Article

Green Dairy Plant: Process Simulation and Economic Analysis of Biogas Use in Milk Drying

Institute of Chemical and Environmental Engineering, Faculty of Chemical and Food Technology, Slovak University of Technology, Radlinského 9, 812 37 Bratislava, Slovakia
*
Author to whom correspondence should be addressed.
Processes 2020, 8(10), 1262; https://doi.org/10.3390/pr8101262
Submission received: 4 September 2020 / Revised: 2 October 2020 / Accepted: 4 October 2020 / Published: 7 October 2020
(This article belongs to the Section Food Process Engineering)

Abstract

:
A project of a new milk drying unit processing 4800 kg/h of fresh milk into milk powder with expected steam consumption of 1000 kg/h (equivalent to ca. 2.6 GJ/h) was assessed. In this paper, investment profitability of this project was analyzed combining mathematical modeling, market analysis, and parametric sensitivity study. Aspen Plus was used as the simulation environment to determine values of key process variables—major streams, mass flows, and energy consumption. Co-digestion of cattle manure in an adjacent biogas plant was considered to provide biogas to partially or completely substitute natural gas as an energy source. As biogas composition from potential co-digestion was unknown, variable methane content from 45 to 60 mol.% was considered. In the next step, thorough economic analysis was conducted. Diverse effects of biogas addition depending on market prices, biogas treatment costs, and biogas methane content were simulated and evaluated. In a market situation closest to reality, biogas mixing to boiler fuel decreased simple payback period from 11.2 years to 5.1 years. However, if biogas treatment costs were high (final biogas price equal to or above 0.175 EUR/m3), the simple payback period was increased two- to sixfold, making the analyzed project practically unfeasible.

1. Introduction

Increasing depletion of fossil fuels and emission of greenhouse gases have motivated significant advances in renewable energy use in the last decade. One of the main representatives of renewable energy carriers is biogas, the combustible product of anaerobic digestion of biomass containing carbohydrates, proteins, fats, cellulose, and hemicelluloses, primarily energy crops, agricultural and food waste, and manure [1]. Biogas is used mainly as fuel in steam boilers and in combined heat and power generation, as a biomethane for injection into the natural gas grid and as transportation fuel [2,3]. Raw biogas has to undergo various treatment and upgrading steps based on its end use [4]. The first common biogas treatment step is desulphurization to avoid excessive corrosion and other operability problems associated with the presence of H2S and its oxidation products. It can be carried out physicochemically or biologically, inside the digester or in a separate unit [5]. Desulphurized biogas can be used directly for combustion. To be used as biomethane and as transportation fuel, its methane content has to be further increased by additional upgrading techniques such as pressure swing adsorption, cryogenic separation, membrane separation, methanation, and so forth [4,5,6]. For example, in order to inject biogas into the natural gas grid in European countries, methane volumetric content from at least 85% to more than 97% is required [3].
A potentially rich source of biogas is the dairy industry [7]. Dairy farms and plants are huge suppliers of organic waste suitable for anaerobic digestion. Biogas produced from a mixture of cattle manure and agricultural waste usually contains methane in the concentration from 50 up to 70 volumetric percent [8,9] and, in addition, cattle manure has a well-documented positive stabilization effect on the biogas production [10,11,12]. There is also a modern trend of additional dairy waste digestion (e.g., whey or dairy sludge [13]) to produce extra biogas and to further lower the negative environmental impact of dairy plants. The final quality of raw biogas strongly depends on the operating conditions of anaerobic digestion and the composition of the substrate. Another studied way of dairy plant waste processing is co-combustion with natural gas to produce electricity [14]. However, in the case of biomass with cattle origin, anaerobic digestion is usually preferable due to the higher water content and higher concentration of chlorine, potassium, and other elements potentially detrimental for combustion [15].
The dairy industry is not only a potential provider of high-quality biogas, but also one of the largest industry segments in many European countries. In Slovakia, the dairy industry, together with the meat industry, represents the majority of food processing companies that belong to the top five industry segments nationwide from the point of view of revenues and the number of employees [16]. A typical dairy plant generates a variety of milk products such as milk, cream, cheese, butter, milk powder, and so forth, and it includes several heat-consuming operations (e.g., pasteurization, evaporation, drying, and cleaning in place [17]). Milk evaporation and drying are considered to be the most energy-intensive operations of a dairy plant [18]. Usually, natural gas is the main energy source to deliver hot water or steam for heat distribution inside the dairy plant. The heat requirements of the dairy industry are among the highest in the food industry sector. To precisely determine heat demand of individual unit operations, mathematical modeling provides a useful insight. There are several commercial process simulators successfully used in the past for dairy plant modeling. Ribeiro and Andrade [19] used Aspen Plus to model a milk concentration system consisting of milk preheating, pasteurization, and evaporation. Bon et al. [20] simulated and optimized the pasteurization process utilizing ProSimPlus. Zhang et al. [21] developed a model mixture of customized hypothetical and real components to simulate milk behavior in the VMGSim software. Aspen Plus was also used in the work of Madoumier et al. [22] to reproduce case studies of milk evaporator systems from published literature. For a more comprehensive overview of simulation approaches suitable for dairy industry operations, the literature review provided by Madoumier et al. [22] in the introduction section of their paper is recommended. Although primary application of the Aspen Plus simulator lies in the oil and gas industry [23], based on the relevant literature data, it can be used also for process simulation in the dairy industry, especially for the evaporation process (in addition to the aforementioned articles, see Jorge et al. [24] and Chawankul et al. [25], who successfully simulated laboratory and industrial evaporators for different food industry segments in the Aspen Plus simulation environment).
One of the emerging concepts to support innovation and improve production efficiency is industrial clustering [26,27]. In an industrial cluster, two or more companies in geographical proximity, both complementary and competitive, intensely cooperate in the form of shared technology (e.g., connection through mass and energy streams), consumers, suppliers, labor, and so forth [28] to form a complex, highly efficient industrial system. It is nowadays a widely promoted concept worldwide and its benefits for regional development are well understood. Examples of possible industrial clusterization in the chemical industry are textiles and apparel industries in China [29], industrial parks in Sweden [30], and food industry cooperation in Denmark and Sweden [31].

2. Materials and Methods

2.1. Case Study Introduction

In this work, the potential industrial clustering of an existing dairy plant with the average annual fresh milk production of 160 000 t (own dairy plant farm consisted of ca. 2000 cows) and an adjacent wastewater treatment plant (WWTP) with operational biogas station generating 90–130 m3/h of biogas was analyzed. Because of the industrial data confidentiality, raw data (records of operating parameters, selected design variables, etc.) are not provided. The goal of the proposed combination is to lower environmental pollution and extend dairy goods variety of the dairy plant by utilizing biogas produced from cattle manure. Biogas is used as a heat source for the additional dairy product manufacture considered in this case study—powdered milk. The suggested production of powdered milk consists of a multieffect evaporator to concentrate liquid milk and a spray dryer to obtain the final milk powder. Capacity of the new milk drying unit was 4800 kg/h of fresh whole milk. In the first part of this paper, a mathematical model of a milk drying unit was constructed in the Aspen Plus environment and it was verified based on real operating data. The second part of the paper is focused on the developed model applied to predict energy demands of a new milk drying unit to be added to the existing dairy plant. In the last part, a parametric sensitivity study of key process parameters coupled with economic analysis was carried out to conduct a complex feasibility study of the proposed new milk drying unit installation. Various mixtures of natural gas and biogas were studied as potential boiler fuel to meet the increased energy demands of the plant under review. Other process parameters in the parametric sensitivity study were biogas methane content, biogas price after desulphurization, fresh milk price, and milk powder price. The source of biogas was the already operating biogas station in the adjacent WWTP where co-substrate in the form of cattle manure was to be added.

2.2. Mathematical Model of a Milk Drying Unit

Milk was simulated in the Aspen Plus simulation environment as an aqueous solution of six chemicals representing fat (palmitic and oleic acid), carbohydrates (lactose), minerals (calcium and potassium), and proteins (proline). Actually, milk consists of several hundred chemicals; however, the proposed approach of six representative chemicals and water yielded good agreement with real properties of fresh pasteurized whole milk (composition in Table 1), specifically in terms of density, dynamic viscosity, and specific heat capacity as documented in Table 2. A similar concept of representative chemicals was successfully adapted also in previous milk modeling instances [21,22].
Natural gas and biogas were considered as possible boiler fuel. Composition of natural gas in Table 3 was taken from data published by the natural gas distributor [34]. Composition of biogas (Table 4) was the subject of further parametric sensitivity study to examine possible effects of cattle manure addition as a co-substrate in anaerobic digestion. Already desulphurized biogas with inclusion of desulphurization costs in the economic analysis was assumed. The lower calorific value of biogas varied for assumed composition in Table 4 from 4.2 kWh/m3 to 6.3 kWh/m3.
In the next step, a milk drying unit was constructed in the Aspen Plus simulation environment. For the purposes of model verification, it was based on real unit configuration consisting of a five-effect evaporator, five milk preheaters, spray dryer, two thermocompressors, seven steam condensate expanders, and a steam boiler room. The heat source in the evaporator was low-pressure steam (200 kPa) produced in the boiler room from natural gas and/or biogas. Spray drying was heated electrically; thus, the only consumer of steam was the milk preheating and concentration section of the proposed milk drying unit. A simplified milk preheating and concentration scheme is depicted in Figure 1. Fresh pasteurized whole milk entered the milk drying unit cooled to 7 °C. First, it was preheated in a series of four preheaters (HEx1,2,3,4) modeled as shell-and-tube heat exchangers with constant heat transfer coefficient calculated by the Aspen Plus solver. As a heating medium, steam from condensate expansion was used. In this process, milk solution was heated to 84 °C and then concentrated in a co-current five-effect evaporator (E1,2,3,4,5) from 9 wt.% of solids to ca. 48 wt.% of solids. Because there is no model of an evaporator available in the Aspen Plus software, predefined unit operations of heat exchanger and flash separator were connected to create one effect of the simulated multieffect evaporator. The heat exchanger served to simulate heat transfer from steam to the milk solution and the flash separator function was to split gaseous phase, evaporated water, from liquid phase, concentrated milk solution. The first part of the evaporator was operated co-currently and the second part counter-currently—steam generated in one evaporator effect served as the heating medium in the following effects—with exceptions of the last two effects (E4,5). Because steam generated in the third effect (E3) was used in the fifth effect (E5) instead of the fourth one (E4) and steam generated in the fifth effect (E5) was used in the fourth effect (E4), milk solution entering the fourth effect (E4) was superheated and that entering the fifth effect (E5) had to be transferred by a pump (not depicted in Figure 1) and preheated in heat exchanger HEx5. In the first effect, live steam from the boiler room represented the main heat source. However, to improve heat integration, two thermocompressors (TC1,2) modeled as mixers were incorporated. As the motive (high-pressure) steam, slightly superheated live steam from the boiler room was used. As the suction (low-pressure) steam, steam generated in the first and second effect of the evaporator was used. The discharge steam (steam created by mixing motive and suction steam in a thermocompressor) was then used as the heat source for the first and second effect of the evaporator. Such configuration is typical for the modern dairy industry because it leads to decreased live steam consumption due to partial heat recovery. Steam condensate expanders (not explicitly shown in Figure 1) were modeled as flash separators. In the spray dryer, air preheated to 220 °C was used to evaporate excess water. Because superheated live steam temperature was not sufficiently high, electrical heating due to its typical use in the dairy industry was selected. Because the spray dryer did not consume steam, it was simulated simplistically in this work. A component separator to separate water from milk powder and a heat exchanger to calculate electrical heating power required for water evaporation and drying air heating were combined to form a spray drying operation in which final milk powder product containing 3.6 wt.% of water was produced.
The boiler room was composed of a feed water preheater and a degasser (FWP) to increase the temperature of feed water from 15 °C to 105 °C and to ensure correct degassing by direct mixing of product steam with feed water, a fuel burner to produce hot flue gas, and a furnace to transform heat from hot flue gas into slightly superheated steam at 200 kPa and 125 °C. A simplified boiler room scheme is depicted in Figure 2 where B-F stands for burner and furnace together. As fuel, a mixture of natural gas (NG) and biogas (BG) with optional ratio was simulated. For feed water degassing, a part of the produced steam was used that will be referred to as own boiler room consumption. It was also assumed that a small portion of steam (0.5%) was lost during degassing (red outlet stream from FWP). In the Aspen Plus environment, the burner was simulated as an RStoic reactor with defined 100% conversions of combustible components, the furnace as a shell-and-tube heat exchanger, and the FWP as a mixer. It should be noted that zero condensate return to the boiler was assumed which is typical for the food industry because of possible biological contamination of the heating steam, in our case during milk drying and consequent mixing of different condensates in steam condensate expanders.
Figure 1 and Figure 2 represent schematic flowsheets for better understanding of the analyzed process. The actual configurations of these operations in the Aspen Plus environment are depicted in Figure 3 and Figure 4, respectively. The following unit operations nomenclature was used in the depicted flowsheets:
  • SCE–steam condensate expander
  • CM–condensate mixer
  • SM–steam mixer
  • SS–steam splitter
  • WS-COND–waste steam condenser
As it was previously mentioned, one effect of the evaporator was created as a combination of a heat exchanger and a flash separator (e.g., E1 modeled as heat exchanger E1-HEX and flash separator as E1-SEP). In the case of superheated milk solution entering the particular effect, the model was modified to expand the milk solution first in the flash separator to proceed with heat exchanger heating the milk solution and the flash separator to separate evaporated water from the liquid solution. Such configuration can be seen, for example, for effect E4 that was modeled as the flash separator E4-SEP-A, heat exchanger E4-HEX, and flash separator E4-SEP-B.
Real milk drying unit operation, which the presented mathematical model was based on, processed 7200 kg/h of fresh raw whole milk and produced ca. 670 kg/h of milk powder. Only natural gas was used as the fuel in the boiler room. As an input into the developed model, temperature of the milk solution in the preheating system and at the inlet and outlet of the evaporator effects was measured and entered. To verify the simulation results, solids content in the milk solution in every effect was laboratory measured, steam consumption of individual evaporator effects was determined by condensate flow measurement, and live steam consumption was evaluated based on the boiler room steam production analysis.
Only very small discrepancies between the data measured in real operation and the results obtained from the computer simulation were revealed during model verification (Figure 5). Figure 5a shows a very good agreement of the simulation with real data in terms of milk solution concentration. The biggest difference was simulated in the case of E5 for which the Aspen Plus model predicted output solids content of 48.9 wt.% while the measured value was 47.6 wt.%. Bigger but still acceptable differences were simulated for steam consumption of individual evaporator effects depicted in Figure 5b. The biggest relative difference of 10.4% was simulated for the steam consumption in E4. Overall live steam consumption predicted by the Aspen Plus simulation was 1389 kg/h, which is less than 2% lower than live steam consumption determined by the boiler room steam production analysis (1406 kg/h). The developed model is thus appropriate and well suited for further analyses.

3. Results

In the second part of the process simulation, the verified Aspen Plus model was used to predict steam consumption of the new milk drying unit with the fresh whole milk capacity of 4800 kg/h (temperature of 7 °C and solids content of 9 wt.%) which corresponded to approximately 25% of total milk processing rate in the analyzed dairy plant. Selected process variables are summarized in Table 5. Based on the required steam flow, consequent consumption of fuel composed of different mixtures of natural gas with biogas can be estimated. Overall live steam consumption (to be provided by a new boiler) predicted by the Aspen Plus simulation was 926 kg/h. To cover potential heat losses not incorporated into the developed model, necessary steam production of 1000 kg/h was assumed.

3.1. Fuel Composition Analysis

Different combinations of natural gas and biogas (different ratios of NG and BG stream flows in Figure 2) were studied as the boiler fuel to provide 1000 kg/h of steam. Furthermore, the effect of cattle manure addition as a co-substrate in the biogas plant on methane content in used biogas was analyzed. As it was discussed earlier, cattle manure has a positive effect on the biogas production. In our work, partial addition of cattle manure from the studied dairy plant to anaerobic digestion at the adjacent biogas station was considered. Because of the complexity of the biogas production process, the effect of variable methane content in the produced biogas was analyzed. The upper limit of methane content was 60 mol.% and the lower limit was 45 mol.%. The higher content of methane and the lower content of carbon dioxide were considered. Other biogas components were constant (Table 4). Total boiler fuel consumption as a function of biogas to fuel ratio for two extreme cases is depicted in Figure 6. Biogas-to-fuel ratio was calculated as biogas volumetric flow divided by the sum of biogas and natural gas volumetric flows in the boiler necessary to produce target 1000 kg/h of steam for the new milk drying unit. If no biogas was added, ca. 86 m3/h of fuel (in this case, pure natural gas) was required. If only biogas was used as fuel (biogas-to-fuel ratio equal to one), fuel consumption depended on the methane content. Logically, at higher methane content in biogas, lower fuel consumption was simulated due to higher energy content in one cubic meter of the fuel. For biogas containing only 45 mol.% of methane, 195.7 m3/h of fuel was required. If biogas contained 60 mol.% of methane, fuel flow of 146 m3/h to the boiler was simulated. Fuel consumption dependency on the biogas-to-fuel ratio and methane content was studied further. Figure 7 demonstrates complex dependency of total fuel consumption on the methane content in biogas and on biogas proportion in fuel mixture where simulated values of fuel consumption in the boiler room for different methane contents in the range of 45–60 mol.% and biogas-to-fuel ratio in the range of 0–1 are depicted in form of a 3D figure. As Figure 6 suggests, addition of biofuel leads always to an increase in total fuel consumption (as can be seen also in Figure 7). However, with the increasing content of methane in biogas due to cattle manure co-digestion, increase in the total fuel consumption can be effectively decelerated. Moreover, natural gas consumption can be reduced significantly by biofuel addition (Figure 8). As indicated in Figure 8, if the biogas-to-fuel ratio in the simulation was ca. 0.7, natural gas consumption was halved. Detailed profitability analysis was conducted to decide on an optimal alternative.

3.2. Economic Analysis

Multiple approaches to evaluate a project’s profitability are known. In our paper, simple payback period (SPP) (Equation (1)) was chosen as a decision criterion where IT is installation time, RI required investment, CI annual cash inflow, and CO annual cash outflow.
S P P = I T + R I C I C O
Installation time (IT) represents the time period required for construction and start-up of a new milk drying unit. Usually, such a process may take up to two years. In our study, IT was equal to one year. Required investment (
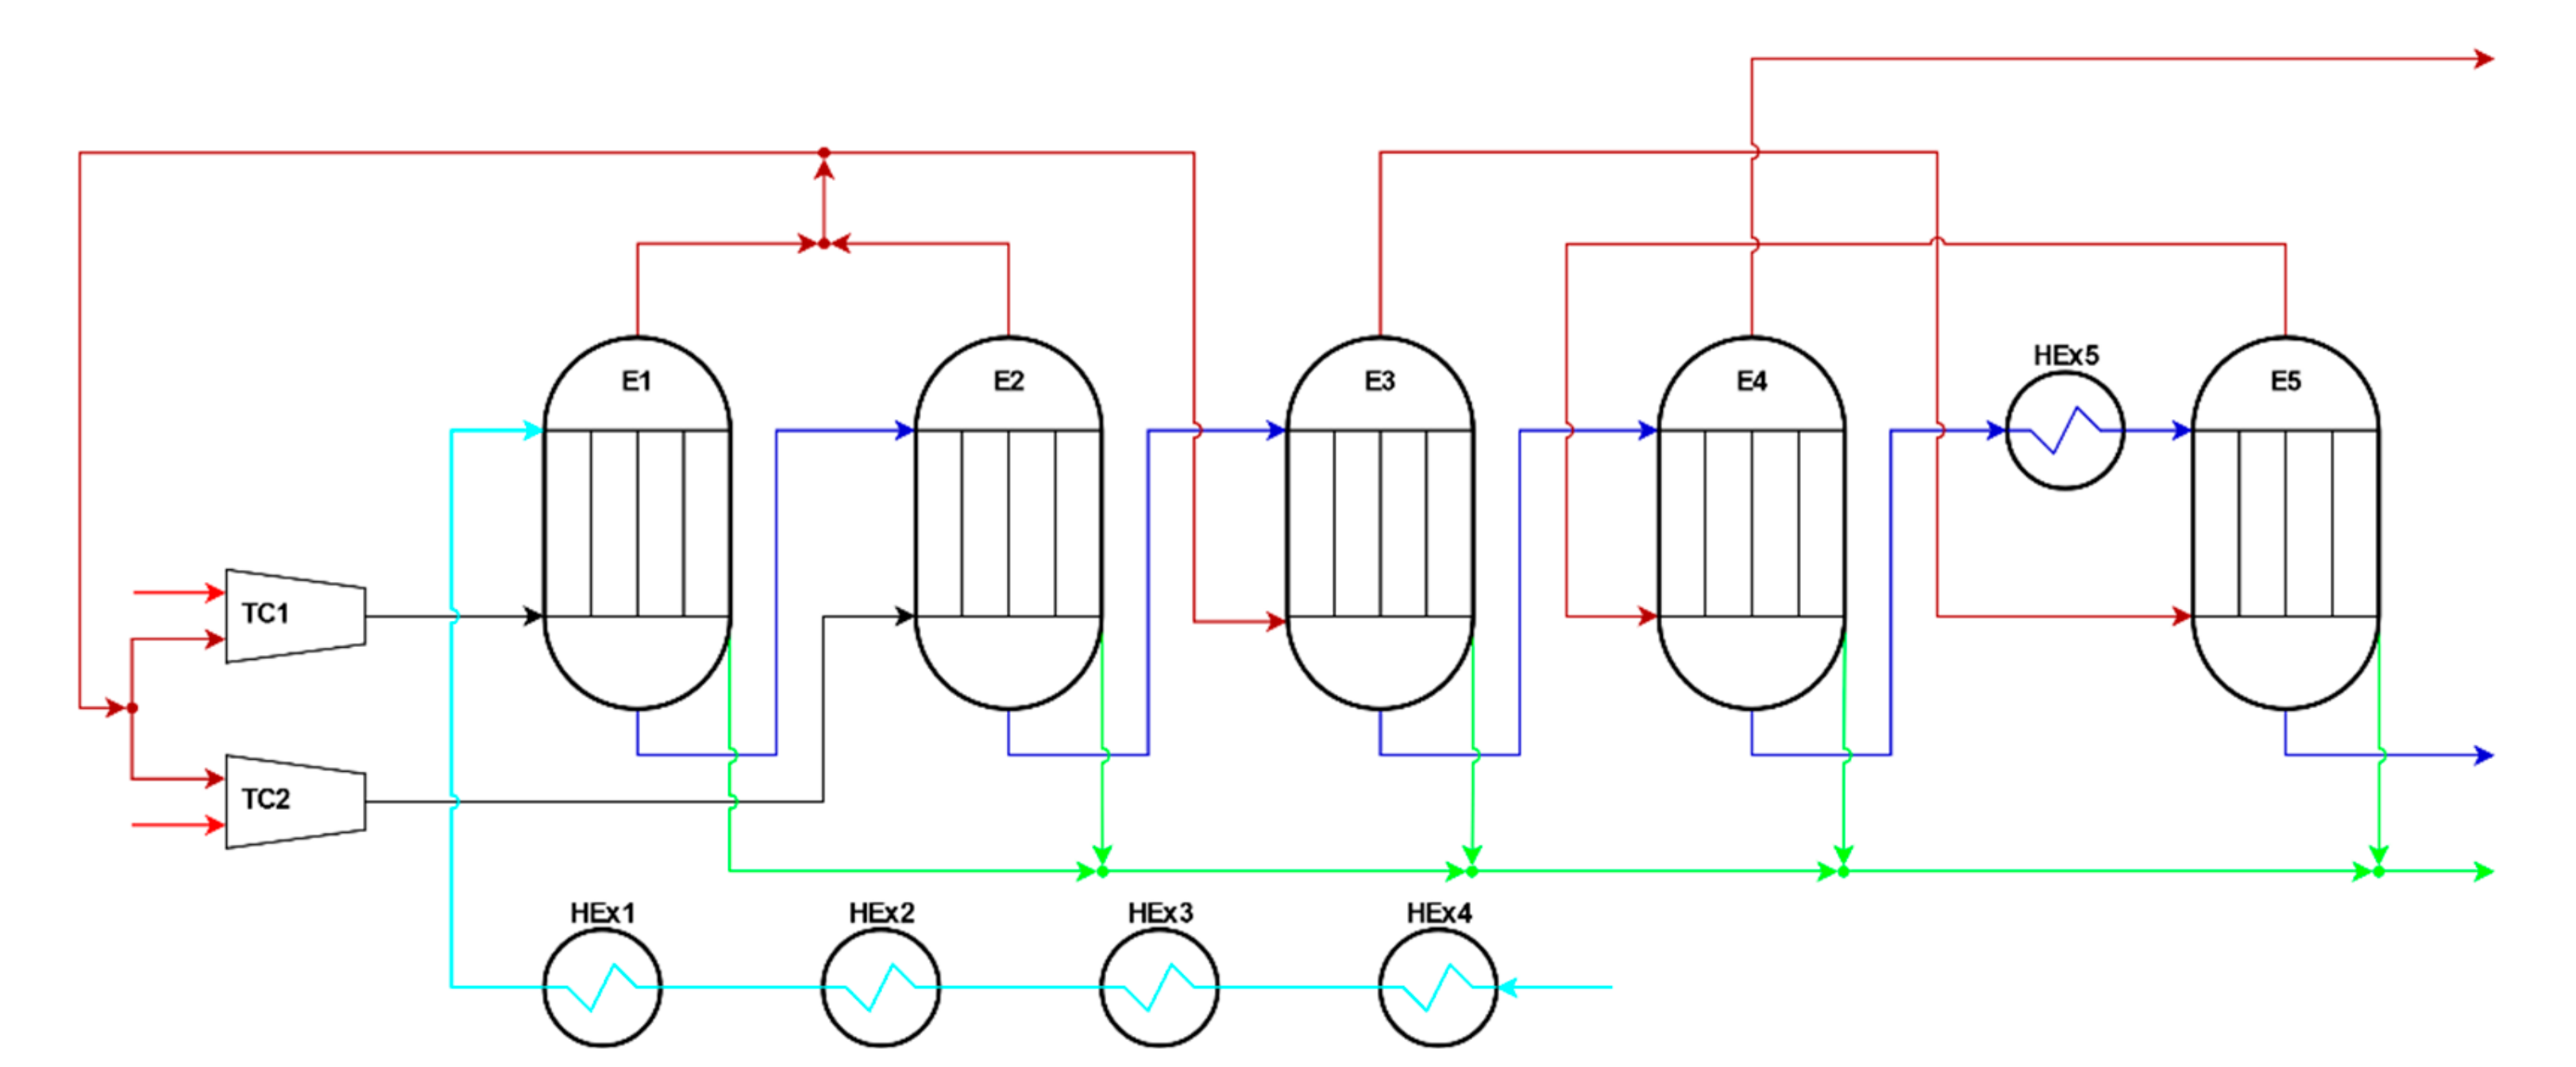
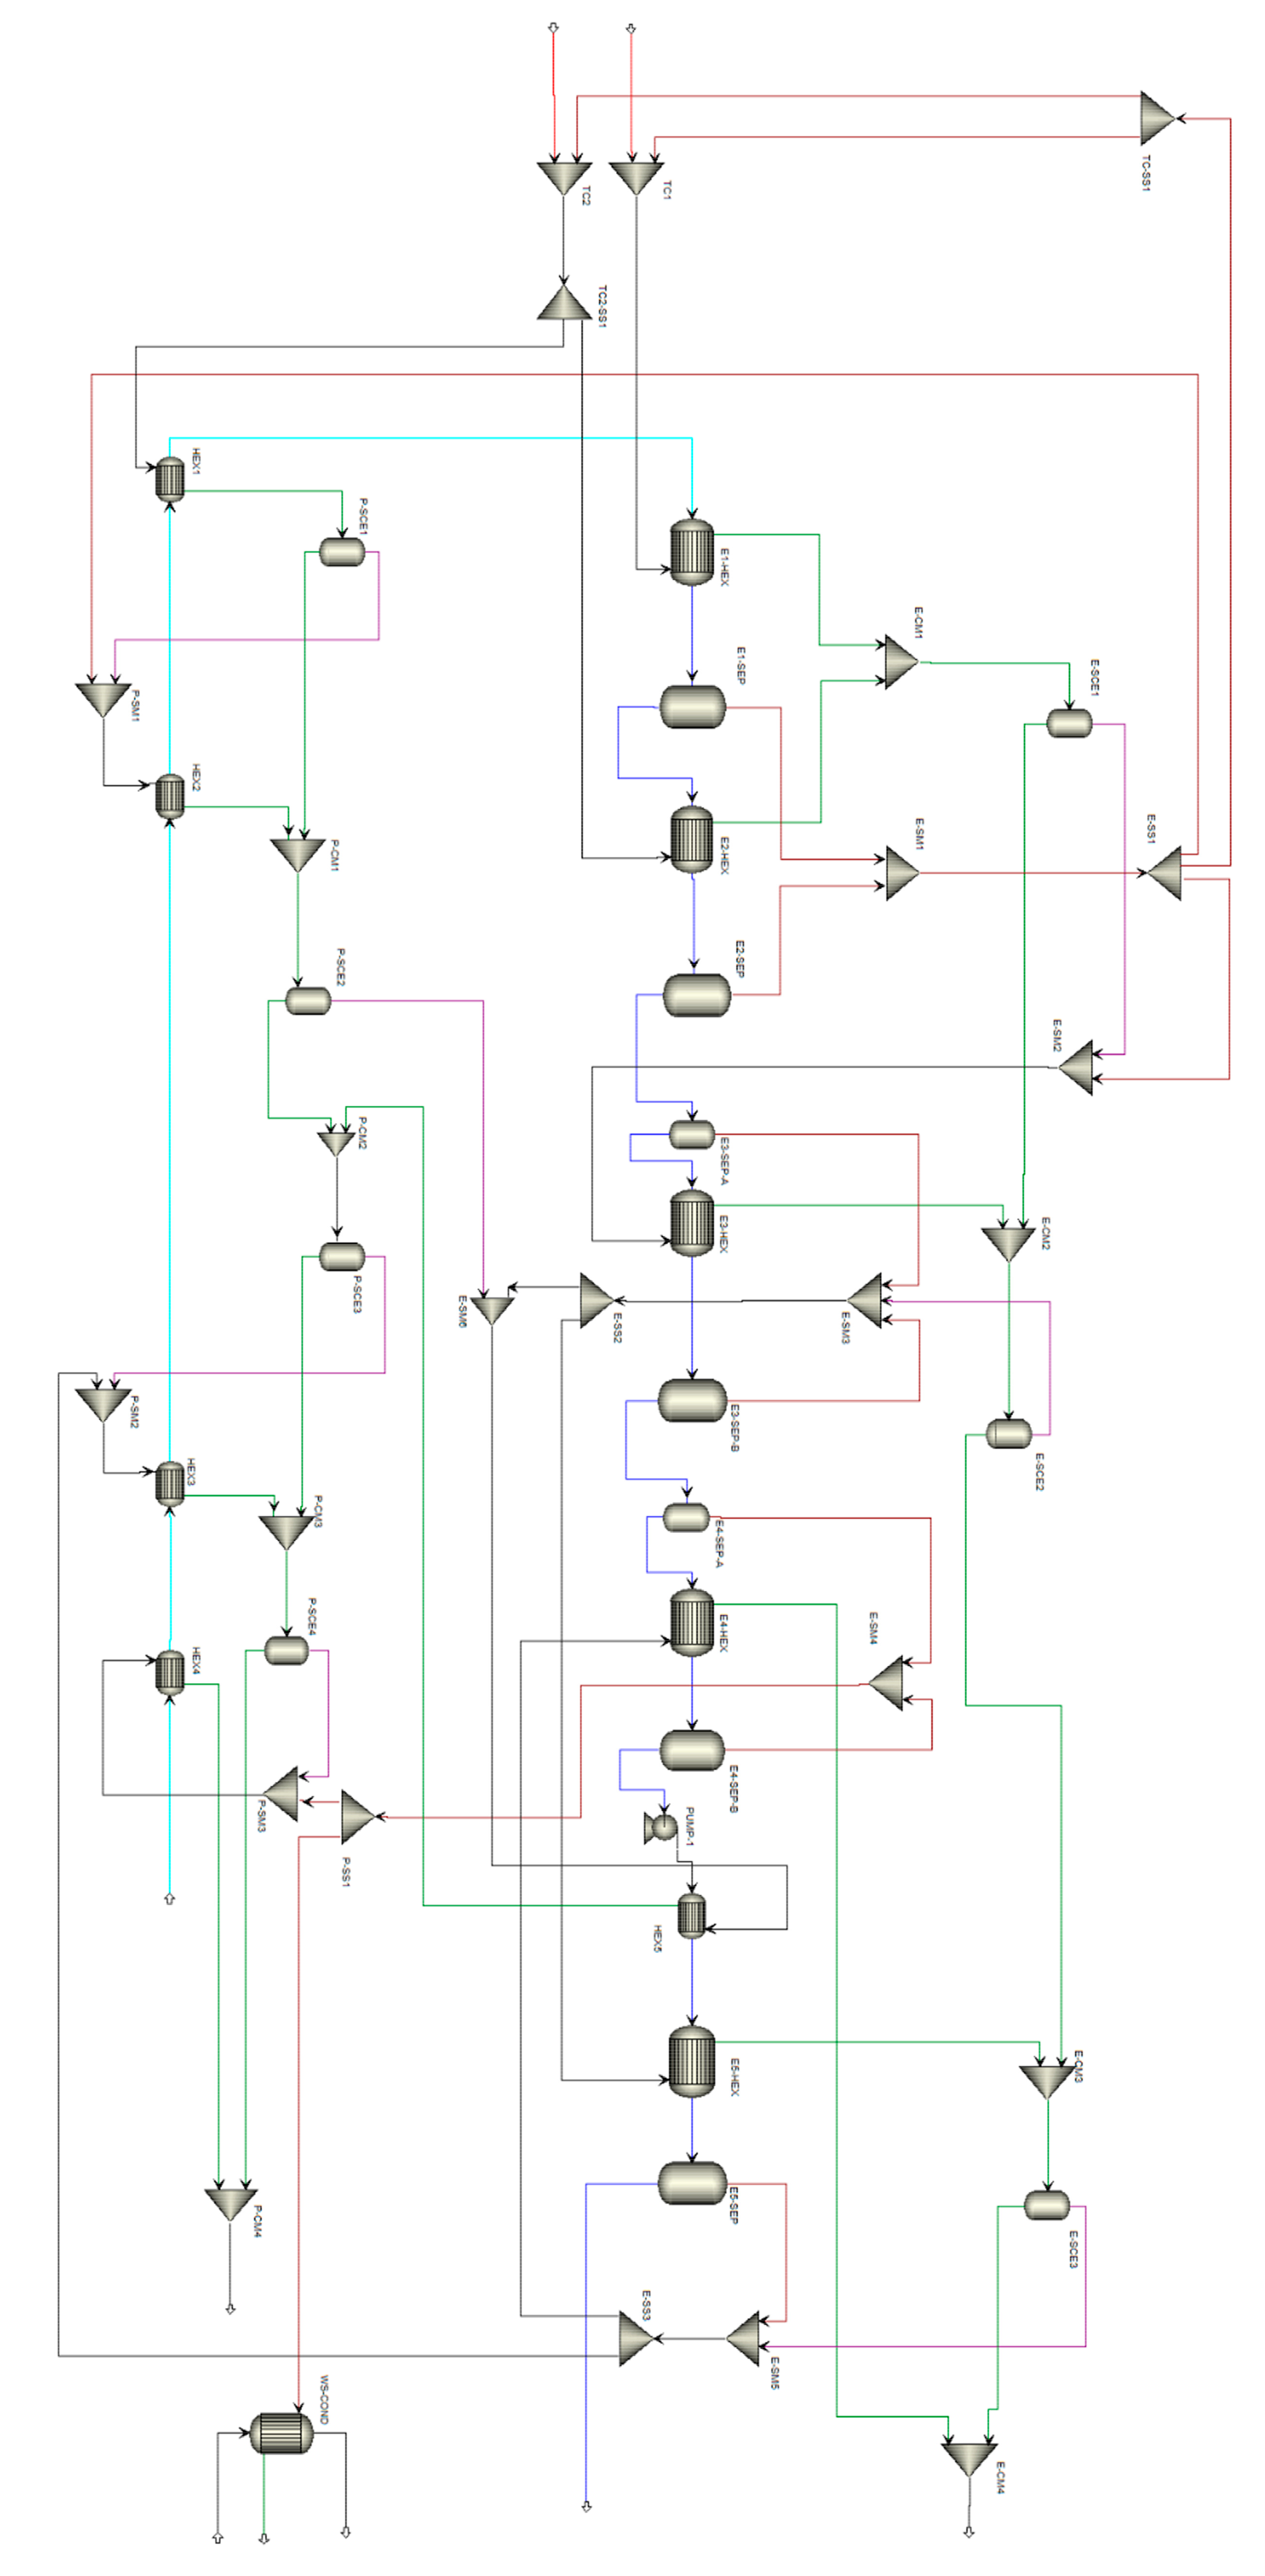
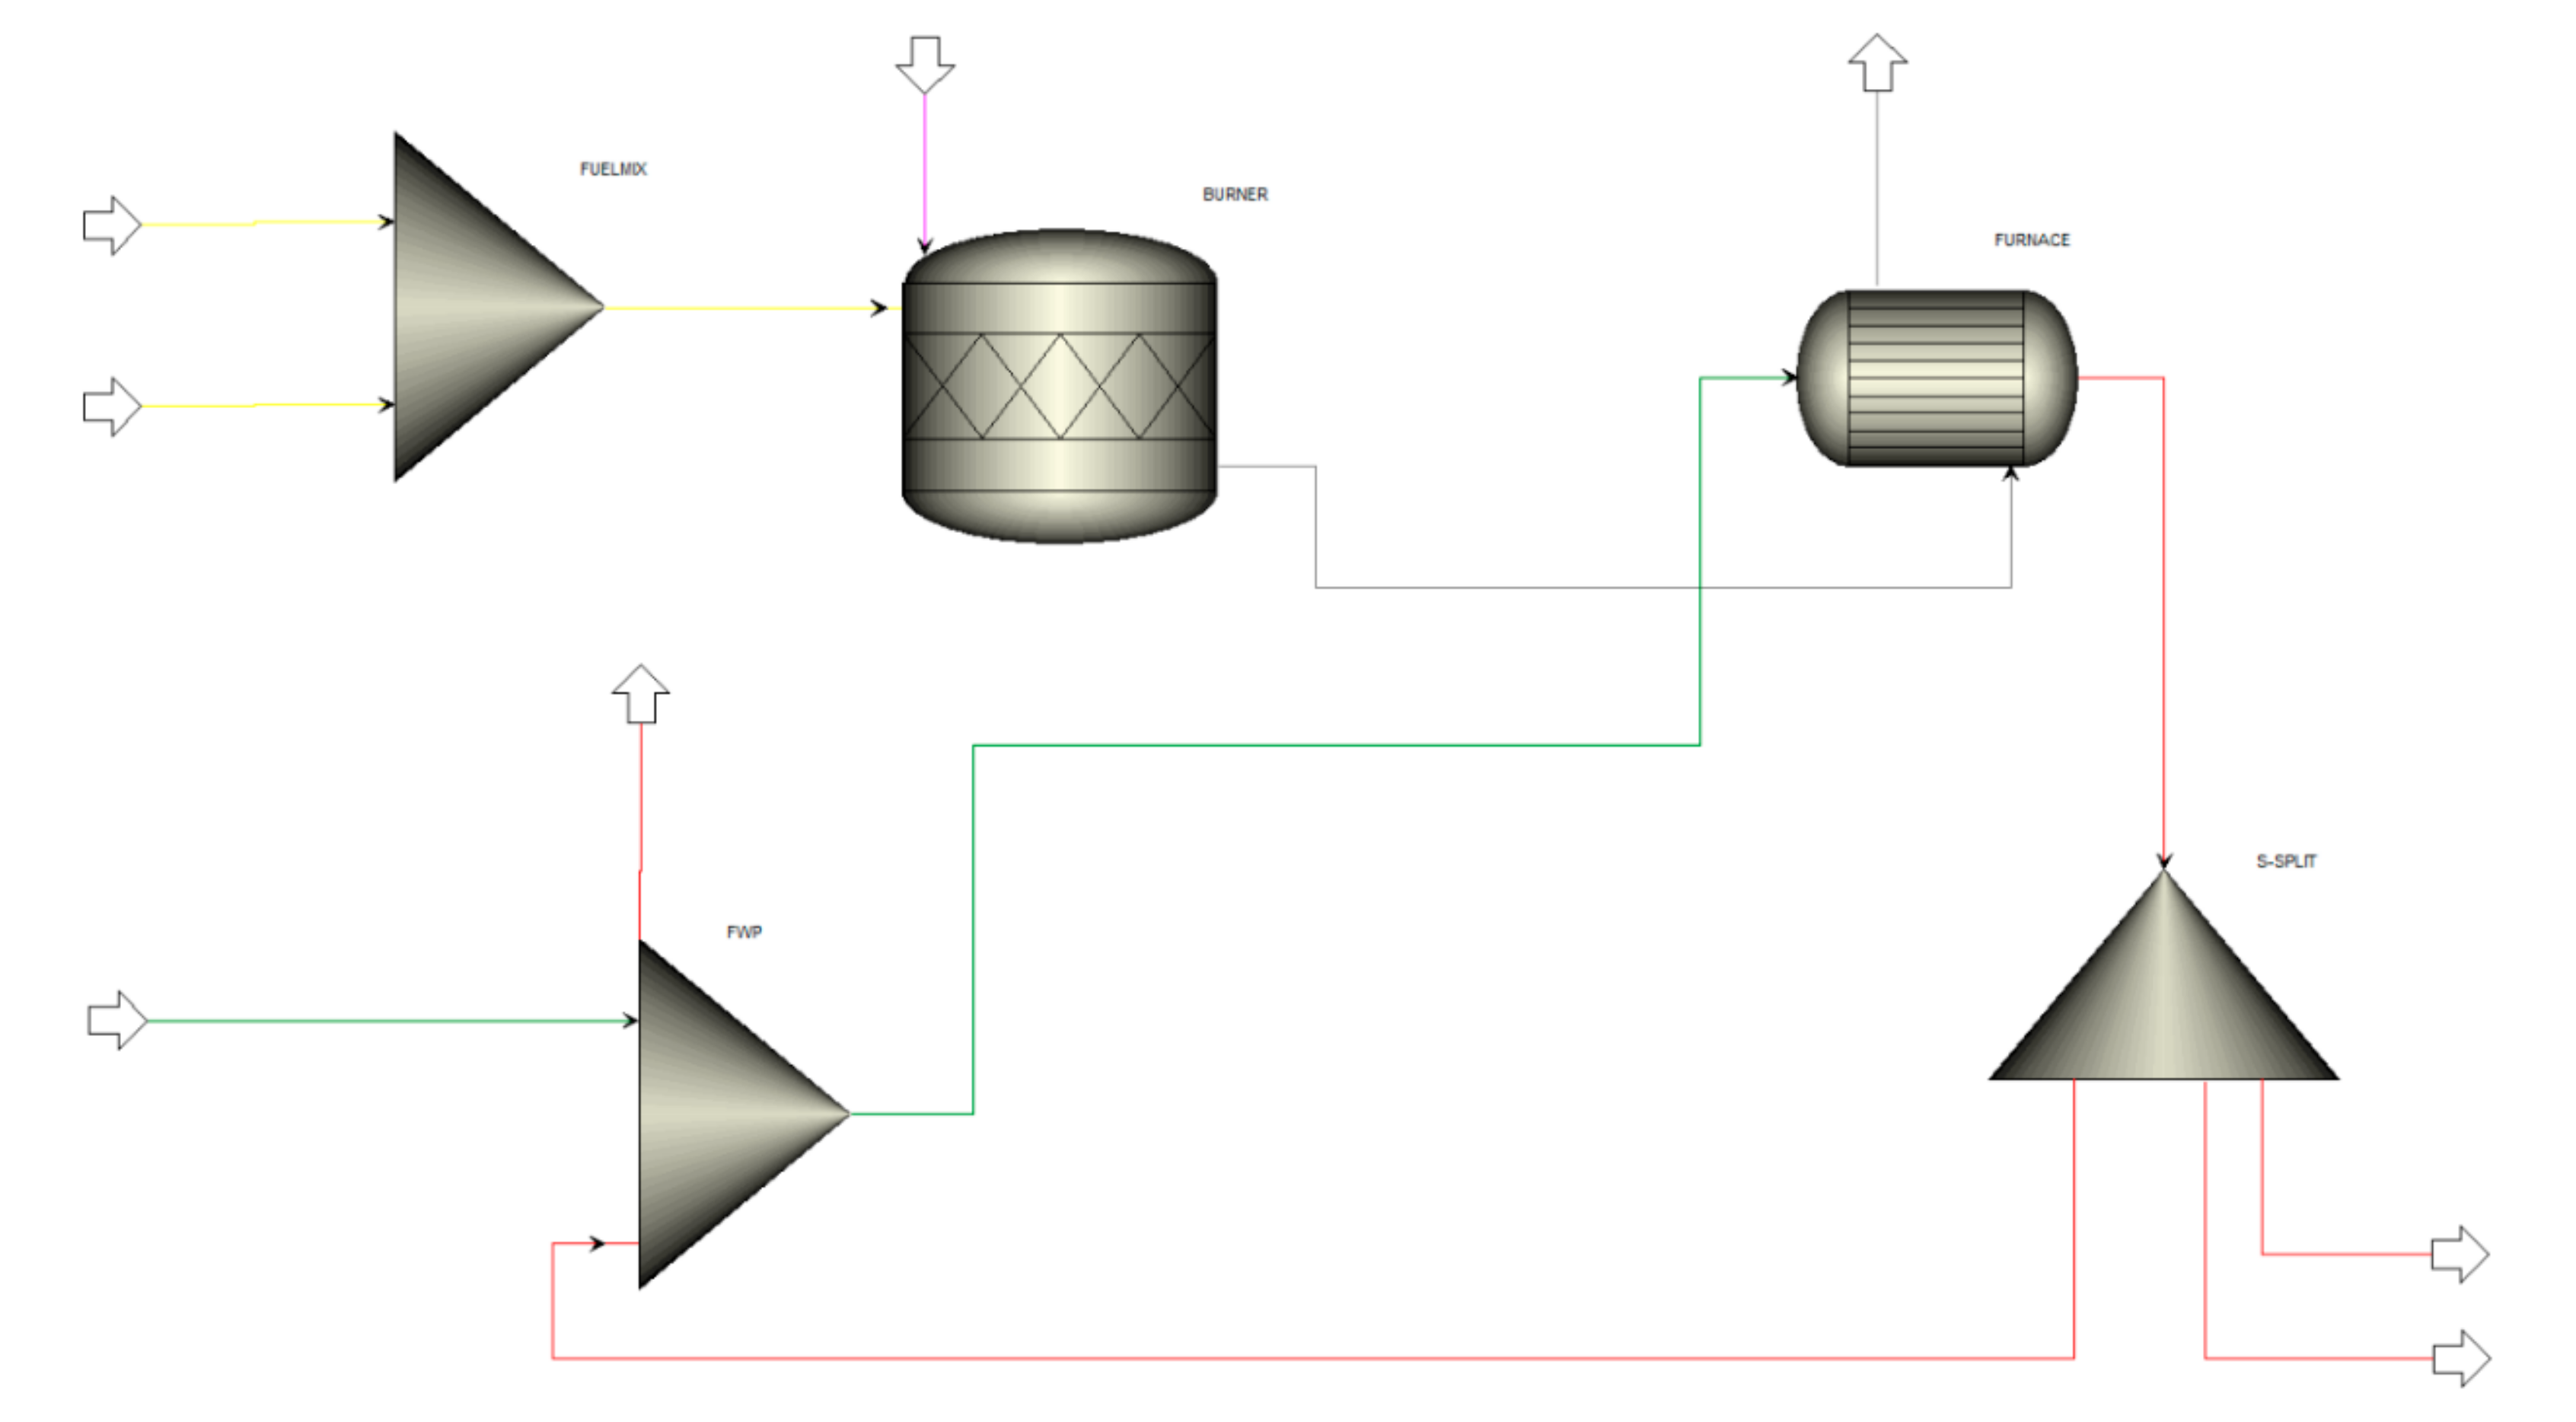
RI) was calculated taking into account all new equipment required for the milk drying (as simulated in Figure 3 and Figure 4)—multieffect evaporator, spray dryer, boiler, heat exchangers, pumps, fans, and thermocompressors. For the purposes of the presented economic analysis, the sum of costs for purchase, taxation, delivery, and installation of these units was considered constant and equal to 1.12 mil. EUR based on literature guidance [35]. More detailed RI breakdown is presented in Table 6. Annual cash inflow (CI) and cash outflow (CO) are variables in this analysis. CI represented profit from sales of milk powder, that is, the difference between selling prices of powdered milk and fresh pasteurized milk. Due to the local and global regulations in the milk market, prices of fresh milk and powdered milk are very volatile and country-specific (Figure 9) [36]. The effect of the fresh milk selling price was in the range from 260 to 400 EUR/t and powdered milk selling price in the range from 2200 to 3700 EUR/t. CO comprised operating costs related to energy consumption. The main energy media considered in our study were water, natural gas, biogas, and electricity. Prices of water, natural gas, and electricity can be considered constant, thus, water price of 0.35 EUR/m3 for boiler feed water and 0.05 EUR/m3 for cooling water in the waste steam condenser, natural gas price of 0.35 EUR/m3, and electricity price of 115 EUR/MWh were considered. Costs related to biogas production, desulphurization, and transfer were subject to our study. These costs strongly depend on the quality of substrate and process conditions. Because of the unknown effect of cattle manure co-digestion, the range of biogas prices was based on technical publications’ reviews [37,38]. Palm [37] analyzed costs for biogas production, upgrade, distribution, and sale in Sweden. After conversion from SEK to EUR and recalculation from kWh to m3, raw biogas price varied from 0.163 EUR/m3 to 0.380 EUR/m3. Beddoes et al. [38] listed biogas production costs with different sources of biomass in the USA. After conversion from USD to EUR and recalculation from ft3 to m3, raw biogas price varied from 0.046 EUR/m3 to 0.105 EUR/m3 for dairy-origin biomass. In the presented economic analysis, biogas price varied from 0.073 EUR/m3 to 0.243 EUR/m3 with a step of 0.034 EUR/m3. CO was increased by 3% to cover maintenance costs and potential increase in wage costs. Annual operating time of the dairy plant of 8400 h was considered.
Economic analysis was split into three scenarios to represent very positive, very negative, and neutral market situations. Scenario A represents conservative circumstances with moderate powdered milk selling price of 3320 EUR/t and moderate fresh milk selling price of 280 EUR/t. Such a scenario should be closest to reality. Scenario B is the best-case scenario in which the highest value of powdered milk selling price and the lowest value of fresh milk selling price were considered. This combination favors further processing of raw milk into milk powder, thus leading to generally shorter payback periods. Scenario C is the worst-case scenario, where fresh milk selling price was the highest and powdered milk selling price was the lowest. Considering such market status can lead to very long payback periods or even to higher CO than CI (i.e., negative cashflow). In such a scenario, the project of a new milk drying unit is unfeasible. All milk prices considered in the scenarios are summarized in Table 7. Similar complex figures as 
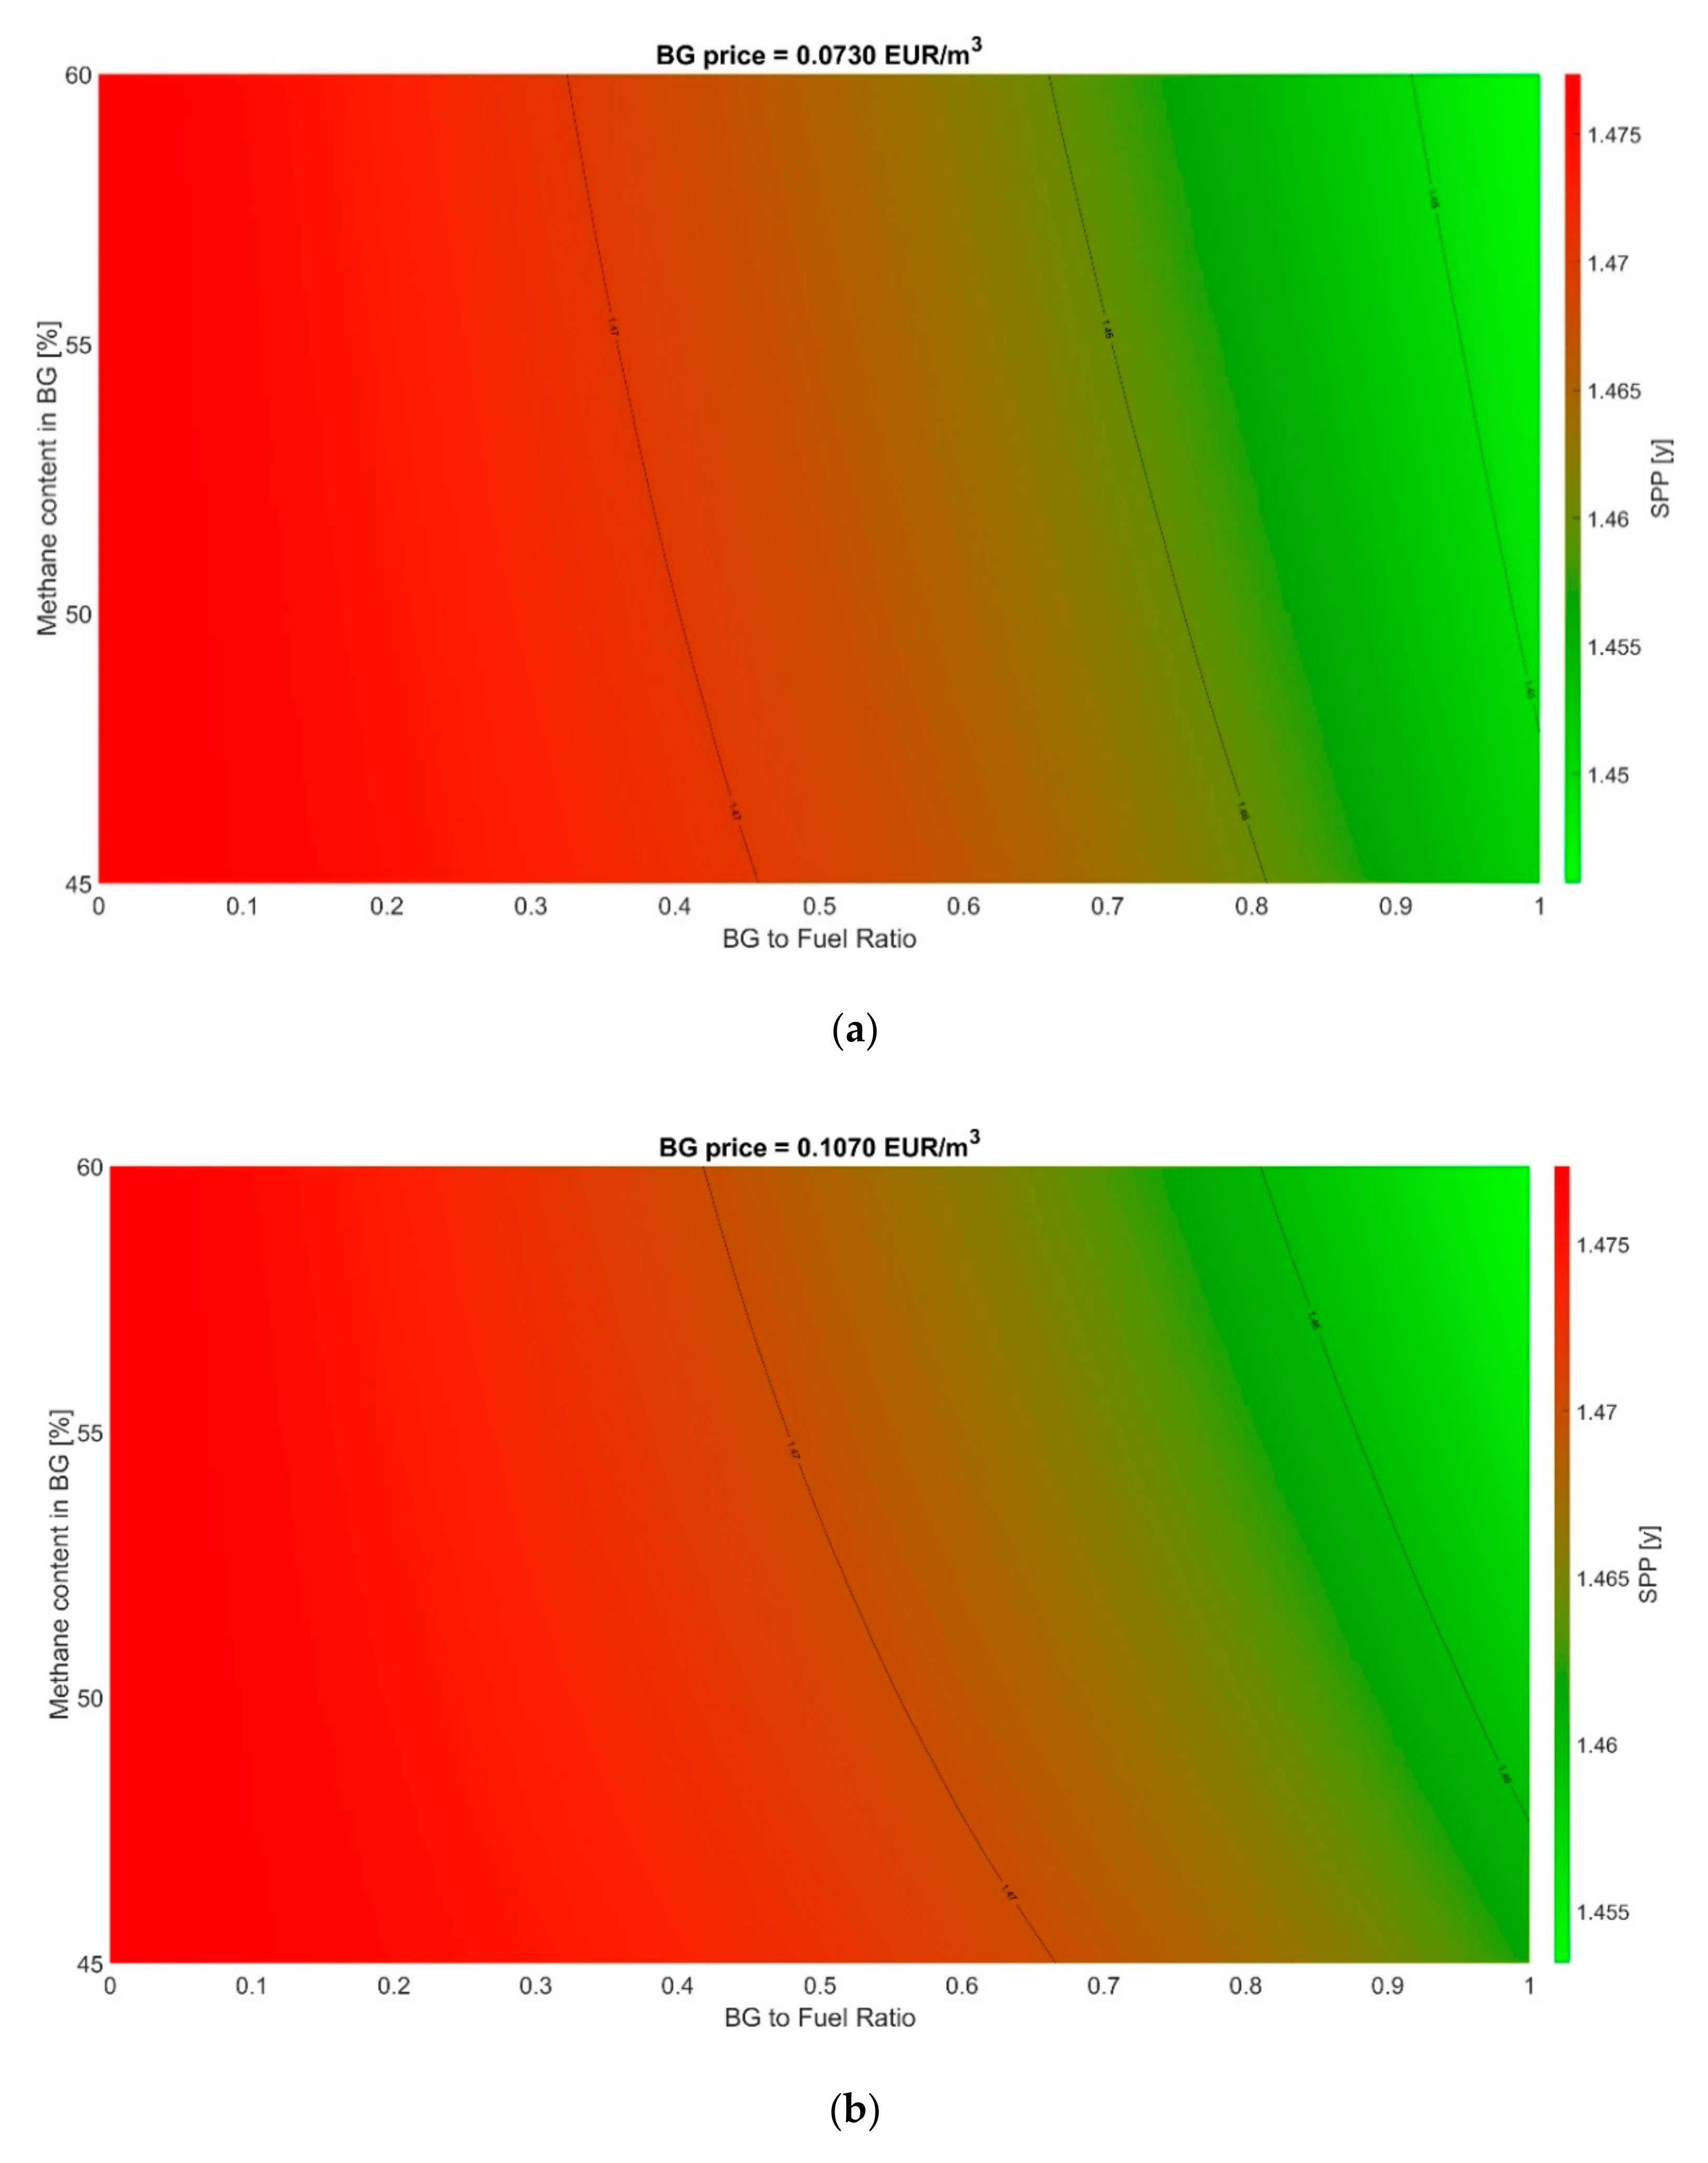
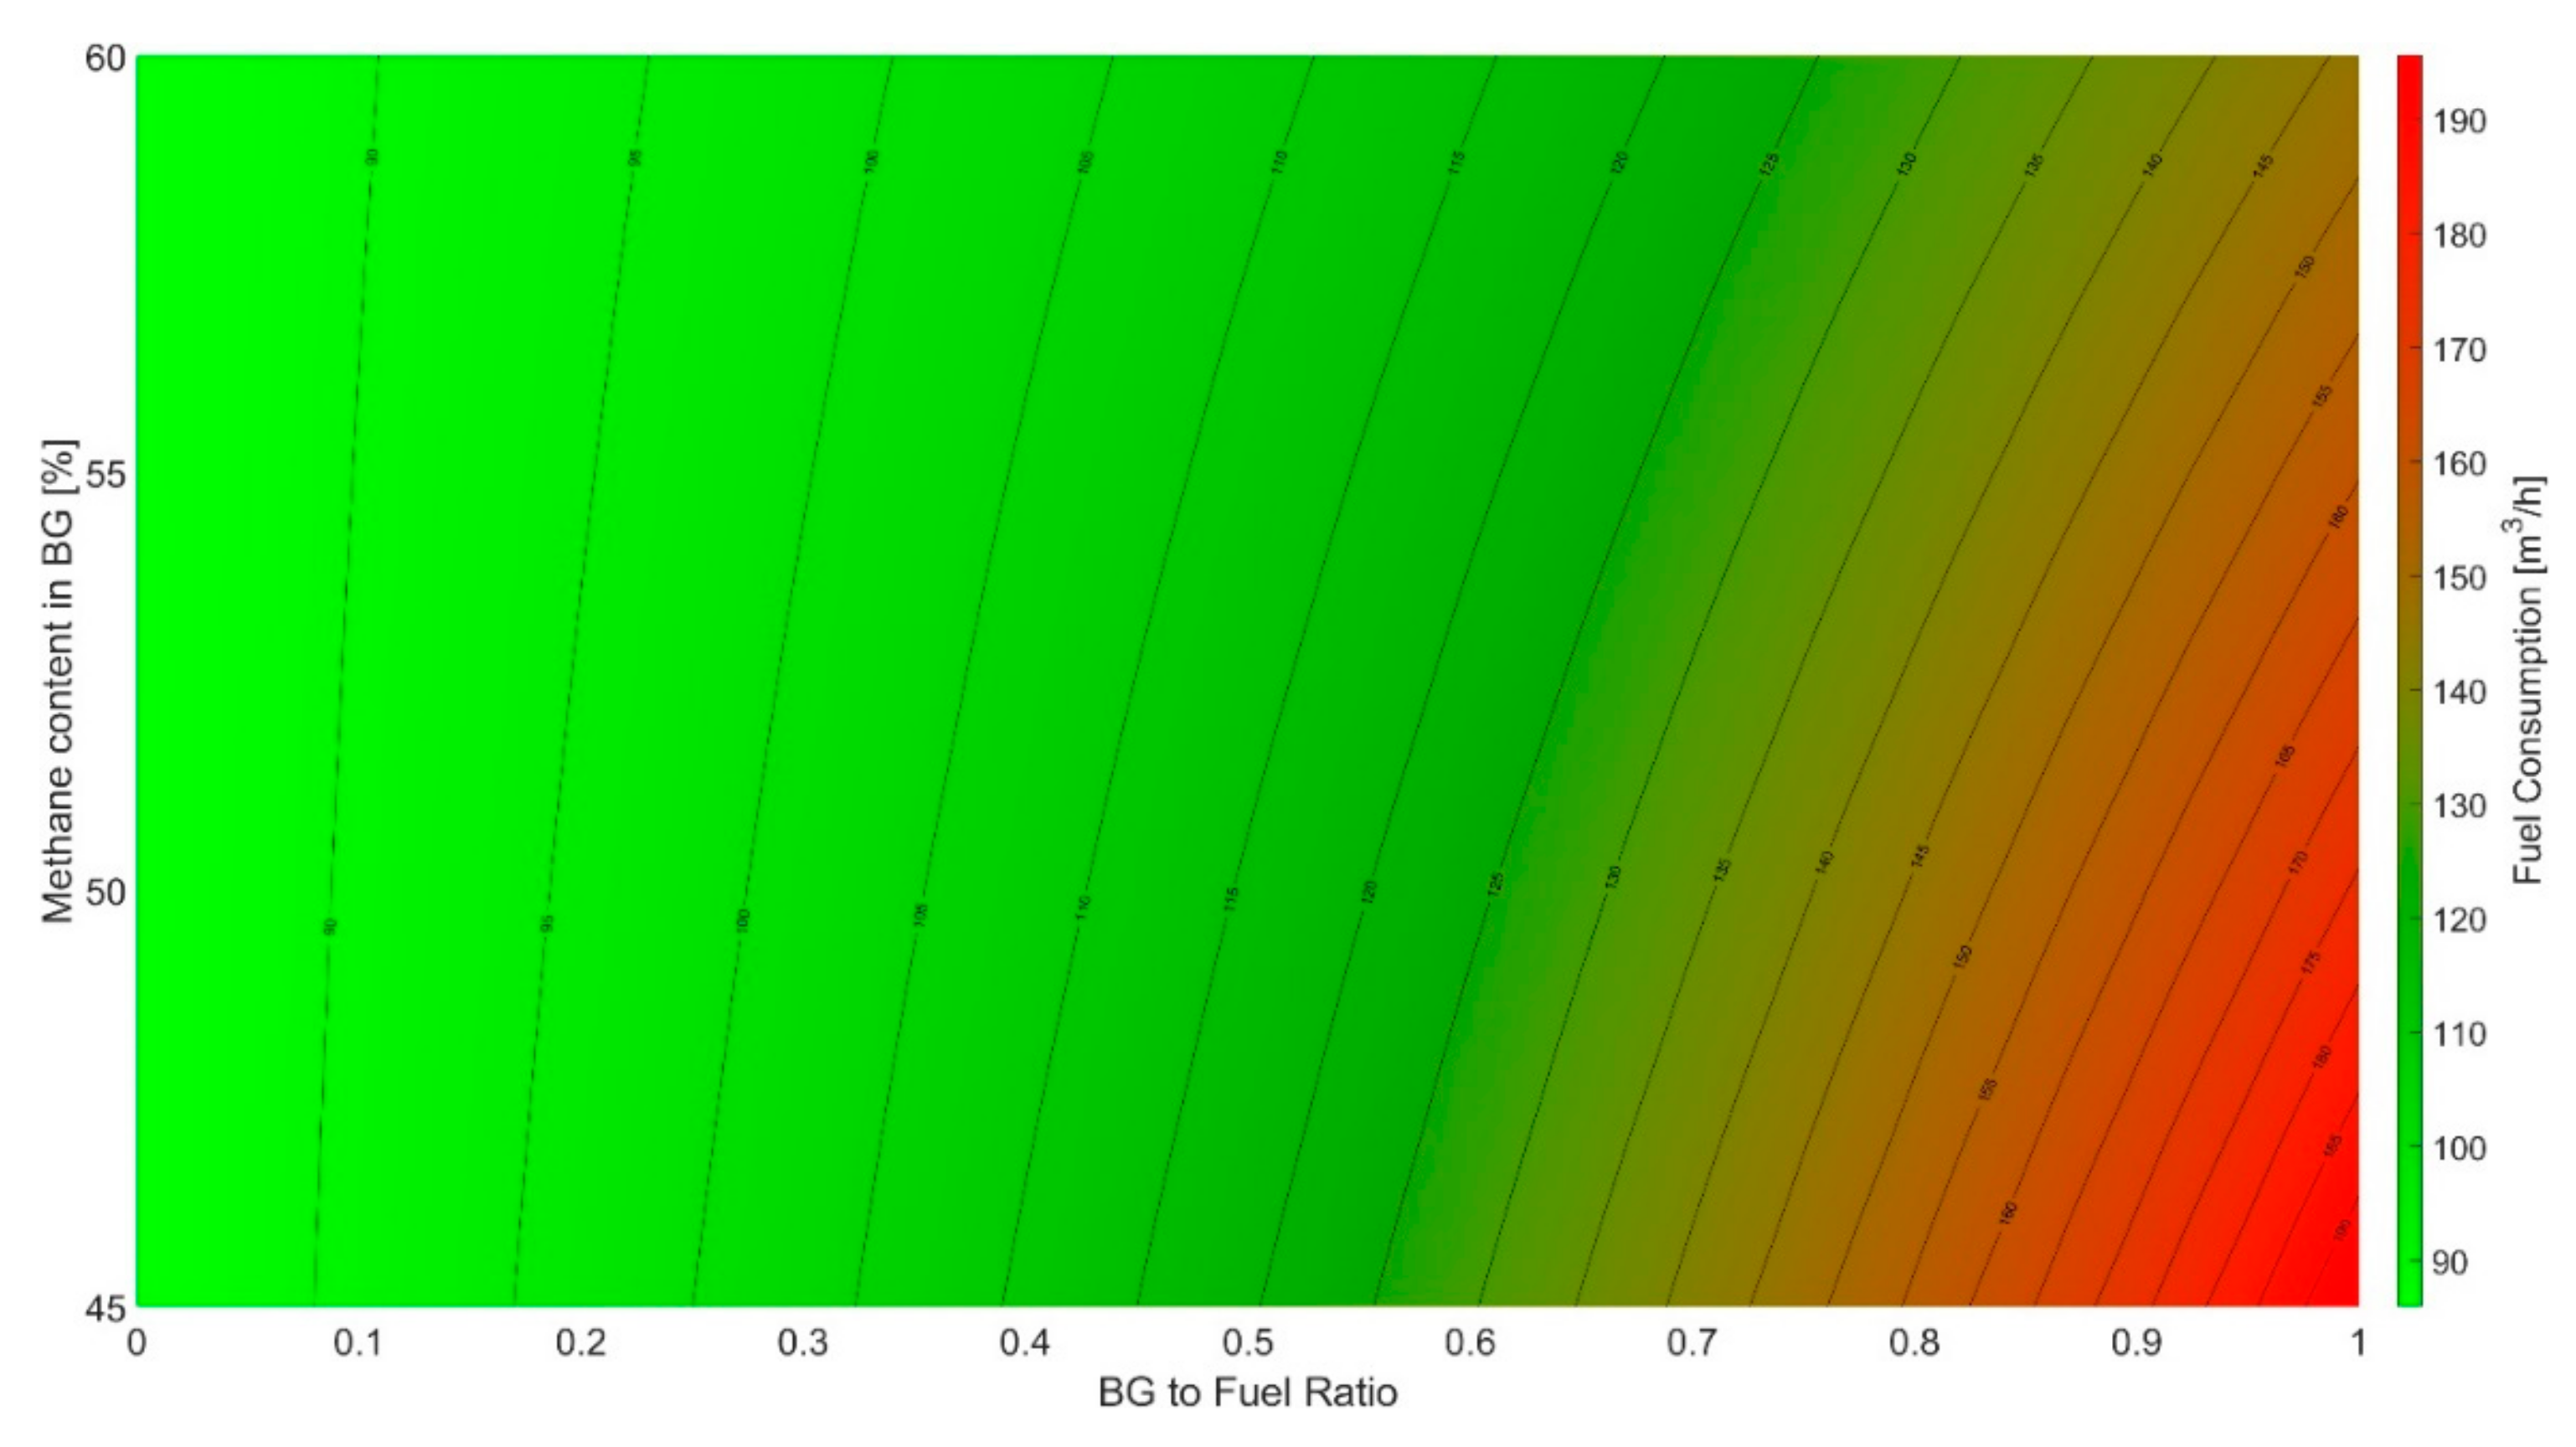
Figure 7 were constructed to grasp the dependency of the project’s profitability on biogas price. Biogas-to-fuel ratio and methane content in biogas remained as analyzed process variables. Instead of fuel consumption, SPP as defined by Equation (1) was evaluated as a function of these two parameters and biogas price.

3.2.1. Scenario A

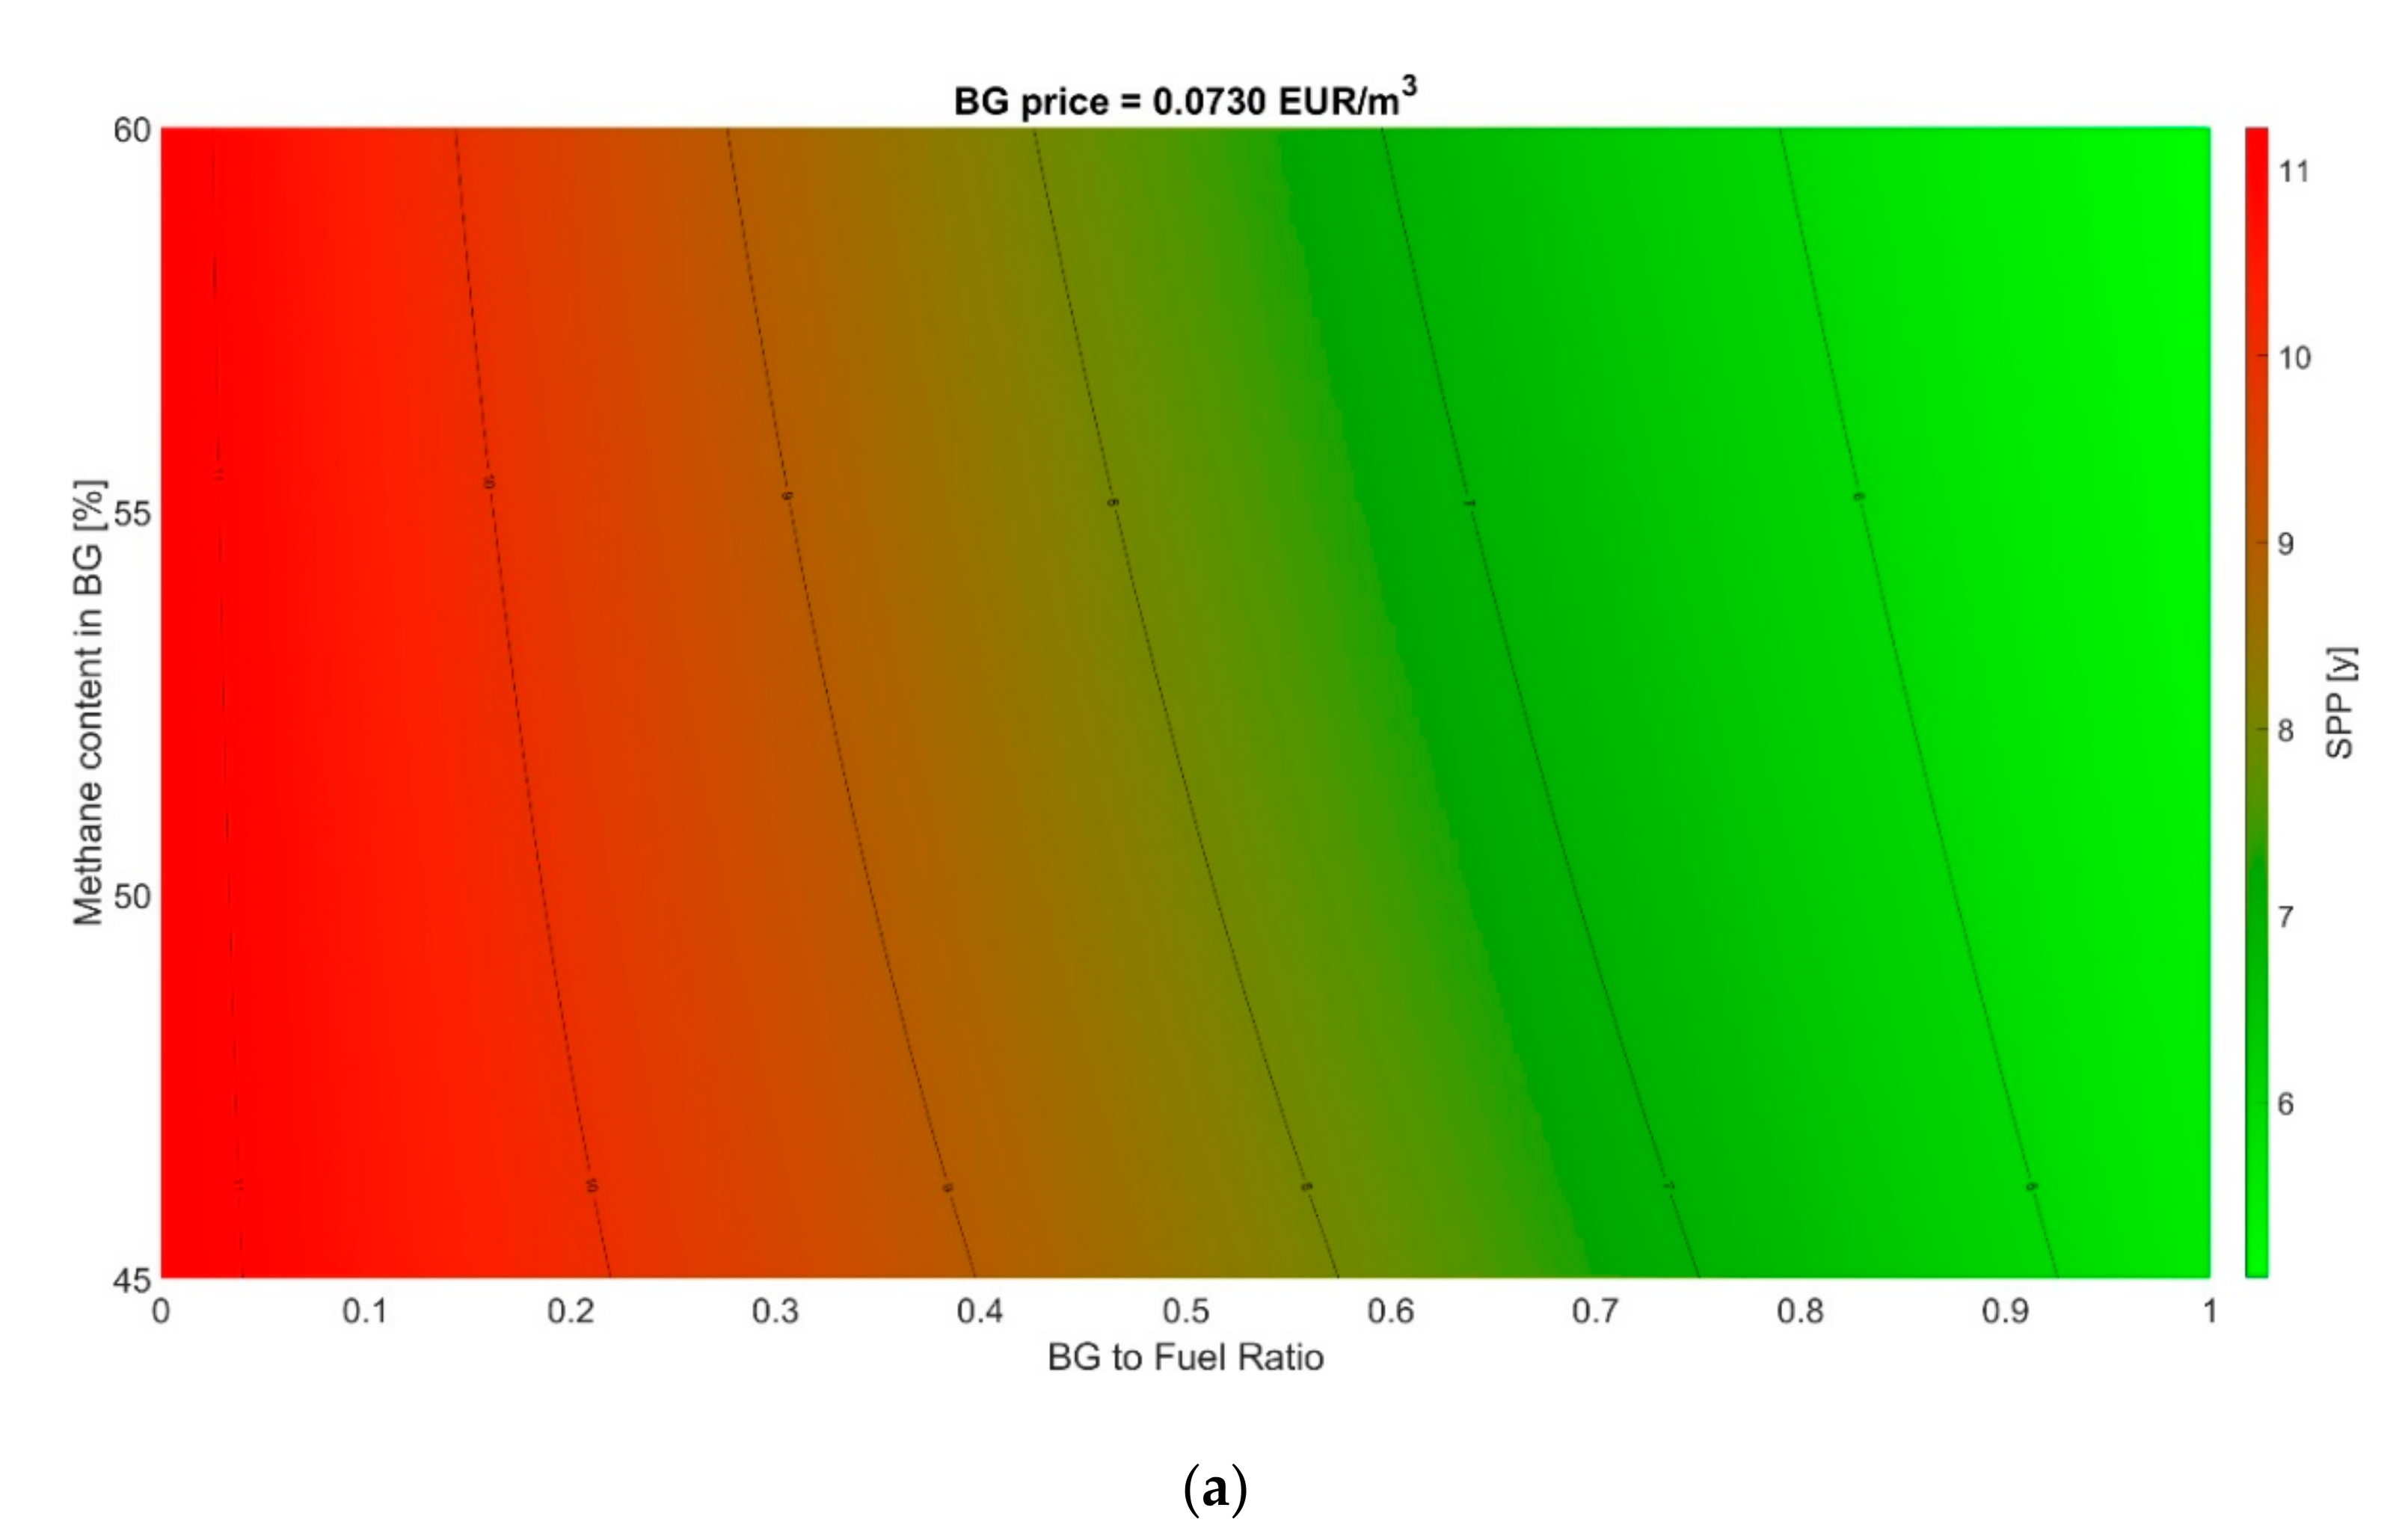
In this scenario, SPP varied from 5.1 to over 60 years. If no biogas is used as boiler fuel, SPP value is 11.2 years. 
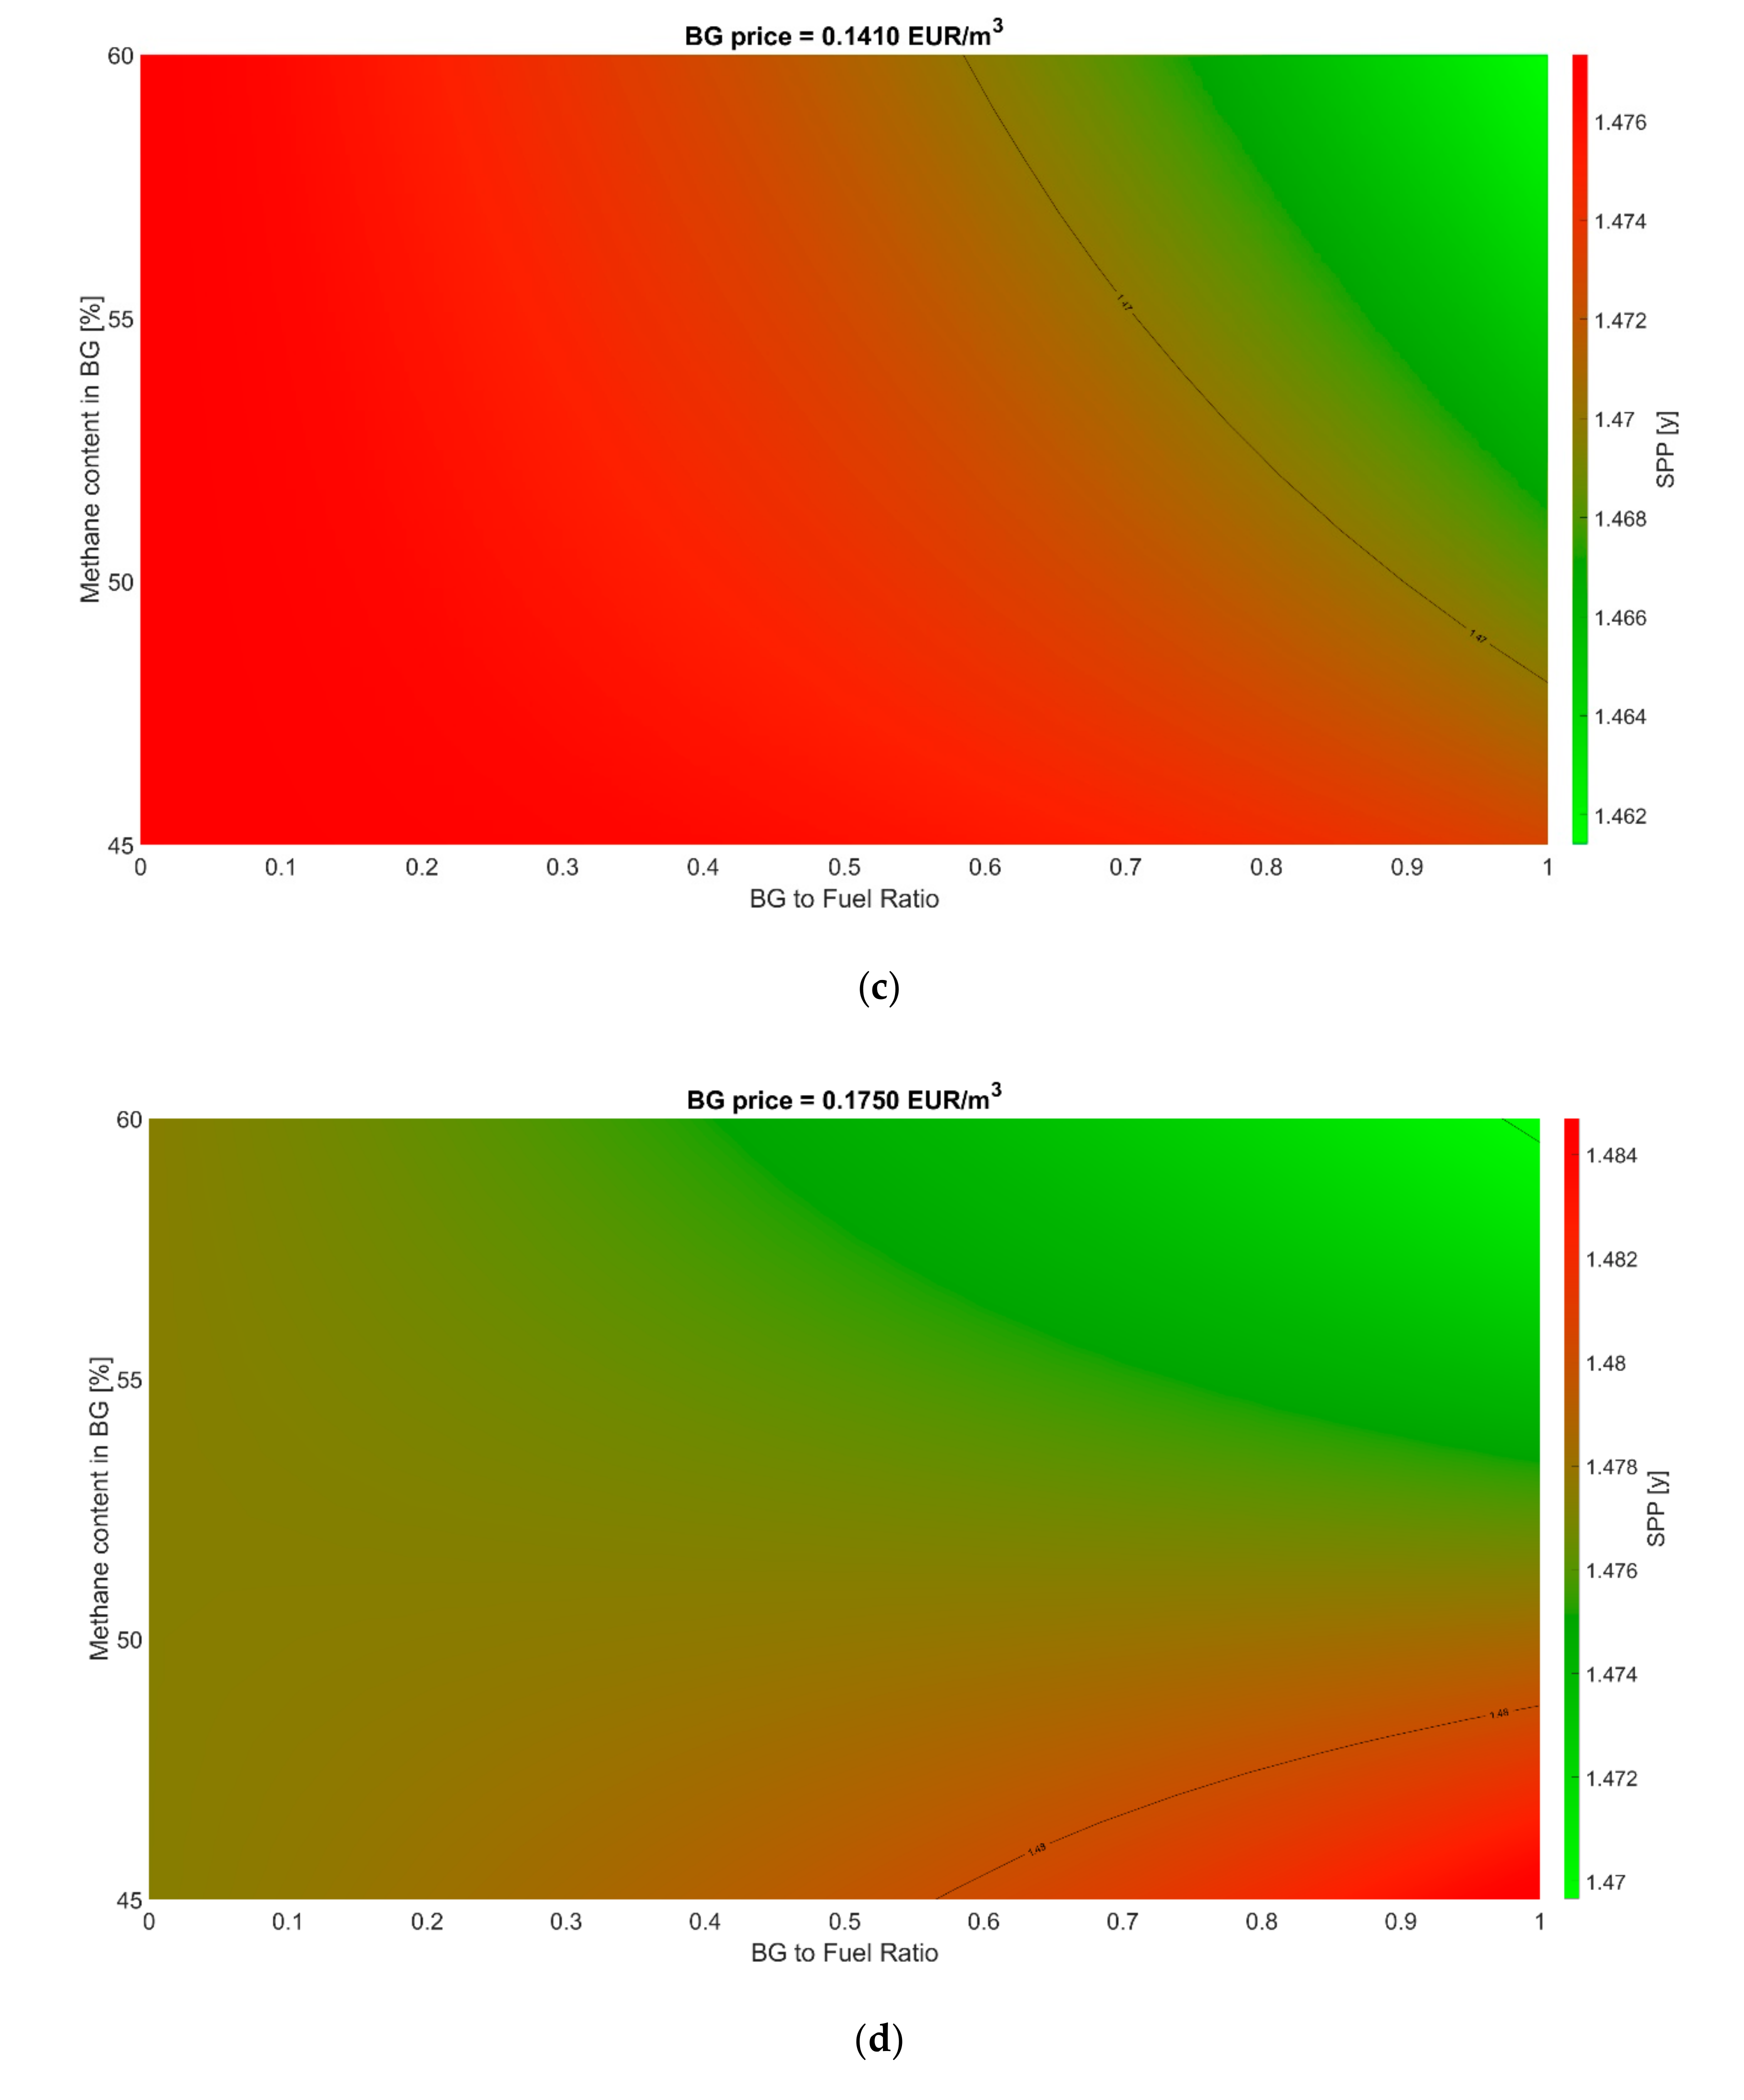
Figure 10 demonstrates the effect of the biogas portion in fuel and biogas digestion conditions (methane content and purification costs) on the project’s economics. Five 3D figures were constructed to represent five different biogas prices. Three different states can be recognized. In the first state (
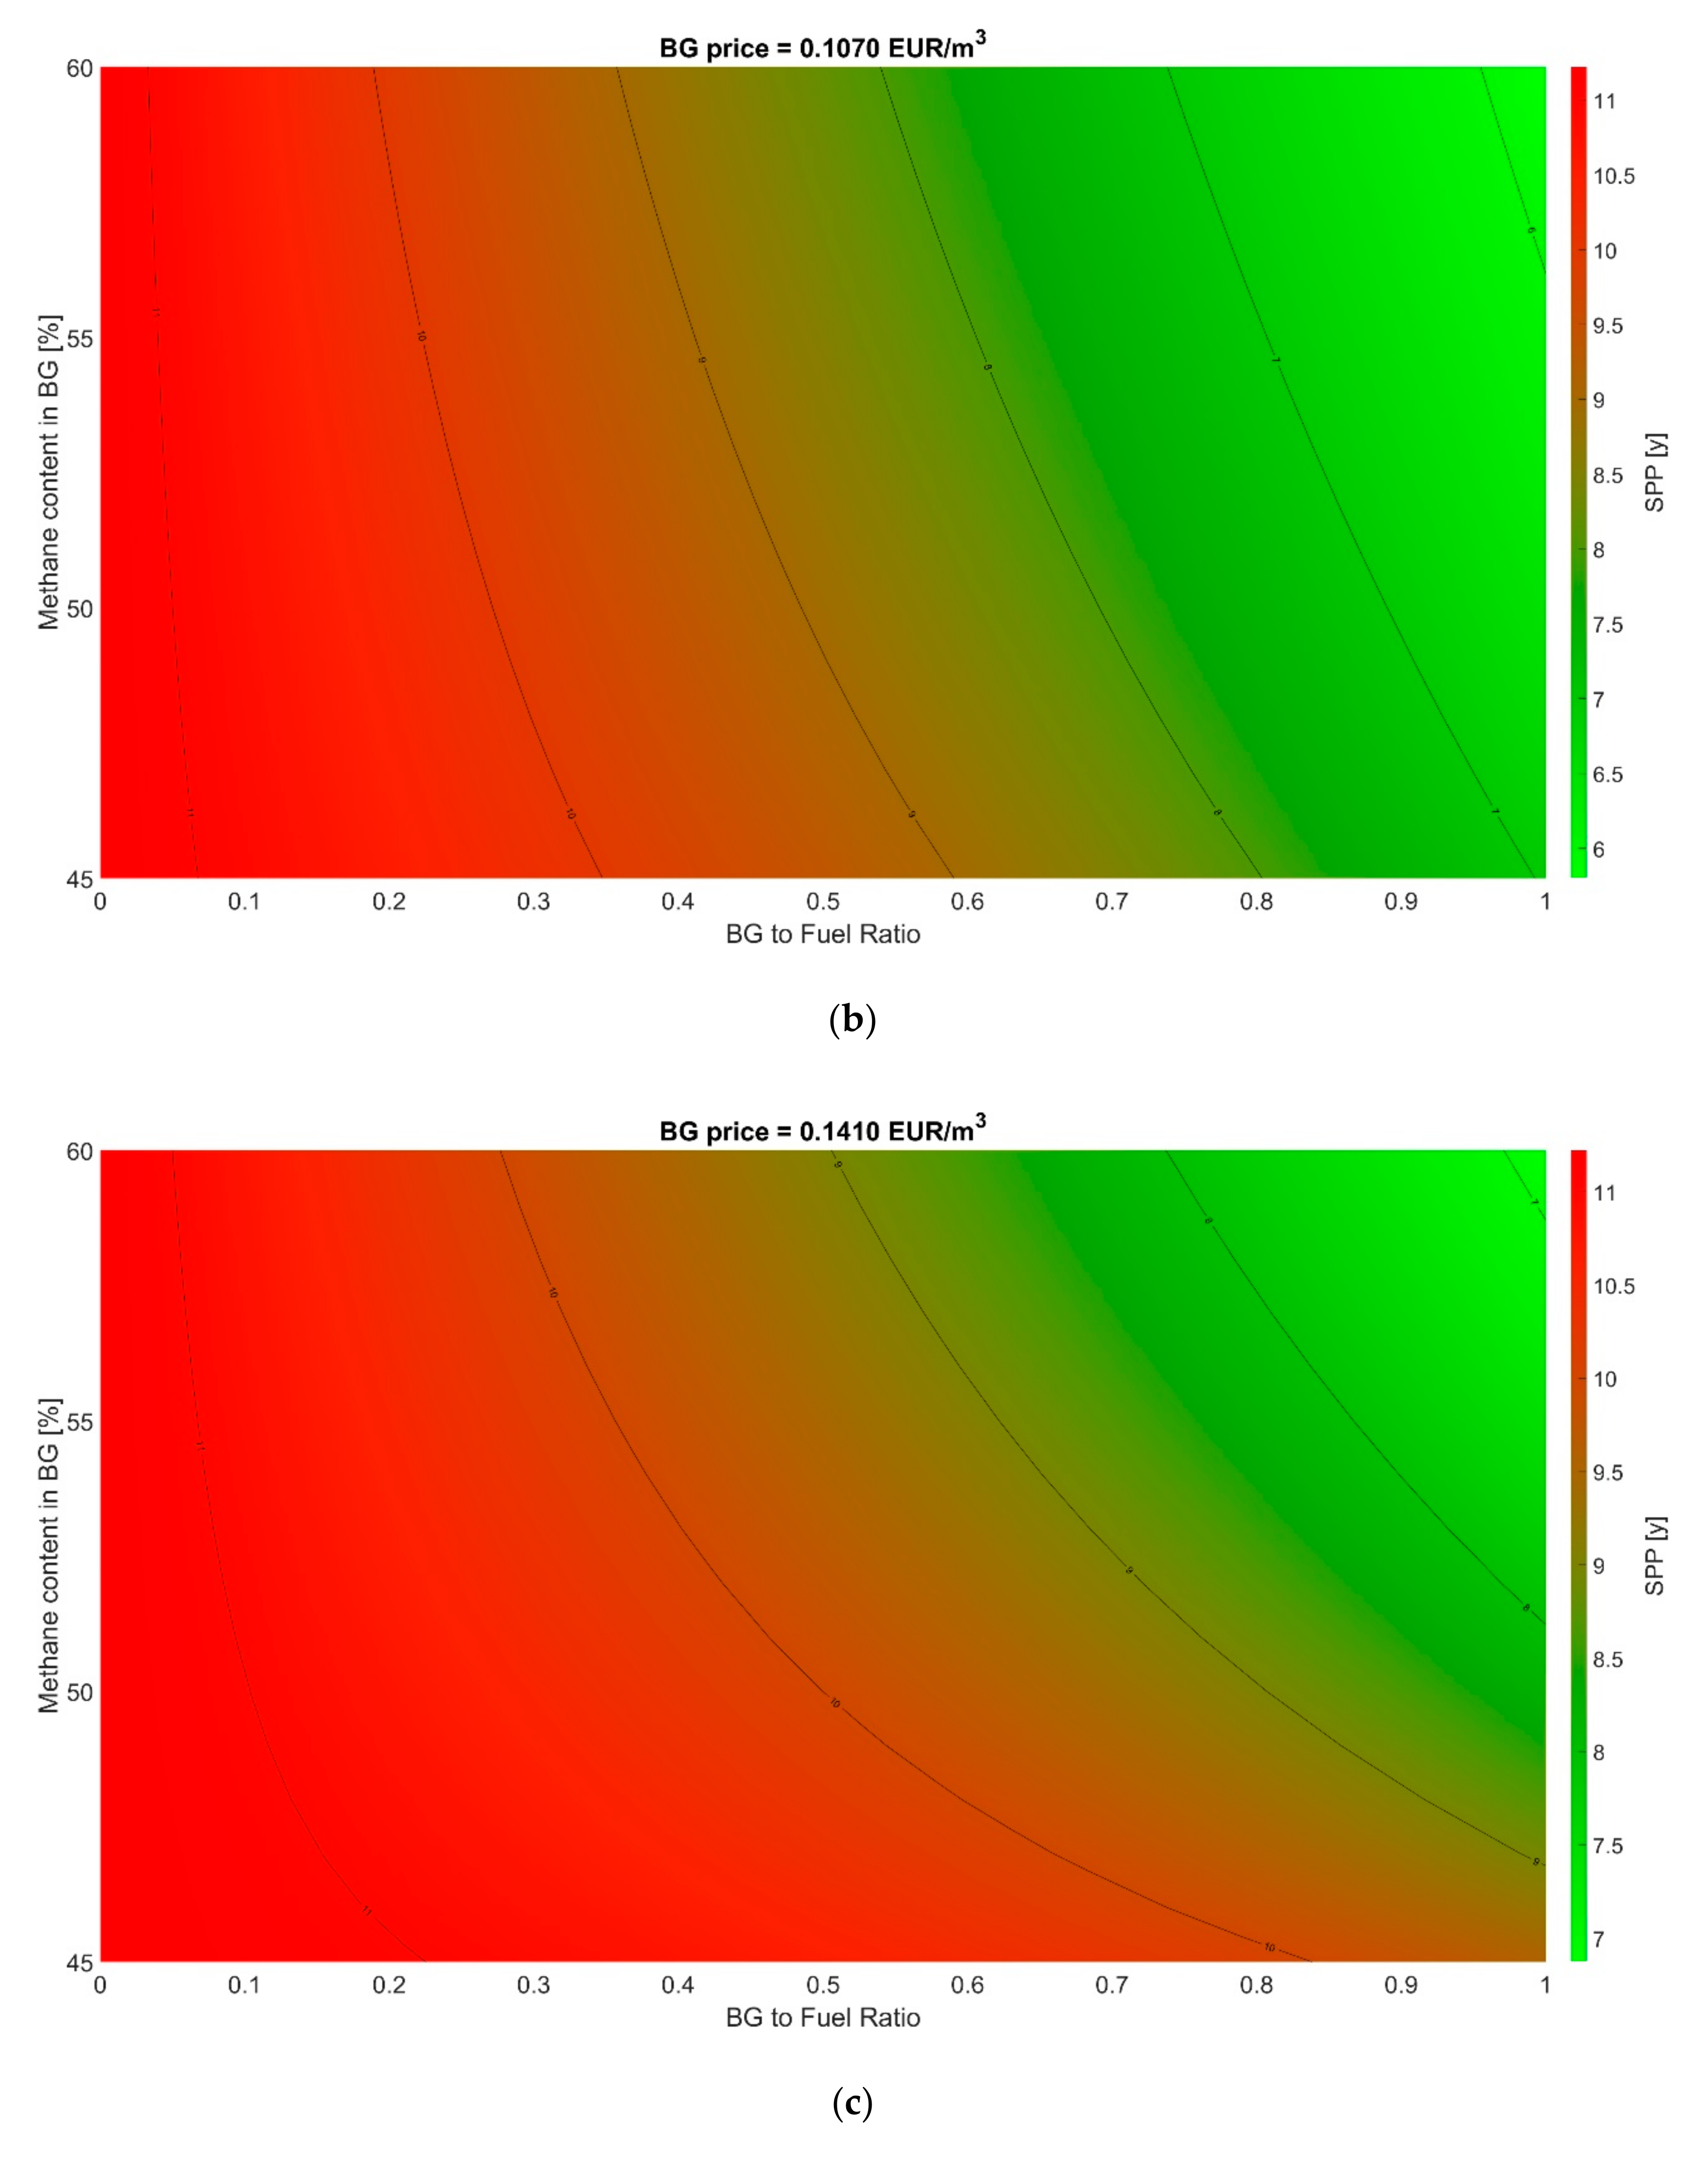
Figure 10a–c), addition of biogas to fuel had always a positive effect on the project’s profitability (i.e., it led to a decrease of SPP). However, with the increasing biogas price, this effect was reduced, which is logical. The minimum achievable SPP in the case of lowest biogas price (0.073 EUR/m3) was 5.1 years and in the case of highest biogas price (0.141 EUR/m3), it was 6.9 years. The second state (
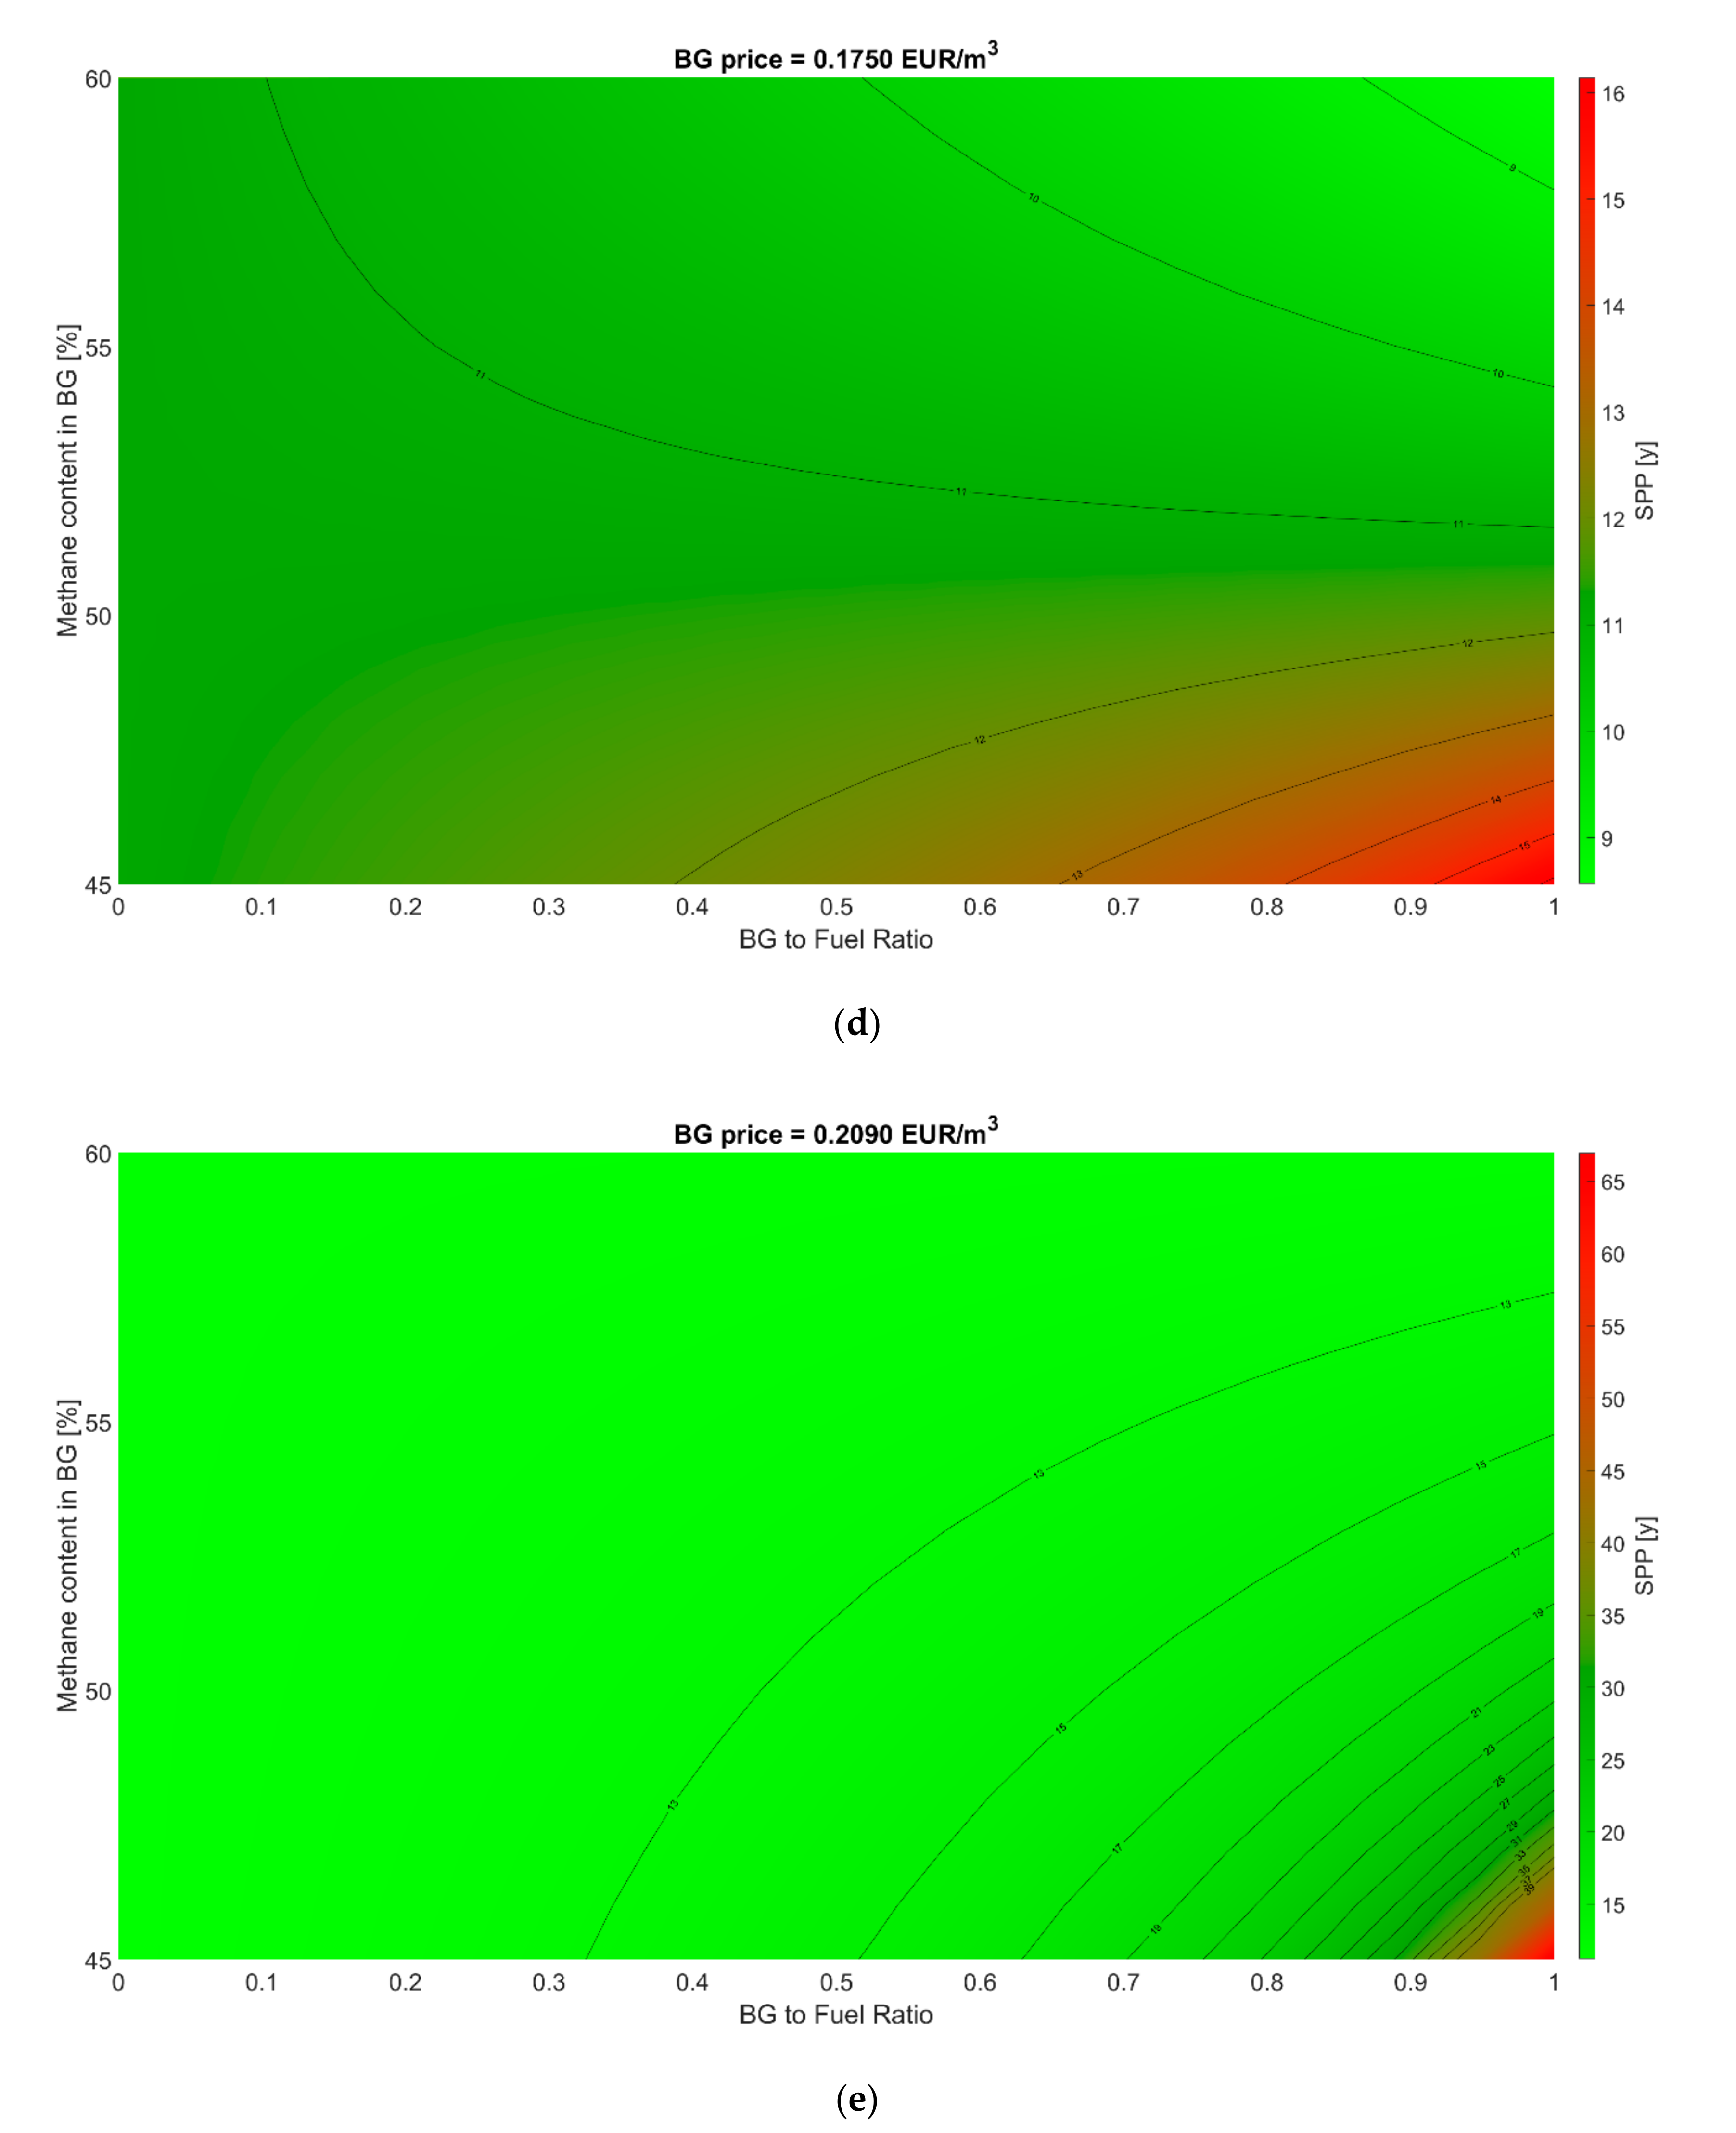
Figure 10d) corresponds to the situation in which biogas addition has positive or negative effect depending on its methane content. In this region, higher methane content led to desired SPP decrease because of higher calorific value of biogas and thus lower required biogas flow for steam generation. Vice versa, if methane content was insufficient, biogas calorific value was too low and consequent increase in biogas flow led to increase in SPP. For methane-rich biogas (over ca. 53 mol.%), adding biogas to boiler fuel led to the desired decrease in SPP from 11.2 years down to 8.6 years. If methane content in biogas was between 53 and 50 mol.%, addition of biogas had negligible effect and SPP remained almost the same. Mixing biogas with methane content below 50 mol.% into boiler fuel had a negative effect on SPP. In the worst case, adding biogas led to an increase of SPP from 11.2 years to 16.1 years, thus disfavoring cattle manure co-digestion as a solution to improve the proposed milk drying unit profitability.
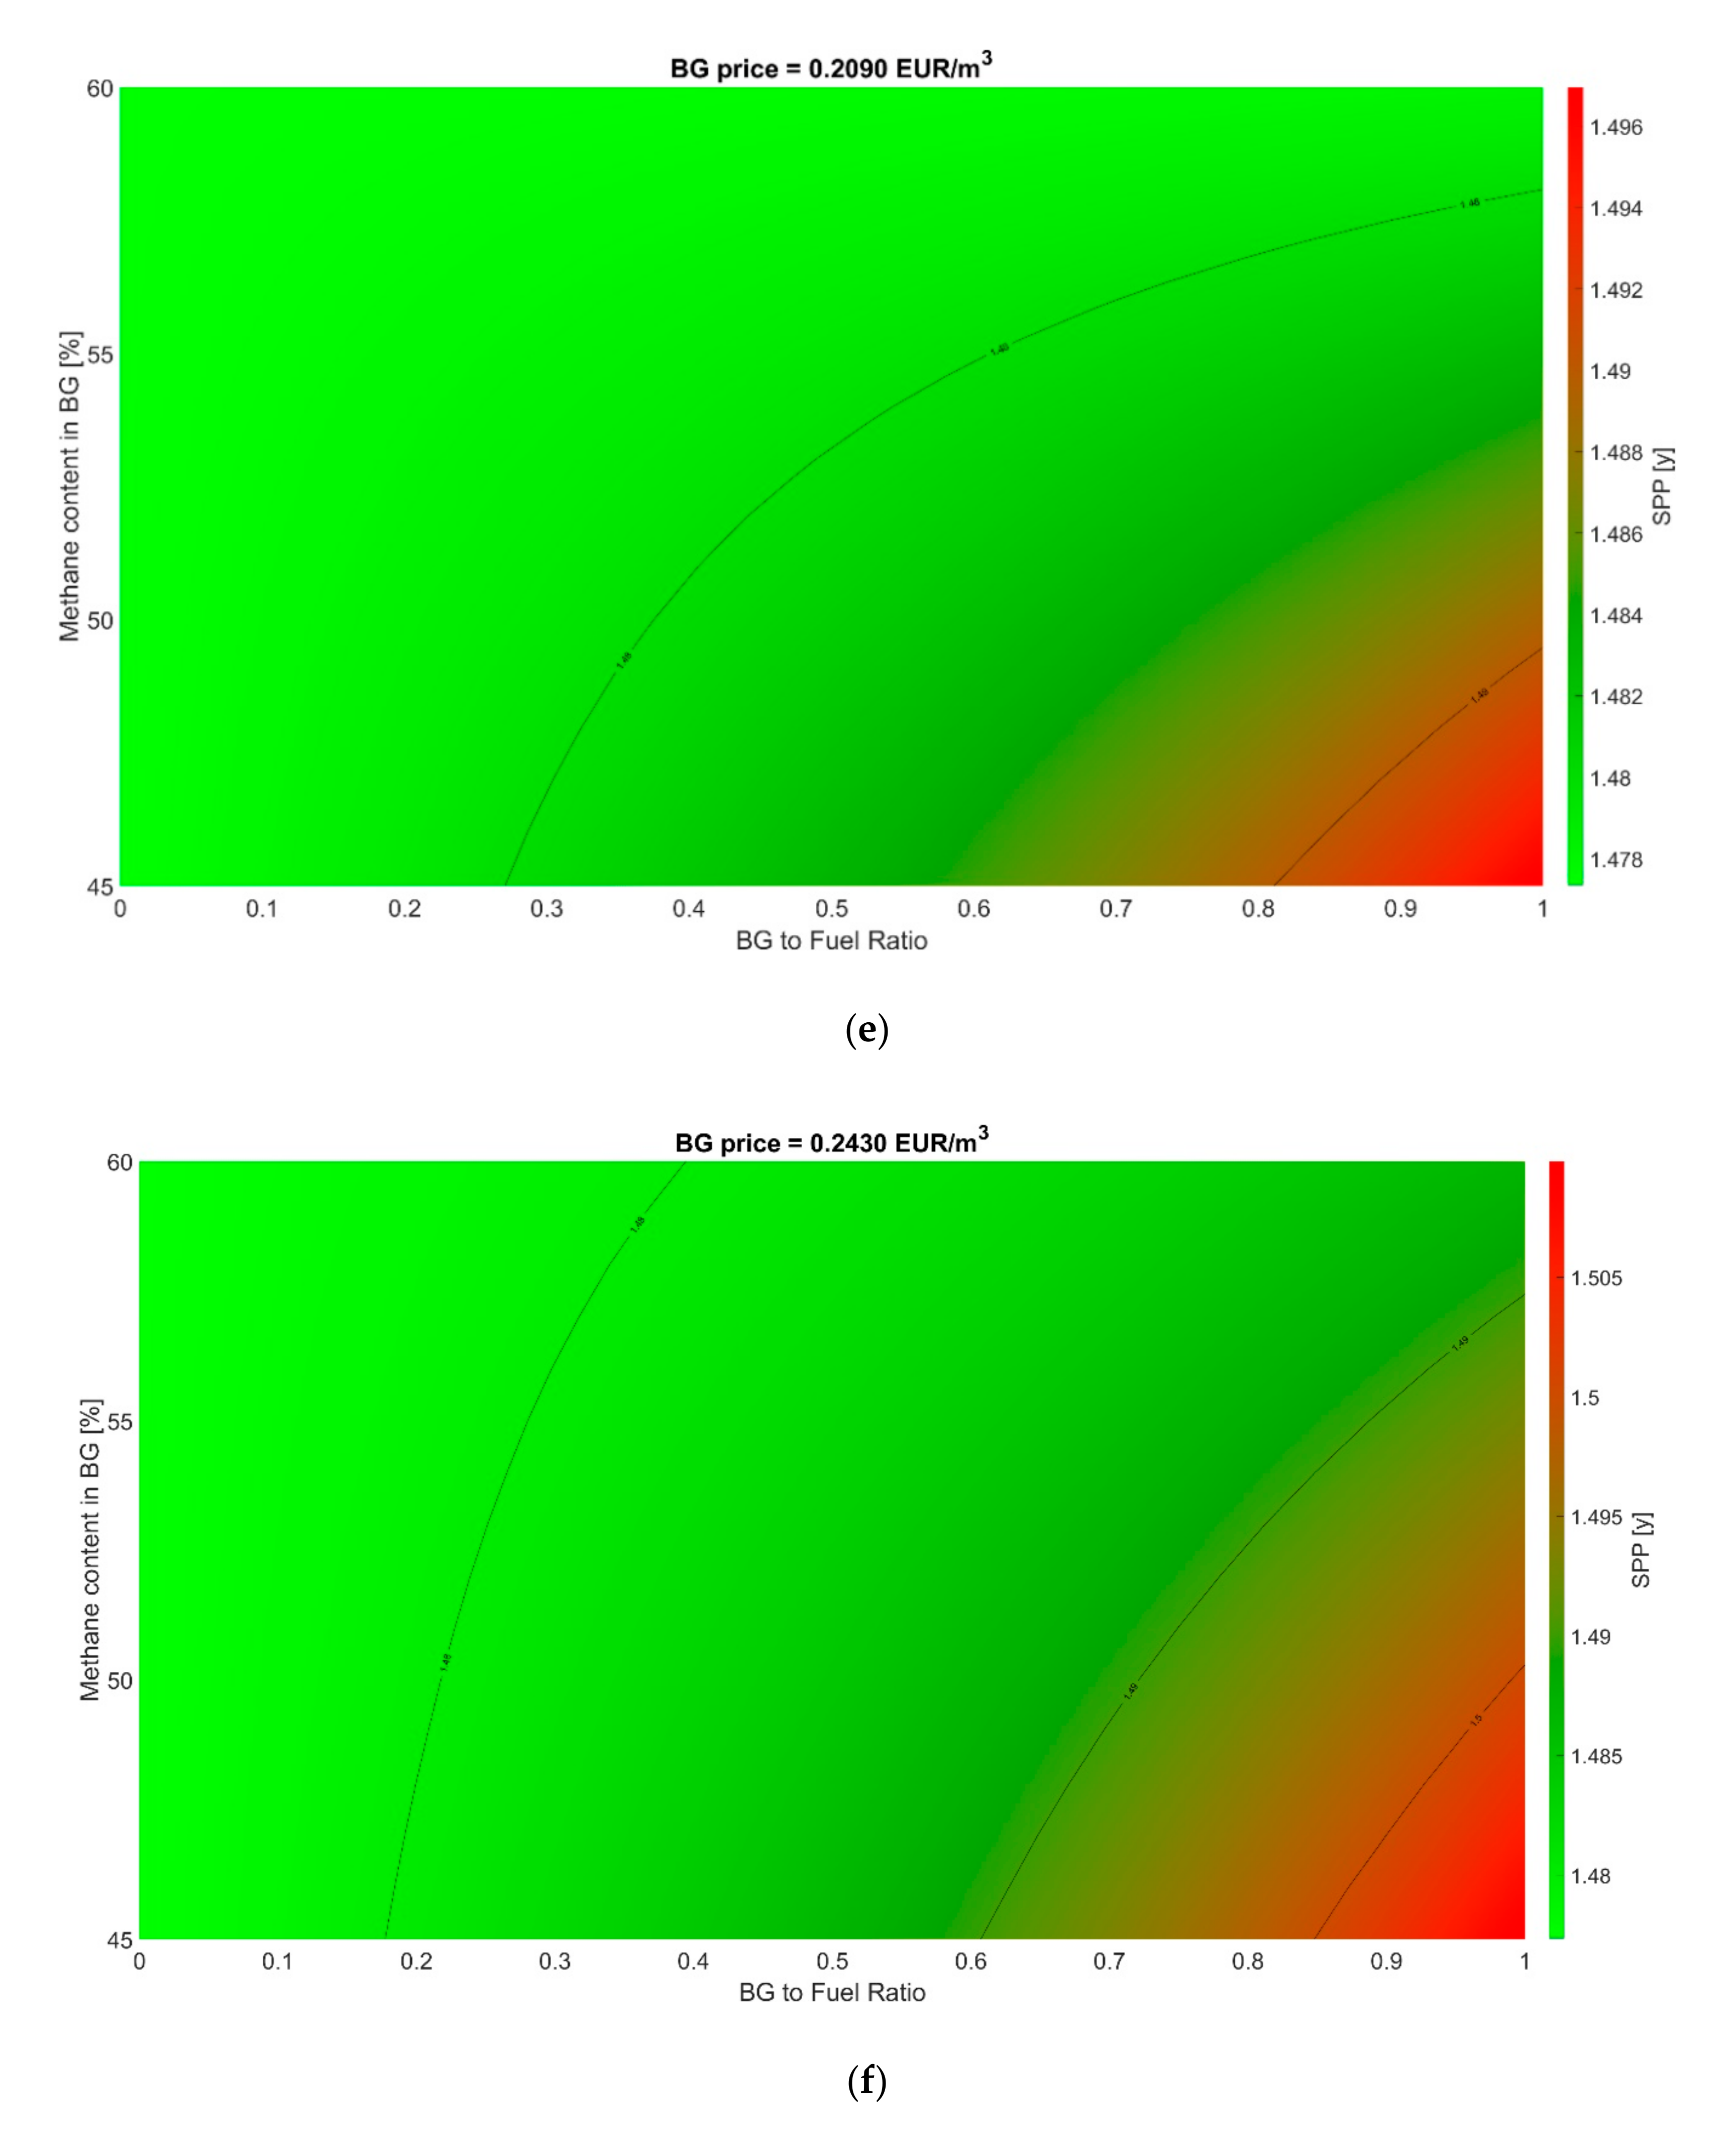
The third state (Figure 10e) represents an adverse situation in which adding biogas has always a negative effect on the project’s economics. For biogas with the lowest methane content, 45 mol.%, SPP increased from 11.2 years up to 66.4 years, making the project completely unfeasible. In this situation, biogas addition is not recommended. A similar plot (with significantly worse SPP increase to unreasonable values over 100 years) was modeled also for the highest considered biogas price of 0.243 EUR/m3, which is not presented in this paper.

3.2.2. Scenario B

Scenario B exhibited analogous behavior to scenario A (Figure 11) with one significant change. Again, Figure 11 shows three different states in which biogas addition had only positive, only negative, or both positive and negative effect on SPP, but high powdered milk price and low fresh milk price resulted in significantly lower SPP than in scenario A. This means that even for the highest biogas price of 0.243 EUR/m3 (Figure 11f), change in SPP due to biogas addition is negligible. SPP value varied from 1.45 to 1.51 years in the whole simulation range of process variables. It can be concluded that if the milk market strongly favors milk powder production, biogas addition is always favorable because of the implied positive environmental impact without significant effect on an actual dairy plant’s profitability. However, it has to be noted that such market price ratio between fresh milk and milk powder was not observed in the analyzed time period (Figure 9) and thus can be really considered only as a hypothetical best-case scenario.

3.2.3. Scenario C

In this scenario, the worst milk market situation was analyzed. In this case, the denominator in Equation (1) of SPP calculation, CI-CO, had always a negative value (i.e., no profit was made by producing milk powder). Therefore, even if the costs related to boiler fuel would be zero, the milk drying unit will always be operated with a loss and the project’s investment will never return. If this scenario is closest to reality, the project of a new milk drying unit is unfeasible in the whole simulation range of process variables. Thus, no relevant figure is presented for this scenario.

4. Discussion

In our work, formation of an industrial cluster combining a dairy plant and a biogas station of a wastewater treatment plant is proposed. The presented approach consisted of mathematical modeling and economic analysis based on a parametric sensitivity study. As literature review suggested [22,24,25], Aspen Plus simulator proved its capability to simulate evaporation processes typical for the food industry. Aspen Plus was successfully used to simulate an existing milk drying unit, to verify the developed model and to propose a new milk drying unit as an extension to an existing dairy plant even with slight alterations of milk composition used in other works [21,22]. As boiler fuel to produce the required steam, a mixture of natural gas and biogas was considered. As it was found out in economic analysis by parametric sensitivity study, addition of biogas can positively affect the project’s profitability. One of the key observations was the effect of fresh milk and milk powder market price. In an extremely positive situation (scenario B), biogas addition is always considered favorable. In an extremely negative situation (scenario C), it is not feasible to build a new milk drying unit even if energy consumption-related costs are zero.
However, in the situation closest to reality (scenario A), investment profitability strongly depends on the final biogas price. If the costs of desulphurization and other treatment of biogas are too high, mixing in biogas increases the operating costs, thus resulting in higher payback period. On the other hand, if the final biogas price is sufficiently low, biogas addition is always favorable. The biogas price region where biogas addition could lead to both payback period increase and decrease was also identified. In this case, methane content is the key determining factor of adding biogas being a negative or positive action. Methane content limits were compatible with experimental works [8,9] where cattle manure for anaerobic digestion was analyzed. It was demonstrated, in agreement with previous works [7,8,9,10,11,12,13], that dairy plant waste represents a potential large energy source and its transformation into biogas has positive environmental and economic implications. Kozłowski et al. [13] stated that this transformation process into biogas is economically unfeasible without financial government support. However, scenarios in which biogas generation can be feasible without external support were also identified in our study. It can be concluded that green dairy plants can be achieved through biogas generation and consumption; however, process economics must be considered in the design of such operation.
In addition, the complexity of industrial clustering was studied in this paper. Industrial clusters represent a complex symbiosis where changes in one part of the cluster (biogas treatment costs in the WWTP) can drastically affect another part of the cluster (profitability of new unit installation in the dairy plant) as it was indicated by Lin et al. [28]. This behavior should be taken into account in proposals and operation improvements of production processes that could benefit from industrial clustering.

5. Conclusions

Three different milk market scenarios for a project of a new milk drying unit were analyzed in this study. In each scenario, parametric sensitivity study of biogas methane content, biogas-to-fuel ratio, and biogas consumption costs was carried out. Major conclusions are:
  • In a moderate milk market situation (powdered milk price of 3320 EUR/t; fresh milk price of 280 EUR/t), biogas addition to boiler fuel can practically halve simple payback period (from 11.2 years to 5.1 years). Feasibility of its addition is strongly affected by effectiveness of cattle manure co-digestion and costs associated with biogas desulphurization. Lower methane content or higher biogas treatment costs led to increase of simple payback period (up to over 60 years).
  • In a very positive milk market situation (powdered milk price of 3700 EUR/t; fresh milk price of 260 EUR/t), biogas addition is always favorable mainly due to the implied positive environmental impact without significant effect on an actual dairy plant’s profitability. Simple payback period in this scenario was relatively constant even for lower methane content in biogas or higher biogas treatment costs. It varied from 1.45 to 1.51 years.
  • In a very negative scenario (powdered milk price of 2200 EUR/t; fresh milk price of 400 EUR/t), the project of a new milk drying unit with or without biogas addition is not feasible because of negative cash flow in the whole analyzed range.
The presented results suggest that rigorous mathematical modeling coupled with thorough economic analysis can serve as an aid in design and optimization of industrial processes where process economics are very sensitive to input data. Our study also represents robust data analysis to support decision making in investing in new projects in the food industry. It combines the frequently used simulation tool Aspen Plus with in-depth economic analysis to determine expected profitability of the examined project. It has shown complexity of renewable energy use and potential benefits of industrial clustering towards sustainable manufacturing processes. Our future work will be focused on further analysis of benefits of industrial clustering in the food and chemical industry, and on deeper evaluation of socioeconomic impacts of new industrial plants and operation improvements in existing ones.

Author Contributions

Conceptualization, J.J.; methodology, J.J., E.M., and A.K.; software, E.M. and A.K.; validation, J.J. and M.V..; formal analysis, M.V.; investigation, J.J.; resources, M.V.; data curation, J.J. and M.V.; writing—original draft preparation, J.J.; writing—review and editing, M.V.; visualization, J.J. and E.M.; supervision, J.J.; project administration, J.J.; funding acquisition, J.J. All authors have read and agreed to the published version of the manuscript.

Funding

This research was funded by the Slovak Research and Development Agency [Grant No. APVV 18 0134], by the Slovak Scientific Agency [Grant No. VEGA 1/0659/18] and by the Slovak University of Technology in Bratislava within the Young Scientist Support Program 2020. The authors are also grateful for support from the project Science and Technology Park STU [Grant No. ITMS26240220084], co-financed from the European Regional Development Fund.

Conflicts of Interest

The authors declare no conflict of interest. The funders had no role in the design of the study; in the collection, analyses, or interpretation of data; in the writing of the manuscript, or in the decision to publish the results.

References

  1. Weiland, P. Biogas production: Current state and perspectives. Appl. Microbiol. Biotechnol. 2010, 85, 849–860. [Google Scholar] [CrossRef] [PubMed]
  2. Scarlat, N.; Dallemand, J.-F.; Fahl, F. Biogas: Developments and perspectives in Europe. Renew. Energy 2018, 129, 457–472. [Google Scholar] [CrossRef]
  3. Ullah Khan, I.; Hafiz Dzarfan Othman, M.; Hashim, H.; Matsuura, T.; Ismail, A.F.; Rezaei-DashtArzhandi, M.; Wan Azelee, I. Biogas as a renewable energy fuel – A review of biogas upgrading, utilisation and storage. Energy Convers. Manag. 2017, 150, 277–294. [Google Scholar] [CrossRef]
  4. Sun, Q.; Li, H.; Yan, J.; Liu, L.; Yu, Z.; Yu, X. Selection of appropriate biogas upgrading technology—A review of biogas cleaning, upgrading and utilisation. Renew. Sustain. Energy Rev. 2015, 51, 521–532. [Google Scholar] [CrossRef]
  5. Abatzoglou, N.; Boivin, S. A review of biogas purification processes. Biofuelsbioproducts Biorefining 2009, 3, 42–71. [Google Scholar] [CrossRef]
  6. Adnan, A.I.; Ong, M.Y.; Nomanbhay, S.; Chew, K.W.; Show, P.L. Technologies for Biogas Upgrading to Biomethane: A Review. Bioengineering 2019, 6. [Google Scholar] [CrossRef] [PubMed] [Green Version]
  7. Walker, S.B.; Sun, D.; Kidon, D.; Siddiqui, A.; Kuner, A.; Fowler, M.; Simakov, D.S.A. Upgrading biogas produced at dairy farms into renewable natural gas by methanation. Int. J. Energy Res. 2018, 42, 1714–1728. [Google Scholar] [CrossRef]
  8. El-Mashad, H.M.; Zhang, R. Biogas production from co-digestion of dairy manure and food waste. Bioresour. Technol. 2010, 101, 4021–4028. [Google Scholar] [CrossRef] [PubMed]
  9. Kafle, G.K.; Chen, L. Comparison on batch anaerobic digestion of five different livestock manures and prediction of biochemical methane potential (BMP) using different statistical models. Waste Manag. (Oxf.) 2016, 48, 492–502. [Google Scholar] [CrossRef] [PubMed] [Green Version]
  10. Amon, T.; Amon, B.; Kryvoruchko, V.; Zollitsch, W.; Mayer, K.; Gruber, L. Biogas production from maize and dairy cattle manure—Influence of biomass composition on the methane yield. Agric. Ecosyst. Environ. 2007, 118, 173–182. [Google Scholar] [CrossRef]
  11. Tufaner, F.; Avşar, Y. Effects of co-substrate on biogas production from cattle manure: A review. Int. J. Environ. Sci. Technol. 2016, 13, 2303–2312. [Google Scholar] [CrossRef] [Green Version]
  12. Westerholm, M.; Hansson, M.; Schnürer, A. Improved biogas production from whole stillage by co-digestion with cattle manure. Bioresour. Technol. 2012, 114, 314–319. [Google Scholar] [CrossRef] [PubMed]
  13. Kozłowski, K.; Pietrzykowski, M.; Czekała, W.; Dach, J.; Kowalczyk-Juśko, A.; Jóźwiakowski, K.; Brzoski, M. Energetic and economic analysis of biogas plant with using the dairy industry waste. Energy 2019, 183, 1023–1031. [Google Scholar] [CrossRef]
  14. Qian, X.; Lee, S.; Chandrasekaran, R.; Yang, Y.; Caballes, M.; Alamu, O.; Chen, G. Electricity Evaluation and Emission Characteristics of Poultry Litter Co-Combustion Process. Appl. Sci. 2019, 9, 4116. [Google Scholar] [CrossRef] [Green Version]
  15. Van Meerbeek, K.; Appels, L.; Dewil, R.; Van Beek, J.; Bellings, L.; Liebert, K.; Muys, B.; Hermy, M. Energy potential for combustion and anaerobic digestion of biomass from low-input high-diversity systems in conservation areas. Gcb Bioenergy 2015, 7, 888–898. [Google Scholar] [CrossRef] [Green Version]
  16. SARIO. Food Processing Industry in Slovakia. Available online: https://www.sario.sk/sites/default/files/data/sario-food-processing-industry-in-slovakia-2017-02-28-web.pdf (accessed on 20 October 2019).
  17. Bylund, G. Dairy Processing Handbook; Tetra Pak Processing Systems AB: Lund, Sweden, 2003. [Google Scholar]
  18. Ramirez, C.; Patel, M.; Blok, K. From fluid milk to milk powder: Energy use and energy efficiency in the European dairy industry. Energy 2006, 31, 1984–2004. [Google Scholar] [CrossRef] [Green Version]
  19. Ribeiro, C.P.; Andrade, M.H.C. Performance analysis of the milk concentrating system from a Brazilian milk powder plant. J. Food Process Eng 2003, 26, 181–205. [Google Scholar] [CrossRef]
  20. Bon, J.; Clemente, G.; Vaquiro, H.; Mulet, A. Simulation and optimization of milk pasteurization processes using a general process simulator (ProSimPlus). Comput. Chem. Eng. 2010, 34, 414–420. [Google Scholar] [CrossRef]
  21. Zhang, Y.; Munir, M.T.; Yu, W.; Young, B.R. Development of hypothetical components for milk process simulation using a commercial process simulator. J. Food Eng. 2014, 121, 87–93. [Google Scholar] [CrossRef]
  22. Madoumier, M.; Azzaro-Pantel, C.; Tanguy, G.; Gésan-Guiziou, G. Modelling the properties of liquid foods for use of process flowsheeting simulators: Application to milk concentration. J. Food Eng. 2015, 164, 70–89. [Google Scholar] [CrossRef] [Green Version]
  23. AspenTech. Aspen Technology Engineering Products—Aspen Plus. Available online: https://www.aspentech.com/en/products/engineering/aspen-plus (accessed on 1 September 2019).
  24. Jorge, L.M.M.; Righetto, A.R.; Polli, P.A.; Santos, O.A.A.; Filho, R.M. Simulation and analysis of a sugarcane juice evaporation system. J. Food Eng. 2010, 99, 351–359. [Google Scholar] [CrossRef]
  25. Chawankul, N.; Chuaprasert, S.; Douglas, P.; Luewisutthichat, W. Simulation of an agitated thin film evaporator for concentrating orange juice using AspenPlusTM. J. Food Eng. 2001, 47, 247–253. [Google Scholar] [CrossRef]
  26. Mo, C.; He, C.; Yang, L. Structural characteristics of industrial clusters and regional innovation. Econ. Lett. 2020, 188, 109003. [Google Scholar] [CrossRef]
  27. Oldani, F.; Thomas, S.; Hiller, F.; Caldelari, F. Industrial Parks; Zurich Insurance Group Ltd.: Zurich, Switzerland, 2013. [Google Scholar]
  28. Lin, C.-H.; Tung, C.-M.; Huang, C.-T. Elucidating the industrial cluster effect from a system dynamics perspective. Technovation 2006, 26, 473–482. [Google Scholar] [CrossRef]
  29. Zhang, Z.; To, C.; Cao, N. How do Industry Clusters Success: A Case Study in China’s Textiles and Apparel Industries. J. Text. Appar. Technol. Manag. 2004, 4, 1–10. [Google Scholar]
  30. Celander, F.; Enquist, R.; Friman, K.; Karlsson, P.; Lundqvist, E.; Persson, A.; Rudolfsson, E.; Sterne, A.; Svanstrom, L.; Ohnerud, M. Industrial Symbiosis in Helsingborg; Linkoping University: Linkoping, Sweden, 2013. [Google Scholar]
  31. Lagnevik, M. The Dynamics of Innovation Clusters: A Study of the Food Industry; Edward Elgar Publishing Limited: Cheltenham, UK, 2003. [Google Scholar]
  32. Bakshi, A.S.; Smith, D.E. Effect of Fat Content and Temperature on Viscosity in Relation to Pumping Requirements of Fluid Milk Products. J. Dairy Sci. 1984, 67, 1157–1160. [Google Scholar] [CrossRef]
  33. Chandan, R. CHAPTER 1: Properties of Milk and Its Components. In Dairy-Based Ingredients; American Association of Cereal Chemists: Minnesota, MN, USA, 1997. [Google Scholar] [CrossRef]
  34. SPP. Natural Gas Composition and Emission Factor (in Slovak). Available online: https://www.spp-distribucia.sk/dodavatelia/informacie/zlozenie-zemneho-plynu-a-emisny-faktor/ (accessed on 3 January 2020).
  35. Woods, D.R. Appendix D: Capital Cost Guidelines. In Rules of Thumb in Engineering Practice; Wiley: New Jersey, NJ, USA, 2007; pp. 376–436. [Google Scholar] [CrossRef] [Green Version]
  36. EC. European Commision—Milk and dairy products. Available online: https://ec.europa.eu/info/food-farming-fisheries/farming/facts-and-figures/markets/prices/price-monitoring-sector/animal-products/milk-and-dairy-products_en (accessed on 21 August 2019).
  37. Palm, R.B. The Economic Potential for Production of Upgraded Biogas Used as Vehicle Fuel in Sweden; Chalmers University of Technology: Goteborg, Sweden, 2010. [Google Scholar]
  38. Beddoes, J.C.; Bracmort, K.S.; Burns, R.T.; Lazarus, W.F. An Analysis of Energy Production Costs from Anaerobic Digestion Systems on U.S. Livestock Production Facilities; Natural Resources Conservation Service, United States Department of Agriculture: Washington, DC, USA, 2007. [Google Scholar]
Figure 1. Simplified process flowsheet of milk preheating and concentration section of the milk drying unit (light blue—fresh whole milk, dark blue—concentrated milk, light red—live steam from boiler room, dark red—steam generated by milk solution evaporation, black—thermocompressor discharge steam, green—steam condensate after expansion). TC—thermocompressor, E—evaporator effect, HEx—heat exchanger.
Processes 08 01262 g001
Figure 2. Simplified process flowsheet of the boiler room (light red—live steam from boiler room and exhaust steam from feed water preheater and degasser, green—feed water, purple—combustion air, yellow—fuel, grey—flue gas). NG – natural gas, BG – biogas, FWP – feed water preheater and degasser, B-F – boiler.
Processes 08 01262 g002
Figure 3. Aspen Plus process flowsheet of milk preheating and concentration (color specification of streams compatible with Figure 1).
Processes 08 01262 g003
Figure 4. Aspen Plus process flowsheet of boiler room (color specification of streams compatible with Figure 2).
Processes 08 01262 g004
Figure 5. Aspen Plus model verification by solids content (a) and steam consumption (b).
Processes 08 01262 g005
Figure 6. Total boiler fuel consumption dependency on biogas-to-fuel ratio for two values of methane content in biogas (solid line—60 mol.% of methane, dashed line—45 mol.% of methane).
Processes 08 01262 g006
Figure 7. Total boiler fuel consumption as a function of biogas-to-fuel ratio and methane content in biogas.
Processes 08 01262 g007
Figure 8. Potential natural gas savings represented as natural gas consumption as a function of biogas-to-fuel ratio and methane content in biogas.
Processes 08 01262 g008
Figure 9. Development of fresh milk (dashed line) and whole milk powder (solid line) prices in European Union in 2012–2018.
Processes 08 01262 g009
Figure 10. SPP for scenario A of milk drying unit as a function of biogas-to-fuel ratio, methane content in biogas, and biogas price—0.073 EUR/m3 (a), 0.107 EUR/m3 (b), 0.141 EUR/m3 (c), 0.175 EUR/m3 (d), and 0.209 EUR/m3 (e).
Processes 08 01262 g010aProcesses 08 01262 g010bProcesses 08 01262 g010c

ScenarioPowdered Milk Price [EUR/t]Fresh Milk Price [EUR/t]
A3320280
B3700260
C2200400
Figure 11. SPP for scenario B of milk drying unit as a function of biogas-to-fuel ratio, methane content in biogas, and biogas price—0.073 EUR/m3 (a), 0.107 EUR/m3 (b), 0.141 EUR/m3 (c), 0.175 EUR/m3 (d), 0.209 EUR/m3 (e), and 0.243 EUR/m3 (f).
Processes 08 01262 g011aProcesses 08 01262 g011bProcesses 08 01262 g011c
Table 1. Composition of fresh pasteurized whole milk in the Aspen Plus model.
ComponentWeight Percentage [%]
Water90.95
Palmitic acid1.40
Oleic acid1.40
Lactose3.30
Calcium0.28
Potassium0.27
Proline2.40
Table 2. Comparison of measured milk properties [17,32,33] with properties predicted by the Aspen Plus model for fresh pasteurized whole milk at 15 °C.
PropertyValue Predicted by the Aspen Plus ModelMeasured Value Range
Density [kg/m3]10181020–1040
Dynamic viscosity [mPa.s]1.41.5–2.8
Specific heat capacity [kJ/kg/K]3.873.8–3.9
Table 3. Natural gas composition as provided by the natural gas distributor [34].
ComponentMole Percentage [%]
Methane95.5
Ethane2.6
Propane0.7
Carbon dioxide0.5
Nitrogen0.7
Table 4. Biogas composition (after treatment).
ComponentMole Percentage [%]Weight Percentage [%]
Methane 145–6024.3–37.8
Carbon dioxide 132–4755.4–69.8
Nitrogen32.8–3.3
Water53.1–3.5
Ammonia, Hydrogen sulfideNegligibleNegligible
1 Subject of parametric sensitivity study.
Table 5. Operating values of selected process variables in the new milk drying unit.
UnitMass Flow of Outlet Milk Stream [kg/h]Mass Flow of Steam Used for Heating [kg/h]Solids Content in Outlet Milk Stream [wt.%]Temperature of Inlet/Outlet Milk Stream [°C]Pressure of Inlet/Outlet Milk Stream [kPa]
Heat exchangers
HEx14 800108971/84100/95
HEx24 800155.3952.9/7195/90
HEx34 80080.7942.9/52.990/85
HEx44 800281.397/42.985/80
HEx51 624.125.526.651.3/62.632/27
Evaporator effects
E13 963.382610.984/84.860/56
E23 176.575013.684.8/8356/53
E32 440.7701.317.783/74.853/38
E41 624.1736.726.674.8/51.338/12
E5883.4747.348.962.6/6327/21
Spray
dryer
448.1Electrical heating96.463/85.1-
Table 6. Required investment breakdown.
EquipmentTotal Purchase Costs [EUR]
Five-effect evaporator410,000
Spray dryer200,000
Boiler190,000
Heat exchangers180,000
Pumps and fans40,000
Thermocompressors100,000
Sum1,120,000
Table 7. Milk price inputs in economic analysis.
ScenarioPowdered Milk Price [EUR/t]Fresh Milk Price [EUR/t]
A3320280
B3700260
C2200400

