Article

Enhanced Degradation of Phenolic Compounds in Coal Gasification Wastewater by Methods of Microelectrolysis Fe-C and Anaerobic-Anoxic—Oxic Moving Bed Biofilm Reactor (A2O-MBBR)

1
Thai Nguyen University of Education, Thai Nguyen University, Thai Nguyen Province 250000, Vietnam
2
Institute of Chemistry and Materials, Institute of Military Science and Technology, Hanoi City 100 000, Vietnam
3
International School, Thai Nguyen University, Thai Nguyen 250000, Vietnam
4
NTT Hi-Tech Institute, Nguyen Tat Thanh University, Ho Chi Minh City 700000, Vietnam
5
Center of Excellence for Green Energy and Environmental Nanomaterials, Nguyen Tat Thanh University, Ho Chi Minh City 700000, Vietnam
*
Authors to whom correspondence should be addressed.
Processes 2020, 8(10), 1258; https://doi.org/10.3390/pr8101258
Submission received: 31 August 2020 / Accepted: 17 September 2020 / Published: 7 October 2020
(This article belongs to the Special Issue Wastewater Treatment Processes)

Abstract

:
The coal gasification wastewater figures prominently among types of industrial effluents due to its complex and phenolic composition, posing great difficulty for conventional water treatment processes. Since the coking wastewater is toxic and mutagenic to humans and animals, treatment of coal gasification wastewater is genuinely necessary. In this study, we established a lab-scale A2O (Anaerobic-Anoxic—Oxic) with moving bed biological reactor (MBBR) system and evaluated some water indicators of wastewater pretreated with internal electrolysis, of wastewater output of the established A2O-MBBR system, and of the wastewater treated by the combination thereof. The wastewater was taken from a coking plant at Thai Nguyen Iron and Steel Joint Stock Company in Vietnam. COD, BOD5, NH4+-N, phenol, and pH of the input coal gasification wastewater were 2359, 1105, 319, 172 mg/L, and 8 ± 0.1, respectively. The conditions of internal electrolysis were as follows: 720 min of reaction time, pH = 4, 25 g/L Fe-C dosage, and 100 mg/L PAM dosage. After internal electrolysis process, the removal of COD, BOD5, NH4+-N, and phenol were 53.7%, 56.7% 60.5%, and 73.3%, respectively. After 24 h of treatment, the treatment efficiencies of the combined treatment process are as follows: 100% phenol removal, 71.3% of TSS removal; 97.7% reduction of BOD5, and 97.1% reduction of COD; total N content reduced by 97.6%; total P content decreased by 81.6%; and NH4+-N content decreased by 97.5%. All above indicators after treatment have met QCVN 52: 2017/BTNMT (column A) Vietnamese standard for steel industry wastewater.

1. Introduction

The coal gasification wastewater is among the most difficult-to-treat wastewaters due to its complex and phenolic composition, which contains a large number of organic compounds and cyanide [1]. Since it is toxic and mutagenic to humans and animals, treatment of coal gasification wastewater is genuinely necessary. However, in Vietnam, coal gasification wastewater has been treated by traditional methods, often combining two main processes, pretreatment by physical and chemical methods and subsequent biological process. Of which, physicochemical pretreatment processes involved the removal of phenol and NH3 from highly concentrated pollutants to facilitate the subsequent biological treatment and might include extraction, extraction, and autoclaving, filler, flocculation, dilution, electrochemical, Fenton, and oxidation [2,3,4,5].
However, such pretreatment methods still present certain disadvantages such as high treatment cost, technological complexity, and generation of secondary pollution. In recent years, internal electrolysis has been gaining popularity in studies involving pretreatment of wastewater, especially industrial wastewater polluted with organic substances that are difficult to biodegrade and present in high concentration. The treatment method could be utilized in a wide range of industries ranging from textile and pharmaceutical to treatment of domestic and coking wastewater [5,6,7,8,9].
Internal electrolysis allows following reactions to occur [5,7]:
  • The effect of electric fields: The electrical field generated microcells in wastewater could trigger the movement of pollutants to move to opposite electrode, where redox reaction would occur against charged pollutants. As a result, chemical structure of the pollutants would be transformed or degraded.
  • The reducing effect of hydrogen:
    In the acidic medium, the following reaction produces atoms [H].
    Fe + 2H+ → Fe2+ + 2 [H]
    Then, atoms [H] will reduce pollutants. For example, NO 2   group pollutants will be reduced and converted to amino group (NH2) compounds.
  • The effect of metallic iron: The metallic elements that have weaker reactivity than iron could exchange electrons on the metallic iron surface. Then metal ions with strong toxicity or organic substances will be reduced by iron to metal ions in a less toxic state. For example, Cr(VI) having E0 ( Cr 2 O 7 2 /Cr3+) = 1.36 V and strong oxidizing properties would react with metal iron:
    2 Fe   +   Cr 2 O 7 2   +   14 H +     2 Fe 3 +   +   2 Cr 3 +   +   7 H 2 O
    Then, Cr(VI) with strong oxidizing properties will be converted to Cr(III) with weak reducing properties.
    In acidic conditions, iron also reduce organic substances containing NO 2   - group to NH2 group.
    C6H5NO2 + 3Fe + 6H+ → C6H5NH2 + 3Fe2+ + 2H2O
  • Reducing effect of Fe2+ ions: Iron oxidized to iron Fe2+, Fe2+ has high reducing properties. For Cr (VI), the reduction reaction occurs as follows.
    6Fe2+ + 14H+ → 6Fe3+ + 2Cr3+ + 7 H2O
  • The flocculation effect of iron ions: In acidic wastewater, metallic iron will corrode, thus expediting the production of Fe2+ and Fe3+ ions. In the presence of O2, following reactions will occur in alkaline environments.
    Fe2+ + 2OH → Fe(OH)2
    4Fe2+ + 8OH + O2 + 2H2O → 4Fe(OH)3
    The generated Fe (OH)2 and Fe(OH)3 could adsorb organic substances, thus contributing to the treatment process.
  • The effect of chemical precipitation: Fe2+ and Fe3+ ions, when being in contact with anions, precipitate into compounds such as FeS, Fe3[Fe(CN)6]2, and Fe4[Fe(CN)6]3. All of which could settle quickly and are easily removed from the wastewater.
Past studies involving treatment of gasified coal wastewater often focused on anaerobic—aerobic (AO), A2O, UASB, SBR, and FBR method [10,11,12,13,14,15]. However, recent advances have shown that combinations thereof, such as A2O (Anaerobic-Anoxic—Oxic) with moving bed biological reactor (MBBR) may offer certain advantages including the oxidation and decomposition of pollutants in anaerobic reaction, thus leading to reduced wastewater concentration and toxicity and allowing the possibility for pollutants to biodegrade. This, in turn, improves the N removal,   NH 4 + nitrification, and antinitrification in subsequent biological processes in the reactor with mobile media biofilm [14]. This approach was further extended by integrating internal electrolysis as the pretreatment process preceding the A2O-MBBR system to treat wastewater that contains pollutants with high COD, NH 4 + ,   and N content and effluents that are difficult to biodegrade such as discharges from coal gasification and coking processes [16,17,18,19]. In this study, we aimed to improve treatment process for real coking wastewater by comparing water indicators of effluents treated by various processes including internal electrolysis with Fe-C materials, the A2O-MBBR integrated system, and a combinational process in which internal electrolysis treatment preceded the A2O-MBBR.

2. Materials and Methods

2.1. Fabrication of Materials

Fe powder with particle size of smaller than 50 µm and purity of 99.9%, graphite powder with particle size of 50 µm and 99.95% purity, and (NH4)2CO3 were purchased from Shanghai Chemical Co. Ltd. (Shanghai, China).
The Fe-C internal electrolytic material sample was prepared as follows. A mixture containing 95% Fe, 3% graphite, and 2% bentonite binder additive (weight ratio) was first prepared. The mixture was then pressed into blocks, dried at 80−105 °C for 2 h, sintered at 500−600 °C for 4 h, and then allowed to cool naturally. The material was then stored in a desiccator for use in further studies.

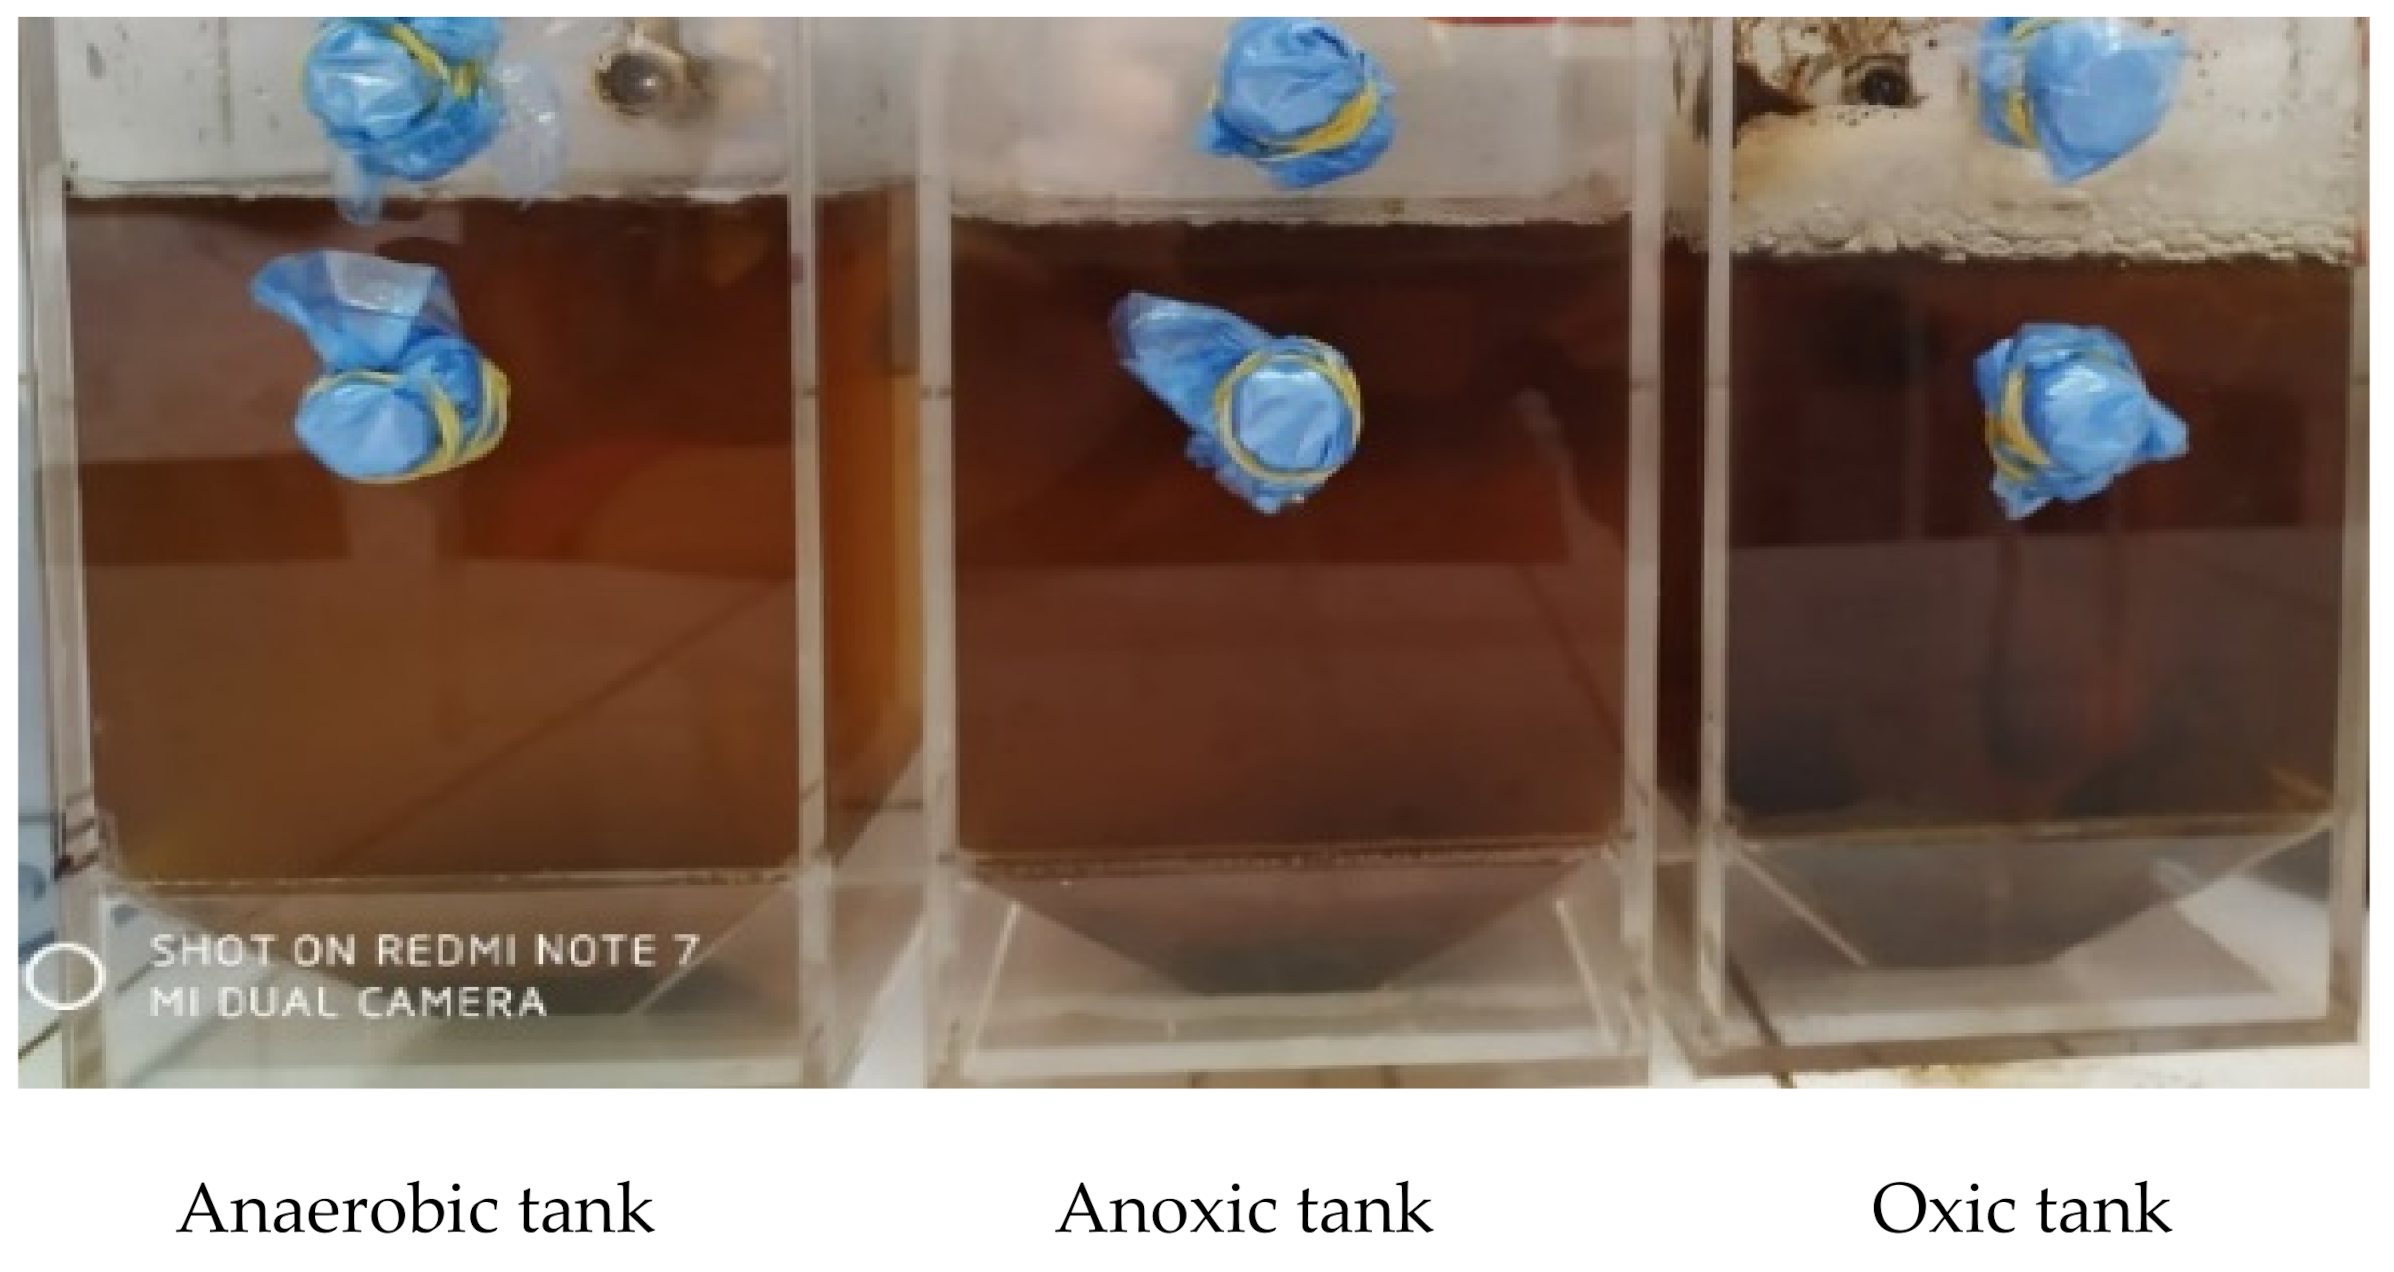
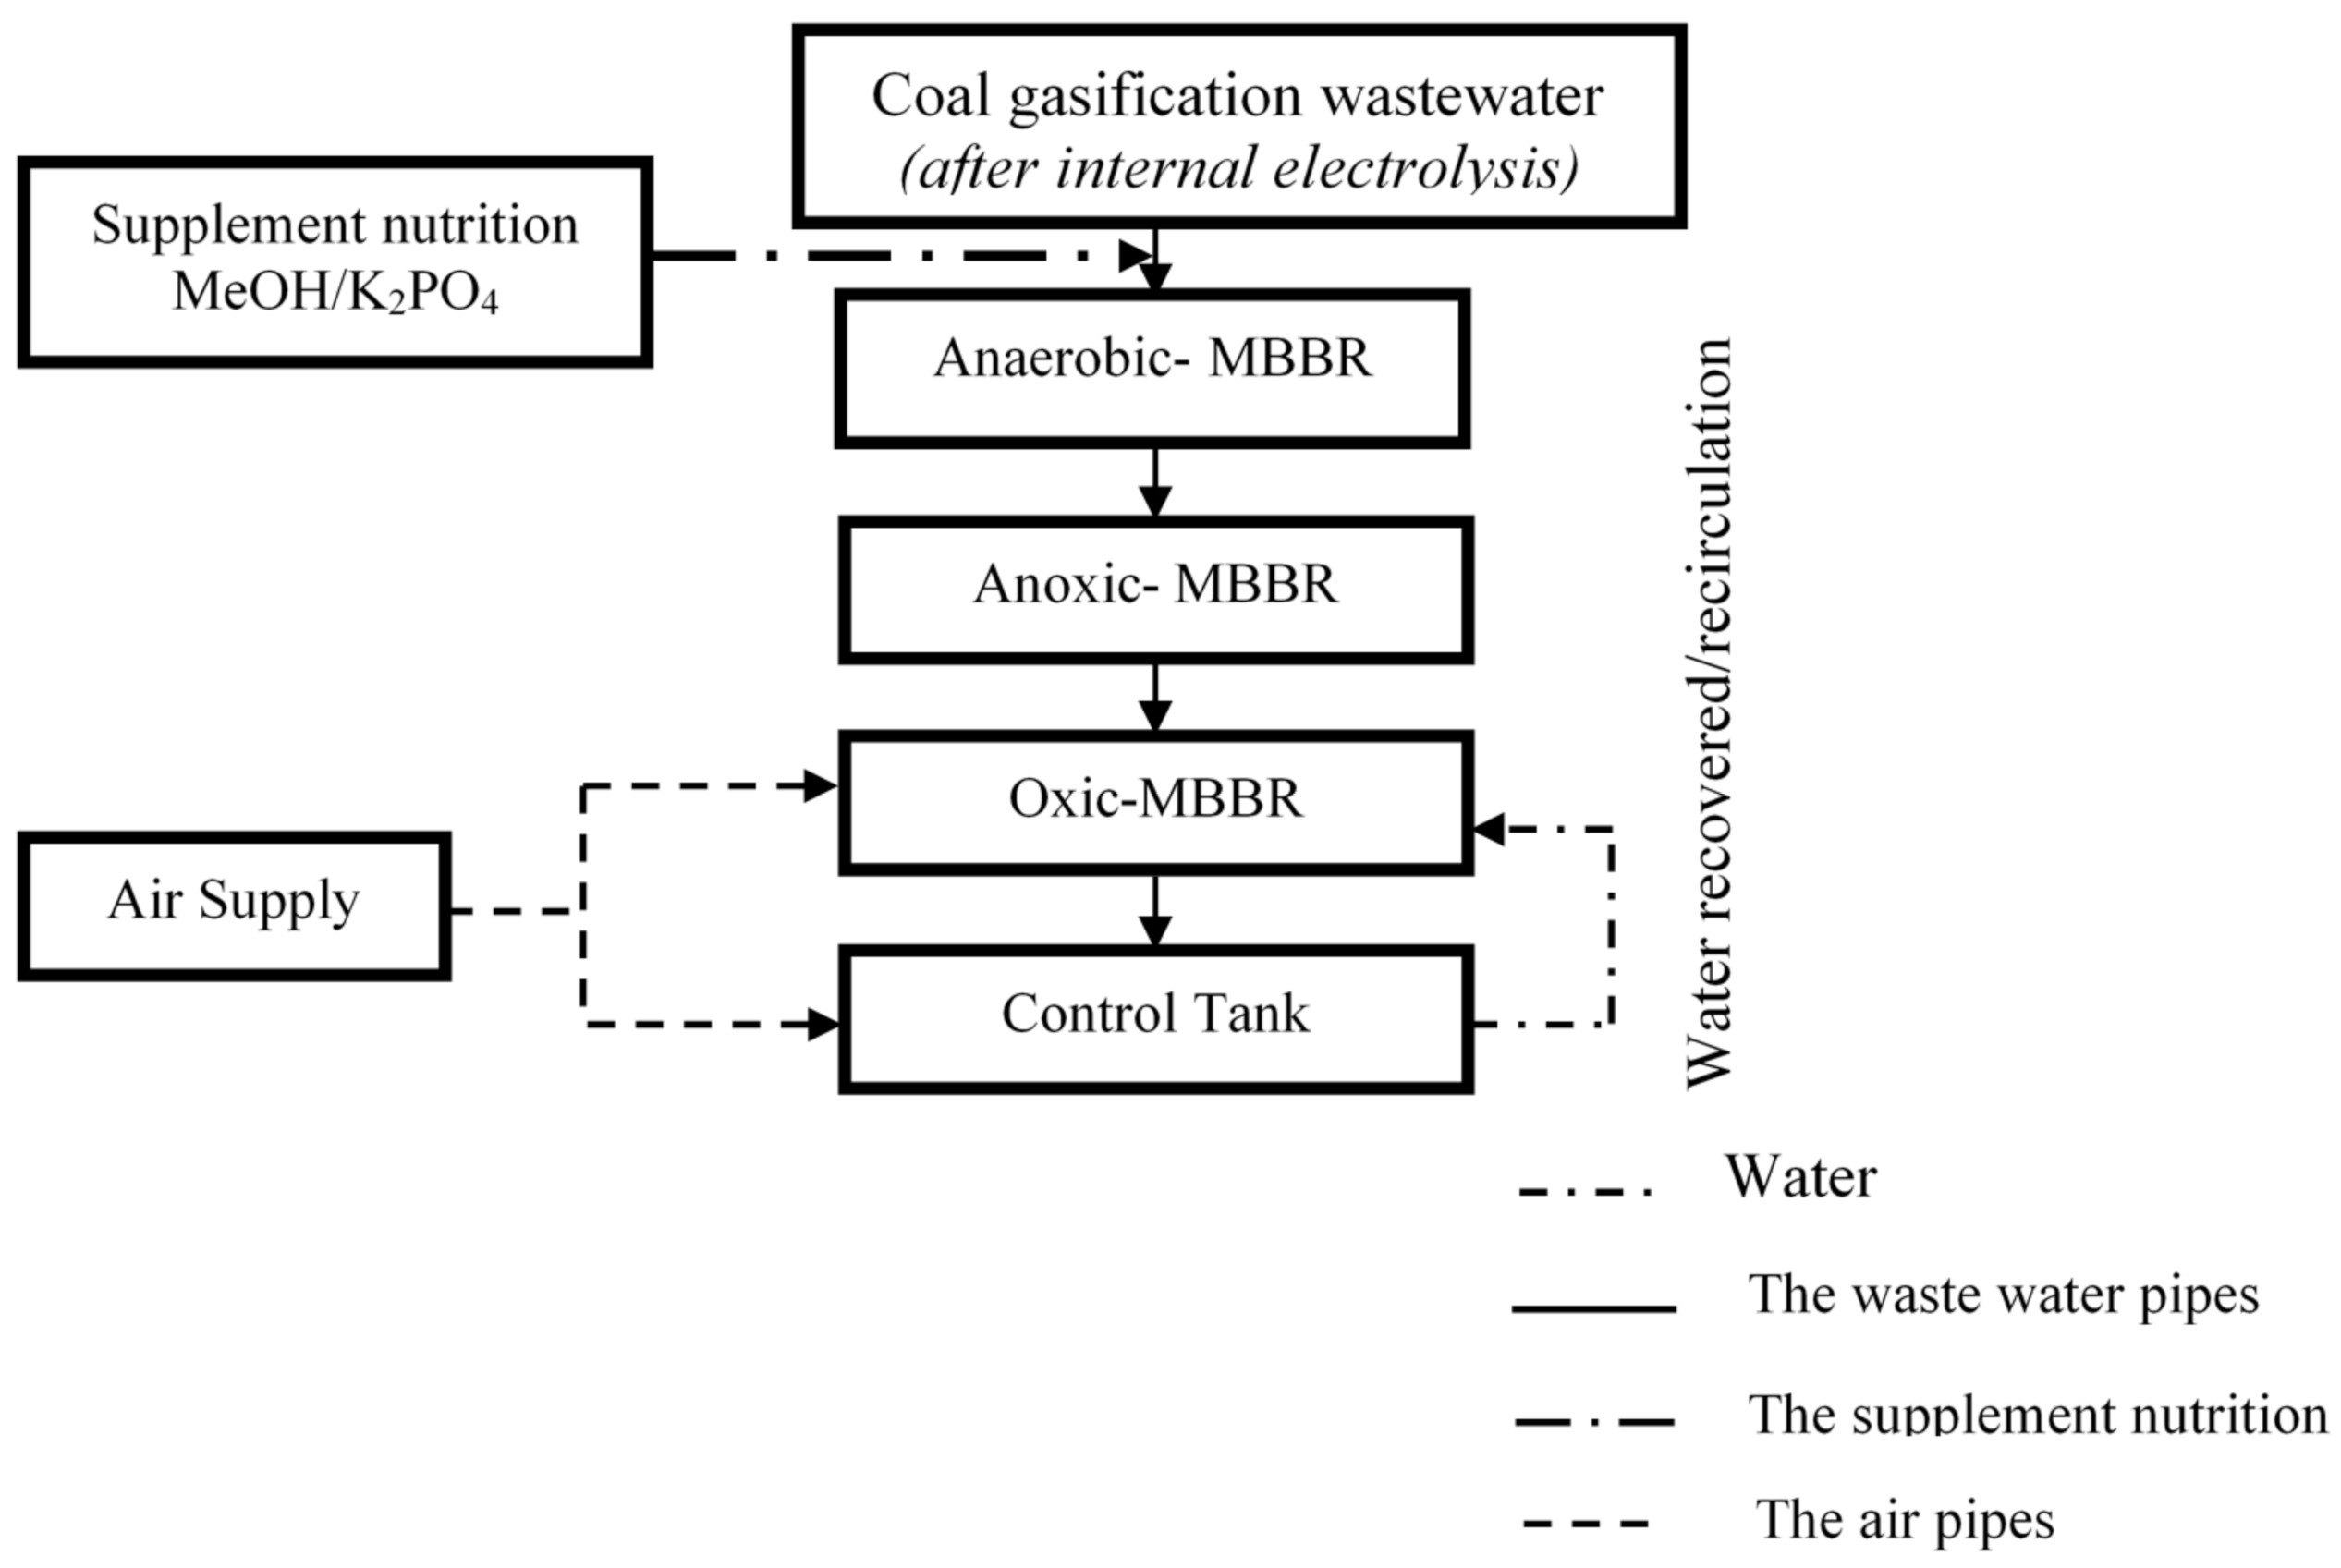
2.2. Establishment of the A2O-MBBR System

2.2.1. Culturing Aerobic Activated Sludge

Activated sludge was taken from the coking plant of Thai Nguyen Iron and Steel Joint Stock Company and was added with isolated bacteria strains with nitrification activities. The sludge was then added with 1 L of electrolytically treated wastewater and supplemented with nutrition resources with the ratio C:N:P = 100:5:1 and 1.0 g of microbiological preparations that are used to treat high ammonium wastewater. Dissolved oxygen content in the aeration tank was 1.5–3.0 mg/L. Air was blown into the tank for 12 h and the tank was allowed to settle for 2 h. Afterwards, clear water was removed, and wastewater and new sources of nutrients were added. This process was repeated several times over a period of 1 week. In the following week, the aeration time was reduced to 6 h. The activated sludge domestication was conducted at room temperature with pH value of 6.5−7.0 and lasted for 2 weeks.

2.2.2. Culturing Anoxic Activated Sludge

Activated sludge was collected from a coking plant at Thai Nguyen Iron and Steel Joint Stock Company. The sludge was added with 1 L of wastewater treated with internal electrolysis and with nutritional supplement to ensure the ratio C:N:P = 150:5:1, followed by addition of 1.0 g of microbiological preparations that are used to treat wastewater with high ammonium content. Dissolved oxygen content in the anoxic tank was from 1.0 to 2.0 mg/L. Culture time was 24 h and the subsequent settle period was 2 h. Clear water was then removed and after that, new wastewater and sources of nutrients were poured into the tank. The activated sludge domestication was conducted at room temperature with pH value of 6.5−7.0 and lasted from 15 to 20 days.

2.2.3. Culturing Oxic Activated Sludge

Activated sludge in the oxic tank was prepared identically to sludge in the anoxic tank except that the sludge domestication lasted 1 month instead of 15−20 days. We isolated bacteria from the tanks to determine bacterial concentration and the growth of microorganisms in the reaction tanks (Figure 1).
Figure 2 depicts the design of the A2O-MBBR system. Each tank has the volume of 3 L and has many different water inlets and outlets to facilitate the experiment and selection of retention time.

2.2.4. Activated Sludge Culture

Aeration in the aeration tank was performed so that dissolved O2 (DO) content ranged from 5 to 8 mg/L. DO in the anoxic tank was maintained in the range of 1−2 mg/L by stirring for 150 min. The length of the stirring paddle was 3 cm. In all tanks, MBBR type biochip was supplemented. Per liter of wastewater, 1 g of growing media was added to the tanks. Table 1 summarizes initial parameters of the system.
After initial parameters had been studied, wastewater pretreated with internal electrolysis (adjusted pH = 7) was then treated using the A2O-MBBR system with following retention time: 24 h in anaerobic, 6 h in anoxic, and 4 h in aerobic tank. The initial and post-treatment phenolic concentrations of coke wastewater were determined on the HPLC Waters ACQUITY Arc instrument at the University of Education—Thai Nguyen University equipped with chromatographic column C18 Inertsil ODS (5 μm, 250 × 3 mm), GL Sciences Inc, Tokyo, Japan. Optimal conditions for the determination of phenol content are as follows: wavelength of 272 nm, ratio of phosphate buffer solution mixture (pH = 4) to acetonitrile solution (pH = 3) of 30:70 (v/v), flow rate of 1.0 mL/min, and column temperature of 30 °C. TSS, BOD5, COD, total N, total P, and NH 4 + -N indicators were determined at Thai Nguyen Center for Natural Resources and Environment Monitoring.

3. Results and Discussion

3.1. Characterization of As-Synthesized Fe-C Material

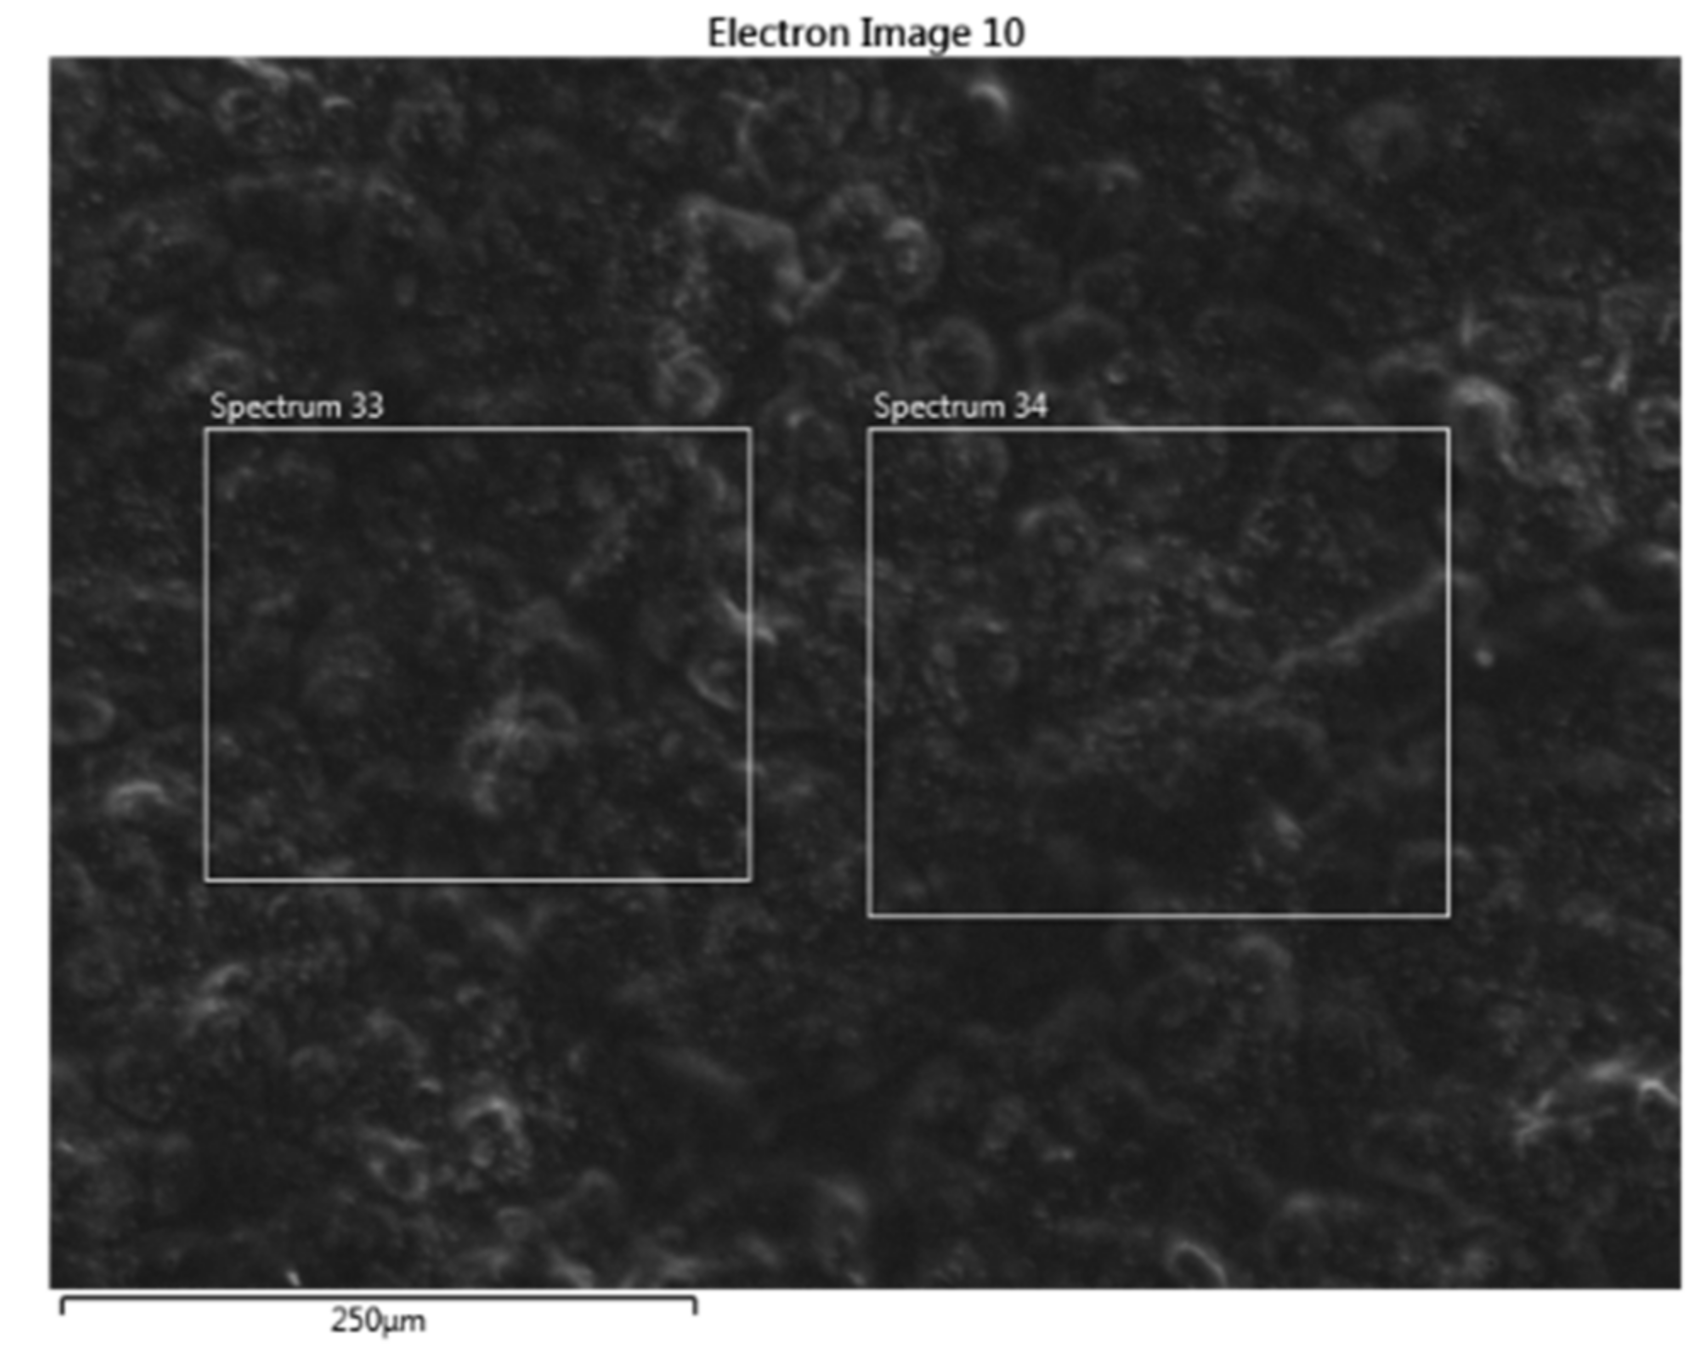
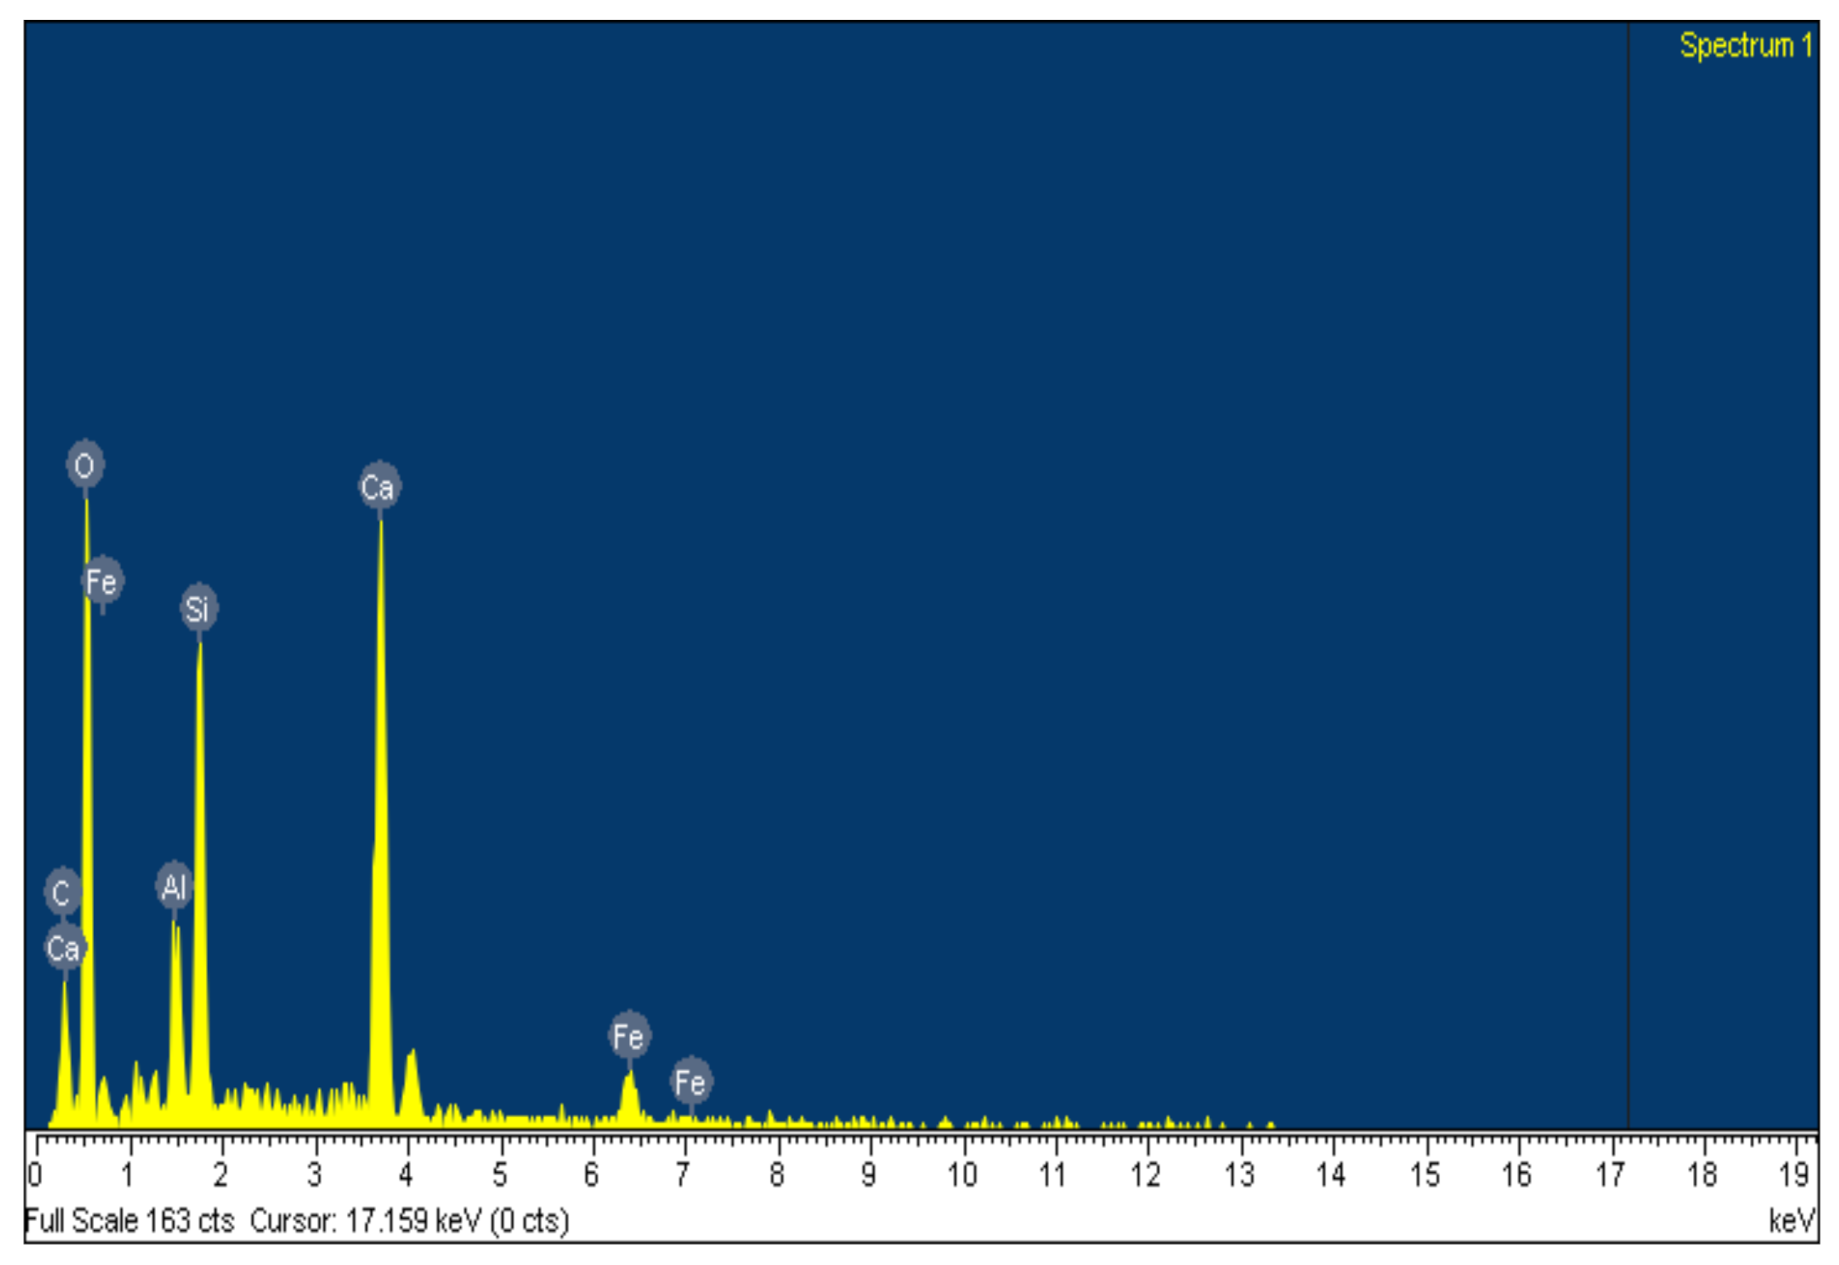
3.1.1. SEM-EDS Analysis of Fe-C

SEM-EDS image analysis results are shown in Figure 3 and Figure 4, and Table 2. SEM image analysis results show that the structure of Fe and C powder particles is distributed relatively evenly on the surface, and they are smaller as 50 µm. EDS analysis results (Table 2) show that the main elements are Fe, C, and O, and in addition, some other impurity elements such as Si, Al, and Ca are present. The occurrence of O in the analytical results shows that during the preservation of the sample, it is much oxidized on the surface. Other impurity elements (Si, Al, and Ca) appear due to the bentonite binder.

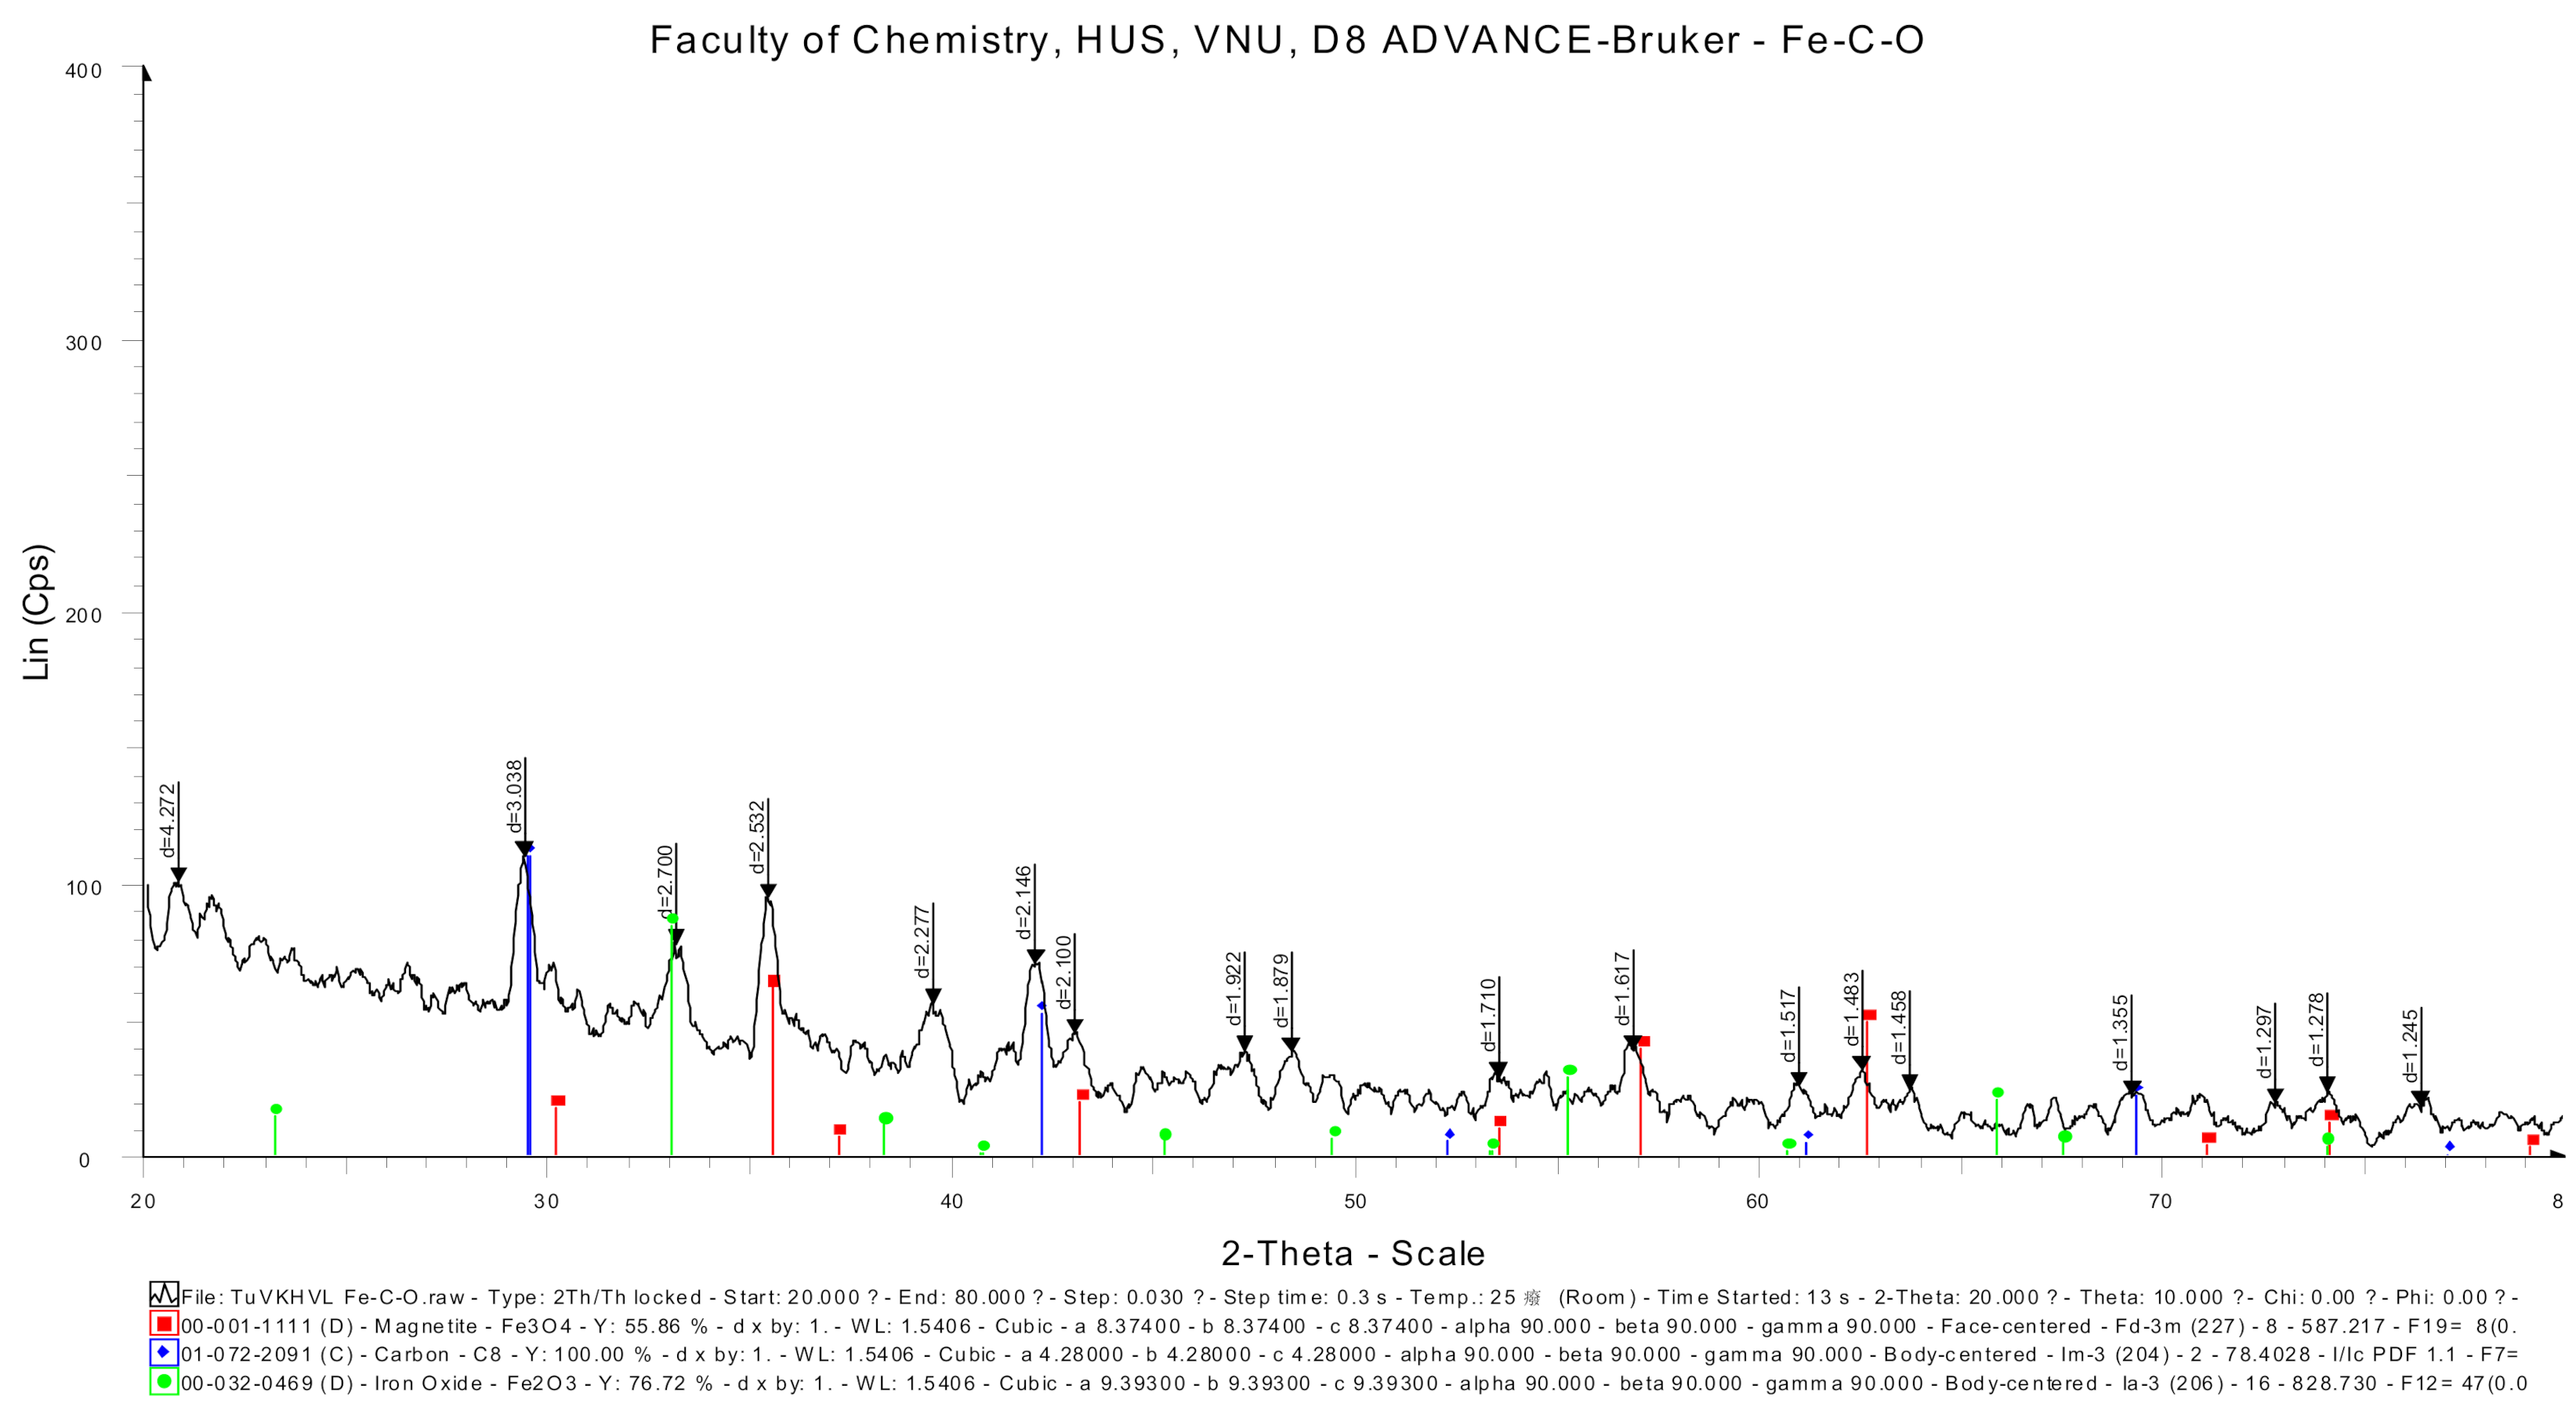
3.1.2. XRD Analysis of Fe-C

The results of XRD analysis (Figure 5) showed that Fe in the Fe-C sample was oxidized, there appeared structures of Fe3O4 and Fe2O3 on the surface of the material. It is possible to see the peaks of these oxides corresponding to the peaks at 45.5°, of Fe3O4 at 63°, of Fe2O3 at 36°, and of Fe appears at lower intensity at 34.5°.

3.2. Wastewater Treatment Using Fe-C Internal Electrolysis Material

Figure 6 and Figure 7 show the HPLC phenol analysis results of the coking wastewater before and after internal electrolysis treatment, respectively. Internal electrolysis was carried out with following conditions: initial phenol concentration of 172.0 mg/L, 25 g/L of Fe-C internal electrolyte material, 720 min of shaking time, pH = 4, and shaking speed of 200 rpm. The HPLC analysis showed that the initial phenol content had degraded by 73.3% after internal electrolysis treatment (Table 3).
The results showed that Fe-C internal electrolysis materials had decomposed 73.32% of phenol, 51.02% of TSS, 56.70% of BOD5, 53.74% of COD, 34.98% of total nitrogen, 47.20% of total phosphorus, and 60.10% of NH4+-N.
The mechanism of phenol degradation in the internal electrolysis process with Fe-C material has been presented previously [6]. Accordingly, the decomposed phenol is converted to a less toxic intermediate compound. The mechanism suggests that the transformation of toxic organic compounds into biodegradable intermediates is caused by the microelectrolysis, which produces radicals and oxidants to destroy benzene rings and chemical bonds situating at side chains [20]. On the other hand, based on the formation of an electric field that induces microelectron currents in the galvanic cell reaction, electron transfer effectively stimulates the growth of microorganisms and active metabolic enzymes and moreover, promotes the biodegradation of microorganisms [21]. Furthermore, iron–carbon microelectrolysis is also capable of efficiently degrading refractory compounds and producing output with great biodegradability, which greatly facilitates the subsequent biological treatment [22].

3.3. Wastewater Treatment Using A2O-MBBR System

Wastewater, after being treated by the internal electrolysis process, was further treated by A2O-MBBR with operating parameters as in Table 1. The MBBR dynamic biofilm where bacterial biomass grows on its surface played the key role in filtering particles from the inlet wastewater, thus reducing organic matter and leading to BOD5 removal or nitrification. In this experiment, MBBR biofilm with area of 1000 m2/g was used with the dosage of 2 g/L. Organic carbon was converted to carbon dioxide and leaves the system, whereas ammonia and nitrogen in organic matter were converted to nitrates through nitrification.

3.3.1. pH Change in the A2O-MBBR System

Changes in pH in the A2O-MBBR system reflect the metabolic capacity of the microorganism, the efficiency of pollutant consumption, the development, and the existence of specific microorganisms in reaction tanks [7,15,18,20]. The retention times in anaerobic, anaerobic, and aerobic treatment were 14, 6, and 4 h, respectively. DO ranges in the three processes were 0.1–0.2, 1−2, and 5–8 mg/L, respectively.
Wastewater treated with internal electrolysis had its pH adjusted to 8 before being supplied to A2O-MBBR system. After 24 h of anaerobic treatment in the tank, measured pH was around 6.2–6.5, indicating that organic acids were produced and confirming the occurrence of anaerobic fermentation. In anoxic and aerobic tank, the pH was higher, ranging from around 6.5 to 7.2, especially in tanks with aeration. This indicates the presence of the heterotrophic processes, which enhanced nitrification and antinitrification.

3.3.2. TSS Change in A2O-MBBR System

Figure 8 shows results of TSS of wastewater after various treatment processes. Treatment using sole A2O-MBBR system reduced the TSS of wastewater from the initial TSS of 145.2 to 40.3 mg/L (efficiency 72.2%). Combining internal electrolysis with A2O-MBBR gave similar reduction, reaching the minimum TSS of 41.6 mg/L with the efficiency of 71.3%. All TSS results meet QCVN 52:2017/BTNMT standard (column A) for steel industry wastewater [23].

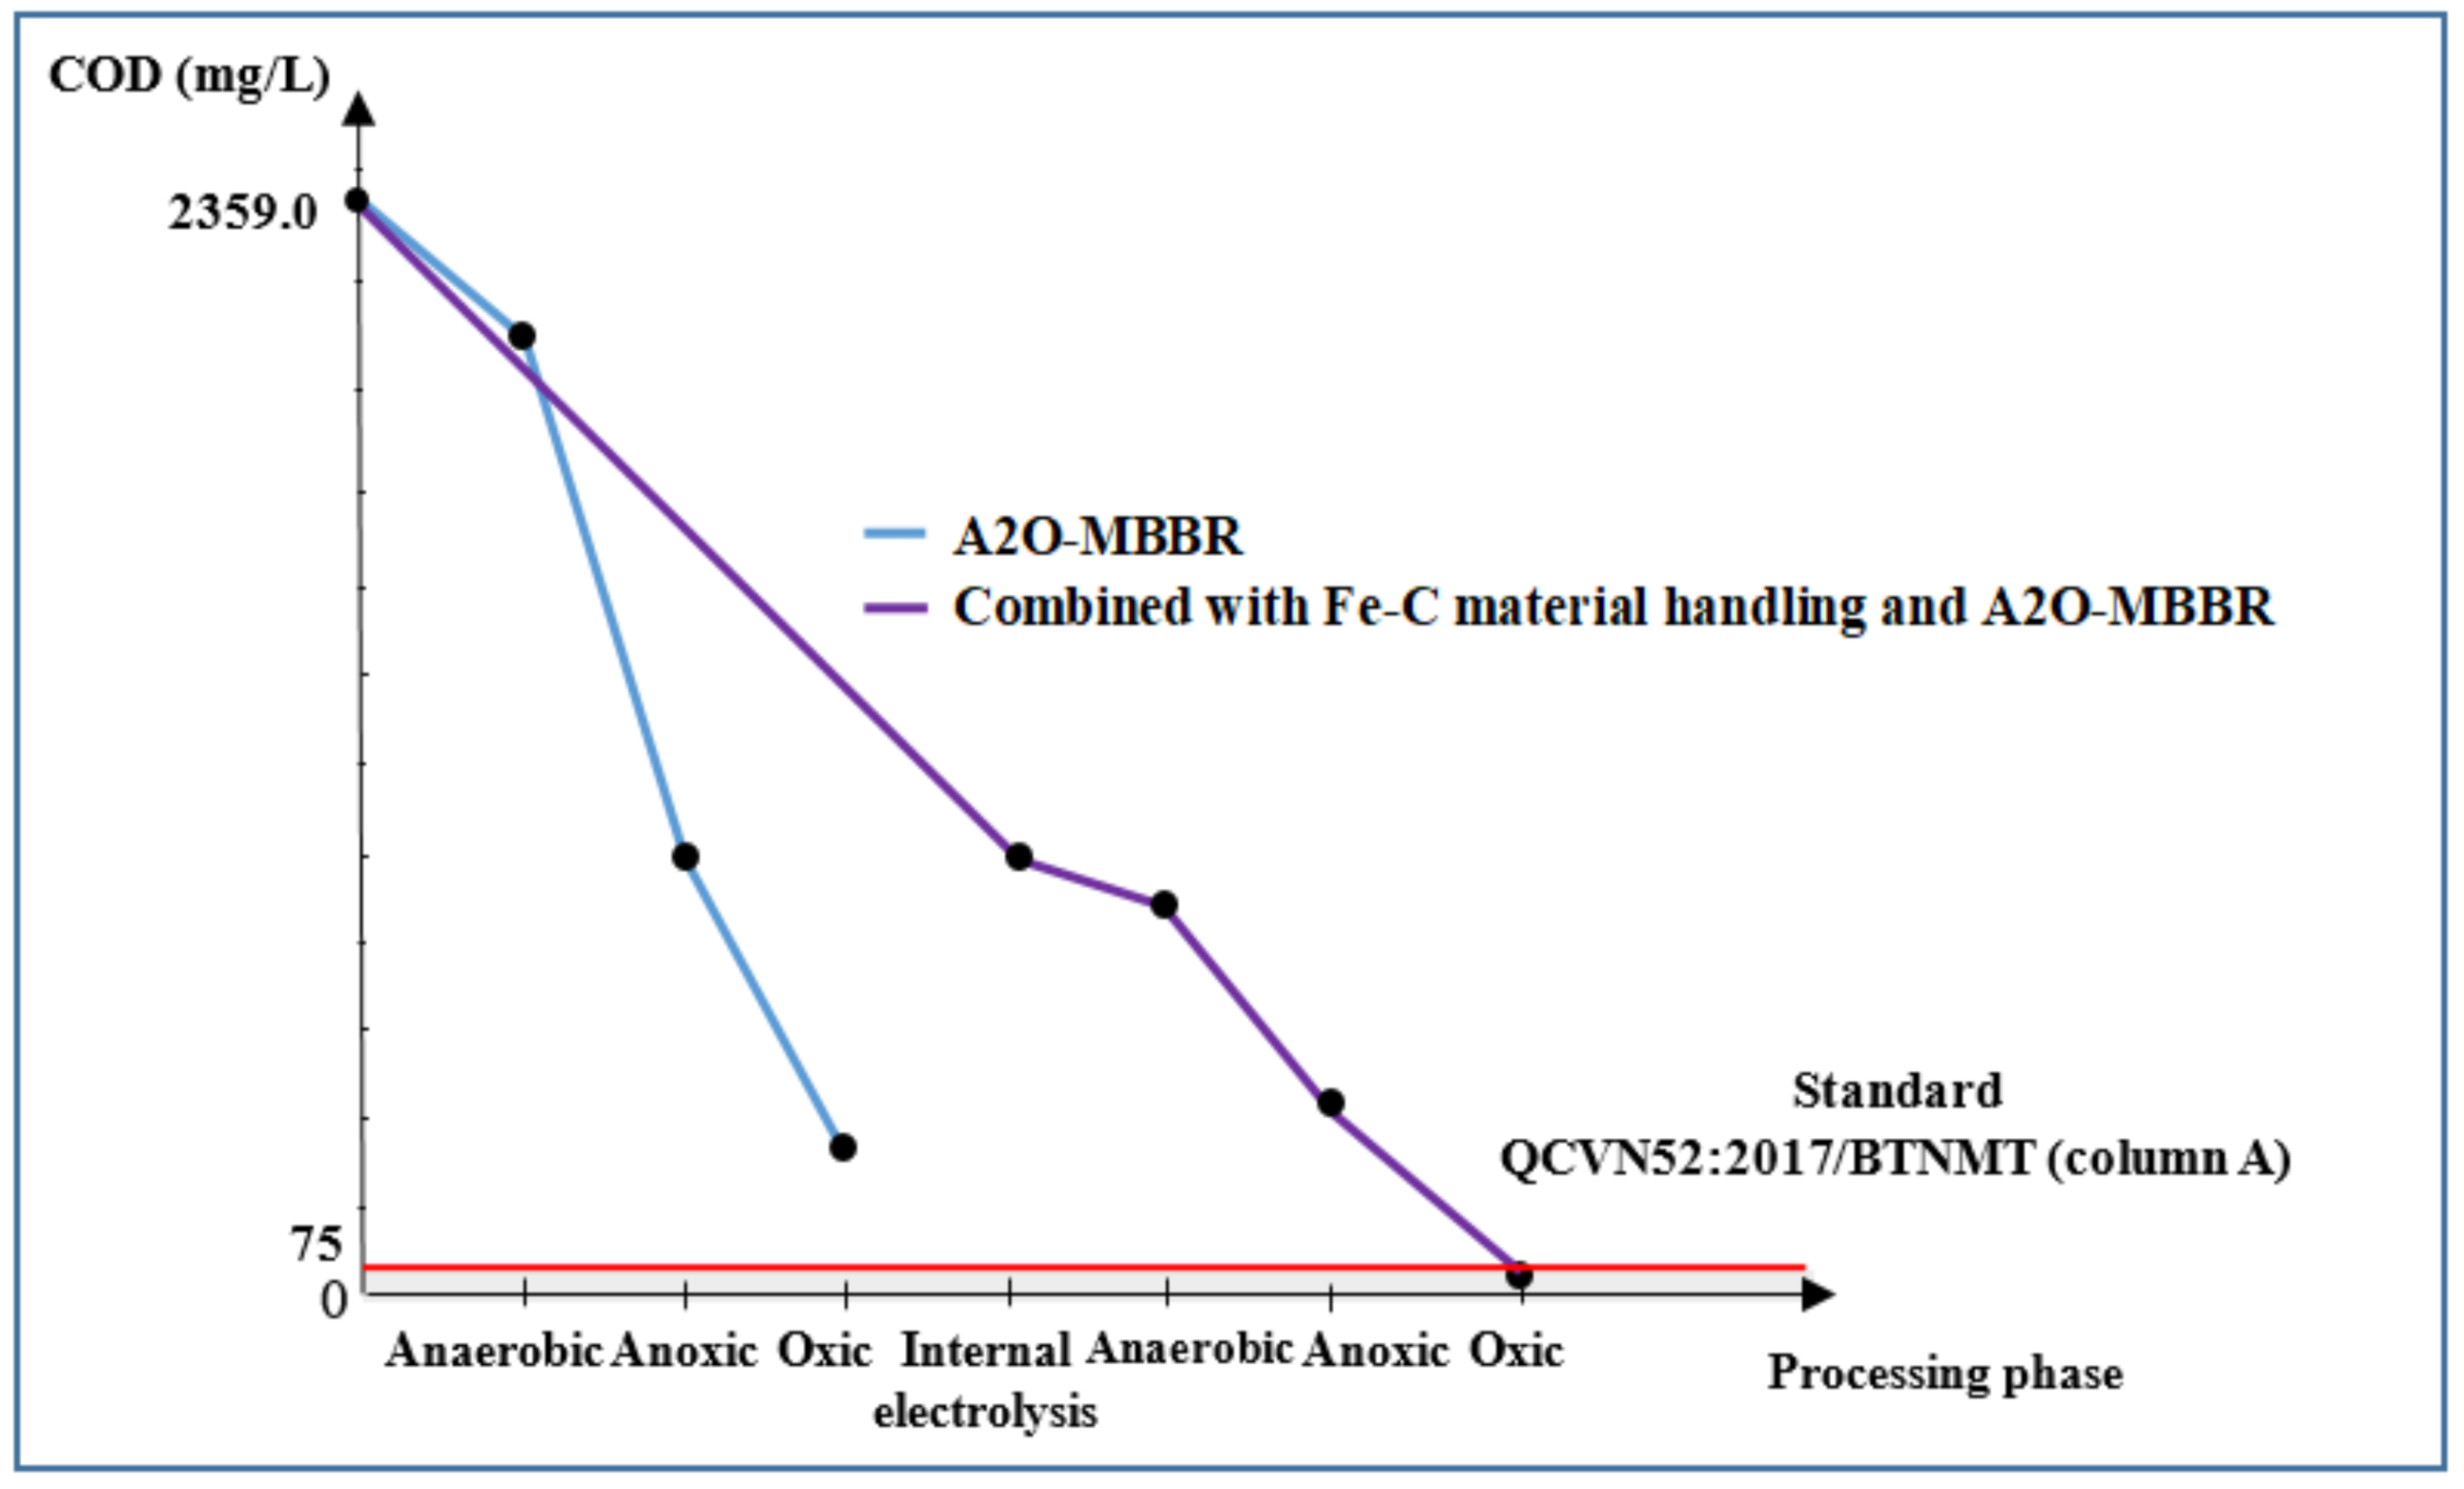
3.3.3. COD and BOD5 of Wastewater Treated Using Internal Electrolysis and A2O-MBBR System
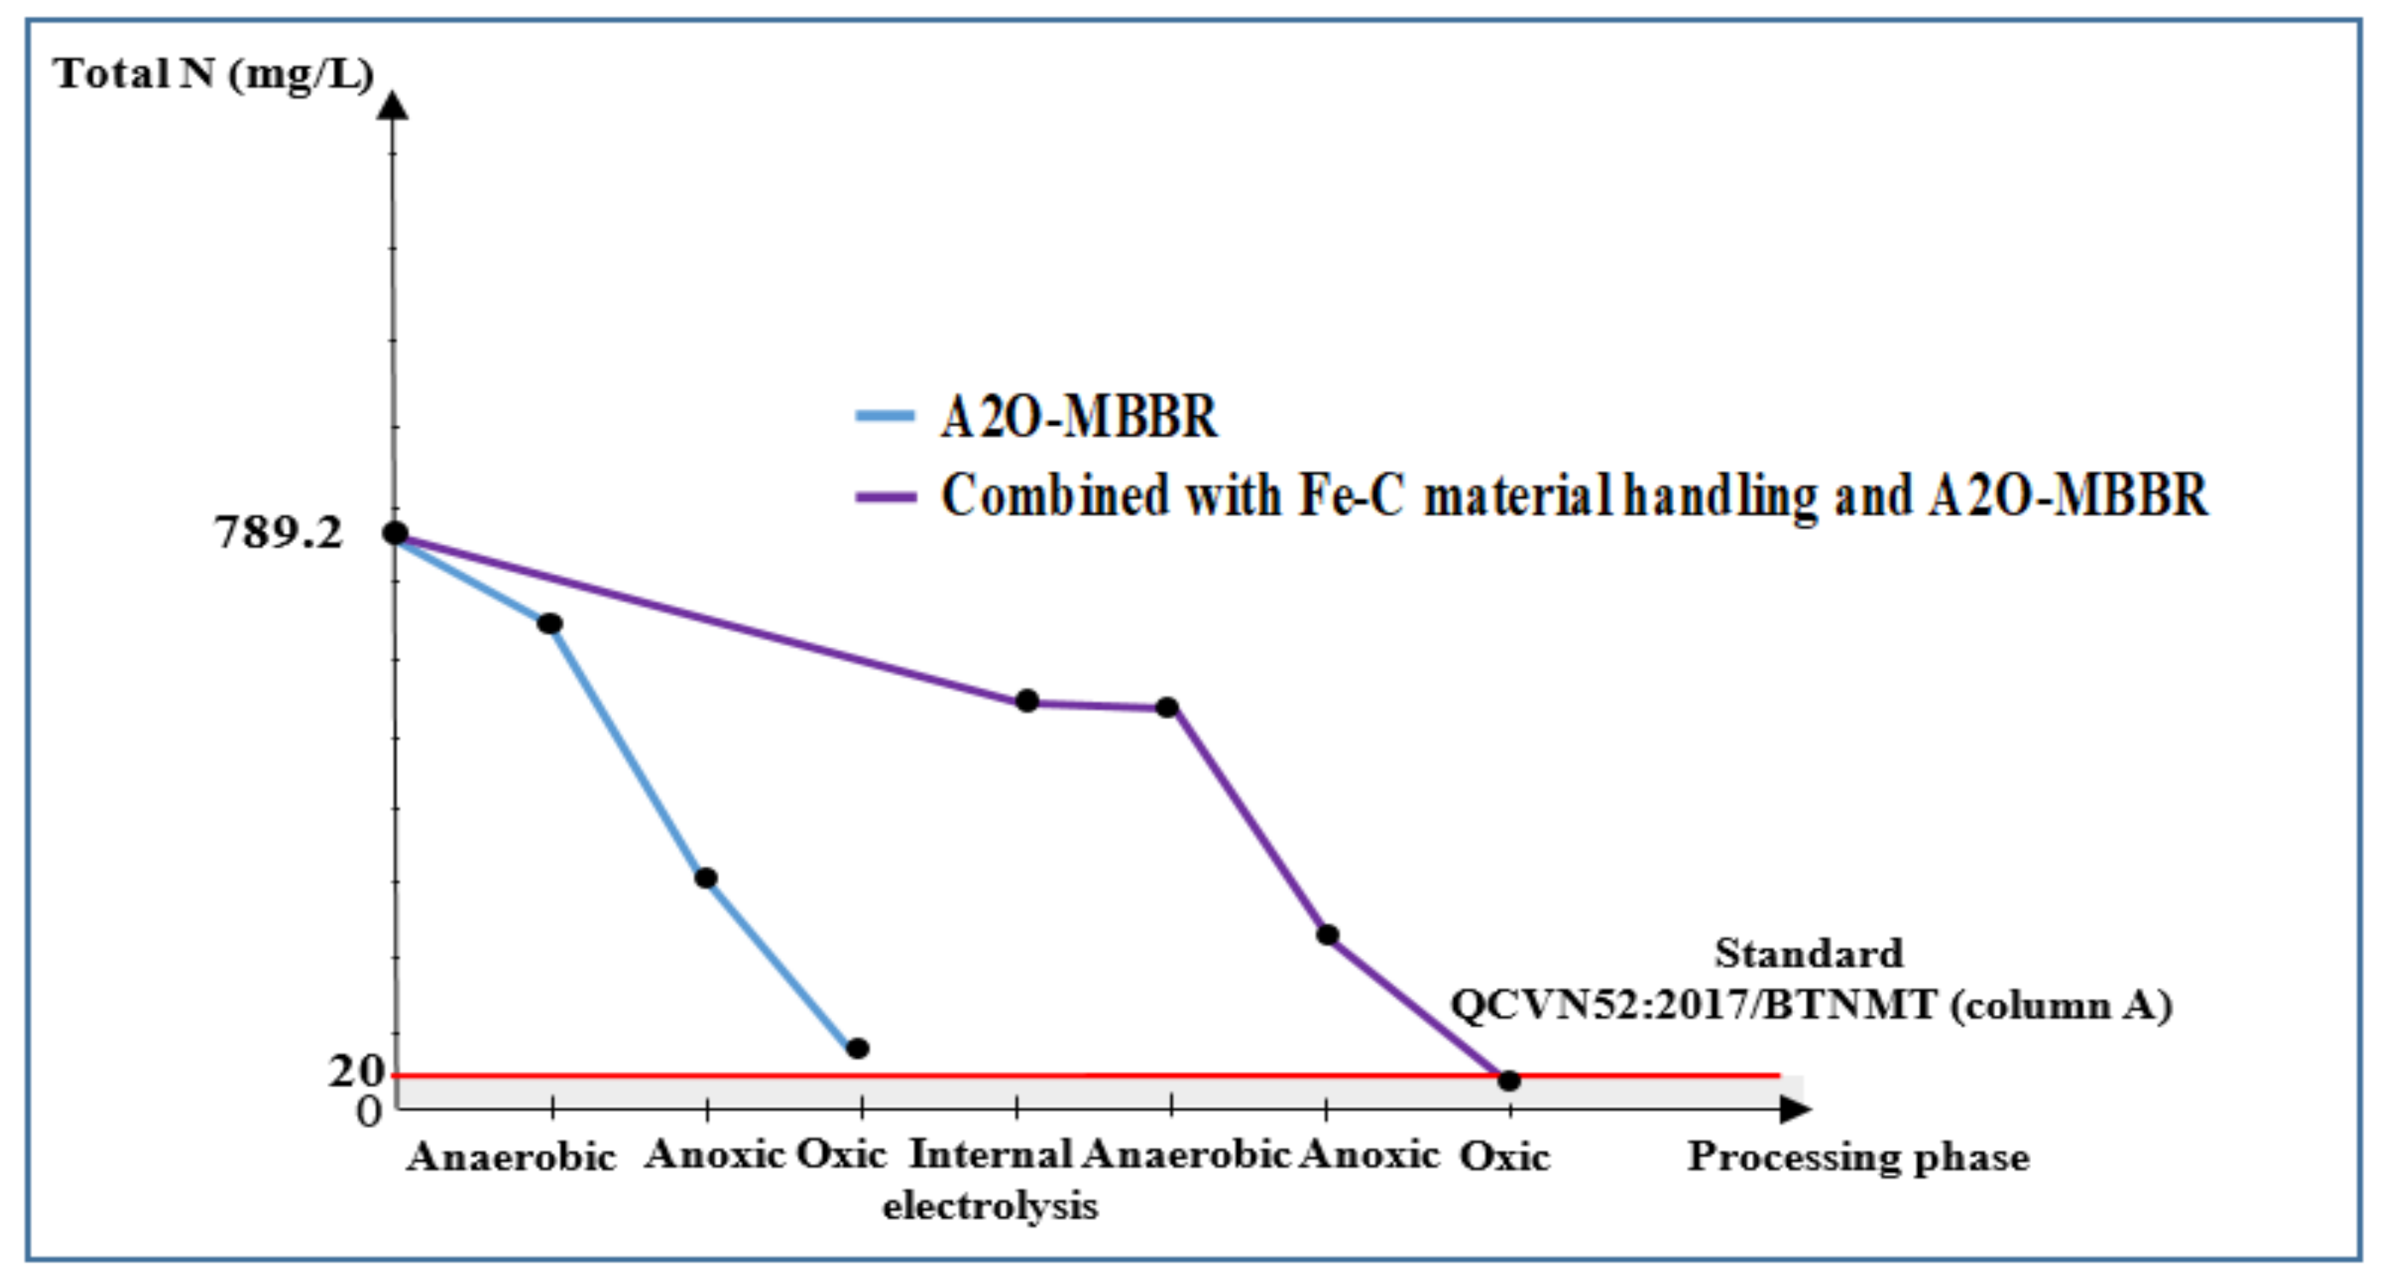
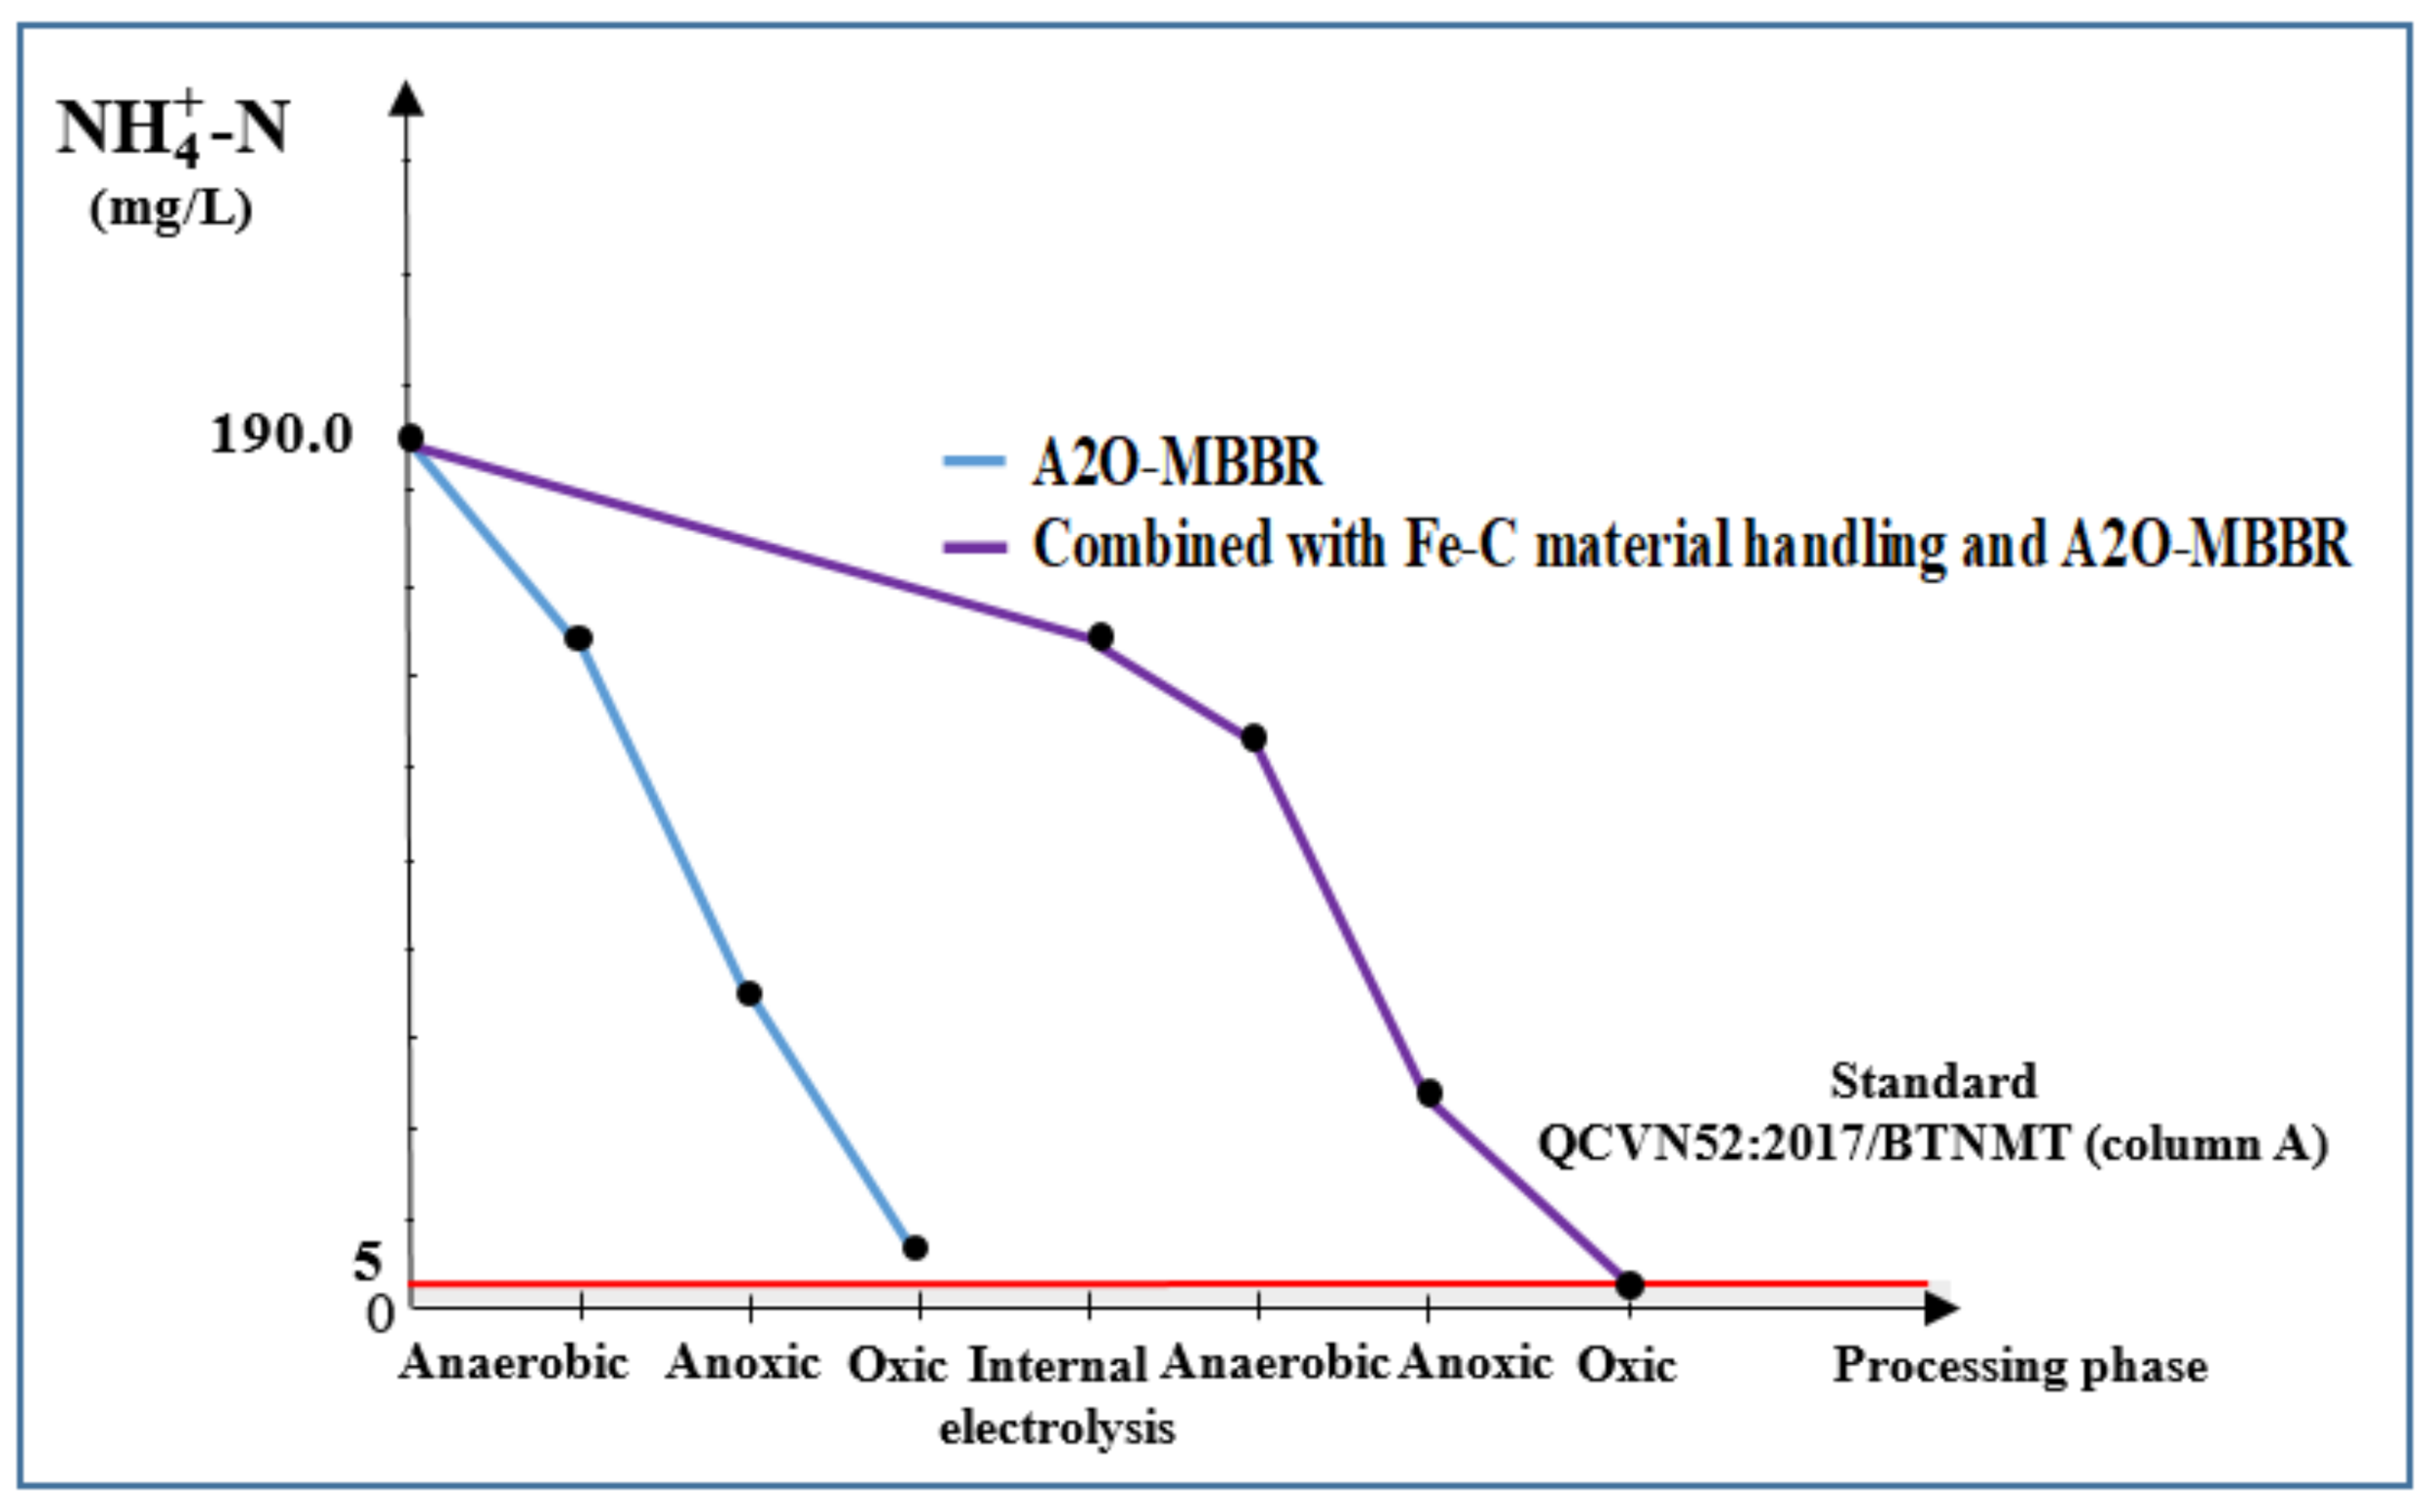
Figure 9 and Figure 10, respectively, illustrate COD and BOD5 of the wastewater during treatment processes. Largest reduction in COD could be observed to occur in aeration tanks. It is indicated that a large quantity of organic matter has been consumed by the process and that final COD and BOD5 of wastewater treated with the combinational process met the QCVN52:2017/BTNMT standard (column A).
The electrolysis process using Fe-C materials resulted in COD and BOD5 treatment efficiency of 53.7% and 56.7%, reaching the COD and BOD5 of 1032.0 and 498.0 mg/L, respectively. These values do not meet QCVN 52:2017/BTNMT standard (column A) for steel manufacturing industrial wastewater. On the other hand, the A2O-MBBR system seemed to be capable of removing COD and BOD5 at high efficiency. To be specific, after the input wastewater having COD and BOD5 of 2359.0 and 1105.0 mg/L, respectively, had been treated with A2O-MBBR system, the metrics were reduced to 378.7 and 68.7 mg/L, which are 83.9% and 93.8% reduction, respectively. However, these results still do not meet the standard. When combining electrolysis with Fe-C material and the subsequent A2O-MBBR system, the output water had the COD and BOD5 decreased significantly to 67.3 and 25.7 mg/L, respectively. This corresponds to treatment efficiency of 97.1% and 97.7% and met the QCVN 52:2017/BTNMT standard (column A) for steel production industrial wastewater.

3.3.4. Total N and NH 4 + -N of Wastewater Treated Using Internal Electrolysis and A2O-MBBR System

Total treatment efficiency of N and NH 4 + -N is shown in as Figure 11 and Figure 12.
Internal electrolysis using Fe-C materials gave total N and NH 4 + -N treatment efficiency of 35.0% and 60.1%, respectively, corresponding to the remaining total content of N of 562.4 mg/L and NH 4 + -N content of 156.0 mg/L. These values do not meet QCVN 52:2017/BTNMT (column A) standards for steel manufacturing industrial wastewater. For the A2O-MBBR system, ammonium removal in the early operation days was low because the microbiota was not stable when exposed to new wastewater and the quantity of nitrate/antinitrifying and nitrite/antinitrite bacteria was not sufficiently high. During the operation period of 30−45 days, after the A2O-MBBR system had established sufficient initial parameters (Table 1), total N and NH 4 + -N treatment efficiency reached 89.6% and 91.9%, respectively, corresponding to the remaining total content of N of 81.9 mg/L and NH 4 + -N content of 15.3 mg/L. These values do not meet QCVN 52:2017/BTNMT (column A) standards for steel manufacturing industrial wastewater. However, the use of combinational process in which internal electrolysis precedes A2O-MBBR system gave total N and NH 4 + -N treatment efficiency of 97.6% and 97.5%, respectively. The final N was 19.1 mg/L and NH 4 + -N content was 4.7 mg/L. These results satisfy QCVN 52:2017/BTNMT (column A) standards for steel industry wastewater.

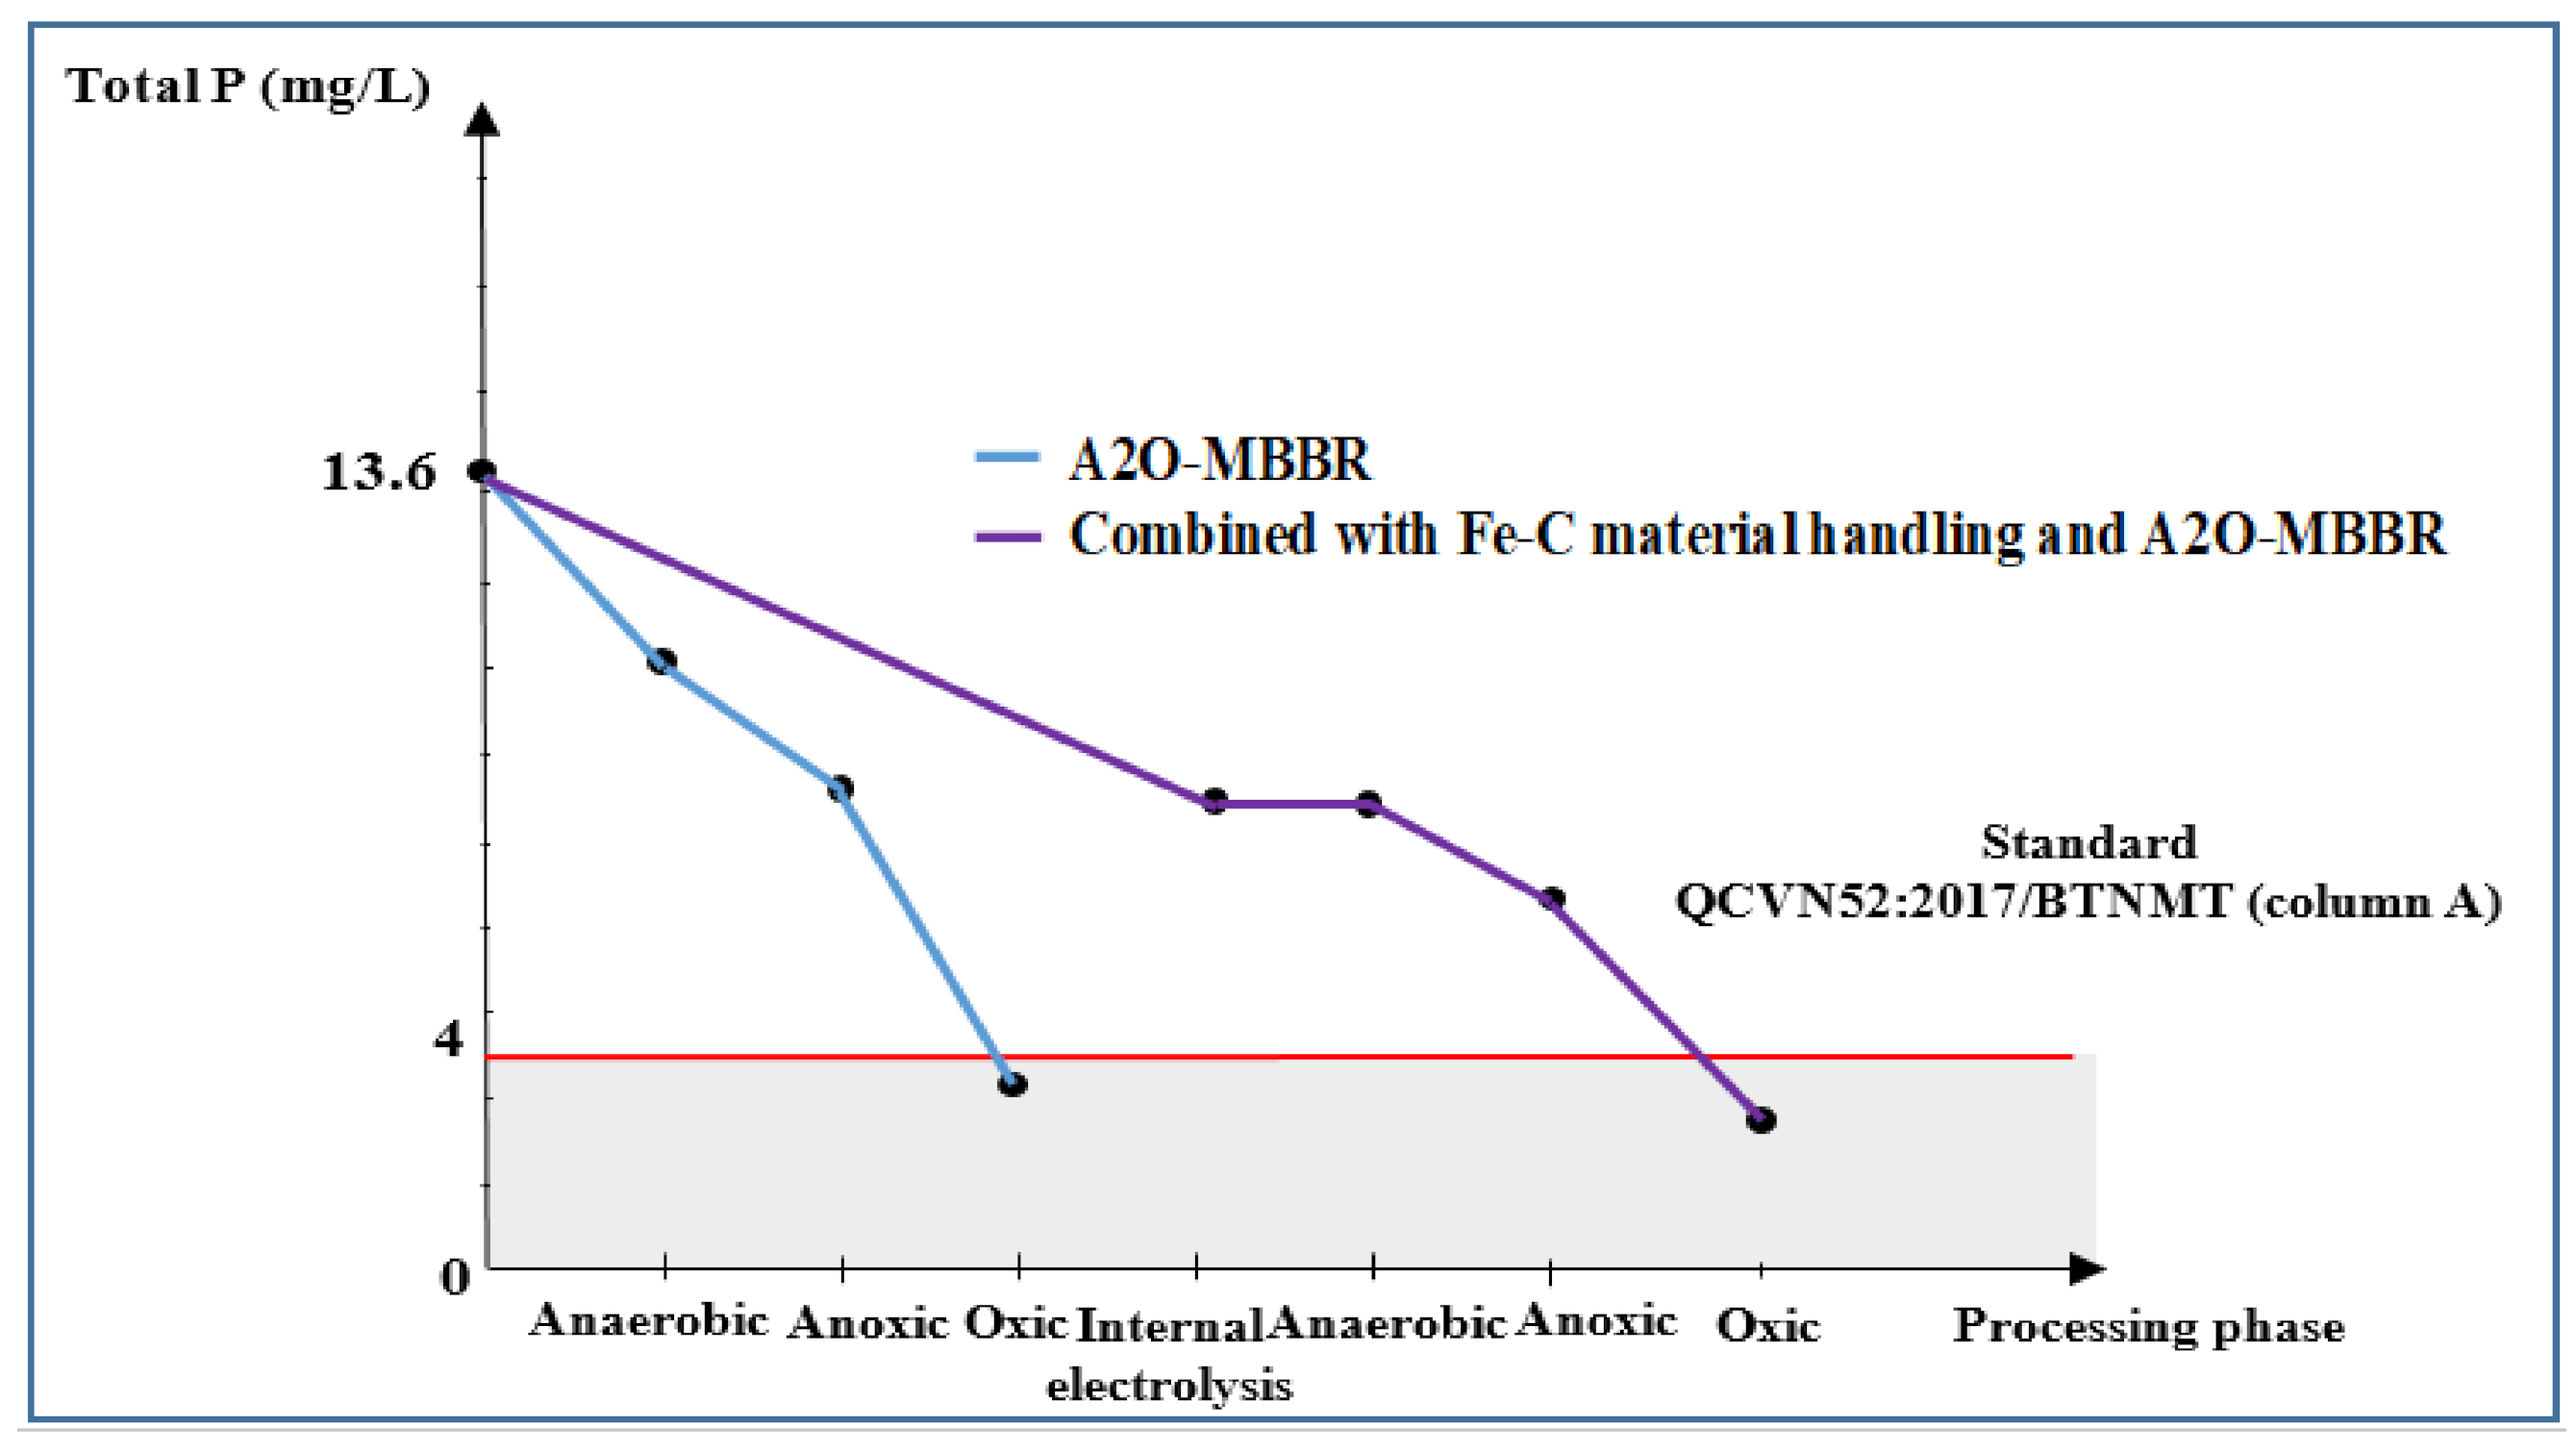
3.3.5. Total P of Wastewater Treated Using Internal Electrolysis and A2O-MBBR System

Phosphorus exists in water in the form of H2P O 4 - , HP O 4 2 - , P O 4 3 - , polyphosphates, Na3(PO3)6, and organic phosphorus. This is one of the sources of nutrients for aquatic plants and a factor for pollution and promotion of eutrophication in water bodies. Excess P content in wastewater causes large algae and aquatic plants to grow rapidly, covering the surface of the water bodies, limiting the amount of dissolved air oxygen into the water. Moreover, the decomposition of dead algae and aquatic plants might also reduce dissolved oxygen, in turn, killing marine animals. Therefore, the total P is an important indicator in assessing wastewater pollution, and the removal efficiency of P is an essential measure in any wastewater treatment process.
With internal electrolysis using Fe-C, P removal efficiency reached 47.2%, resulting in total remaining P of 8.5 mg/L (Figure 13), which is unsatisfactory according to QCVN 52:2017/BTNMT (column A) standards for steel industry wastewater. On the contrary, both A2O-MBBR system and the combinational process gave very high treatment efficiency of total P, achieving the total P of 3.0 (77.9% efficiency) and 1.8 mg/L (81.6% efficiency). Those values met QCVN 52:2017/BTNMT (column A) standards for steel industry wastewater.

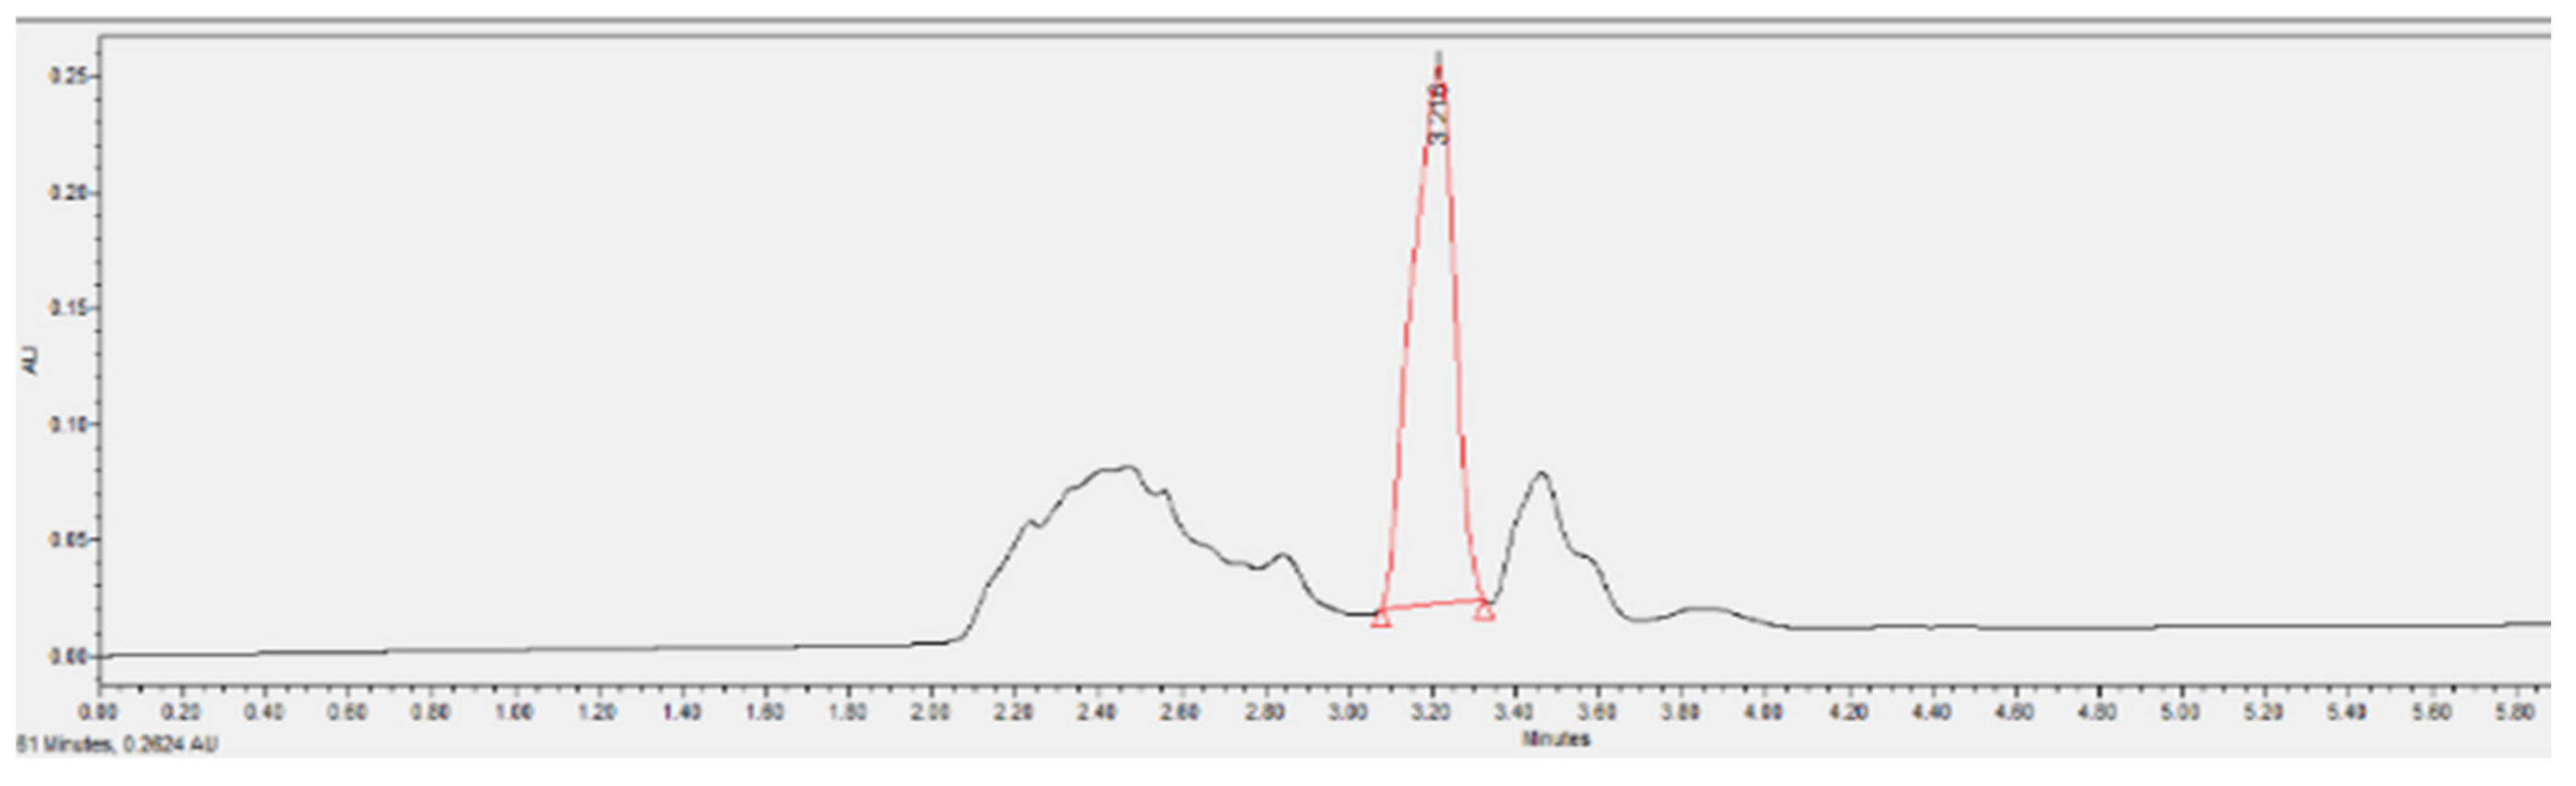
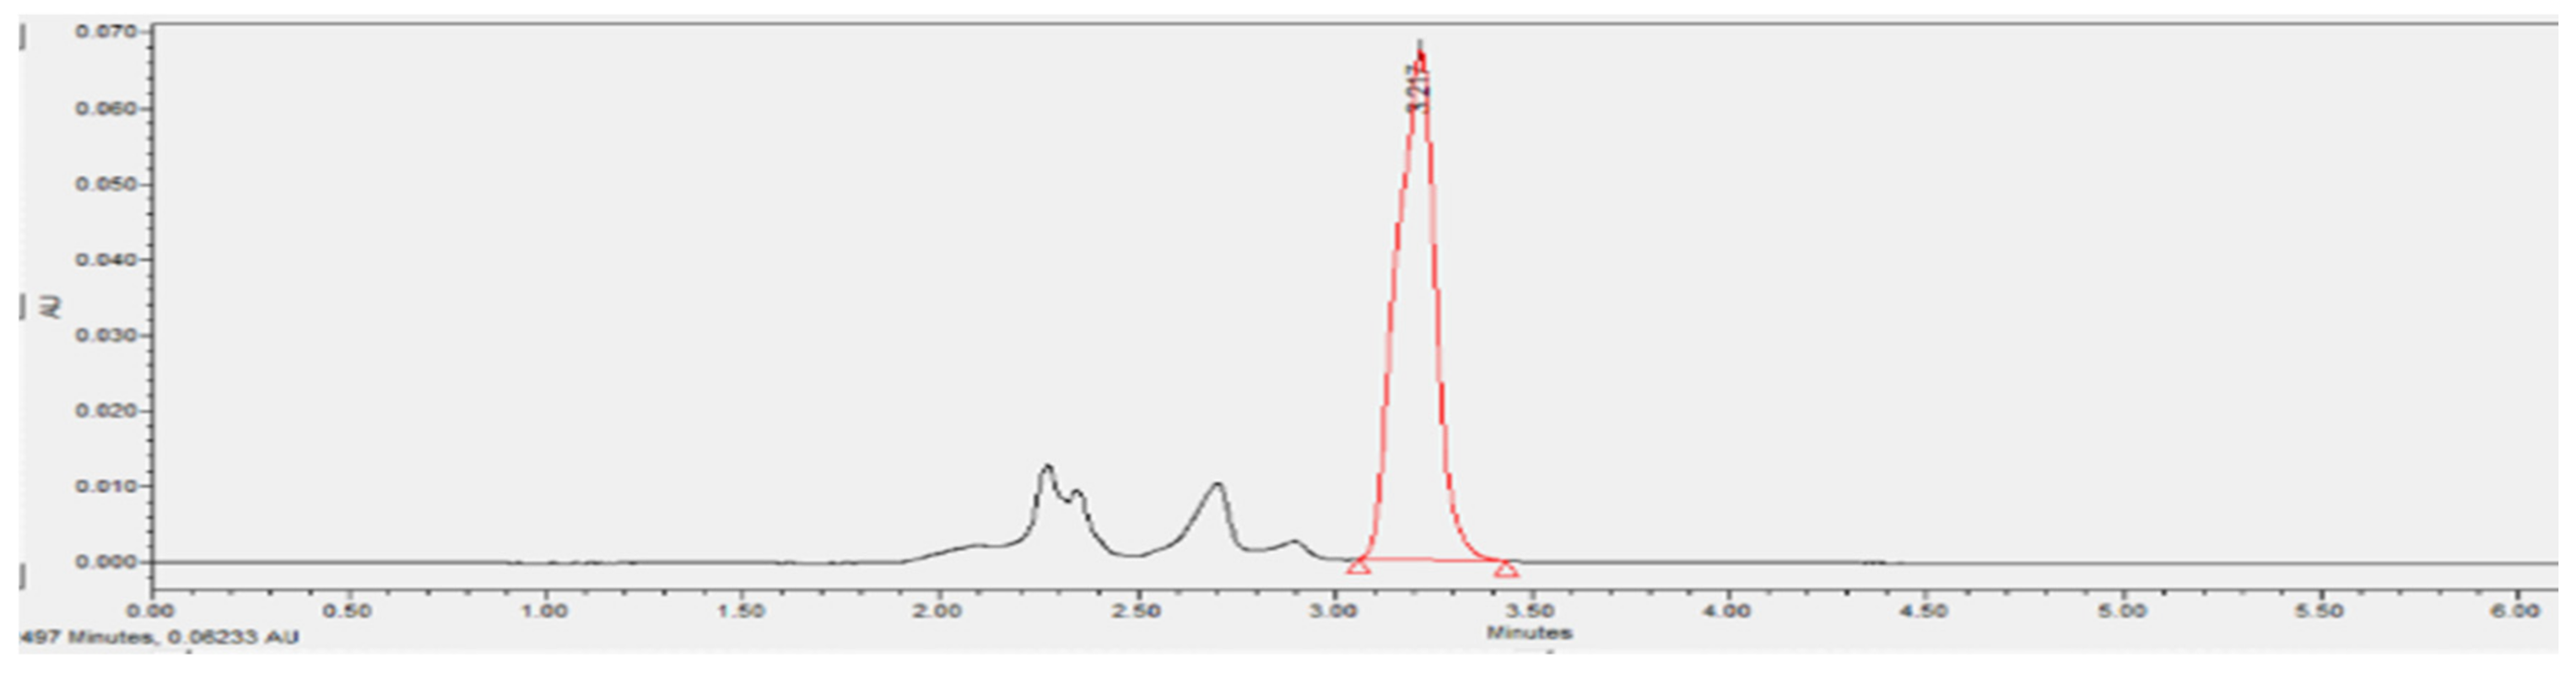
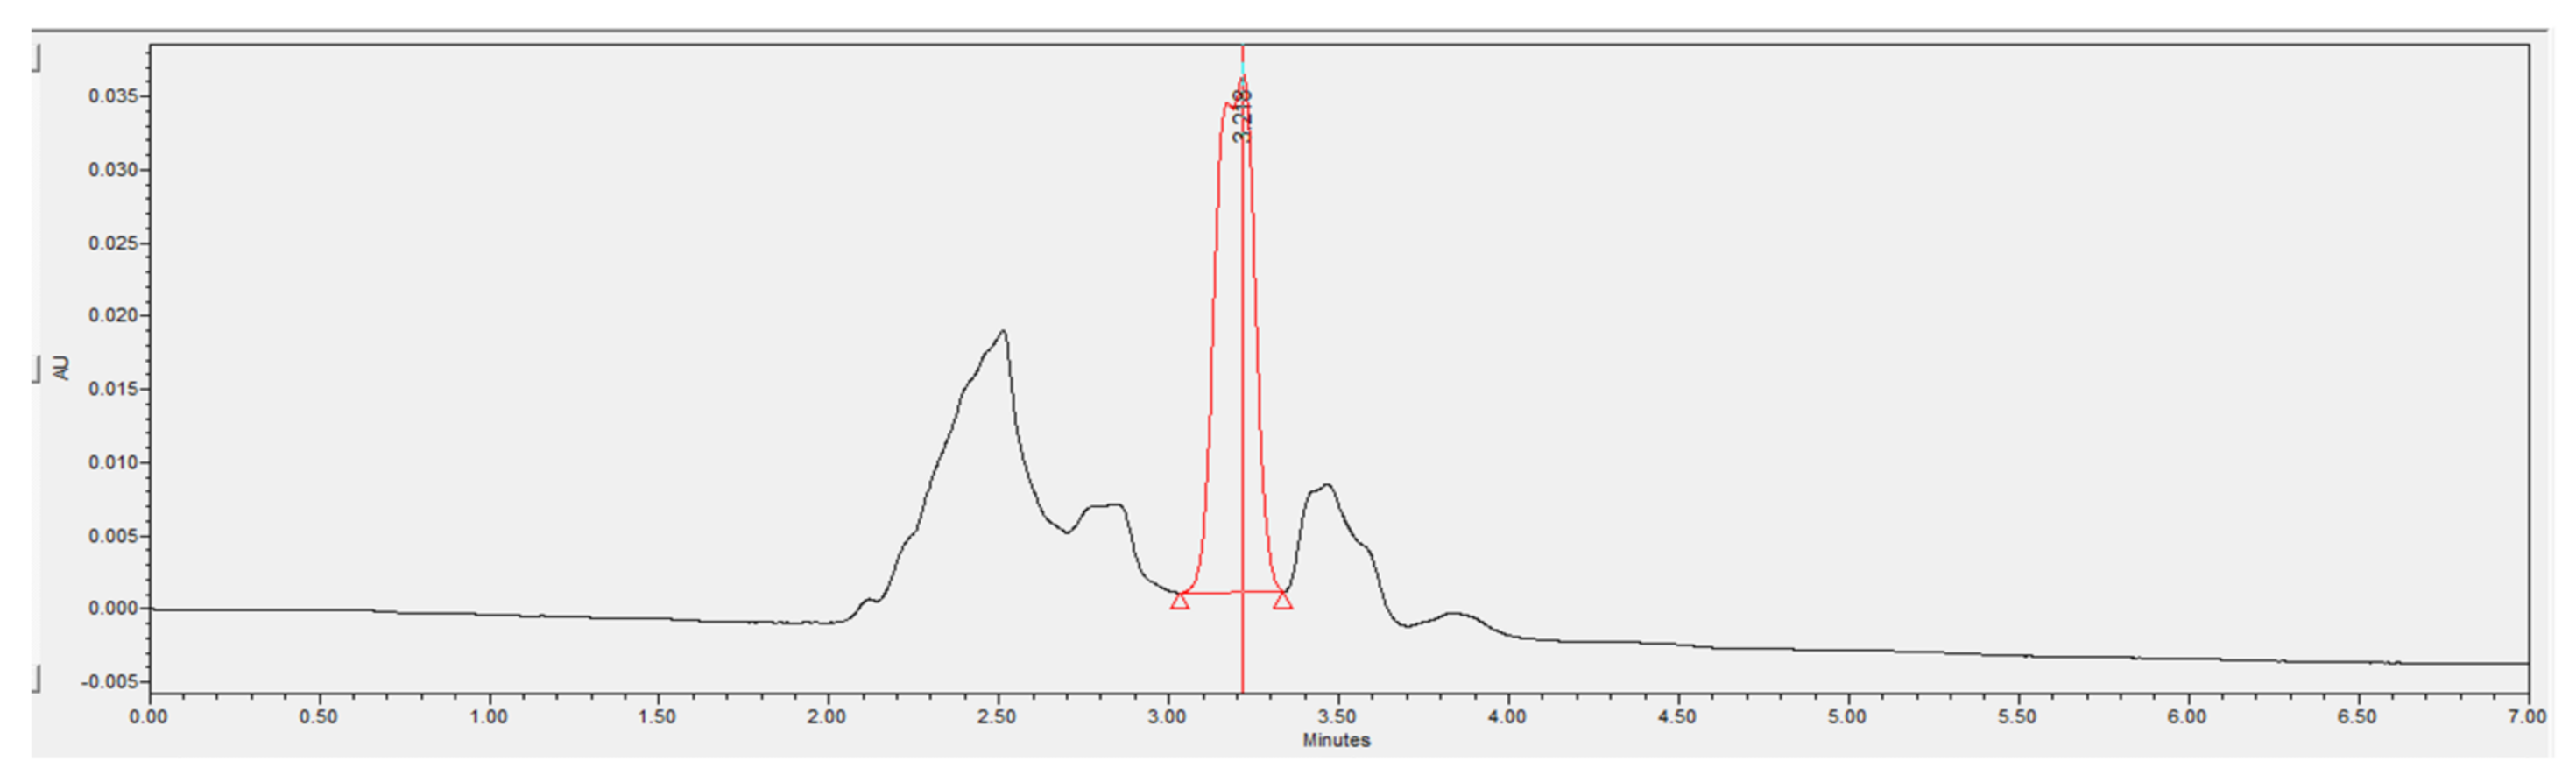
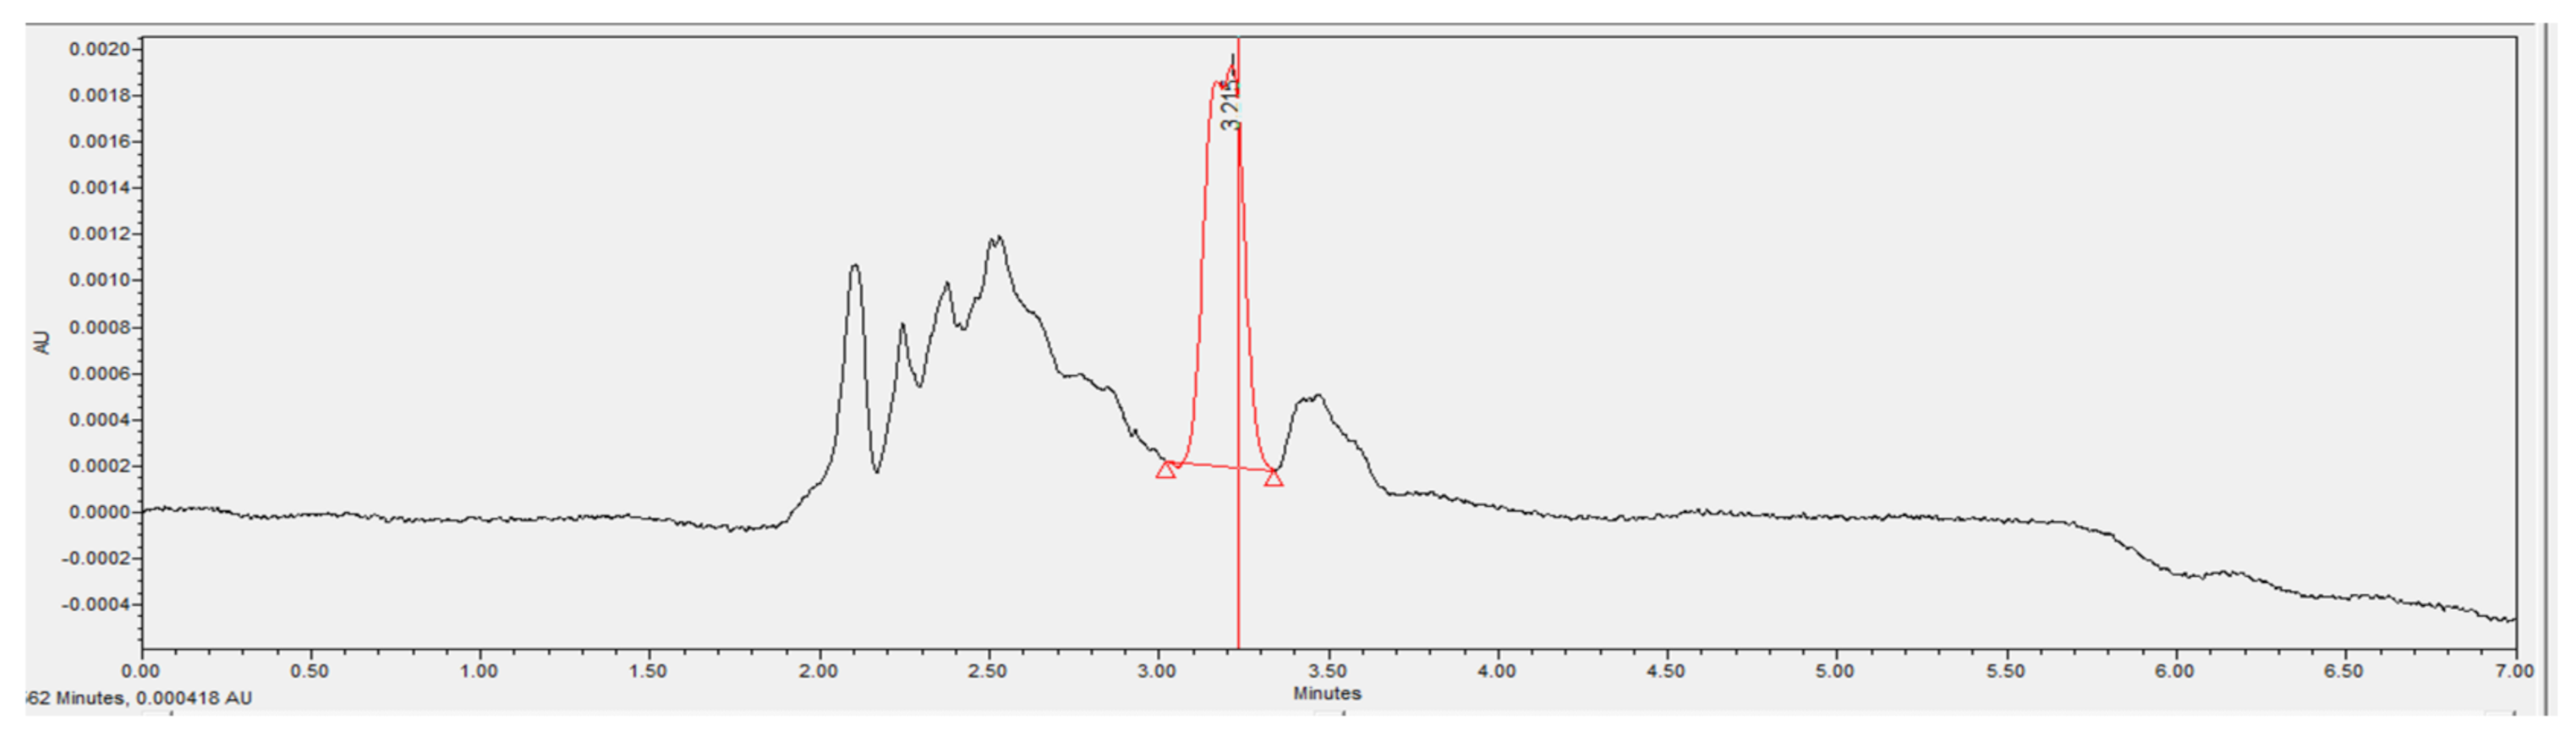
3.3.6. Phenol Removal Efficiency of A2O-MBBR System

Results of phenol treatment in wastewater are shown in Figure 14 and Figure 15.
Overall, good phenol removal performance was observed in the chromatograms of the wastewater treated by the A2O-MBBR system. The real coking wastewater sample had its phenol concentration reduced from 172.0 to 25.8 mg/L, which is an 85% removal efficiency (Table 4). On the other hand, the combinational process reduced the concentration of phenol from 45.9 to 0 mg/L. Thus, the combination of the two treatment processes is recommended to meet the QCVN 52:2017/BTNMT standard (column A) for steel production industrial wastewater.

4. Conclusions

In this study, two wastewater treatment methods, namely, internal electrolysis with Fe-C material and A2O-MBBR process, were evaluated for treatment of real coking wastewater. The employment of the internal electrolysis alone resulted in the removal efficiencies of phenol, TSS, BOD5, COD, total N, total P, and NH4+-N of 73.32%, 51.02%, 56.70%, 53.74%, 34.98%, 47.20%, and 60.10%, respectively. For the A2O-MBBR system, the figures were 85.0%, 72.2%, 93.8%, 83.9%, 89.6%, 77.9%, and 91.9%, respectively. However, the combination of the two processes gave significantly higher phenol decomposition, at 100%, and moderately improved COD, total N, and NH 4 + -N removal efficiency. All water indicators of the wastewater treated with the combination process also meets the QCVN 52:2017/BTNMT (column A) for steel industry wastewater. The above results suggest the possibility to deploy the application of the internal electrolysis technology combined with the A2O-MBBR biofilm in practice to treat the wastewater in the coking process.

Author Contributions

Investigation, D.T.H., V.T.N., X.L.H., H.L.N.T., T.T.D. and H.-T.N.T.; writing—original draft, D.T.H.; writing—review and editing, D.C.N. All authors have read and agreed to the published version of the manuscript.

Funding

This work was completed with financial support from the Ministry of Education and Training of Vietnam, under the project B2019-TNA-10.

Conflicts of Interest

The authors declare no conflict of interest.

References

  1. Kang, M.; Chen, Q.; Li, J.; Liu, M.; Weng, Y. Preparation and study of a new type of Fe–C microelectrolysis filler in oil-bearing ballast water treatment. Environ. Sci. Pollut. Res. 2019, 26, 10673–10684. [Google Scholar] [CrossRef] [PubMed]
  2. Zheng, X.-Y.; Jin, M.; Zhou, X.; Chen, W.; Lu, D.; Zhang, Y.; Shao, X. Enhanced removal mechanism of iron carbon micro-electrolysis constructed wetland on C, N, and P in salty permitted effluent of wastewater treatment plant. Sci. Total Environ. 2019, 649, 21–30. [Google Scholar] [CrossRef] [PubMed]
  3. Huang, L.; Sun, G.; Yang, T.; Zhang, B.; He, Y.; Wang, X.-H. A preliminary study of anaerobic treatment coupled with micro-electrolysis for anthraquinone dye wastewater. Desalination 2013, 309, 91–96. [Google Scholar] [CrossRef]
  4. Zhang, L.; Yue, Q.; Yang, K.; Zhao, P.; Gao, B. Analysis of extracellular polymeric substances (EPS) and ciprofloxacin-degrading microbial community in the combined Fe-C micro-electrolysis-UBAF process for the elimination of high-level ciprofloxacin. Chemosphere 2018, 193, 645–654. [Google Scholar] [CrossRef] [PubMed]
  5. Wang, Y.; Wu, X.; Yi, J.; Chen, L.; Lan, T.; Dai, J. Pretreatment of printing and dyeing wastewater by Fe/C micro-electrolysis combined with H2O2 process. Water Sci. Technol. 2018, 2017, 707–717. [Google Scholar] [CrossRef]
  6. Ma, W.; Han, Y.; Xu, C.; Han, H.; Ma, W.; Zhu, H.; Li, K.; Wang, D. Enhanced degradation of phenolic compounds in coal gasification wastewater by a novel integration of micro-electrolysis with biological reactor (MEBR) under the micro-oxygen condition. Bioresour. Technol. 2018, 251, 303–310. [Google Scholar] [CrossRef]
  7. Liu, M.; Wang, L.; Xiao, X.; He, Z. Fe/C micro electrolysis and Fenton oxidation process for the removal of recalcitrant colored pollutants from mid-stage pulping effluent. J. Bioresour. Bioprod. 2018, 3, 118–122. [Google Scholar] [CrossRef]
  8. Ji, Q.; Tabassum, S.; Hena, S.; Silva, C.G.; Yu, G.; Zhang, X. A review on the coal gasification wastewater treatment technologies: Past, present and future outlook. J. Clean. Prod. 2016, 126, 38–55. [Google Scholar] [CrossRef]
  9. Zhao, Q.; Liu, Y. State of the art of biological processes for coal gasification wastewater treatment. Biotechnol. Adv. 2016, 34, 1064–1072. [Google Scholar] [CrossRef]
  10. Xu, L.; Wang, J.; Zhang, X.; Hou, D.; Yü, Y. Development of a novel integrated membrane system incorporated with an activated coke adsorption unit for advanced coal gasification wastewater treatment. Colloids Surfaces A Physicochem. Eng. Asp. 2015, 484, 99–107. [Google Scholar] [CrossRef]
  11. Banu, J.R.; Uan, D.K.; Yeom, I.T. Nutrient removal in an A2O-MBR reactor with sludge reduction. Bioresour. Technol. 2009, 100, 3820–3824. [Google Scholar] [CrossRef] [PubMed]
  12. Pimple, S.; Karikkat, S.; Devanna, M.; Yanamadni, V.; Sah, R.; Prasad, S. Comparison of MBR/RO and UF/RO hybrid systems for the treatment of coke-oven effluents. Desalin. Water Treat. 2014, 57, 1–9. [Google Scholar] [CrossRef]
  13. Zeng, W.; Li, L.; Yang, Y.; Wang, S.; Peng, Y. Nitritation and denitritation of domestic wastewater using a continuous anaerobic–anoxic–aerobic (A2O) process at ambient temperatures. Bioresour. Technol. 2010, 101, 8074–8082. [Google Scholar] [CrossRef] [PubMed]
  14. Wang, Z.; Xu, X.; Gong, Z.; Yang, F. Removal of COD, phenols and ammonium from Lurgi coal gasification wastewater using A2O-MBR system. J. Hazard. Mater. 2012, 78–84. [Google Scholar] [CrossRef] [PubMed]
  15. Zeng, W.; Li, L.; Yang, Y.-Y.; Wang, X.-D.; Peng, Y. Denitrifying phosphorus removal and impact of nitrite accumulation on phosphorus removal in a continuous anaerobic–anoxic–aerobic (A2O) process treating domestic wastewater. Enzym. Microb. Technol. 2011, 48, 134–142. [Google Scholar] [CrossRef] [PubMed]
  16. Dong, C.; Li, M.; Zhuang, L.-L.; Zhang, J.; Shen, Y.; Li, X. The Improvement of Pollutant Removal in the Ferric-Carbon Micro-Electrolysis Constructed Wetland by Partial Aeration. Water 2020, 12, 389. [Google Scholar] [CrossRef] [Green Version]
  17. Zhang, M.; Tay, J.H.; Qian, Y.; Gu, X.S. Coke plant wastewater treatment by fixed biofilm system for COD and NH3-N removal. Water Res. 1998, 32, 519–527. [Google Scholar] [CrossRef]
  18. Peng, Y.; Wang, X.-L.; Li, B.-K. Anoxic biological phosphorus uptake and the effect of excessive aeration on biological phosphorus removal in the A2O process. Desalination 2006, 189, 155–164. [Google Scholar] [CrossRef]
  19. You, S.; Hsu, C.; Chuang, S.; Ouyang, C. Nitrification efficiency and nitrifying bacteria abundance in combined AS-RBC and A2O systems. Water Res. 2003, 37, 2281–2290. [Google Scholar] [CrossRef]
  20. Yang, Z.; Ma, Y.; Liu, Y.; Li, Q.; Zhou, Z.; Ren, Z. Degradation of organic pollutants in near-neutral pH solution by Fe-C micro-electrolysis system. Chem. Eng. J. 2017, 315, 403–414. [Google Scholar] [CrossRef]
  21. Zhang, J.; Zhang, Y.; Quan, X. Electricity assisted anaerobic treatment of salinity wastewater and its effects on microbial communities. Water Res. 2012, 46, 3535–3543. [Google Scholar] [CrossRef] [PubMed]
  22. Wu, S.; Qi, Y.; Fan, C.; Dai, B.; Huang, J.; Zhou, W.; He, S.; Gao, L. Improvement of anaerobic biological treatment effect by catalytic micro-electrolysis for monensin production wastewater. Chem. Eng. J. 2016, 296, 260–267. [Google Scholar] [CrossRef]
  23. Ministry of Natural Resources and Environment of Vietnam. National Technical Regulation on Wastewater of Steel Industry; QCVN 52:2017/BTNMT; Hanoi, Vietnam, 2017. Available online: http://vea.gov.vn/Quy%20chun%20Vit%20Nam/QCVN%2052-2017-BTNMT.pdf (accessed on 18 September 2020).
Figure 1. Activated sludge culture in the laboratory.
Processes 08 01258 g001
Figure 2. Diagram of A2O-MBBR system.
Processes 08 01258 g002
Figure 3. SEM image of Fe-C material.
Processes 08 01258 g003
Figure 4. EDS pattern of Fe-C material.
Processes 08 01258 g004
Figure 5. XRD pattern of Fe-C material.
Processes 08 01258 g005
Figure 6. Chromatogram of the phenol containing wastewater before treatment with Fe-C internal electrolyte material.
Processes 08 01258 g006
Figure 7. Chromatogram of the phenol containing wastewater after treatment with Fe-C internal electrolyte material.
Processes 08 01258 g007
Figure 8. Treatment efficiency of TSS (mg/L) via A2O-MBBR system and through treatment of Fe-C materials combined with A2O-MBBR system.
Processes 08 01258 g008
Figure 9. COD treatment efficiency (mg/L) via A2O-MBBR system and through treatment of Fe-C material combined with A2O-MBBR system.
Processes 08 01258 g009
Figure 10. BOD5 treatment efficiency 5 (mg/L) via A2O-MBBR system and through treatment of Fe-C material combined with A2O-MBBR system.
Processes 08 01258 g010
Figure 11. Total N treatment efficiency (mg/L) through A2O-MBBR system and through treatment of Fe-C material combined with A2O-MBBR system.
Processes 08 01258 g011
Figure 12. NH 4 + -N treatment efficiency (mg/L) via A2O-MBBR system and through treatment of Fe-C material combined with A2O-MBBR system.
Processes 08 01258 g012
Figure 13. Treatment efficiency total P (mg/L) via A2O-MBBR system and through treatment of Fe-C material in combination with A2O-MBBR system.
Processes 08 01258 g013
Figure 14. Chromatogram of a phenol containing wastewater sample after being treated with A2O-MBBR system.
Processes 08 01258 g014
Figure 15. Chromatogram of the wastewater sample containing phenolic conjugate material processing Fe-C and A2O-MBBR system.
Processes 08 01258 g015
Table 1. Initial operating parameters of A2O-MBBR system.
Reaction TankCOD (mg/L)MLSS (mg/L)pHDO (mg/L)Retention Time (h)
Anaerobic23591800−20007.5–814
Anoxic tank2000−23001−26
Aerobic4000−45005–84
MLSS is the activated sludge concentration.
Table 2. Elemental analysis of Fe-C material.
ElementWeigh (%)Atomics (%)
C14.5923.57
O50.1660.86
Al1.891.36
Si5.473.78
Ca5.402.61
Fe22.487.81
Total100.00100.00
Table 3. Characteristics of coking wastewater before and after internal electrolysis treatment with Fe-C material.
ParametersUnitMethod of AnalysisResult (mg/L)Efficiency
H (%)
BeforeAfter
pHTCVN 6492:20118.36.7
DOmg/LTCVN 7325:20040.62.8-
TSSmg/LSMEWW 2540 D:2012156.276.551.02
BOD5
(20 °C)
mg/LTCVN 6001–1:20081150.0498.056.7
CODmgO2/LSMEWW 5220C:20122231.01032.053.7
Phenolmg/LTCVN 6216:1996172.045.973,32
CNmg/LSMEWW4500 CNB:20120.05<0.01
Total Nmg/LTCVN 6638:2000865.0562.434.98
NH 4 + -Nmg/LTCVN 6179–1:1996391.0156.060.1
Total Pmg/LTCVN 6202:200816.18.547.2
Table 4. Indicators of wastewater through different treatment stages.
IndicatorBefore TreatmentAfter Fe-CAfter A2O-MBBRFe-C & A2O-MBBRQCVN 52:2017/BTNMT
(Column A)
After TreatmentH%
TSS, mg/L145.276.540.341.671.350.0
BOD5, mg/L1105.0498.068.725.797.730.0
COD, mg/L2359.01032.0387.767.397.175.0
Total N, mg/L789.2562.481.919.197.620.0
Total P, mg/L13.68.53.02.581.64.0
N H 4 + -N, mg/L190156.015.34.797.55.0
Phenol, mg/L172.045.925.80.01000.1
pH8.04.06.5–7.26.5–7.26.0–9.0

