Article

Effects of Alginate and Chitosan on Activated Carbon as Immobilisation Beads in Biohydrogen Production

by
Nur Farahana Dzul Rashidi
1,
Nur Syakina Jamali
1,*,
Siti Syazwani Mahamad
1,
Mohamad Faizal Ibrahim
2,
Norhafizah Abdullah
1,
Siti Fatimah Ismail
1 and
Shamsul Izhar Siajam
1
1
Department of Chemical and Environmental Engineering, Faculty of Engineering, Universiti Putra Malaysia, Serdang 43400, Selangor Darul Ehsan, Malaysia
2
Department of Bioprocess Technology, Faculty of Biotechnology and Biomolecular Sciences, Universiti Putra Malaysia, Serdang 43400, Selangor Darul Ehsan, Malaysia
*
Author to whom correspondence should be addressed.
Processes 2020, 8(10), 1254; https://doi.org/10.3390/pr8101254
Submission received: 28 July 2020 / Revised: 3 September 2020 / Accepted: 14 September 2020 / Published: 6 October 2020
(This article belongs to the Special Issue Biotechnology for Sustainability and Social Well Being)

Abstract

:
In this study, the effects of alginate and chitosan as entrapped materials in the biofilm formation of microbial attachment on activated carbon was determined for biohydrogen production. Five different batch fermentations, consisting of mixed concentration alginate (Alg), were carried out in a bioreactor at temperature of 60 °C and pH 6.0, using granular activated carbon (GAC) as a primer for cell attachment and colonisation. It was found that the highest hydrogen production rate (HPR) of the GAC–Alg beads was 2.47 ± 0.47 mmol H2/l.h, and the H2 yield of 2.09 ± 0.22 mol H2/mol sugar was obtained at the ratio of 2 g/L of Alg concentration. Next, the effect of chitosan (C) as an external polymer layer of the GAC–Alg beads was investigated as an alternative approach to protecting the microbial population in the biofilm in a robust environment. The formation of GAC with Alg and chitosan (GAC–AlgC) beads gave the highest HPR of 0.93 ± 0.05 mmol H2/l.h, and H2 yield of 1.11 ± 0.35 mol H2/mol sugar was found at 2 g/L of C concentration. Hydrogen production using GAC-attached biofilm seems promising to achieve consistent HPRs at higher temperatures, using Alg as immobilised bead material, which has indicated a positive response in promoting the growth of hydrogen-producing bacteria and providing excellent conditions for microorganisms to grow and colonise high bacterial loads in a bioreactor.

1. Introduction

Biohydrogen is a popular energy carrier as its production promises clean energy that only generates water upon combustion, with higher energy content per unit weight (122 kJ/g) than any other fuel [1]. Biological methods have been studied to ensure the hydrogen production is safer and more economical than thermochemical methods. Dark fermentation is being recognised as an excellent biological method of hydrogen production because of its ability to perform without light energy and oxygen source [2]. Fermentation is the process of using specific microorganisms to convert organic substrates into hydrogen, carbon dioxide, and other solutes such as acetate, butanol, and ethanol [3].
The production of biohydrogen using a suspended cultivation system through high-temperature operation (50–60 °C) has gained attention due to its higher yield and hydrogen productivity (HPR) capability. This operation is preferable in pathogenic destruction as it can restrain the growth of hydrogen consumers such as homoacetogens and methanogens [4,5]. However, the lower microbial cell density at this temperature is a disadvantage for the fermentation. Difficulties in the retention of biomass in the suspended system and cell washout are regularly experienced inside the reactor, which usually happens during the short hydraulic retention time (HRT) [6,7]. As a consequence, attached cell immobilisation is an approach to maximising and maintaining biomass, such that it can work at a higher rate of dilution without biomass washout from the reactor. Immobilisation technology has been developed to increase hydrogen production by providing a favourable environment of support for microbial cells during fermentation. Hence, the selection of the supporting material is imperative because it affects the overall performance of biohydrogen production.
Alginate (Alg) is an excellent support material, making it a practical choice in immobilisation. It has been reported that biohydrogen production increases three-fold when using alginate beads supplemented with aluminum oxide and titanium oxide [8,9]. Meanwhile, Wuet al. [10] said that biohydrogen production is two-times greater when alginate beads are enhanced with activated carbon. Nonetheless, even though alginate beads have been widely used in immobilisation, they are reported to still suffer from certain limitations like weak mechanical strength and reduced porosity [11,12]. Therefore, several approaches have been studied to improve the permeability and mechanical stability of alginate matrices, such as incorporating other materials like cellulose, metal, and carbon sources.
A previous study reported that the entrapment between chitosan and alginate forms a strong ionic interaction between carboxyl groups of alginate and amino groups of chitosan, thus resulting in an improvement in the mechanical properties of the matrix support [13,14]. In other studies, the formation of high, crosslinked, porous beads, with better mechanical and chemical stability of the support matrix in the buffered medium, is produced from the ionotropic gelation of chitosan, leading to low rates of cell leakage even at higher cell loading [15]. It was also reported that the effectiveness of chitosan coating enables the physical isolation of bacteria from the outer environment and reduces cell detachment during fermentation, besides improving the mechanical strength of alginate bead carriers during storage [16,17,18].
The entrapment technique is widely used, which can be done in a simple procedure. This technique involves an entrapment process in which the enzyme is crosslinked within polymeric materials such as calcium alginate, polyacrylamide (PAM) gel, and agar [19]. The research reported that the stability of immobilised cells can be enhanced via the fusion of microbial cells into a rigid network of the polymer due to the mechanical firmness and good porosity of the carrier, thus providing the right anaerobic conditions to microorganisms during hydrogen production [20].
In this study, the effect of alginate and chitosan was investigated as one of the potential entrapped-material approaches in cell immobilisation and cell encapsulation. In the first part of this research, the ability of microbial culture to attach and maintain itself on a granular activated carbon (GAC) surface as their support material was performed on mixtures of glucose and xylose as the carbon source. GAC has a high surface area, low toxicity, and excellent mechanical properties, which are ideal for fermentation at high temperatures. Moreover, its characteristic of having highly porous structure helps to preserve cell viability, which serves an excellent purpose in the field of microbial colonisation where fermentative bacteria can expand freely on the surface of the supporting material and form a biofilm [21]. Efforts have been made to improve the high cell density that facilitates the good production of hydrogen. Furthermore, entrapment is part of immobilisation methods that have been used to improve the productivity of enzyme or microbial cells. This study investigated the variations of GAC–alginate (GAC–Alg)- and GAC–alginate–chitosan (GAC–AlgC)-immobilised beads, which acts as a support carrier during biofilm development in batch fermentation of biohydrogen production.

2. Materials and Methods

2.1. Microorganism, GAC Carrier, Alginate, and Chitosan Carriers

The microorganism source was collected from a sludge pit of palm oil mill effluent (POME) that was located at Sime Darby Plantation, Selangor, Malaysia. The sludge containing mixed culture underwent a heat-treated process at 80 to 90 °C for 60 min to prevent the development of the methanogenic population prior to use. The GAC carrier originated from shells of coconuts that were supplied by KI Carbon Solutions Sdn Bhd. GAC was sieved to attain 2–3 mm of particle size. Sodium alginate powder and chitosan flakes originated from crab shells were supplied by BT Science Sdn Bhd. Sodium alginate powder was dissolved into 1 L of distilled water and stirred using a hot plate magnetic stirrer for 30 min to attain homogeneity prior to use.

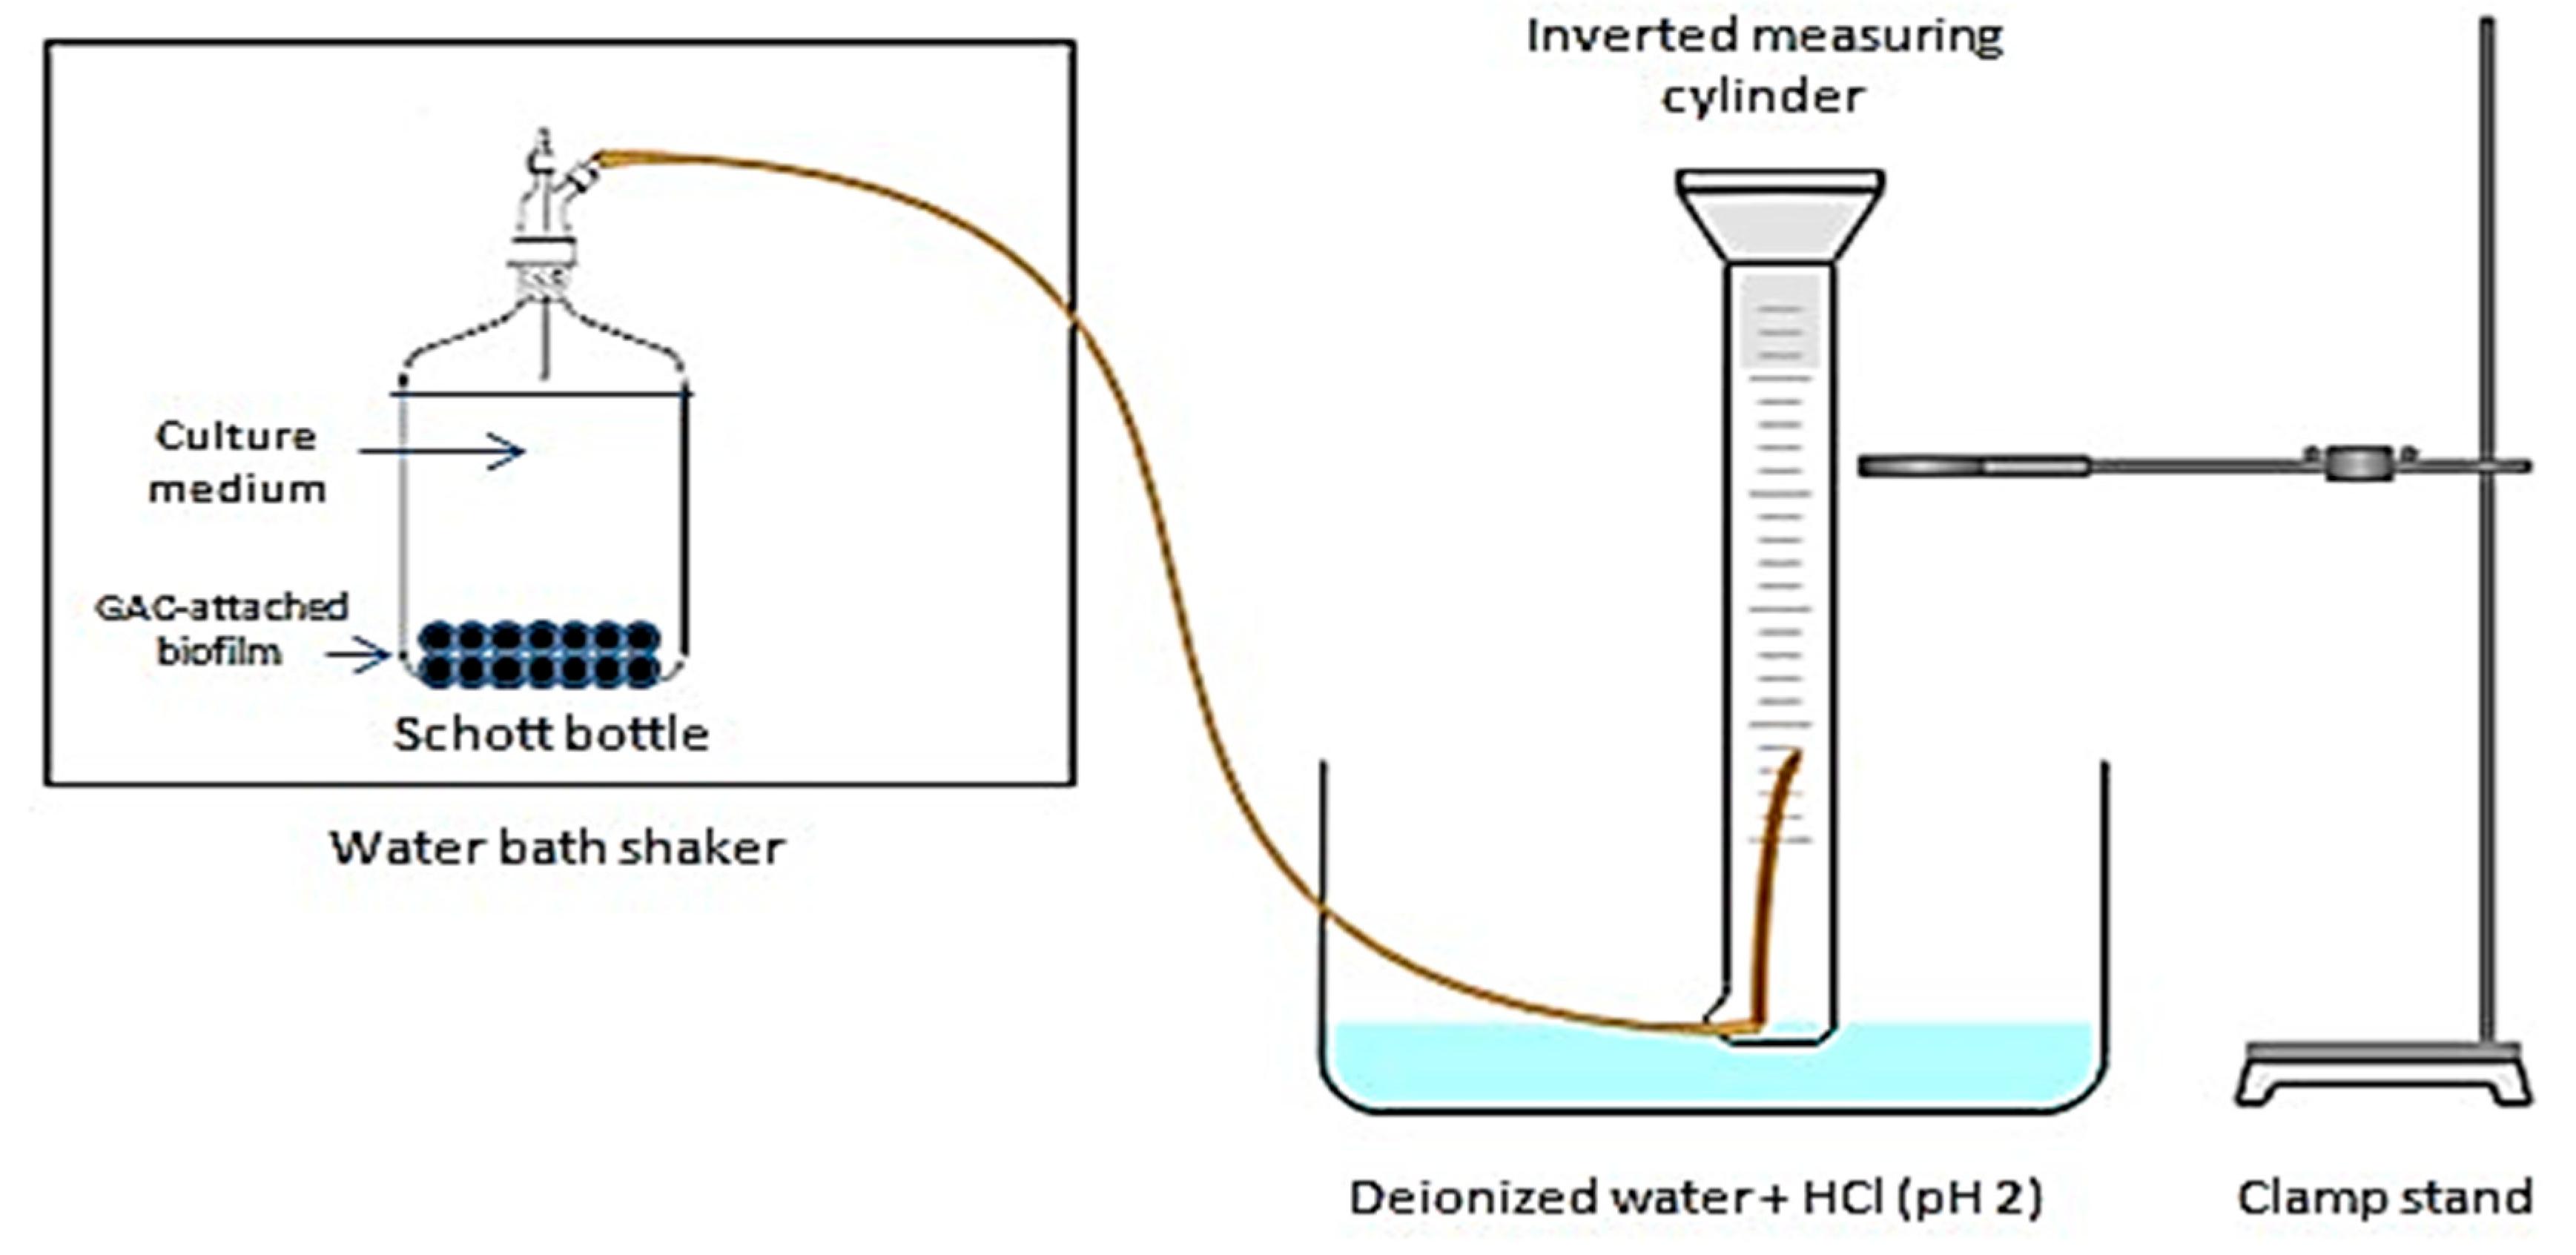
2.2. Biofilm Formation on Activated Carbon

Biofilm was primarily developed on the surface of GAC using the surface attachment method as one of the immobilisation approaches. A similar ratio of GAC to sludge, 10:10 (w/v g/L), was acclimatised in the synthetic medium inside a 1 L modified Schott bottle using the sequencing batch operation mode of 2 days HRT. The biofilm was continuously developed until biogas production was consistently obtained. The synthetic medium was used in sequencing batch fermentation. The medium contained (per liter of deionised water): KH2PO4 0.75 g L−1, NH4Cl 1 g L−1, K2HPO4.3H2O 1.5 g L−1, NaCl 2 g L−1, NaHCO3 2.6 g L−1, MgCl2.6H2O 0.5 g L−1, CaCl2.2H2O 0.05 g L−1, yeast extract 2 g L−1, xylose 10 g L−1, and glucose 10 g L−1. The fermentation system was cultivated for 48 h in a water bath shaker at 60 °C and 120 rpm, with the pH of the culture medium adjusted to pH 6.0 [21,22].
The gas produced was monitored using the water displacement method. The measuring cylinder was put invertedly in the hydrochloric acid solution (with pH 2) to avoid the gases from being released into the environment. The volume of biogas was recorded in every cycle and collected once the stationary phase was achieved. The experimental setup of this study is shown in Figure 1.

2.3. Development of GAC—Attached Biofilm Entrapped in Alginate Beads (GAC–Alg)

The different concentrations of alginate were prepared by dissolving 0.5, 1, 2, 3, and 4 g of sodium alginate powder into 1 L of distilled water, as shown in Table 1. About 40 g of GAC-attached biofilm were put into the alginate solution and mildly stirred until well mixed. The mixed granules were then dropped into a 2% (w/v) solution of 100 mL of calcium chloride (CaCl2) in a separate beaker to form and harden the beads and left for 30 min. The hardened beads, obtained with a diameter range of approximately 4–5 mm, were filtered and rinsed with sterile water before use.

2.4. Entrapment of GAC–Alg Beads with Chitosan (GAC–AlgC)

The previous method of GAC-attached biofilm with alginate was repeated. The different concentrations of chitosan were prepared by dissolving 0.5, 1, 2, 3, and 4 g of chitosan flakes into 5% (v/v) of acetic acid (5 mL) in a separated beaker, as shown in Table 1. The beads formed were added into chitosan solution until they were well immersed. The beads were then sunk into 40 g of NaOH for 30 min to make it hardened and fully coated before being filtered and rinsed with sterile water and used in fermentation [23,24].

2.5. Batch Fermentation of Biohydrogen Production

The fermentation process was carried out in a 250 mL Schott Duran bottle, as shown in Figure 1 Nitrogen gas was pumped into the bottle for 2 min before fermentation to eliminate the oxygen inside the bottle. The fermentation process was carried out for 12 h, with an initial medium of pH 6.0, as well as temperature and shaking speed at 60 °C and 120 rpm, respectively. The process was repeated periodically for two batches with different types of substrates [25,26]. The gas samples generated during the fermentation were collected when the biogas amount was consistently achieved.

2.6. Analysis of Gaseous, Hydrogen Yield, and Productivity

The hydrogen yield (HY) was determined based on the amount of hydrogen produced over the amount of sugar consumed. Hydrogen yield was represented as hydrogen moles per mole of sugar consumed. The percentage of biogas composition was examined using gas chromatography (GC) (Model HP6890N, Agilent Technology, USA) consisting of two detectors: a thermal conductivity detector (TCD) andflame-ionization detector (FID). The internal diameter and film thickness of the column was 0.53 mm and 0.5 mL, respectively. The oven temperature was set at 75 °C, and the carrier gas flow rate (argon) was 6 mL/min. Then, 0.5-mL samples of gas were taken using a 1-mL gas-tight syringe, injected into the GC immediately. The TCD was calibrated with standard gas (Air Product, Malaysia) mixtures, consisting of H2, CH4, CO, and CO2 in nitrogen, at periodic intervals.
Modified Gompertz was presented to correlate the cumulative hydrogen gas production using the Solver add-in in Excel. Theoretically, the Gompertz equation was modified [26]
H t =   H m . exp { e x p [ R m . e H m ( λ t ) + 1 ] } .
where Ht is the cumulative hydrogen production (mL), Hm is the maximum hydrogen production (mL), Rm is the maximum hydrogen production rate (mL.h−1), e is the Euler number (e = 2.73), λ is the lag phase time (h), and t is the incubation time (h).

2.7. Analysis of Volatile Fatty Acid and Sugar

HPLC analysis was used to determine the number of monosaccharides mainly found as xylose and glucose, and also the amount of volatile fatty acids (TVFAs) that was present in a sample. The liquid samples were filtered into vials via a 0.22-µm syringe. The soluble microbial product (SMP) and monomeric sugar concentrations were quantified by HPLC analysis fitted with a refractive index detector (RID) with a column (Phenomenex, RPM Pb2+). The mobile phase used was 5 mM water at a constant flow rate of 0.6 mL/min at room temperature. The column temperature was maintained at 80 °C, and the HPLC sample injection volume was 20 µL. The intended compounds were identified by conducting standard curves of different concentrations of SMPs and sugar concentrations.

2.8. Scanning Electron Microscope (SEM)

The formation of cell attachments on the immobilisation beads was observed by using scanning electron microscopy (SEM) [27]. The appearance of beads was seen before and after the fermentation process. The size of both types of beads was measured as 4–6 mm per bead. The physical stability of the beads was observed by putting the bead samples separately into test tubes with a medium of synthetic solution at pH 6.0 and keeping them in the same water bath shaker for fermentation. The state of the physical changes of the beads was recorded after they began to degrade. For further analysis, the beads were taken right after the fermentation process and left at −20 °C before the morphology test. The experiment was conducted using a scanning electron microscope (SEM; model Q250, Thermo Scientific, Waltham, MA, USA). The beads were cut into half with a knife to inspect the structure inside. The gel beads were then mounted on metal stubs, and the inside layer underwent sputter-coating with gold for 6 min. Then, the surfaces were examined and captured.

3. Results and Discussion

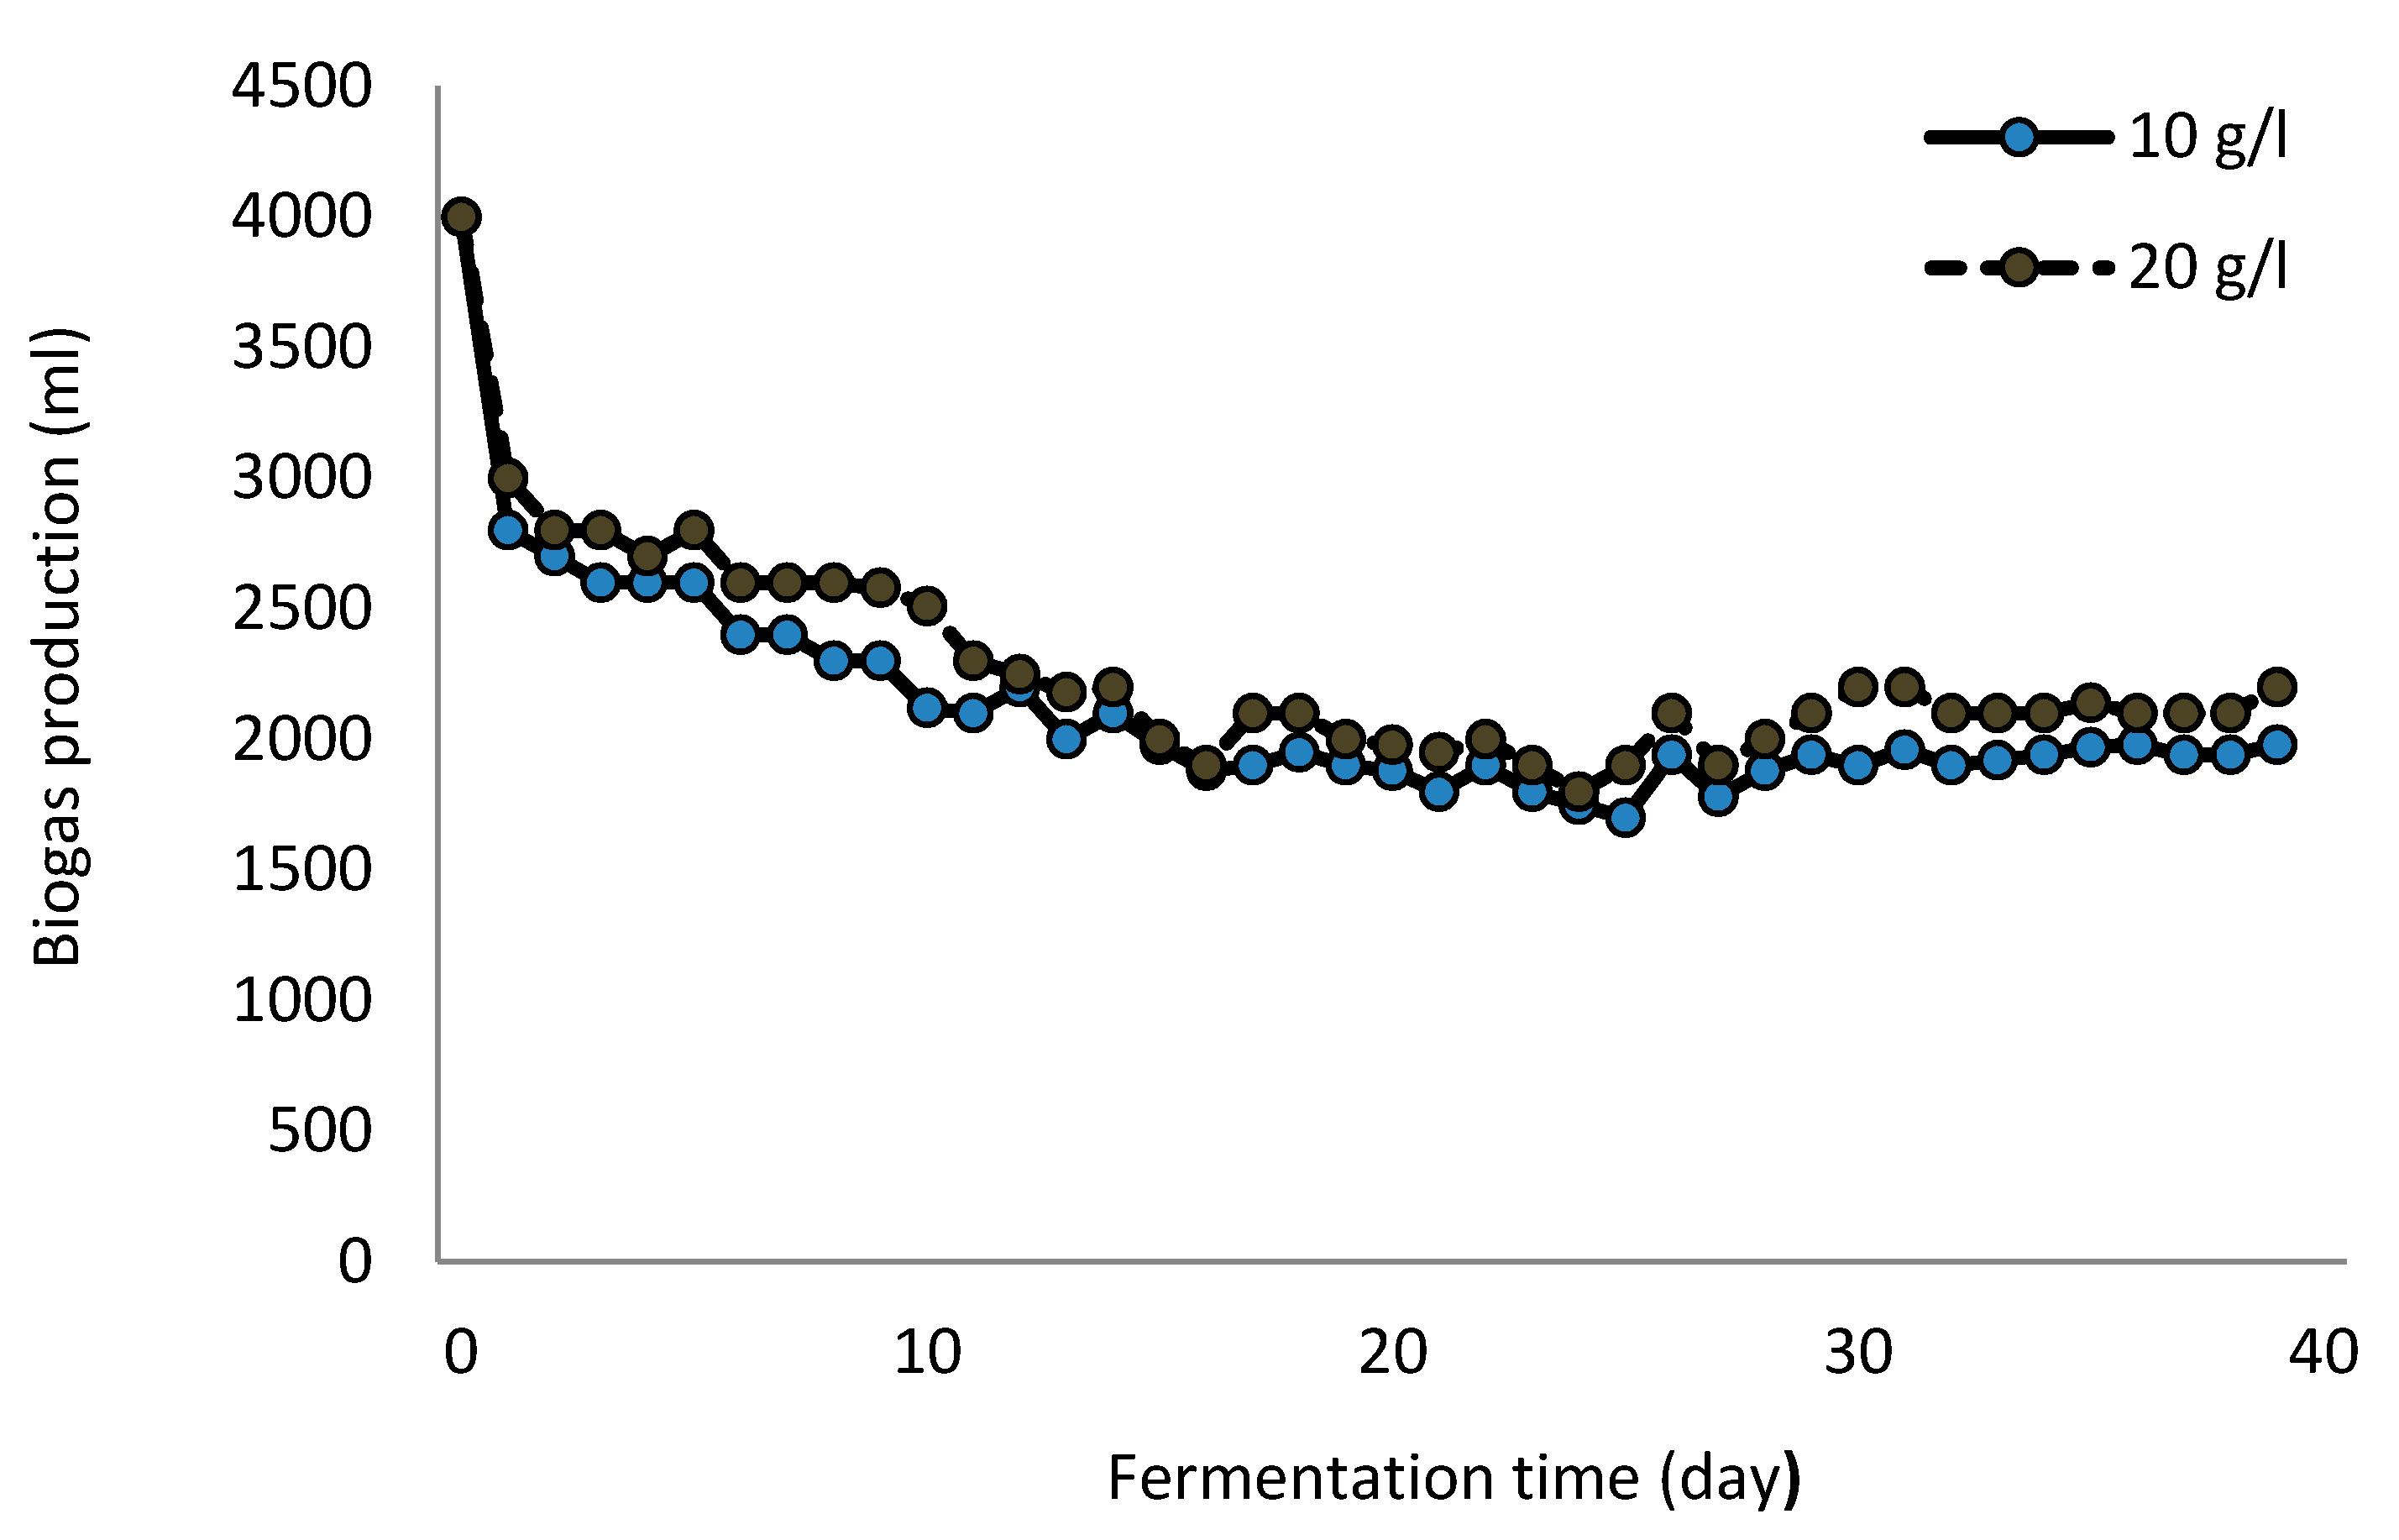
3.1. Microbial Cells Self-Attached to GAC for Hydrogen Production

The microbes were cultivated in a synthetic medium containing glucose and xylose mixtures as the sole carbon and energy source until biogas production was consistently achieved. The ability of the cells to bind themselves (self-attach) to the GAC surface had been thoroughly evaluated. Biogas production (mL) was plotted over fermentation time (day), as shown in Figure 2. It can be seen that the biogas fluctuated over the fermentation period and started to be consistently produced at Day 30, towards the end of 40 days of fermentation, with cumulative biogas production being 2115.75 ± 413.03 mL and 2274.75 ± 411.83 mL for 10 and 20 g/L sugar loading, respectively. The results of the production of biogas via dark fermentation immobilised with GAC are shown in Table 2.
The process continued until the biogas was stable and ready for gaseous analysis by using GC. The average hydrogen production rate was recorded as 3.71 ± 0.09 mmol H2/l.d at 10 g/L sugar used and 3.92 ± 0.21 mmol H2/l.d at 20 g/L sugar used. This indicates that 20 g/L is the optimal amount of sugar to be used for immobilisation beads and, thus, as the optimum substrate for future experiments. In parallel, our previous work also suggested that 20 g/L sugar was the optimal amount of sugar to use [21]. From the data obtained, it was found that the granular activated carbon could provide a suitable matrix to become a primer for cell attachment and colonisation before entrapment for hydrogen production. This is due to the mechanical stability of the biofilms formed on the activated carbon, which have a high propensity in binding capacity, providing a nutrient-rich environment, and thus promoting microbial adhesion [28,29]. The attachment-formed biofilms also help to sustain cell viability and prevent cell washout from the reactor, thus increase cell density [30].

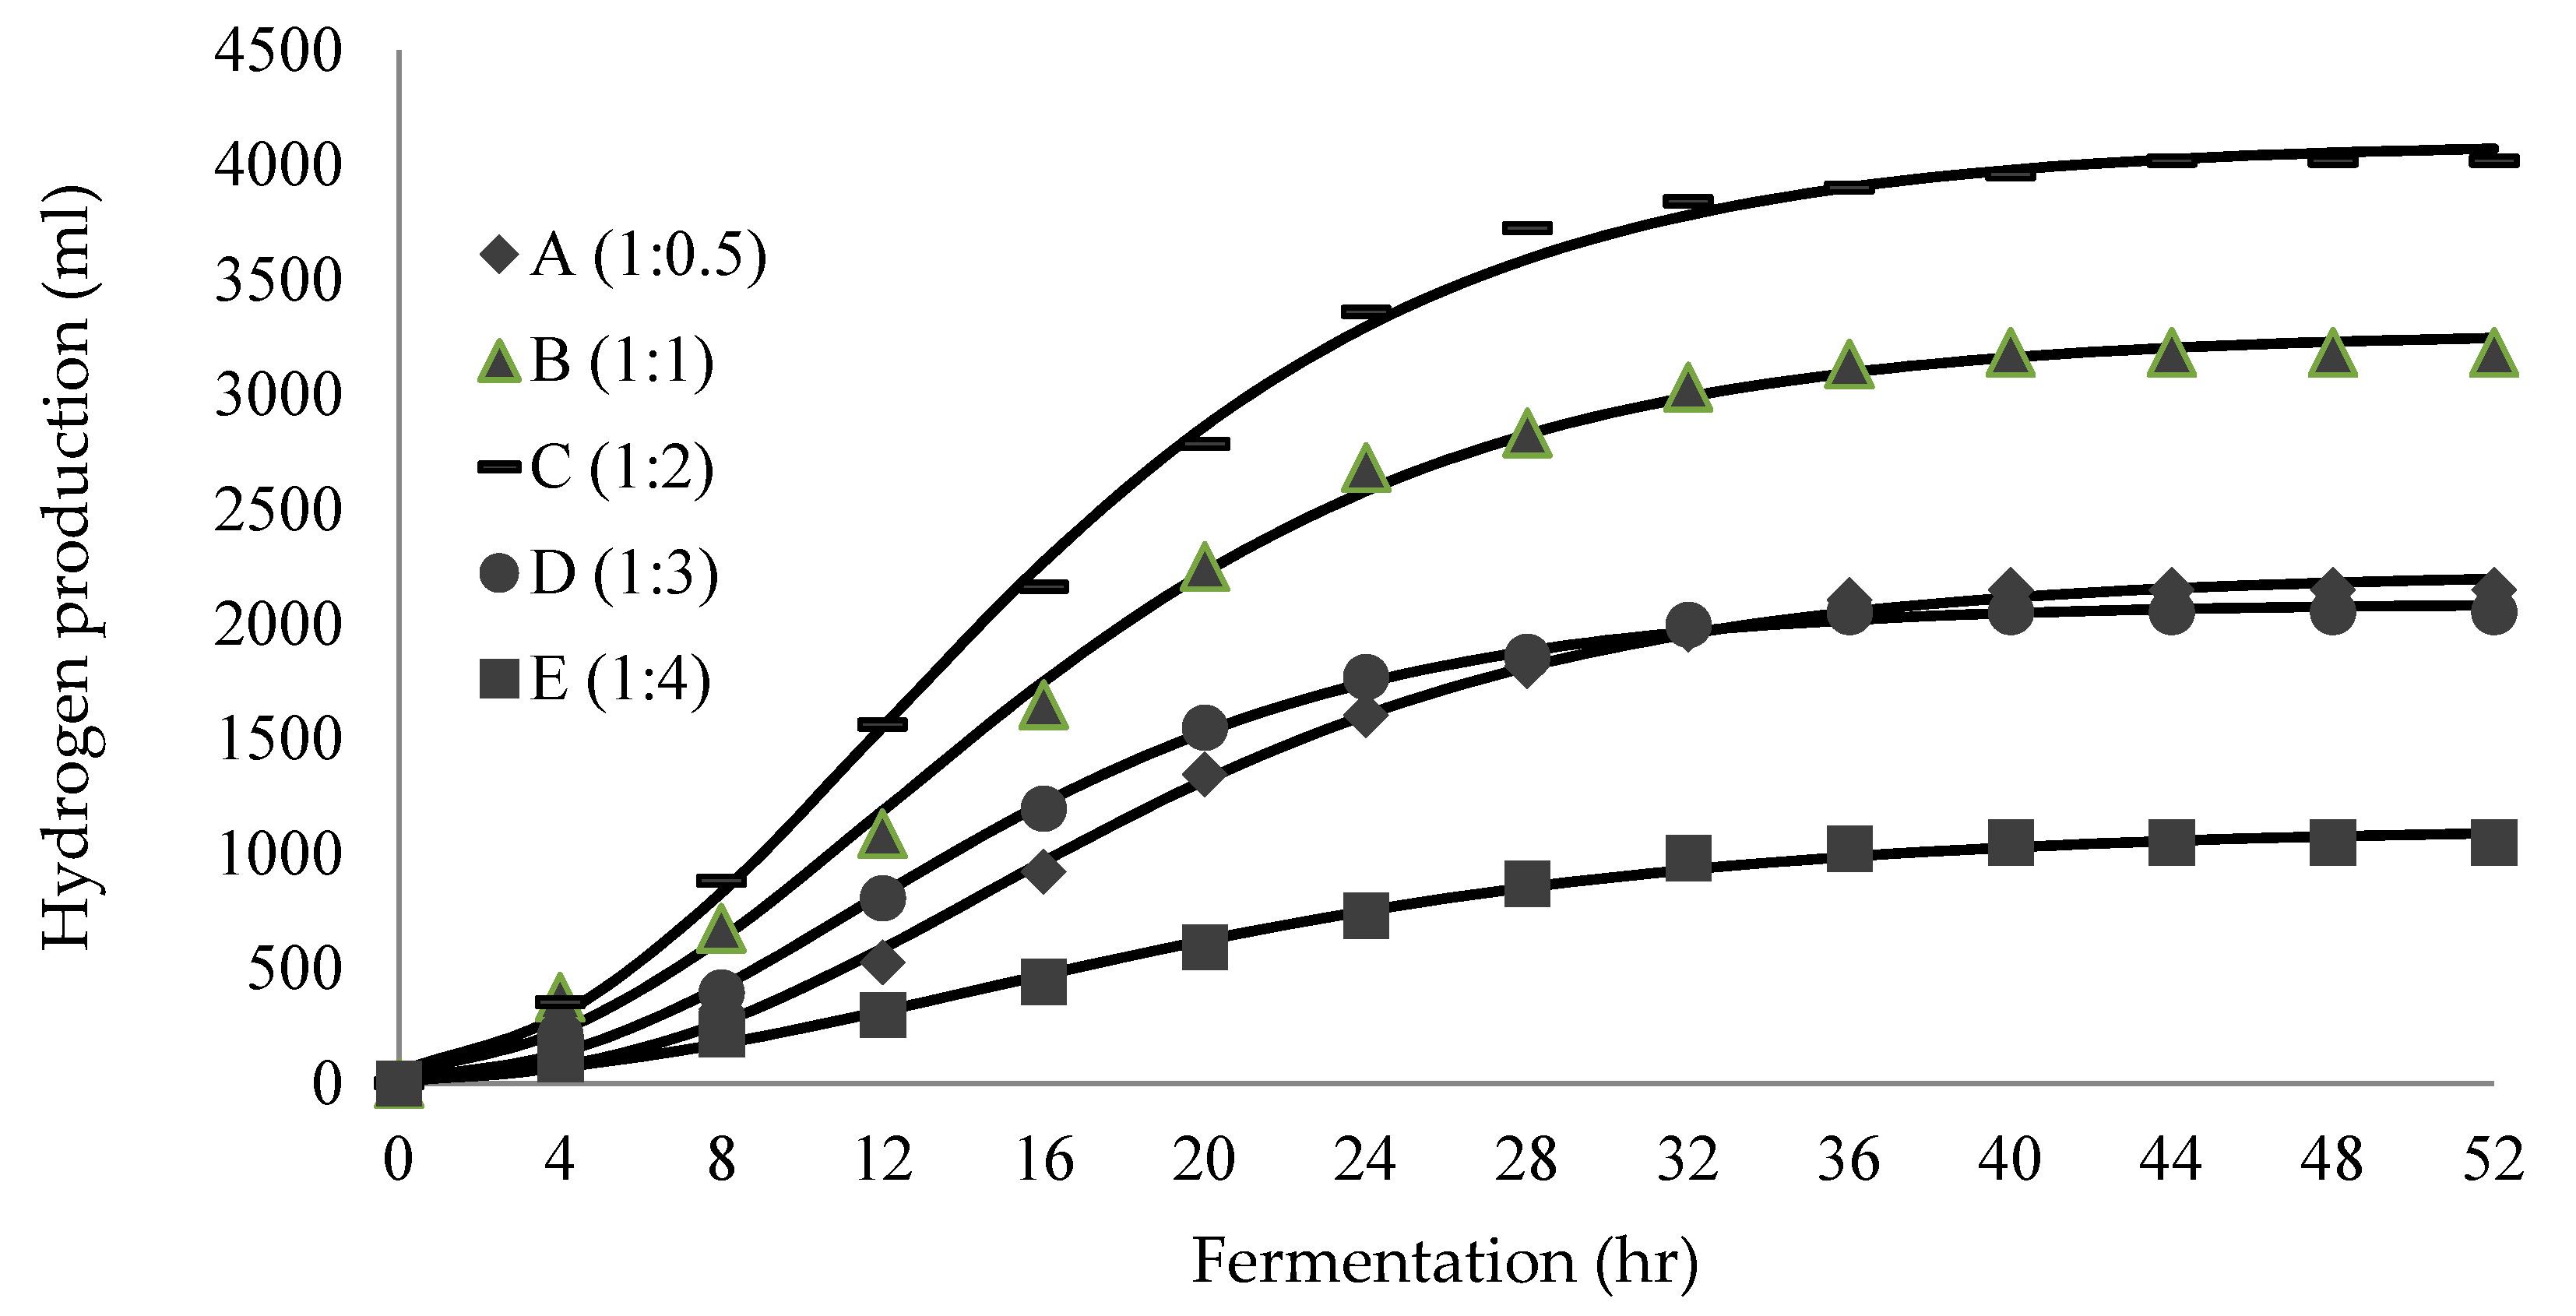
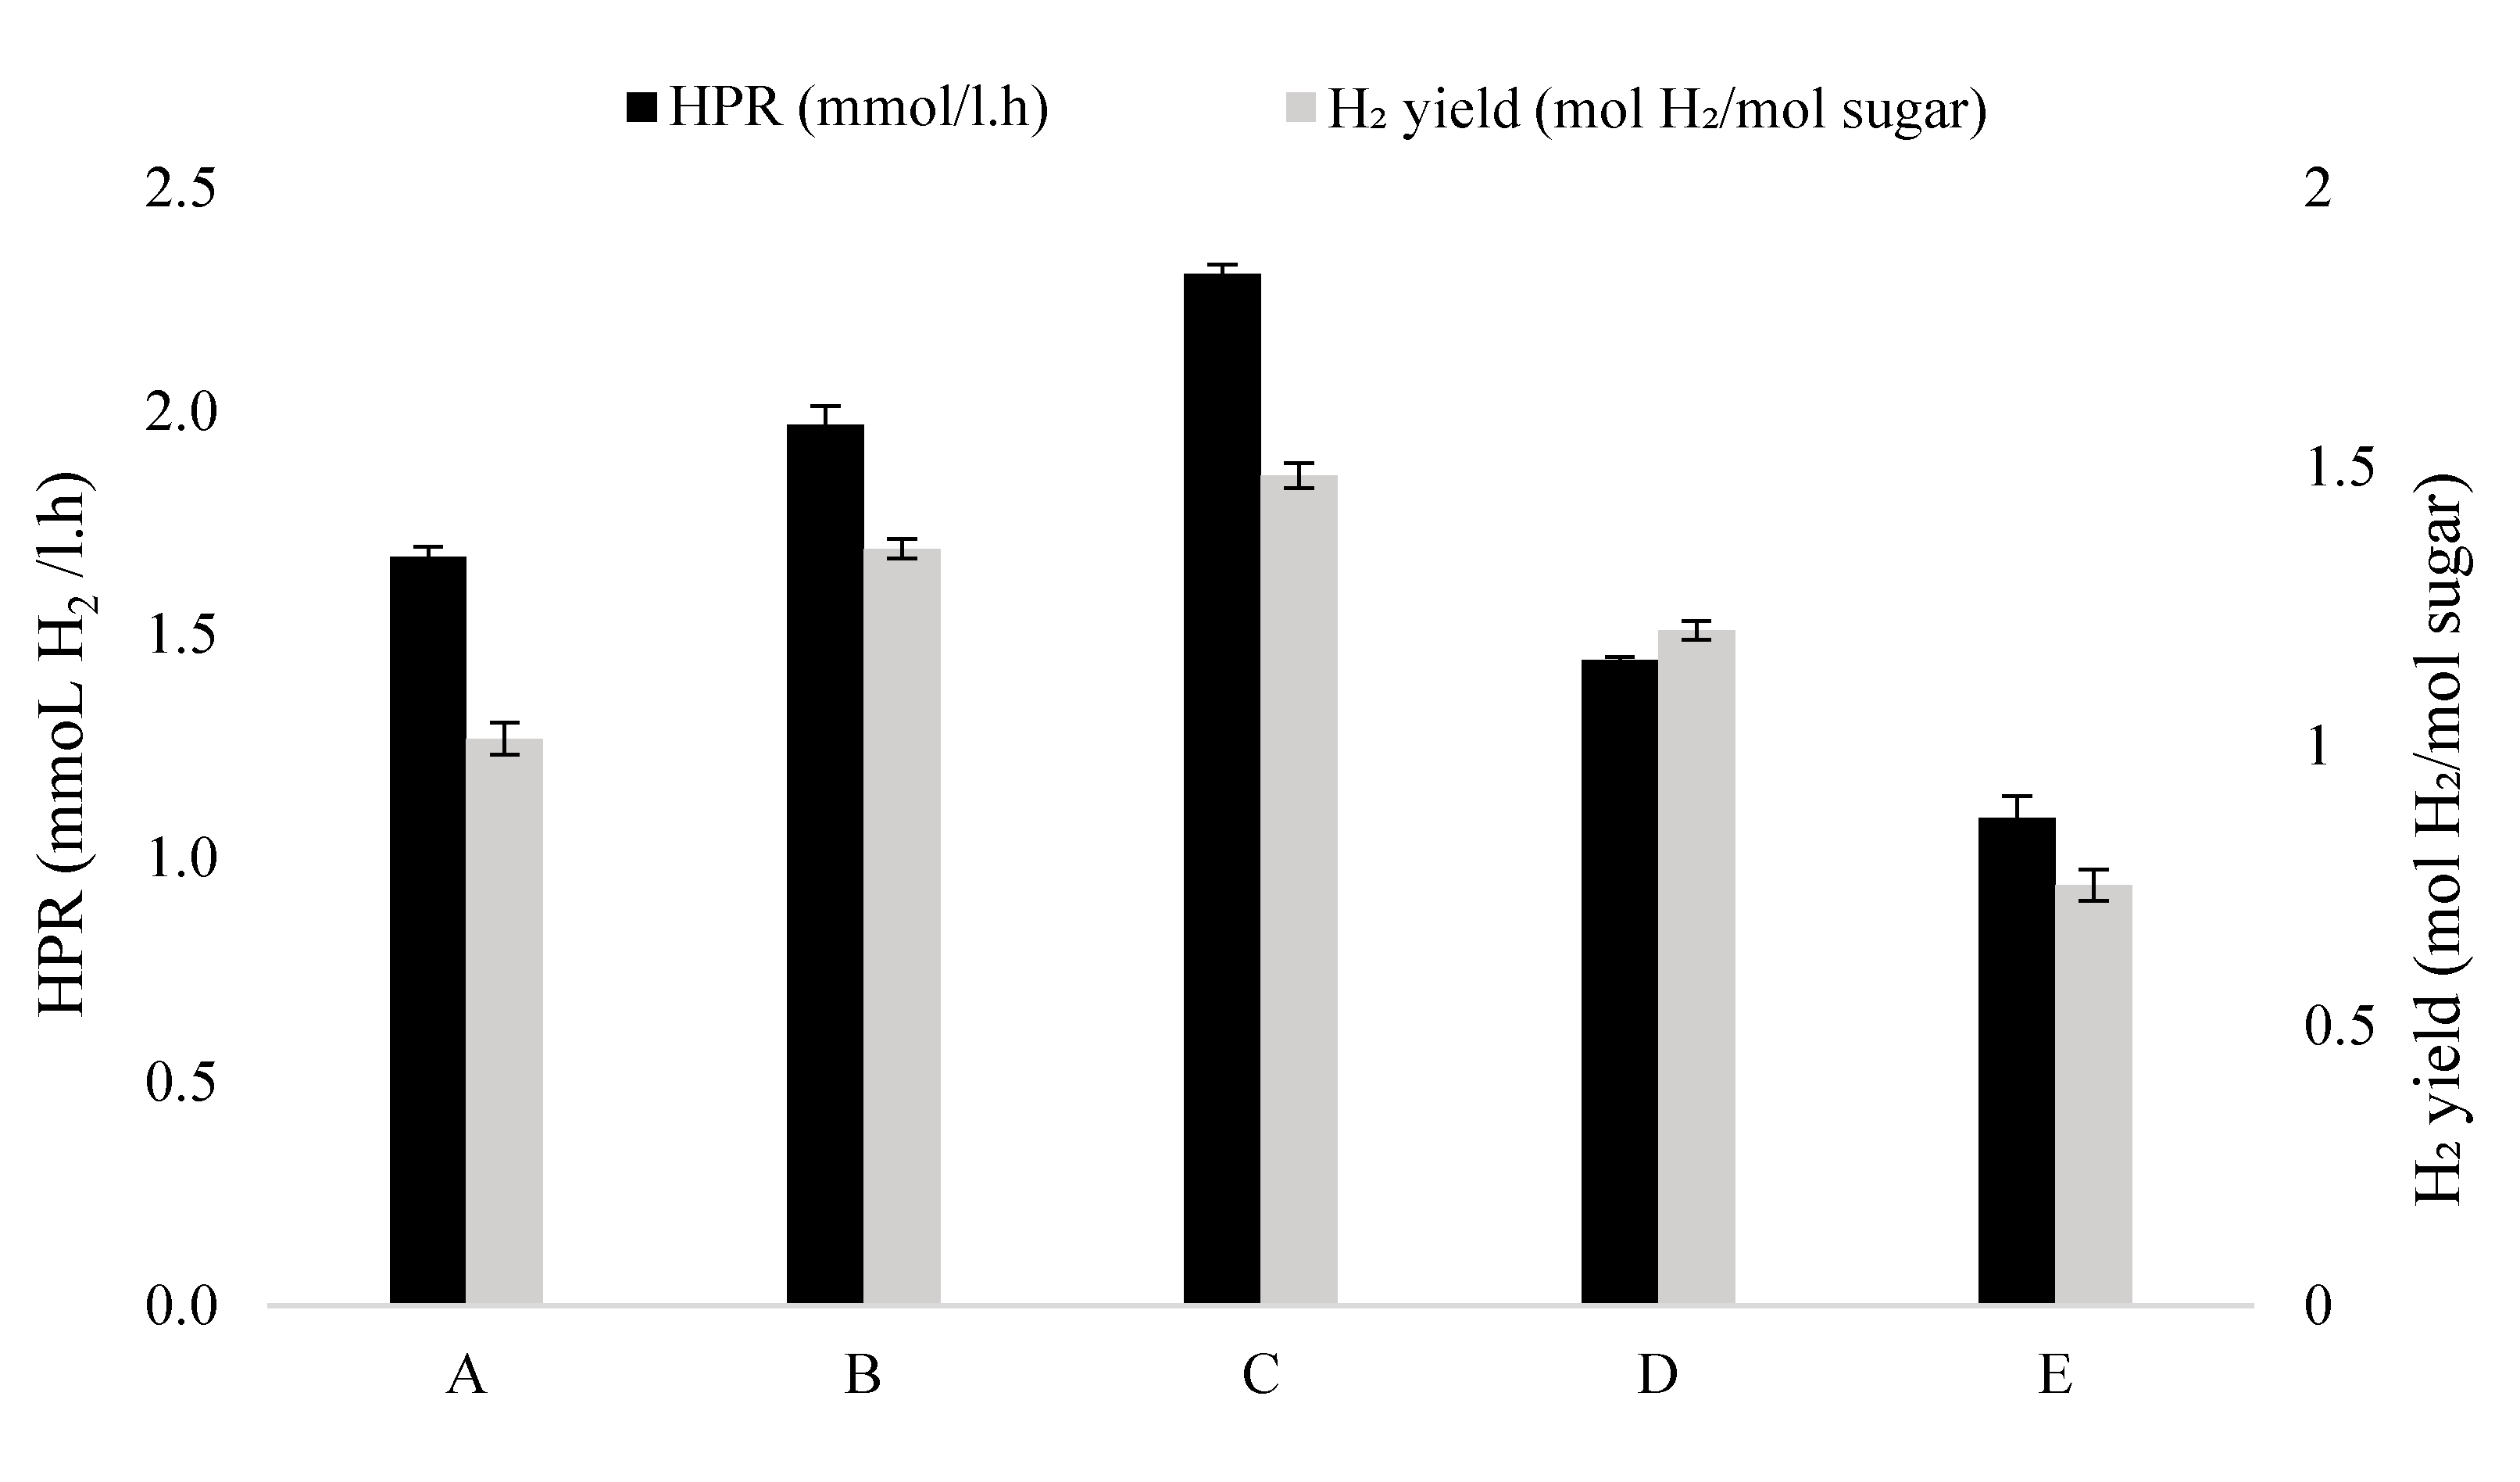
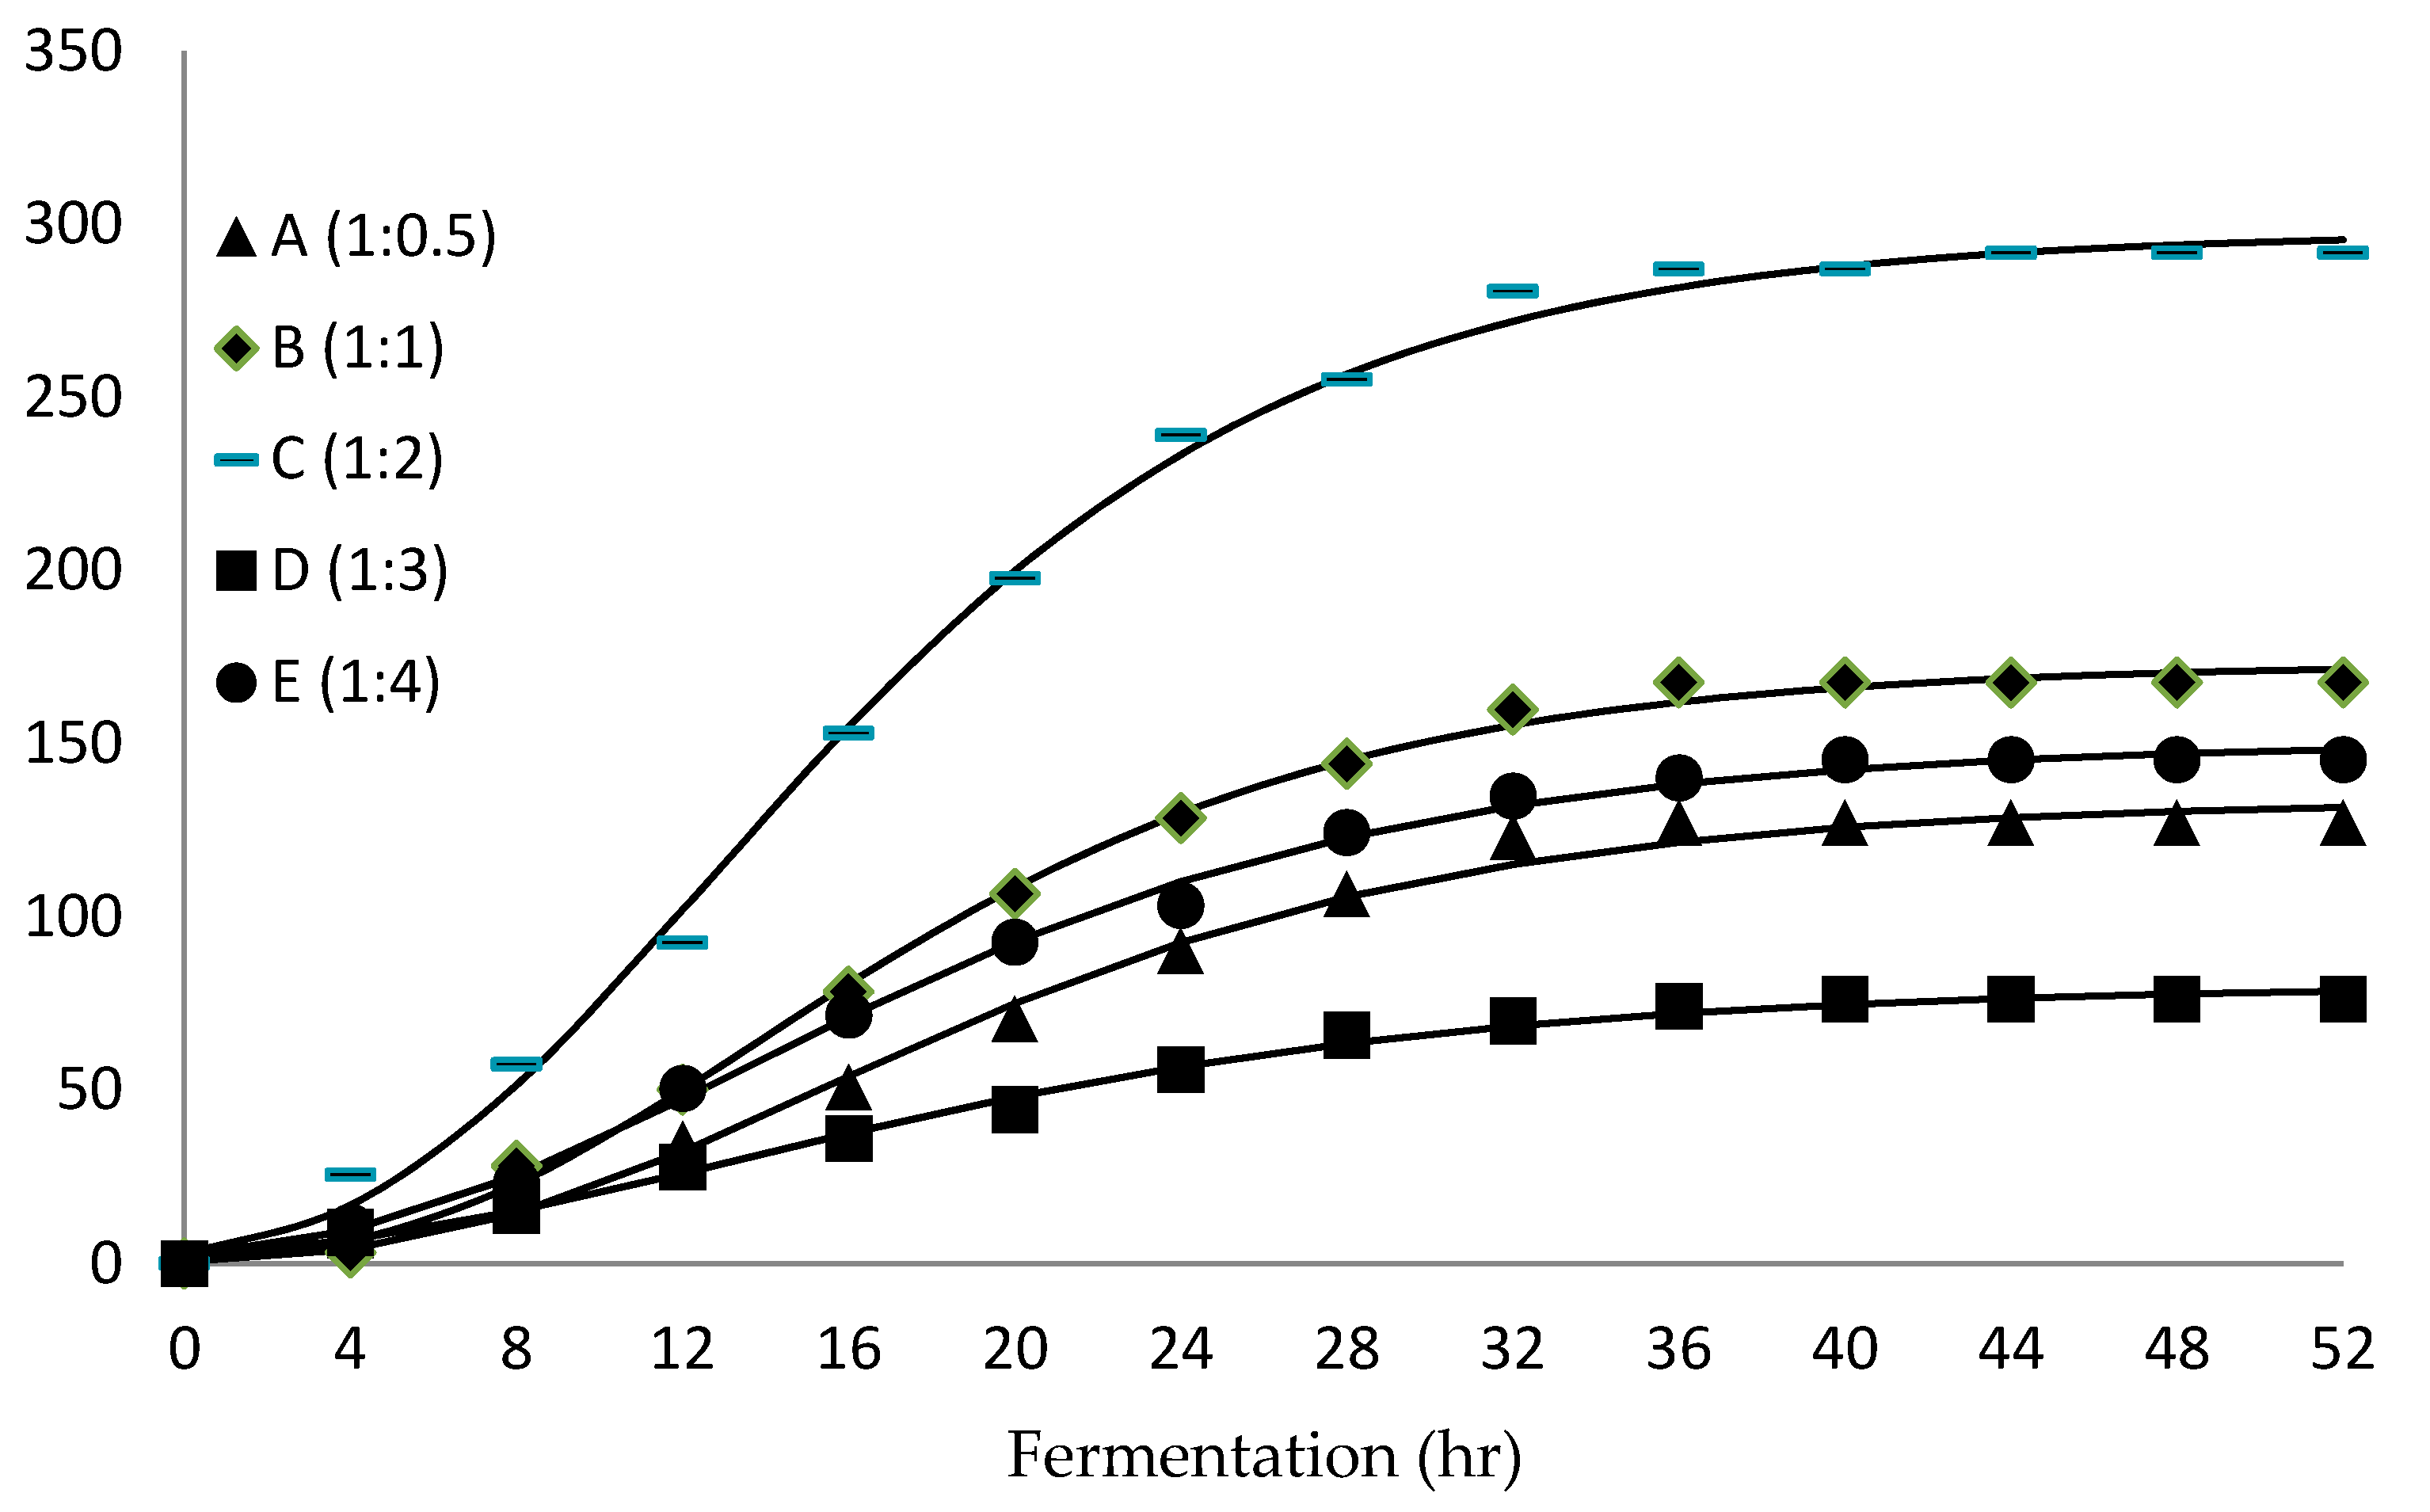
3.2. Biohydrogen Production of Immobilised Beads GAC–Alg

The different concentrations of alginate (Alg) ratios were added to GAC to determine an optimum amount of alginate for biohydrogen production. The results of hydrogen gas produced in each run were plotted against time. From Section 3.1, the optimum result was obtained when 20 g/L amount of sugar was used as a substrate in this experiment, which was subjected to 20% w/v of GAC–Alg as immobilised beads in 200 mL working volume.
Hydrogen production using the entrapment technique as immobilised beads was evaluated. Figure 3 shows the comparison of biogas trend production for GAC–Alg beads during the acclimatisation period using a synthetic medium as a substrate. Hydrogen production started to increase at 4 h of fermentation for five different concentrations of alginate, dominantly by GAC–Alg beads at C with a ratio of 1:2.
The results of HPR (mmol H2/l.h) and hydrogen yield (mol H2/mol sugar) were plotted against different concentrations of GAC–Alg, as shown in Figure 4. It can be seen that the highest hydrogen production was found for C at the GAC–Alg ratio of 1:2, with HPR of 2.47 ± 0.47 mmol H2/l.h. The highest hydrogen yield was 2.09 ± 0.22 mol H2/mol total sugar run at C. The cell density (in VSS) of the GAC–Alg was produced at the highest value of 1.65 g/L, as compared to the density of the lowest concentration of GAC–Alg at Run A, which was only 0.48 g/L.
The trends of HPR and hydrogen yield obtained in Table 3 were comparable to the other runs that contained GAC–Alg at different ratios of B, D, E, and F. It was slightly different in terms of hydrogen yield under different concentrations of alginate, comparing the higher results of Runs B and C to Run D. It can be determined that the irregular space and porous structure present on the carrier’s surface provided the microbes with ample space to develop well, in agreement with the results obtained by [31,32]. However, the trends decreased with the increment of added alginate in Runs E and F. It shows that when surrounded by a large number of support carriers, the microbial population had some limitations to grow. Increasing the concentration of alginate did not improve the beads’ robustness, and the production of hydrogen gas was slower because a higher amount of alginate also acted as a barrier to the substrate and products [33].
The optimum ratio of GAC to alginate of 1:2 remarked the occupation of the optimal porous space of GAC–Alg immobilised beads by the microbes to promote stable biological activity for biohydrogen production. Hence, the study revealed that a combination of GAC and alginate as immobilised beads gave a positive response in bacterial immobilisation, especially in promoting the growth of hydrogen-producing bacteria during the fermentation [34]. The positive performance of the GAC–Alg beads was due to the presence of granule activated carbon inside, which acted as a support for the alginate carrier and maintained the stability of beads [21].

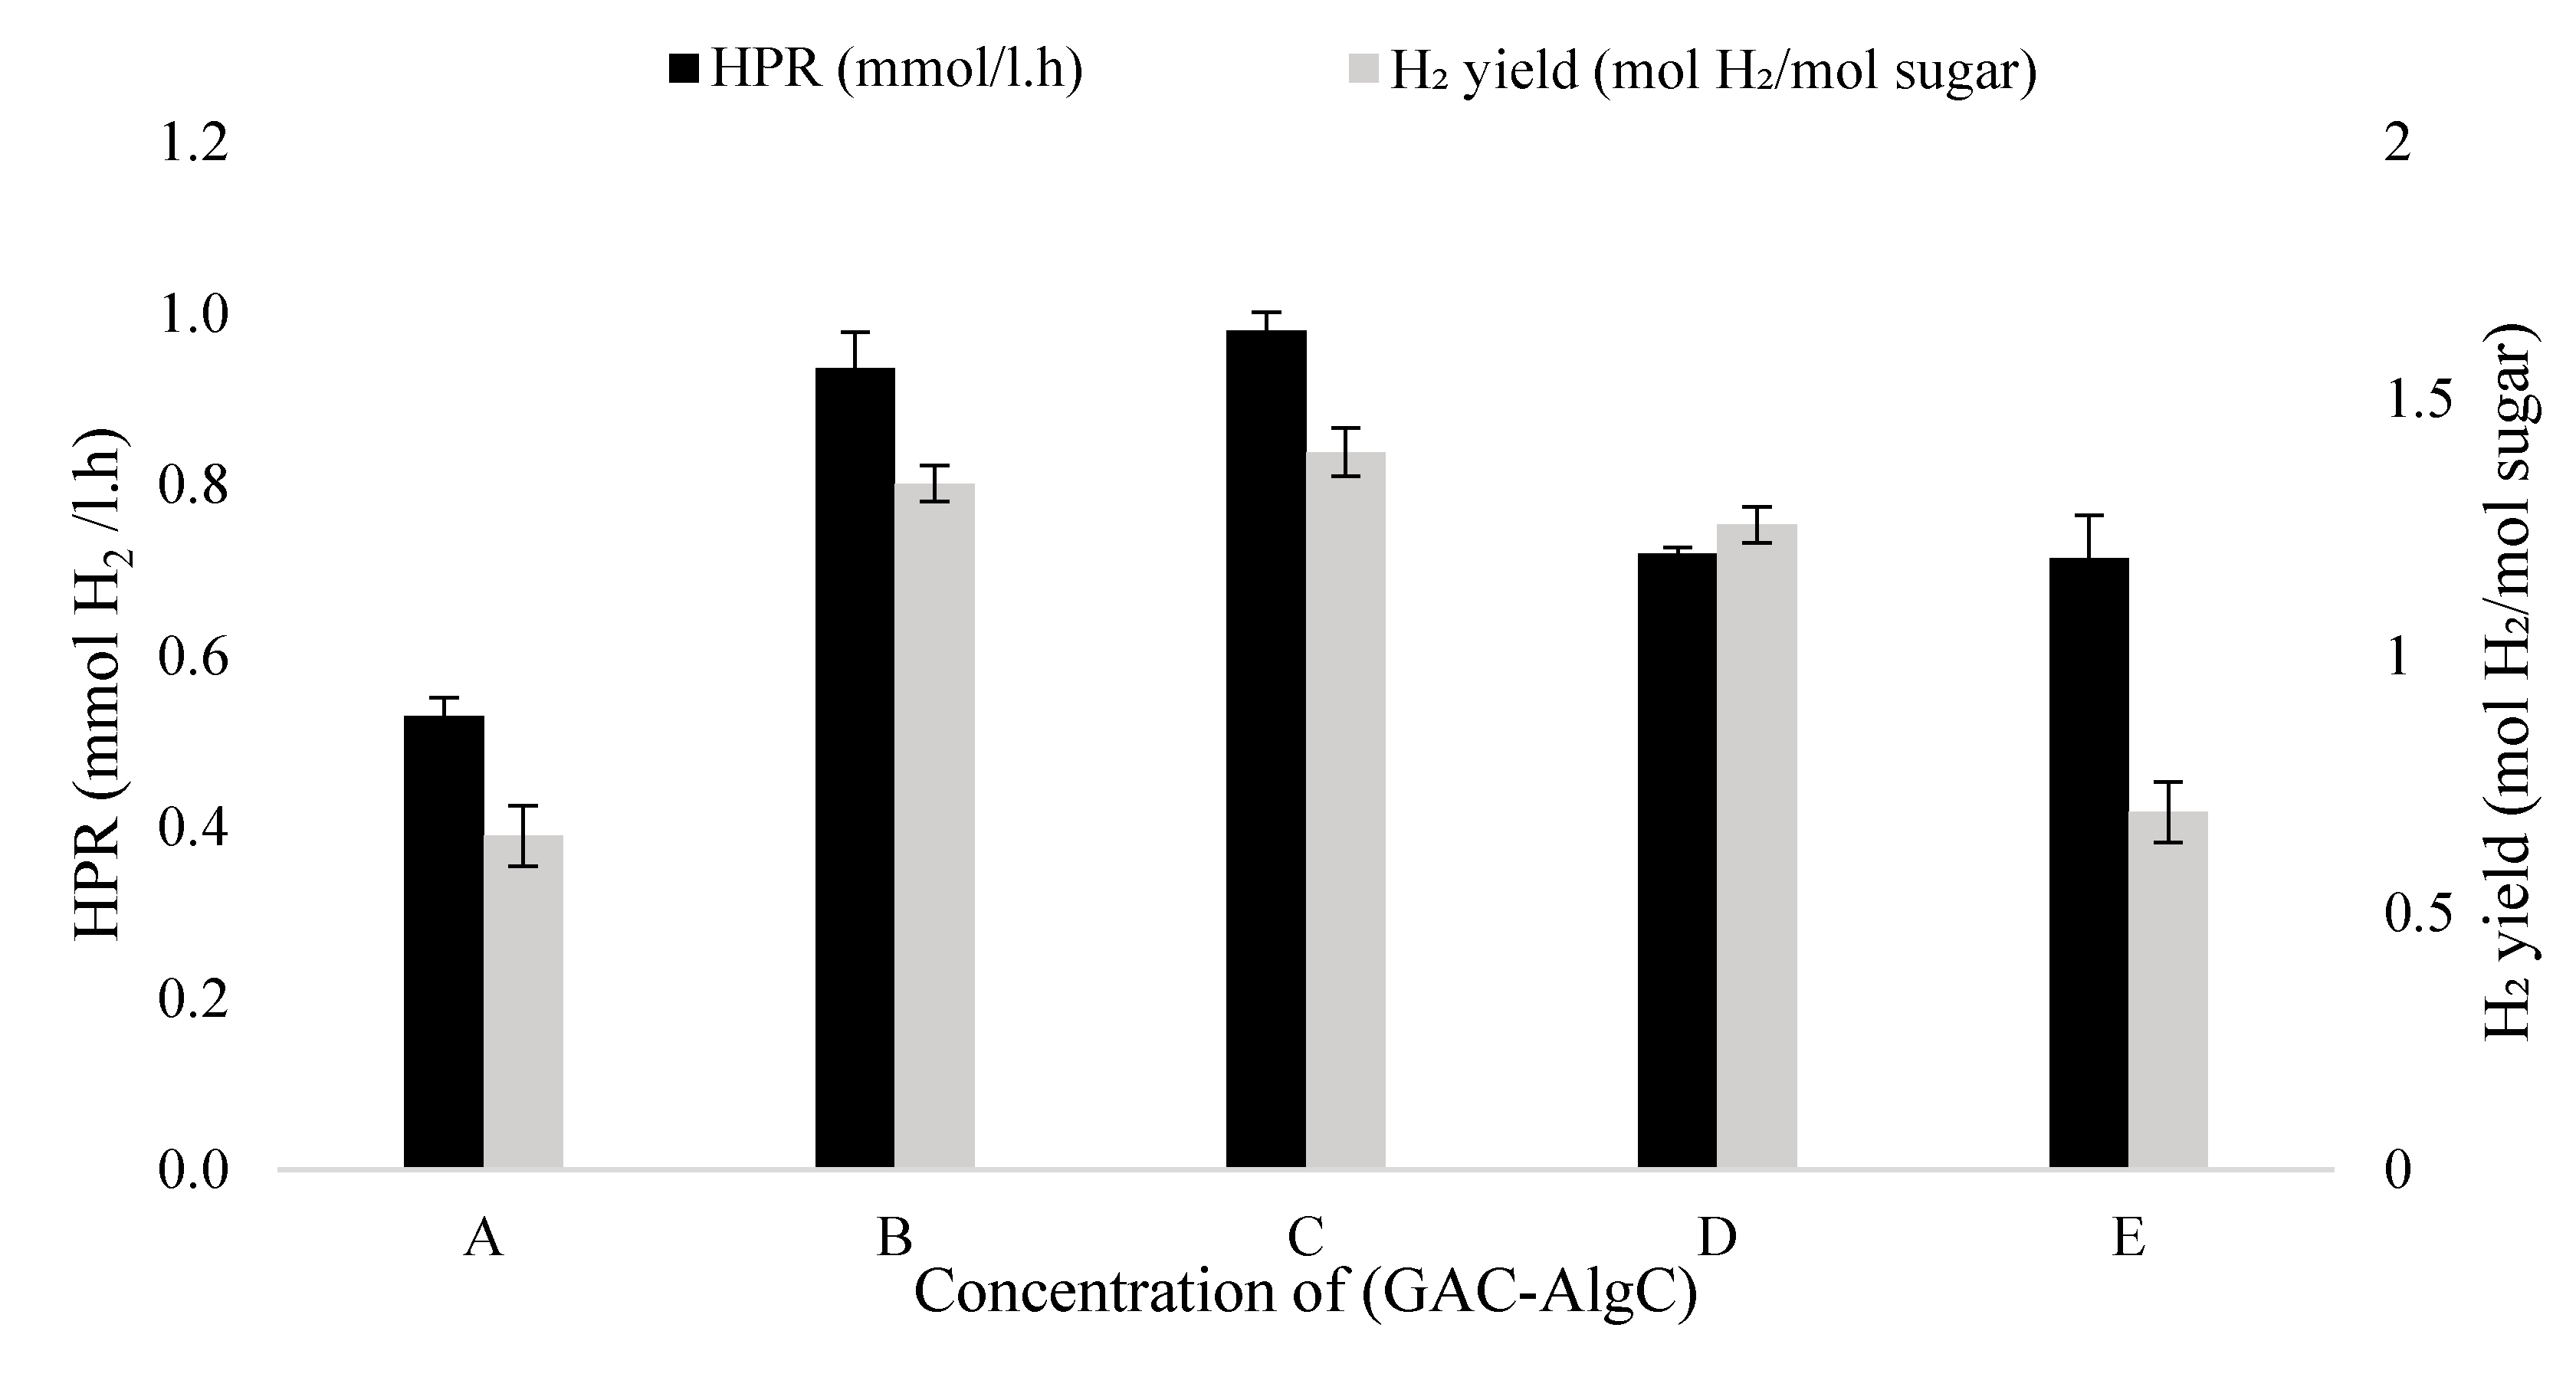
3.3. Bacteria Immobilisation in GAC–Alg Entrapped with Chitosan on Hydrogen Production

The development of entrapped GAC–Alg in chitosan was studied to investigate the adherence of GAC–Alg beads with regards to the mucoadhesion behaviour of chitosan. As reported by Szymańska and Winnicka [35], chitosan possesses good mucoadhesion behaviour resulting from the cationic properties, existence of amino groups, and free hydroxyl, which allow the polymers to interact with each other by electrostatic and hydrogen bonding. The capability of chitosan to trap the GAC–Alg beads had been thoroughly evaluated. Different concentrations of chitosan subjected to 20% w/v of GAC–AlgC as immobilisation beads in 200 mL working volume (w/v) were used. The results of the hydrogen production (mL H2) were plotted over fermentation (hr), as shown in Figure 5. It showed the comparison of hydrogen production trends for different concentrations of chitosan g/L used during the acclimatisation period, using a synthetic medium as a substrate. Hydrogen production started to increase at 4 h of fermentation and dominantly during Run C, which had a ratio of chitosan of 1:2. The consistency of hydrogen against chitosan concentration g/L was consistent after 40 h of operation.
The results of HPR (mmol H2/l.h) and hydrogen yield (mol H2/mol sugars consumed) were plotted over different concentrations of chitosan (g/L), as shown in Figure 6. The entrapment of GAC–Alg beads with varying concentrations of chitosan was measured from the evolved gas during the acclimatisation process. The results were analysed and presented in Table 4, which shows that the chitosan concentration at C with 2 g/L reached the highest level for both HPR (0.93 ± 0.05 mmol H2/l.h) and H2 yield (1.11 ± 0.35 mol H2/mol sugar consumed) with 86.63 H2 %. Meanwhile, at a lower concentration than C, which is concentration atB reached the second highest HPR of 0.85 ± 0.08 mmol H2/l.h and H2 yield of 0.97 ± 0.21 mol H2/mol total sugar with 84.79 H2 %. The beads of Run D, with 3 g/L, followed as the thirdighest HPR of 0.74 ± 0.15 mmol H2/l.h and H2 yield of 0.88 ± 0.12 mol H2/mol total sugar with 64.54 H2%. HPR of ratios A 0.5 g (as the lowest concentration) and E (as the highest concentration, with 4 g) was proportionate between those two and was recognised as causing lower hydrogen production than Concentrations B, C, and D after 52 h of operation, individually at 0.58 ± 0.20 and 52.94, and 0.70 ± 0.20 and 76.43 (mmol H2/l.h; H2%).
The comparison of these findings revealed that the immobilised beads of Run C reached the highest hydrogen production and they were examined as the optimum concentration for microbial support matrix in immobilisation bead development. The work by Damayanti et. al [36] reported that among a variety of chitosan applications, chitosan in encapsulation technology is widely applied whether as a second-layer coating or in combination with other polymers. It was also reported that chitosan could improve the stability of the capsules. In other studies reported by Žuža et al. [16], it was claimed that the mechanical confidence of alginate beads increased up to seven days when coated with chitosan, which significantly contributes to the preservation of carrier strength during fermentation. The formation of the shape of cell-immobilised GAC, cell-immobilised GAC-Alg and GAC-AlgC were presented in Figure 7. Figure 7a image of cell-immobilised into GAC, (b) the shape of cell-immobilised GAC with alginate and (c) the shape of cell- immobilised GAC-Alginate beads with chitosan. It can be seen both GAC-Alg and GAC-Alg coated with chitosan were not much spherical. The GAC covered with alginate were transparent, while the beads coated with chitosan have slightly cloudy of physical appearance. Generally, the differences in the shape of beads were caused by the gravity and surface tension imbalance when the beads dropped from the syringe. The beads shape formation also were affected by the viscosity of alginate and chitosan, and distance of dropper to gel solution [34]. This is a new method introduced to improve the stability of biofilm formation and adsorption capacity as well as enhanced the mechanical strength of the carrier, thus enhanced the hydrogen yield production. Table 5 summarizes the comparison of a similar study on the efficiency of different types of immobilisation beads on hydrogen production. Table 5 shows that the carbon source and fermentation process were different to produce hydrogen gas. In the present work, the highest hydrogen yield was 2.09 mol H2 /mol sugar obtained from GAC-Alg immobilised beads. It should be noted that the type of fermentation process and carbon source can always influence the results [36]. Likewise, the selection of the materials to be used as immobilising carriers also playing an important role in biohydrogen production, in term of high resistance towards temperature, mechanical strength as well as the possibility to recycle the immobilised carriers. Hence, in this research, attached-biofilm of hydrogen-producing bacteria on GAC from adsorption approach are stabilised using alginate entrapped with chitosan to form stable cells immobilised beads as a novel approach.

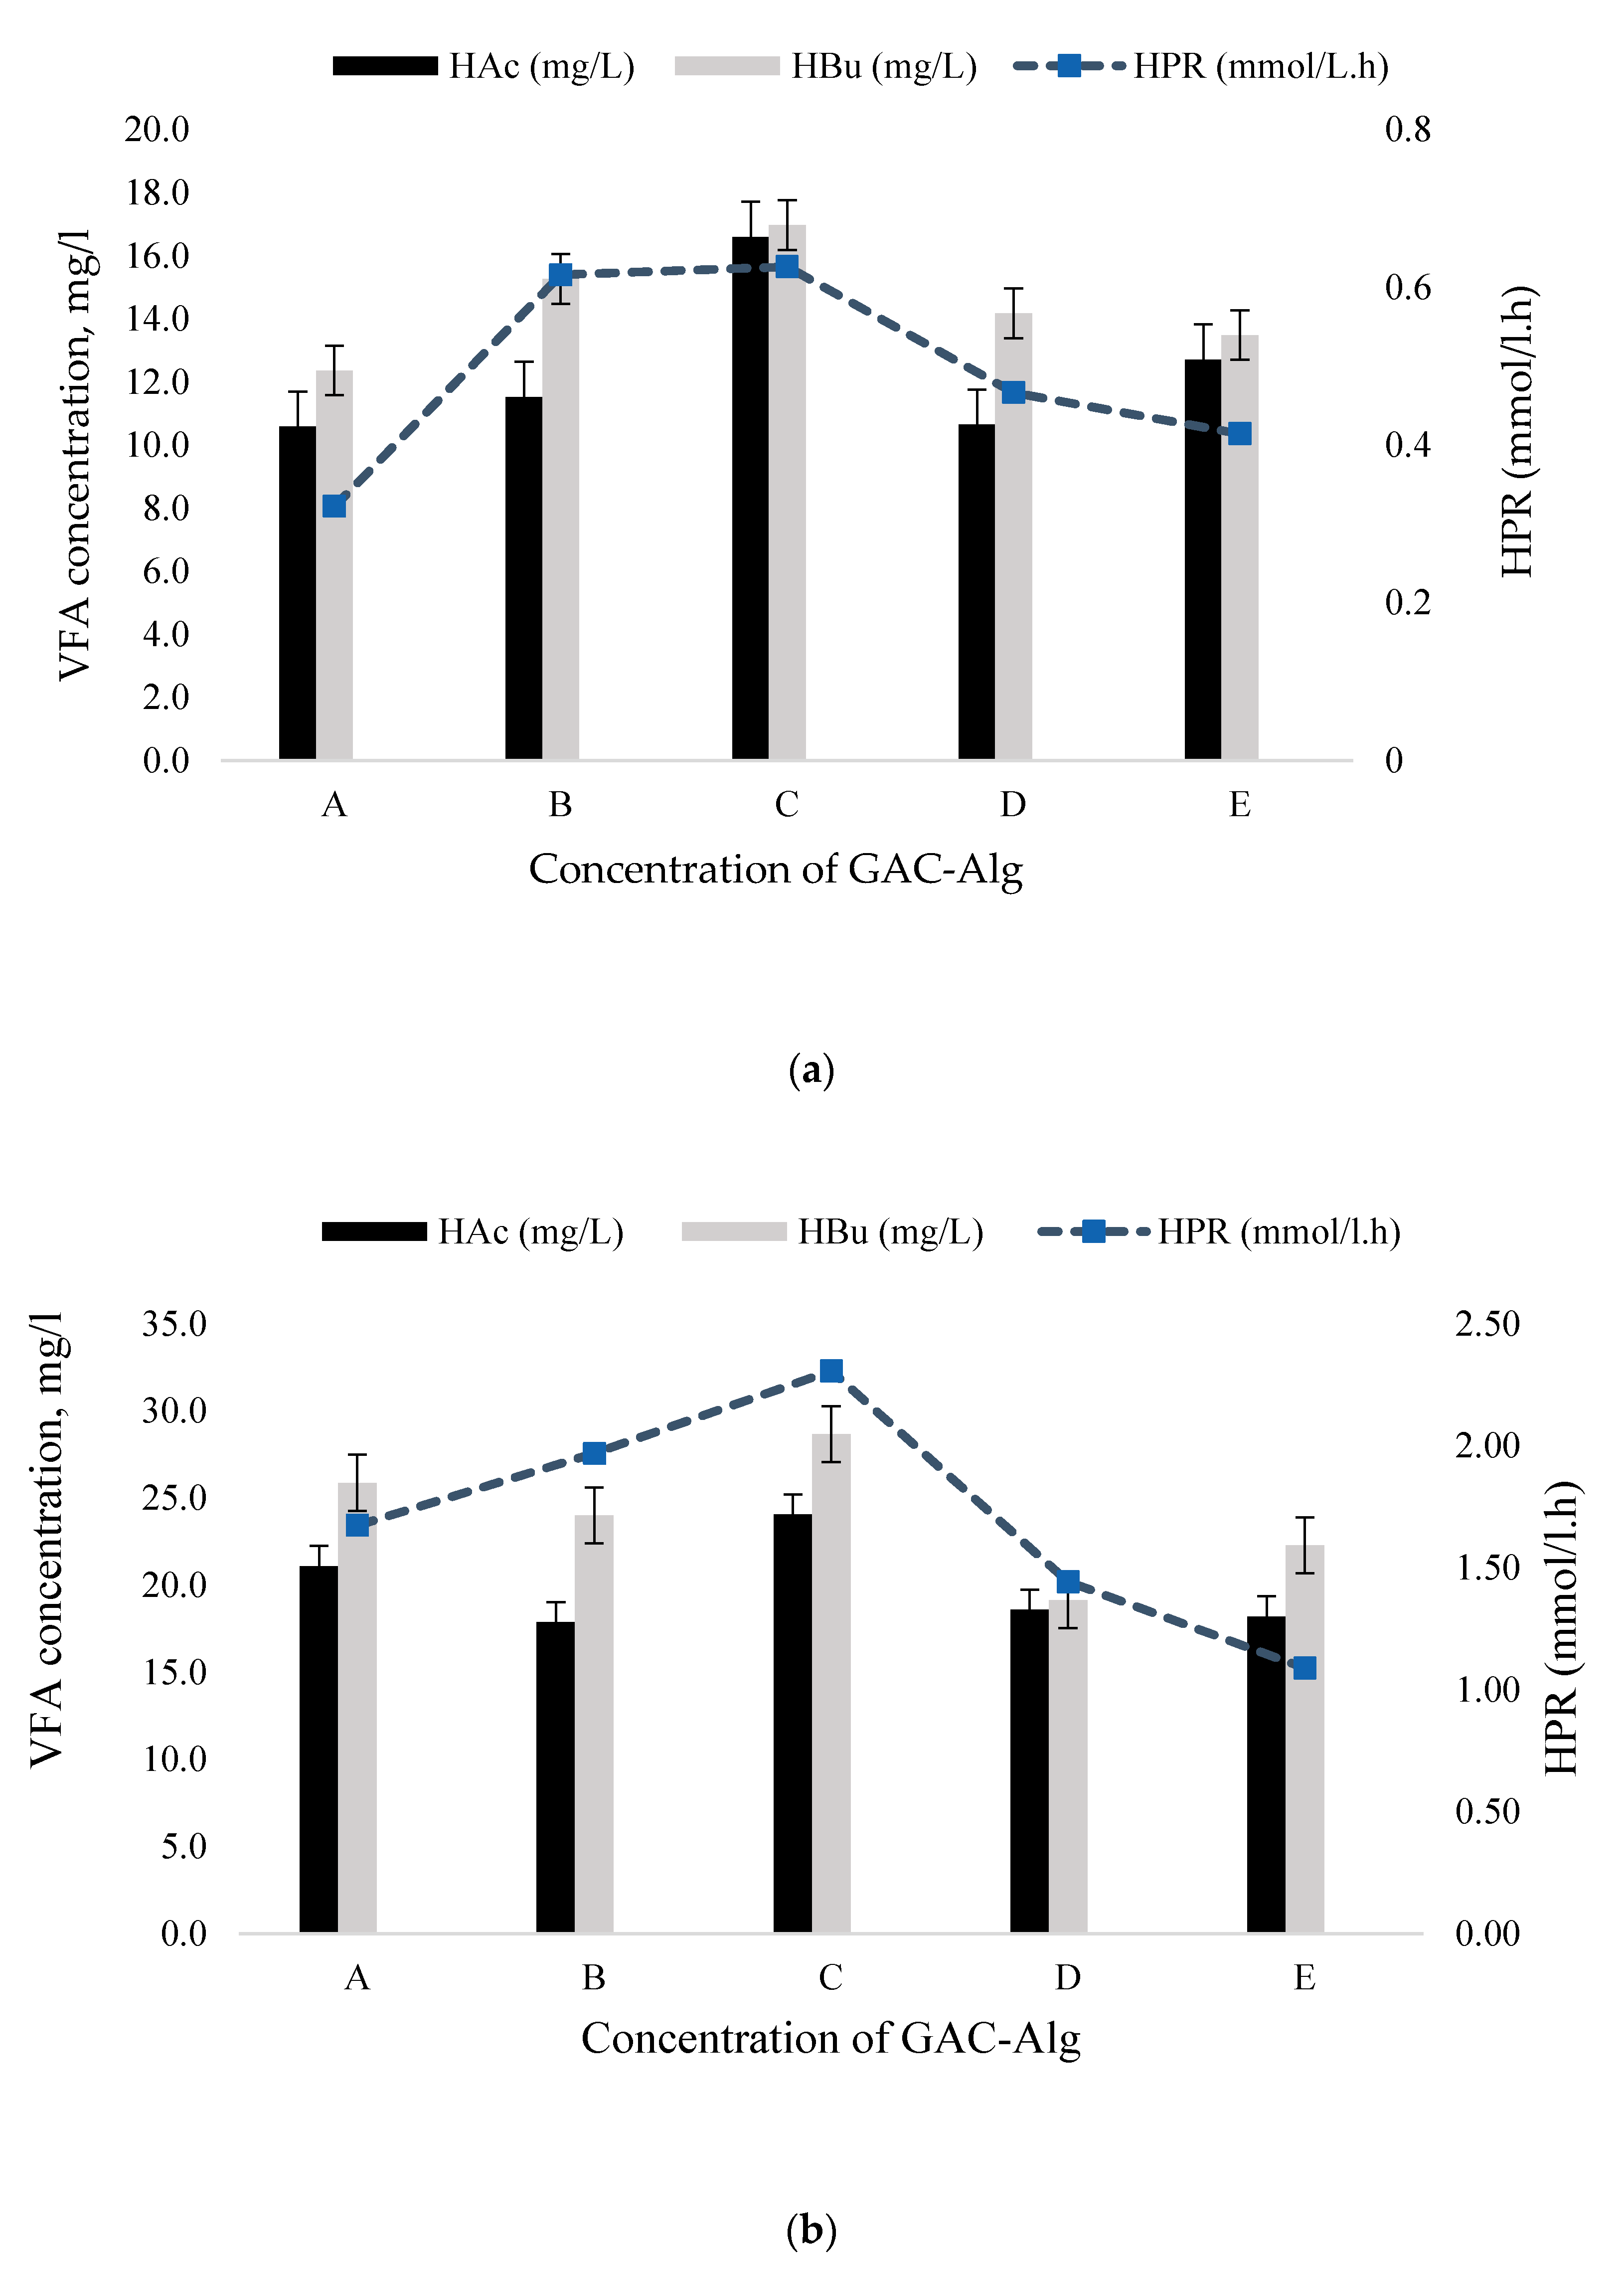
3.4. Effect of Alginate and Chitosan Concentration on Volatile Fatty Acid Production

Hydrogen production performance is usually monitored collectively with the formation of acetic acid (HAc) to butyric acid (HBu) and total volatile fatty acids (TVFAs). In this anaerobic hydrogen production, the concentration of TVFAs and their relative proportions were effectively used as indicators. The plot between HPR (mmol H2/l.h) and volatile fatty acid (VFA) concentration (mg/L) for GAC-Alg- and GAC-AlgC-immobilised beads in batch fermentation is presented in Figure 8a for GAC-Alg and Figure 8b for GAC-AlgC. The summary of total volatile fatty acids at various concentrations of GAC-Alg and GAC-AlgC shown in Table 6
Glycolysis is the gateway for the metabolic process of cells that convert glucose into pyruvate as an intermediate metabolite. Pyruvate reacts to acidogenesis and generates VFAs, including butyric acid, acetic acid, and also propionic acid under anaerobic conditions [34]. Theoretically, the maximum amount of H2 yields when all glucose has been converted to HAc is 4 mol H2 per mole of glucose in Equation (2), while HBu is 2 mol H2 per glucose in Equation (3) [44].
C6H12O6 + 2H2O → 2CH3COOH + 4H2 + 2CO2
C6H12O6 + 2H2O → CH2CH2CH2COOH + 2H2+ 2CO2
It was found that HBu and HAc were the primary volatile fatty acids that were produced, while propionate (HPr) contributed to negligible amounts. The result of GAC–Alg dominated, with 23.99 ± 3.60 mM of HBu and 19.96 ± 2.61 mM of HAc found at Run C. For GAC–AlgC, the result was dominated by the ratio of 1:2, with 14.45 ± 1.76 mM of HBu and 12.41 ± 2.49 mM of HAc. Hydrogen production was slightly increased as the concentration of alginate increased from Runs A to C as Hbu and HAc increased. These results are close to similar metabolic pathways of hydrogen production found by [45,46], who stated that when the composition of HAc and HBu increases, the hydrogen production efficiency should also increase.
Based on these findings, it was found that HBu and HAc were eminently affected by hydrogen production in Equations (2) and (3). The highest range found in butyrate acid proposed that the biohydrogen production from a mixture of xylose and glucose was of a butyrate type in Equation (3). Hence, the investigation suggests that butyrate is significantly affected by glucose and xylose consumption rather than acetate, as reported by [45].

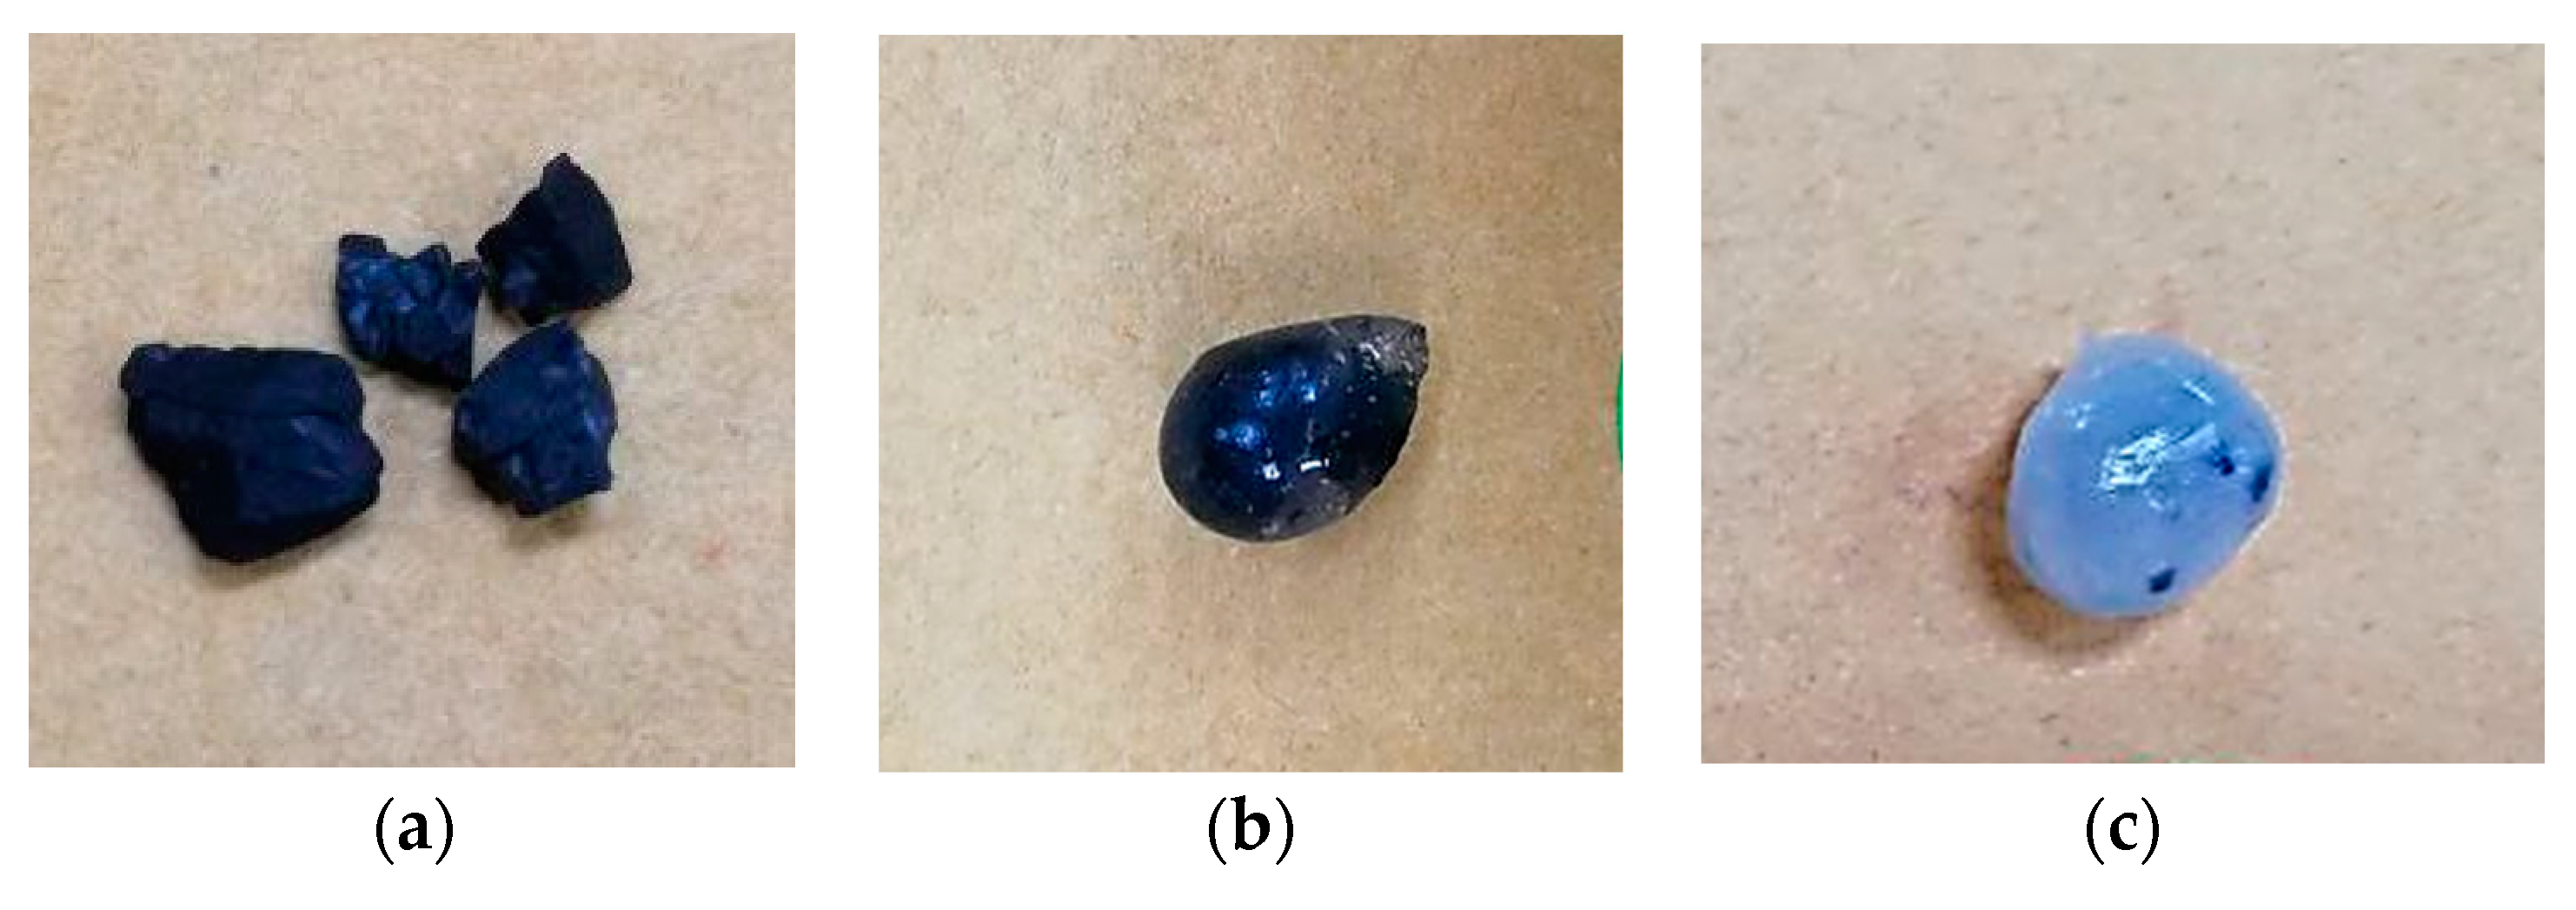
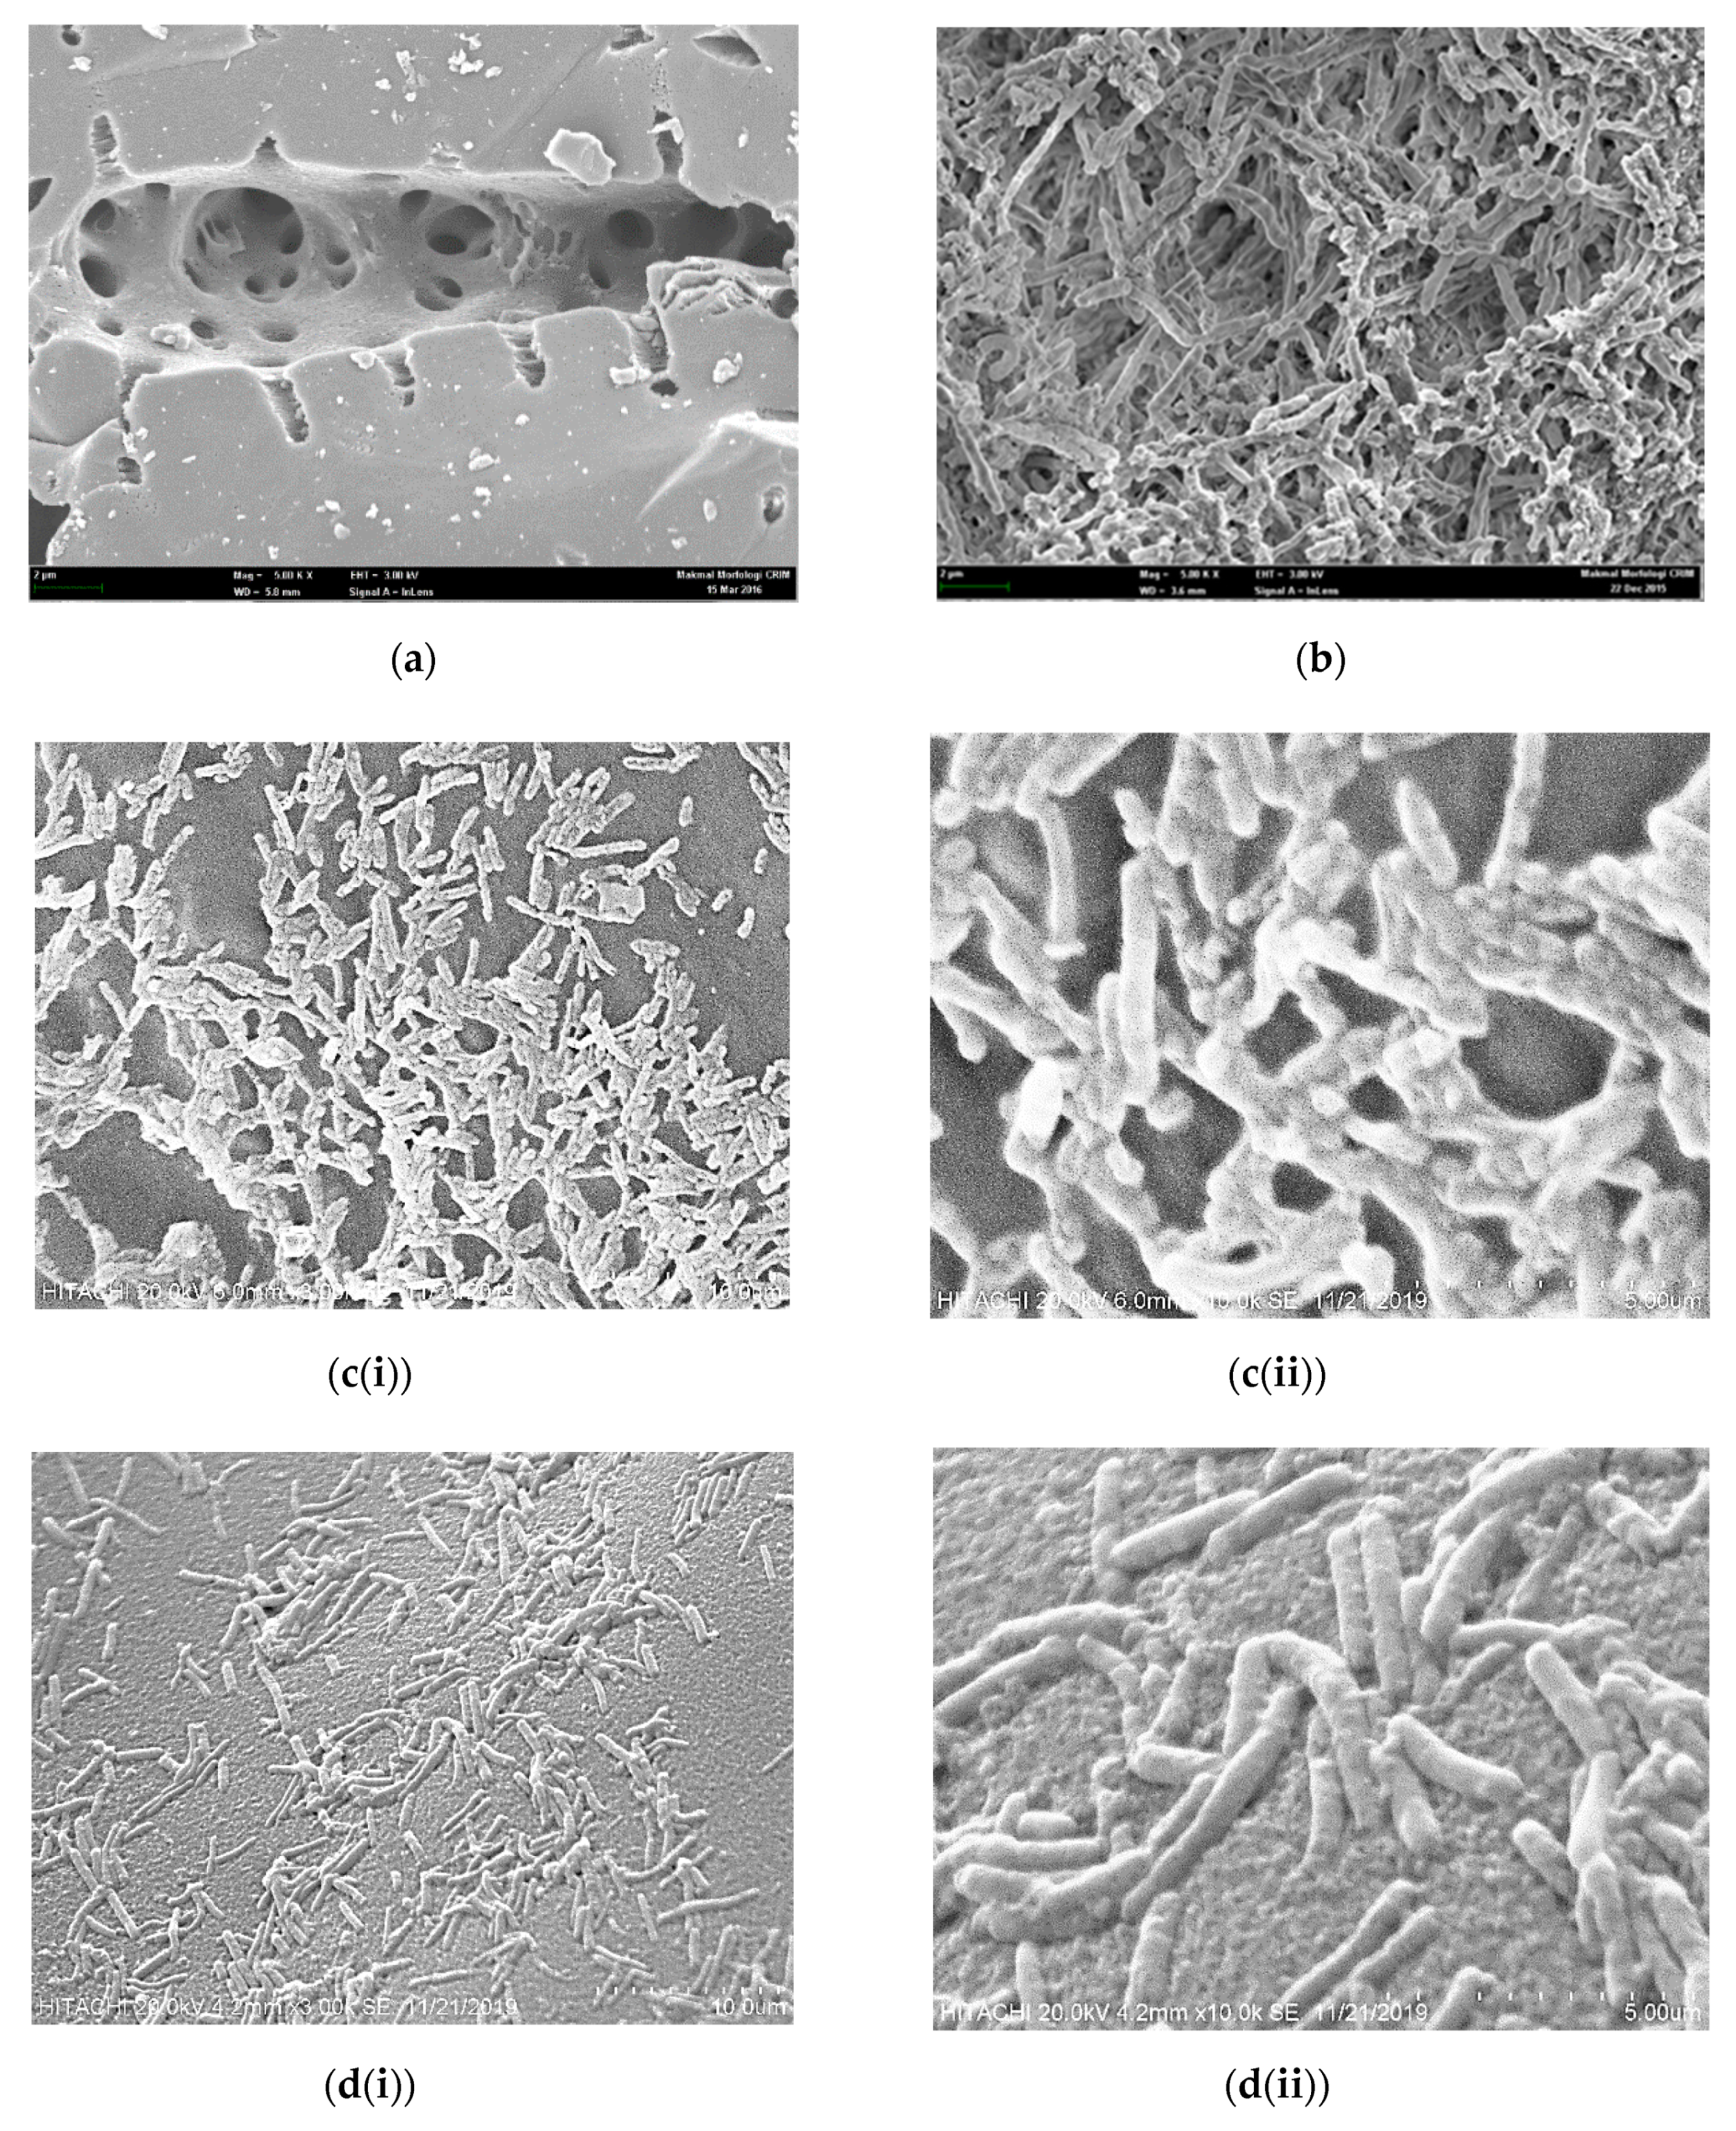
3.5. SEM of Immobilized Beads

Furthermore, this study observed the microbial cell culture on carriers using a scanning electron microscope (SEM). GAC as a primer for cell attachment and colonisation was observed before and after acclimatisation. The image of the micropores of clean GAC is shown in Figure 9a, while the image of Figure 9b shows the microbial cells that have successfully attached to the GAC surface. Both of the images were captured using a field emission scanning electron microscope (FESEM) at 10.00 k magnification [27]. The porosity of GAC was provided with a pleasant environment and conditions for cells to adhere themselves firmly inside the pores, thus helping the cells to grow and form the population. This overcomes the problem of self-detachment of hydrogen-producing cells during repeated batch fermentation in the culture medium [4].
A significant number of microbial cells were observed to have successfully immobilised into the alginate surface, as shown in Figure 9c(i), and agglomerated each other (Figure 9c(ii)). These features indicate that the alginate does not provide toxic and non-nutritive environments towards the microbial cells, but gives them a suitable place to grow dominantly, besides protecting the cells inside the beads. A part of the entrapment of cells into alginate, the image of the predominantly rod-shaped microbial species, was captured after the fermentation process, which can be clearly seen in Figure 9d(ii). The rod-shaped bacterial cells appeared to be the dominant consortium on the GAC based on their morphologic properties. This study is in agreement with a previous study by Jamali et al. [21]. It has been identified that the dominant species of anaerobic hydrogen producers is Thermoanaerobacterium thermosaccharolyticum, which is stated to have spores and is rod-shaped and Gram-positive [21,28]. A similar source of inoculum was used in this research as this species has been recognised as having a high propensity to be cultivated at an optimal temperature of 50–60 °C and a pH of approximately 5.5 to 6.5. This bacterium played a significant role in the production of butyric acid, acetic acid, and hydrogen. This research is supported by [21], where Thermoanaerobacterium thermosaccharolyticum has been documented to be effective hydrogen producers of xylose and glucose, with butyrate and acetate as the main byproducts of fermentation in a synthetic medium. Thermoanaerobacterium thermosaccharolyticum has also been documented as capable of fermenting a broad variety of carbohydrates and complex sugars that are present in almost all wastewater [47]. The accumulation of microbial cells around the GAC–AlgC carrier surface membrane, as illustrated in Figure 9d(ii), explains the right conditions of the carrier, allowing the retention of the biological activity of the encapsulated cells. There was a significantly high mortality of cells when using chitosan as an external encapsulation agent. The hydrophobicity behaviour of chitosan was favoured by the undesired protein adsorption and denaturation process. Moreover, the diffusion issues also affected the molecular traffic of substrates and products of the microbial enzymatic process between the outsides and the insides of the carrier [48,49]. Generally, high microbial loadings hosted within the carrier showed that the cells are protected from microbial attack and physical or mechanical damage. The high porosity of the microbial matrix support will provide the right places for cells to grow and immobilise. The suitable chemical nature of carriers also can help the cells to extend as well as their protein can be easily accommodated within the channel. Nevertheless, the unavoidably fragile and prone-to-grinding environment of the carrier needs to be enhanced with optimal entrapment agents.

4. Conclusions

This work has successfully developed the entrapment of immobilised GAC with alginate and chitosan in the batch fermentation system from xylose and glucose fermentation. It was found that concentrations of alginate- and chitosan-immobilised beads at 2 g/L presented the highest amount of hydrogen productivity. The results showed that the immobilised beads maintained their stability in hydrogen production after 40 h; a consistent HPR of 2.47 ± 0.47 mmol H2/l.h and H2 yield of 2.09 ± 0.22 mol H2/mol total sugar was found with GAC–Alg beads. The consistent HPR obtained with GAC–AlgC beads was 0.93 ± 0.05 mmol H2/l.h, along with H2 yield of 0.88 ± 0.12 mol H2/mol total sugar. In accordance with all of the significant results, it is emphasised that the acclimatisation of GAC–Alg and GAC–AlgC beads as support carriers ensures the continuity of HPR and enhances cultural density in the handling of synthetic wastewater for thermophilic hydrogen production.

Author Contributions

Conceptualisation, N.S.J., S.S.M., and N.F.D.R.; methodology, N.F.D.R. and S.S.M.; validation, N.F.D.R.; investigation, N.F.D.R.; resources, N.S.J.; writing—original draft preparation, N.F.D.R.; visualization, S.F.I.; software, S.I.S.; supervision, N.S.J., N.A., and M.F.I.; project administration, N.S.J. All authors have read and agreed to the published version of the manuscript.

Funding

This research was funded by the Ministry of Education Malaysia (MOE) under the Fundamental Research Grant Scheme (FRGS) through the vot code of 5540208 (Ref: FRGS/1/201/STG05/UPM/02/28) towards the success of this study.

Acknowledgments

These authors would like to express their gratitude to all the laboratory staff at the Department of Chemical and Environmental Engineering, Universiti Putra Malaysia, for assisting this research.

Conflicts of Interest

The authors declare no conflict of interest.

References

  1. Kim, J.K.; Nhat, L.; Chun, Y.N.; Kim, S.W. Hydrogen production conditions from food waste by dark fermentation with Clostridium beijerinckii KCTC 1785. Biotechnol. Bioprocess Eng. 2008, 13, 499–504. [Google Scholar] [CrossRef]
  2. Hu, B.; Liu, Y.; Chi, Z.; Chen, S. Biological hydrogen production via bacteria immobilized in calcium alginate gel beads. Biol. Eng. Trans. 2007, 1, 25–37. [Google Scholar] [CrossRef]
  3. Liu, X.; Yu, X. Enhancement of Butanol Production: From Biocatalysis to Bioelectrocatalysis. ACS Energy Lett. 2020, 5, 867–878. [Google Scholar] [CrossRef]
  4. Jamali, N.S.; Jahim, J.; Nor, W.; Wan, R.; Abdul, P.M. Particle size variations of activated carbon on biofilm formation in thermophilic biohydrogen production from palm oil mill effluent. Energy Convers. Manag. 2016, 141, 354–366. [Google Scholar] [CrossRef]
  5. Mohamad, N.R.; Marzuki, N.H.C.; Buang, N.A.; Huyop, F.; Wahab, R.A. An overview of technologies for immobilization of enzymes and surface analysis techniques for immobilized enzymes. Biotechnol. Biotechnol. Equip. 2015, 29, 205–220. [Google Scholar] [CrossRef]
  6. Mishra, P.; Krishnan, S.; Rana, S.; Singh, L.; Sakinah, M.; Ab Wahid, Z. Outlook of fermentative hydrogen production techniques: An overview of dark, photo and integrated dark-photo fermentative approach to biomass. Energy Strategy Rev. 2019, 24, 27–37. [Google Scholar] [CrossRef]
  7. Singh, L.; Wahid, Z.A.; Siddiqui, M.F.; Ahmad, A.; Hasbi, M.; Rahim, A.; Sakinah, M. Biohydrogen production from palm oil mill effluent using immobilized Clostridium butyricum EB6 in polyethylene glycol. Process Biochem. 2013, 48, 294–298. [Google Scholar] [CrossRef] [Green Version]
  8. Wu, S.-Y.; Lin, C.-N.; Chang, J.-S. Hydrogen Production with Immobilized Sewage Sludge in Three-Phase Fluidized-Bed Bioreactors. Biotechnol. Prog. 2003, 19, 828–832. [Google Scholar] [CrossRef]
  9. Smidsrød, O.; Skjåk-Bræk, G. Alginate as immobilization matrix for cells. Trends Biotechnol. 1990, 8, 71–78. [Google Scholar] [CrossRef]
  10. Wu, S.-Y.; Lin, C.-N.; Chang, J.-S.; Lee, K.-S.; Lin, P.-J. Microbial Hydrogen Production with Immobilized Sewage Sludge. Biotechnol. Prog. 2002, 18, 921–926. [Google Scholar] [CrossRef]
  11. Sekoai, P.T.; Awosusi, A.A.; Yoro, K.O.; Oloye, O.; Ayeni, A.O.; Bodunrin, M.; Thabang, P.; Awosusi, A.A.; Yoro, K.O.; Oloye, O.; et al. Critical Reviews in Biotechnology Microbial cell immobilization in biohydrogen production: A short overview. Crit. Rev. Biotechnol. 2017, 38, 157–171. [Google Scholar] [CrossRef]
  12. Sekoai, P.T.; Yoro, K.O.; Bodunrin, M.O.; Ayeni, A.O.; Daramola, M.O. Integrated system approach to dark fermentative biohydrogen production for enhanced yield, energy efficiency and substrate recovery. Rev. Environ. Sci. Bio Technol. 2018, 17, 501–529. [Google Scholar] [CrossRef]
  13. Ngah, W.S.W.; Fatinathan, S. Adsorption of Cu (II) ions in aqueous solution using chitosan beads, chitosan-GLA beads and chitosan-alginate beads. Chem. Eng. J. 2008, 143, 62–72. [Google Scholar] [CrossRef]
  14. Shu, X.; Zhu, K. The release behavior of brilliant blue from calcium-alginate gel beads coated by chitosan: The preparation method effect. Eur. J. Pharm. Biopharm. 2002, 53, 193–201. [Google Scholar] [CrossRef]
  15. Overgaard, S.; Scharer, J.M.; Moo-Young, M.; Bols, N.C. Immobilization of hybridoma cells in chitosan alginate beads. Can. J. Chem. Eng. 1991, 69, 439–443. [Google Scholar] [CrossRef]
  16. Žuža, M.G.; Obradović, B.M.; Knežević-Jugović, Z.D. Hydrolysis of Penicillin G by Penicillin G Acylase Immobilized on Chitosan Microbeads in Different Reactor Systems. Chem. Eng. Technol. 2011, 34, 1706–1714. [Google Scholar] [CrossRef]
  17. Stojkovska, J.; Kostić, D.; Jovanović, Ž.; Vukašinović-Sekulić, M.; Mišković-Stanković, V.; Obradović, B. A comprehensive approach to in vitro functional evaluation of Ag/alginate nanocomposite hydrogels. Carbohydr. Polym. 2014, 111, 305–314. [Google Scholar] [CrossRef]
  18. Obradović, N.S.; Krunić, T.Ž.; Damnjanović, I.D.; Vukašinović-Sekulić, M.S.; Rakin, M.B.; Rakin, M.P.; Bugarski, B.M. Influence of whey proteins addition on mechanical stability of biopolymer beads with immobilized probiotics. Tehnika 2015, 70, 397–400. [Google Scholar] [CrossRef] [Green Version]
  19. Mahajan, R.; Gupta, V.K.; Sharma, J. Comparison and suitability of gel matrix for entrapping higher content of enzymes for commercial applications. Indian J. Pharm. Sci. 2010, 72, 223–228. [Google Scholar] [CrossRef] [Green Version]
  20. Kumar, G.; Mudhoo, A.; Sivagurunathan, P.; Nagarajan, D.; Ghimire, A.; Lay, C.-H.; Lin, C.-Y.; Lee, D.-J.; Chang, J.-S. Recent insights into the cell immobilization technology applied for dark fermentative hydrogen production. Bioresour. Technol. 2016, 219, 725–737. [Google Scholar] [CrossRef]
  21. Jamali, N.S.; Farahana, N.; Rashidi, D.; Jahim, J.; O-thong, S.; Jehlee, A.; Engliman, N.S. Thermophilic biohydrogen production from palm oil mill effluent: Effect of immobilized cells on granular activated carbon in fluidized bed reactor. Food Bioprod. Process. 2019, 117, 231–240. [Google Scholar] [CrossRef]
  22. Angelidaki, I.; Sanders, W. Assessment of the anaerobic biodegradability of macropollutants. Rev. Environ. Sci. Biotechnol. 2004, 3, 117–129. [Google Scholar] [CrossRef]
  23. Duarte, J.C.; Rodrigues, J.A.R.; Moran, P.J.S.; Valença, G.P.; Nunhez, J.R. Effect of immobilized cells in calcium alginate beads in alcoholic fermentation. AMB Express 2013, 3, 1–8. [Google Scholar] [CrossRef] [Green Version]
  24. Khanna, N.; Das, D. Biohydrogen production by dark fermentation. Wiley Interdiscip. Rev. Energy Environ. 2013, 2, 401–421. [Google Scholar] [CrossRef]
  25. Wang, C.C.; Chang, C.W.; Chu, C.P.; Lee, D.J.; Chang, B.V.; Liao, C.S. Producing hydrogen from wastewater sludge by Clostridium bifermentans. J. Biotechnol. 2003, 102, 83–92. [Google Scholar] [CrossRef]
  26. Sekoai, P.T.; Yoro, K.O.; Daramola, M.O. Batch Fermentative Biohydrogen Production Process Using Immobilized Anaerobic Sludge from Organic Solid Waste. Environments 2016, 3, 38. [Google Scholar] [CrossRef] [Green Version]
  27. Chen, W.-H.; Chen, S.-Y.; Kumar Khanal, S.; Sung, S. Kinetic study of biological hydrogen production by anaerobic fermentation. Int. J. Hydrog. Energy 2006, 31, 2170–2178. [Google Scholar] [CrossRef]
  28. Syakina, N.; Jahim, J.; O-thong, S. ScienceDirect Hydrodynamic characteristics and model of fluidized bed reactor with immobilised cells on activated carbon for biohydrogen production. Int. J. Hydrog. Energy 2019. [Google Scholar] [CrossRef]
  29. Chu, Y.; Wei, Y.; Yuan, X.; Shi, X. Bioconversion of wheat stalk to hydrogen by dark fermentation: Effect of different mixed microflora on hydrogen yield and cellulose solubilisation. Bioresour. Technol. 2011, 102, 3805–3809. [Google Scholar] [CrossRef]
  30. Syakina, N.; Jahim, J. ScienceDirect Biofilm formation on granular activated carbon in xylose and glucose mixture for thermophilic biohydrogen production. Int. J. Hydrog. Energy 2016, 1–11. [Google Scholar] [CrossRef]
  31. Seifan, M.; Samani, A.K.; Hewitt, S.; Berenjian, A. The Effect of Cell Immobilization by Calcium Alginate on Bacterially Induced Calcium Carbonate Precipitation. Fermentation 2017, 3, 57. [Google Scholar] [CrossRef] [Green Version]
  32. Lutpi, N.A.; Jahim, J.; Mumtaz, T. RSC Advances Physicochemical characteristics of attached bio fi lm on granular activated carbon for thermophilic biohydrogen production. RSC Adv. 2015, 19382–19392. [Google Scholar] [CrossRef]
  33. Mesran, M.H.; Mamat, S.; Pang, Y.R.; Tan, Y.H.; Muneera, Z.; Ghazali, N.F.; Ali, M.A.; Mahmood, N.A. Preliminary Studies on Immobilized Cells-Based Microbial Fuel Cell System on Its Power Generation Performance. J. Asian Sci. Res. 2014, 4, 428–435. [Google Scholar]
  34. Damayanti, A.; Sediawan, W.B.; Syamsiah, S. Performance analysis of immobilized and co-immobilized enriched-mixed culture for hydrogen production. J. Mech. Eng. Sci. 2018, 12, 3515–3528. [Google Scholar] [CrossRef]
  35. Szymańska, E.; Winnicka, K. Stability of chitosan—A challenge for pharmaceutical and biomedical applications. Mar. Drugs 2015, 13, 1819–1846. [Google Scholar] [CrossRef]
  36. Talebnia, F.; Taherzadeh, M.J. In situ detoxification and continuous cultivation of dilute-acid hydrolyzate to ethanol by encapsulated S. cerevisiae. J. Biotechnol. 2006, 125, 377–384. [Google Scholar] [CrossRef]
  37. Wu, K.; Chang, J. Biohydrogen Production Using Suspended and Immobilized Mixed Microflora. J. Chin. Inst. Chem. Eng. 2006, 37, 545–550. [Google Scholar]
  38. Basile, M.A.; Dipasquale, L.; Gambacorta, A.; Vella, M.F.; Calarco, A.; Cerruti, P.; Malinconico, M.; Gomez d’Ayala, G. The effect of the surface charge of hydrogel supports on thermophilic biohydrogen production. Bioresour. Technol. 2010, 101, 4386–4394. [Google Scholar] [CrossRef]
  39. Kumar, A.; Jain, S.R.; Sharma, C.B.; Joshi, A.P.; Kalia, V.C. Increased H2 production by immobilized microorganisms. World J. Microbiol. Biotechnol. 1995, 11, 156–159. [Google Scholar] [CrossRef]
  40. Zhu, K.; Arnold, W.A.; Sakkos, J.; Davis, C.W.; Novak, P.J. Achieving high-rate hydrogen recovery from wastewater using customizable alginate polymer gel matrices encapsulating biomass. Environ. Sci. Water Res. Technol. 2018, 4, 1867–1876. [Google Scholar] [CrossRef] [Green Version]
  41. Zhang, Z.P.; Show, K.Y.; Tay, J.H.; Liang, D.T.; Lee, D.J. Enhanced Continuous Biohydrogen Production by Immobilized Anaerobic Microflora. Energy Fuels 2008, 22, 87–92. [Google Scholar] [CrossRef]
  42. Wu, S.Y.; Lin, C.N.; Chang, J.S.; Chang, J.S. Biohydrogen production with anaerobic sludge immobilized by ethylene-vinyl acetate copolymer. Int. J. Hydrog. Energy 2005, 30, 1375–1381. [Google Scholar] [CrossRef]
  43. Zhao, L.; Cao, G.; Wang, A.; Guo, W.; Liu, B.; Ren, H.; Ren, N.; Ma, F. Enhanced bio-hydrogen production by immobilized Clostridium sp. T2 on a new biological carrier. Int. J. Hydrog. Energy 2011, 37, 162–166. [Google Scholar] [CrossRef]
  44. Karimi, K. Lignocellulose-Based Bioproducts; Springer: Berlin/Heidelberg, Germany, 2015; ISBN 9783319350349. [Google Scholar]
  45. Zhang, S.; Kim, T.-H.; Lee, Y.; Hwang, S.-J. Effects of VFAs Concentration on Bio-hydrogen Production with Clostridium Bifermentans 3AT-ma. Energy Procedia 2012, 14, 518–523. [Google Scholar] [CrossRef] [Green Version]
  46. Jamali, N.S.; Jamaliah, J. Optimization of Thermophilic Biohydrogen Production by Microflora of Palm Oil Mill Effluent: Cell Attachment on Granular Activated Carbon as Support Media Zirconia ceramic membrane as a separator in microbial fuel cell View project. Artic. Malays. J. Anal. Sci. 2016. [Google Scholar] [CrossRef]
  47. Ueno, Y.; Sasaki, D.; Fukui, H.; Haruta, S.; Ishii, M.; Igarashi, Y. Changes in bacterial community during fermentative hydrogen and acid production from organic waste by thermophilic anaerobic microflora. J. Appl. Microbiol. 2006, 101, 331–343. [Google Scholar] [CrossRef]
  48. Fu, Y.-L.; Xiong, Y.; Liu, X.-D.; Yu, W.-T.; Wang, Y.-L.; Yu, X.-J.; Ma, X.-J. Study of alginate/chitosan microcapsules for immobilization of Escherichia coli DH5 alpha. Sheng Wu Gong Cheng Xue Bao 2002, 18, 239–241. [Google Scholar]
  49. Zucca, P.; Sanjust, E. Inorganic Materials as Supports for Covalent Enzyme Immobilization: Methods and Mechanisms. Molecules 2014, 19, 14139–14194. [Google Scholar] [CrossRef]
Figure 1. Experimental setup for cell acclimatisation
Processes 08 01254 g001
Figure 2. Biogas production (mL) of 10 g/L and 20 g/L sugar loading over fermentation time (day) with 2 days HRT in sequencing mode reactor.
Processes 08 01254 g002
Figure 3. Hydrogen production (mL) at different concentrations of alginate in 200 mL of a 250-mL modified bioreactor in batch fermentation.
Processes 08 01254 g003
Figure 4. Hydrogen productivity rate (mmol H2/l.h) and hydrogen yield (mol H2/mol sugar) in the different concentrations of alginate for hydrogen production.
Processes 08 01254 g004
Figure 5. Hydrogen production (mL) at different concentrations of chitosan in 200 mL of a 250 mL modified bioreactor in batch fermentation.
Processes 08 01254 g005
Figure 6. Hydrogen productivity rate (mmol H2/l.h) and hydrogen yield (mol H2/mol sugar) in the different concentrations of chitosan.
Processes 08 01254 g006
Figure 7. (a) Cell-immobilised GAC; (b) cell-immobilised GAC–Alg; (c) cell-immobilised GAC–AlgC.
Processes 08 01254 g007
Figure 8. Hydrogen production rate (mmol/l.h) and VFA concentration (HAc-acetate acid and HBu-butyrate acid) in batch fermentation of (a) GAC-Alg and (b) GAC-lgC beads.
Processes 08 01254 g008
Figure 9. Images of (a) clean GAC; (b) GAC-attached biofilm; (c) immobilised cells on GAC–Alg at (i) 3.00 k magnification and (ii) 10.00 k magnification; (d) immobilised cells on GAC–AlgC at (i) 3.00 k magnification and (ii) 10.00 k magnification.
Processes 08 01254 g009
Table 1. Samples of granular activated carbon–alginate (GAC–Alg)- and granular activated carbon–alginate–chitosan (GAC–AlgC)-immobilised beads v/w.
Sample LabellingGAC-AlgGAC-AlgC
A1:0.51:0.5
B1:11:1
C1:21:2
D1:31:3
E1:41:4
Table 2. Hydrogen productivity and H2 yield obtained from each of the different sugar loadings.
Sugar LoadingGlucoseXyloseH2H2 Productivity Rate (HPR)H2 Yield
g/Lg/Lg/LmLmmol H2/l.dmmol H2/l.hmol H2/mol Total Sugar
10551743.42 ± 42.163.71 ± 0.092.56 ± 0.173.27 ± 0.08
2010101840.42 ± 97.763.92 ± 0.212.70 ± 0.293.38 ± 0.18
Table 3. Hydrogen productivity obtained from different concentrations of alginate in batch fermentation.
SamplesH2Modified Gompertz Equation Parameter Values for H2 Production (Per Working Volume)
YieldHPRHmRmλ
mol H2/mol Sugar Consumedmmol H2/l.hmLmL/hh
A (1:0.5)1.36 ± 0.131.66 ± 0.052225.0395.835.89
B (1:1)1.73 ± 0.061.92 ± 0.053273.37145.483.84
C (1:2)2.09 ± 0.222.47 ± 0.474099.59187.583.72
D (1:3)1.54 ± 0.061.51 ± 0.452091.09104.854.11
E (1:4)1.11 ± 0.341.00 ± 0.171119.4939.794.10
Table 4. Hydrogen productivity obtained from different concentrations of chitosan in batch fermentation.
SamplesH2Modified Gompertz Equation Parameter for H2 Production
(Per Working Volume)
YieldHPRHmRmλ
mol H2/mol Sugar Consumedmmol H2/l.hmLmL/hh
A (1:0.5)0.46 ± 0.120.58 ± 0.20133.775.556.26
B (1:1)0.97 ± 0.210.85 ± 0.08173.197.765.57
C (1:2)1.11 ± 0.350.93 ± 0.05297.7613.534.45
D (1:3)0.88 ± 0.120.74 ± 0.1580.372.903.01
E (1:4)0.67 ± 0.300.70 ± 0.20150.616.034.14
Table 5. Comparative study on the efficiency of different types of immobilisation beads on hydrogen production.
Carbon SourceType of CarrierTempFermentation ProcessHydrogen YieldReferences
GlucoseCA-AC35Batch2.6 mol H2/mol sucrose[10]
SucroseCA-C-TiO235Batch2.60 mol H2/mol sucrose[37]
GlucoseCA60Batch1.90 mol H2/mol glucose[38]
GlucoseCA40Batch17 L/g mol glucose[39]
Brewery wastewaterCA37Batch14 g/L COD[40]
glucoseGAC37Continuous0.4–1.7 mol H2/mol sugar[41]
GlucoseCA-AC36Batch0.029 mol H2/mol glucose[34]
SucroseCA35Batch1.7 mol H2/mol sucrose[42]
XyloseCA37Continuous3.15 mmol H2/mol xylose[43]
SucroseCA-AC35Continuous2.67 mol H2/mol sucrose[8]
Glucose/XyloseGAC-AlgC60Batch1.11 mol H2/mol sugarThis study
Glucose/XyloseGAC-Alg60Batch2.09 mol H2/mol sugarThis study
Ac = activated carbon; GAC = granular activated carbon; CA = calcium alginate; C = chitosan.
Table 6. Summary of total volatile fatty acids at various concentrations of GAC–Alg and GAC–AlgC, all at 200 mL working volume of a 250 mL modified bioreactor in batch fermentation.
SamplesHPRHydrogenHAcHBuTVFAs
mmol/l.dmmol/l.h%mMmMmM
GAC–Alg
A (1:0.5)3.631.6684.6021.0825.8846.95
B (1:1)4.271.9278.9717.8724.0141.87
C (1:2)5.002.4785.8724.0528.6652.71
D (1:3)3.131.5165.7418.5819.1437.72
E (1:4)2.361.0073.1818.2122.2940.50
GAC–AlgC
A (1:0.5)1.150.5852.9410.5912.3622.95
B (1:1)2.030.8584.7911.5315.2626.79
C (1:2)2.120.9386.6316.6016.9733.57
D (1:3)1.560.7464.5410.6414.1824.82
E (1:4)1.550.7076.4312.7113.4926.20
TVFAs (total volatile fatty acids) = HAc + HBu.

