Continuous Fixed Bed CO2 Adsorption: Breakthrough, Column Efficiency, Mass Transfer Zone


 , ,
, ,  and
and
Abstract
1. Introduction
2. Materials and Methods
2.1. Materials
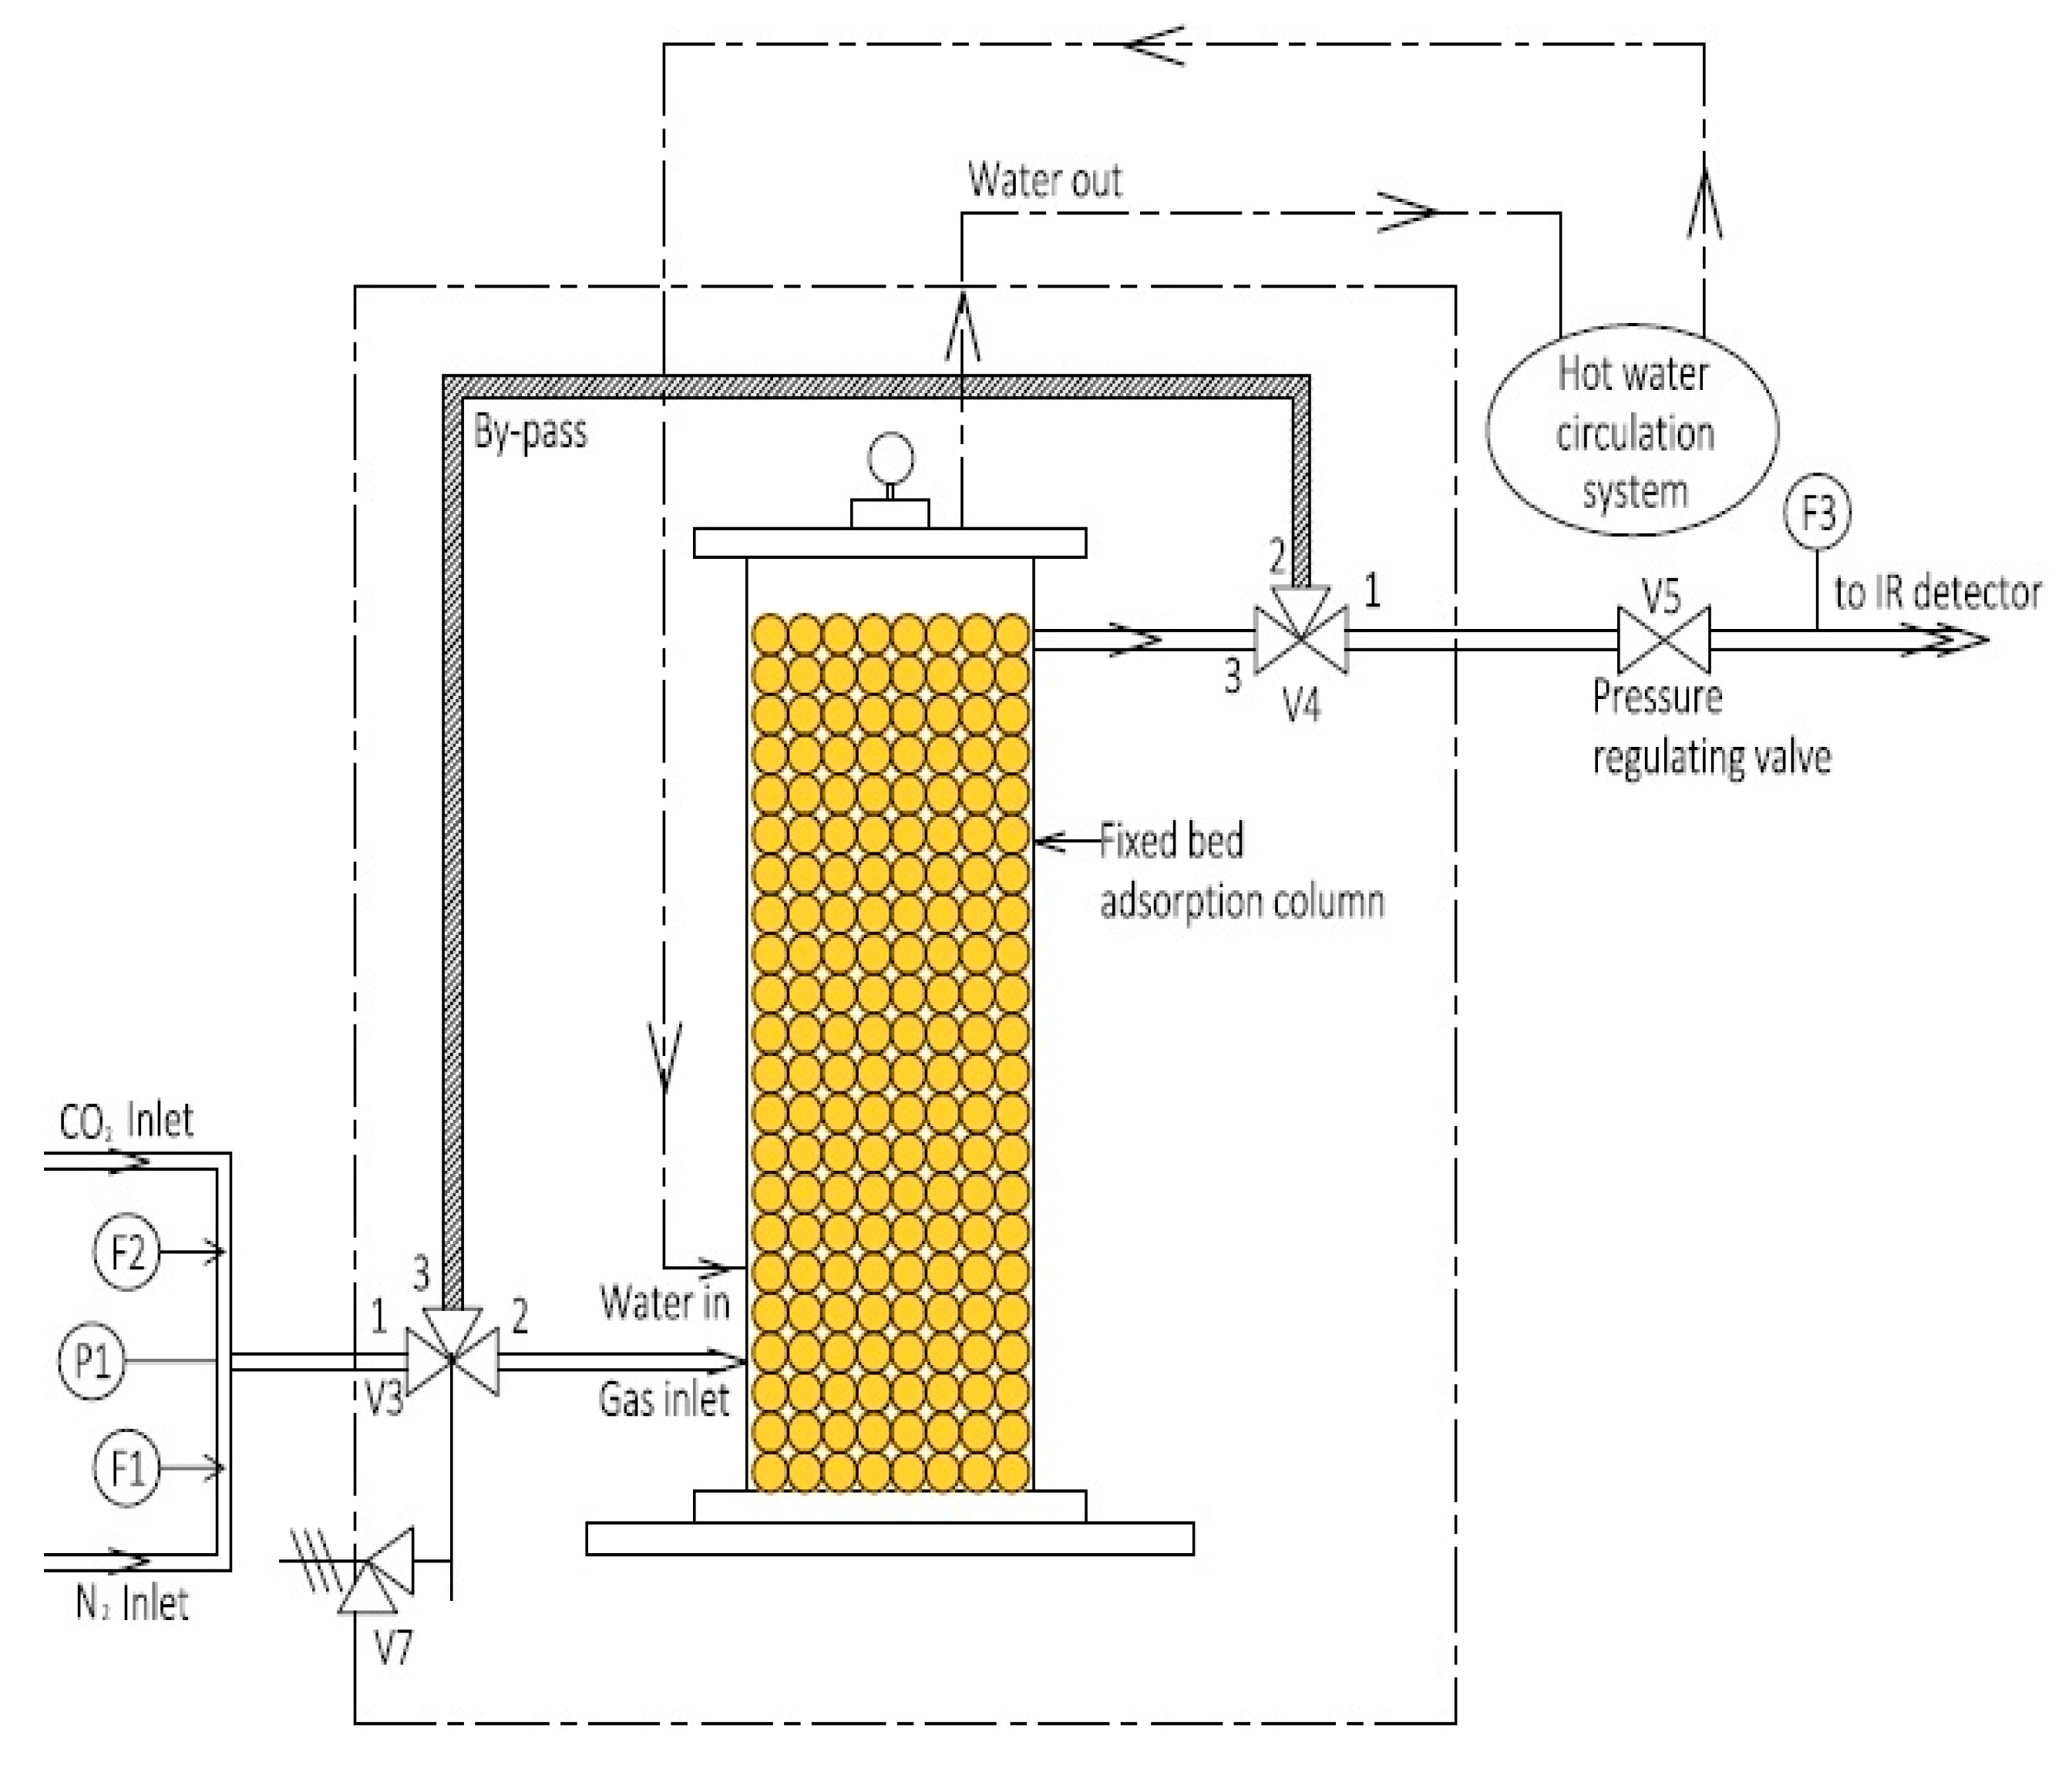
2.2. Setup
2.3. Procedure
3. Results and Discussion
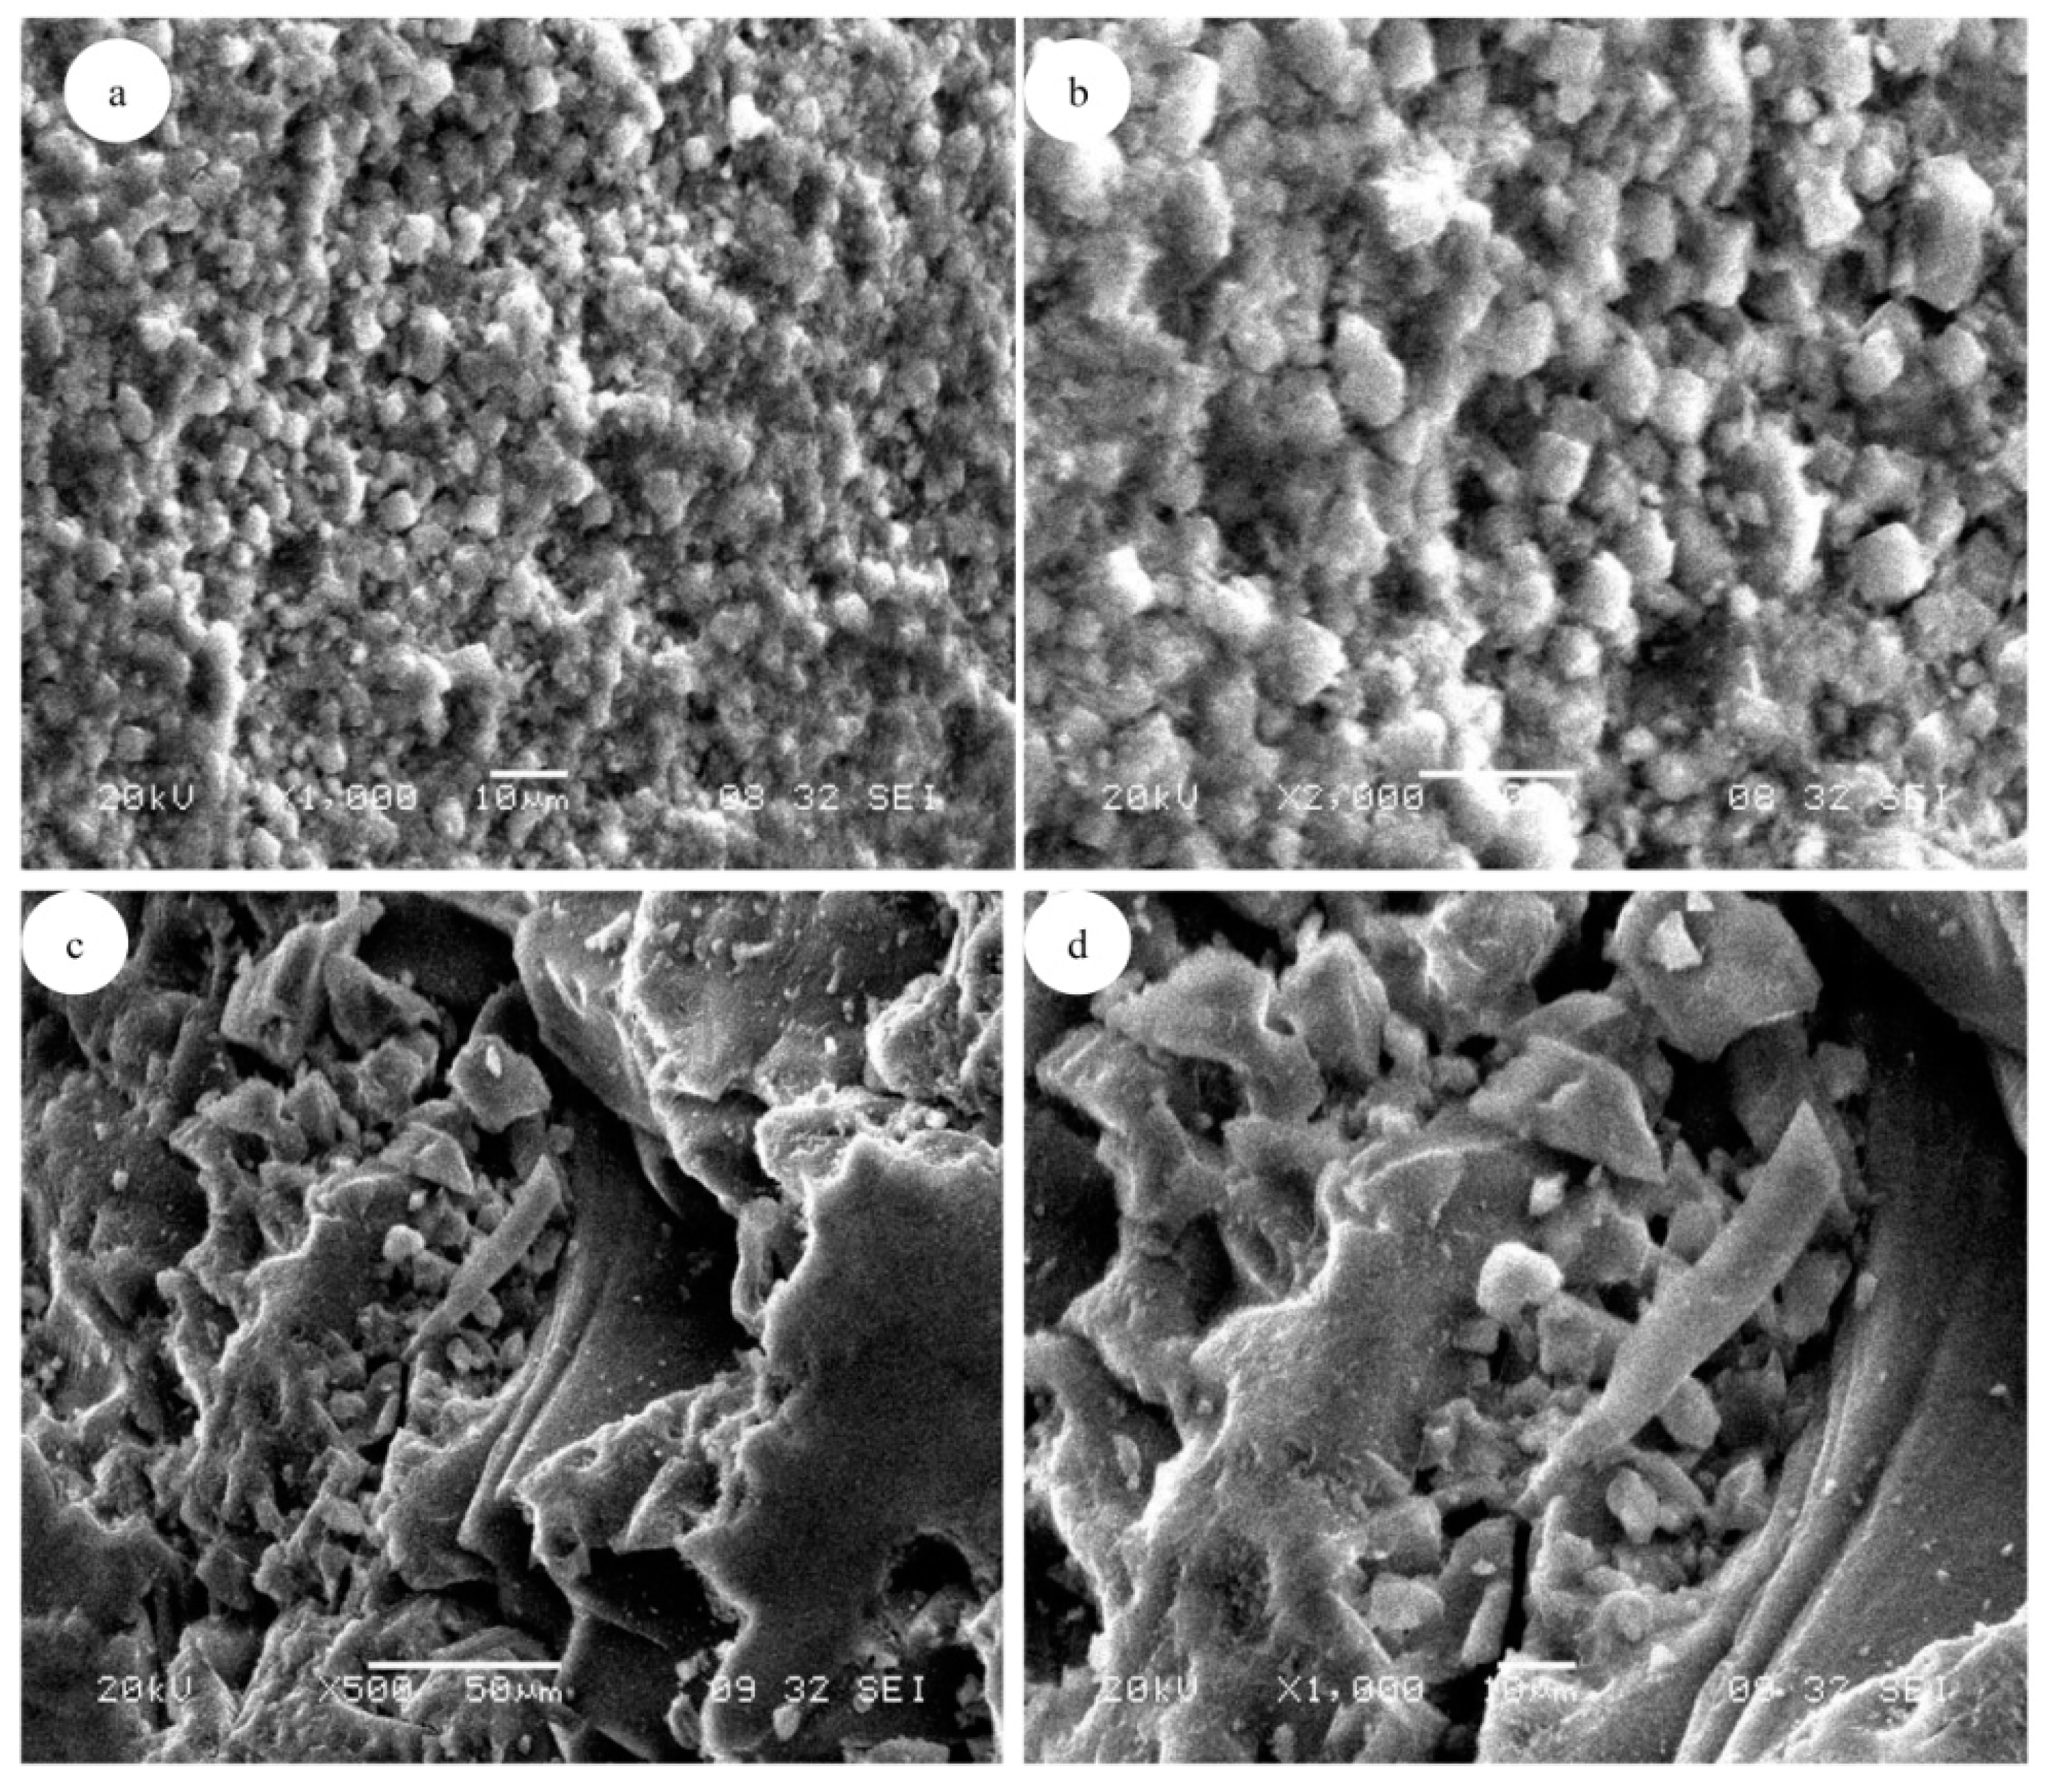
3.1. Adsorbent Characterizations
3.2. Molecular Sieve
3.3. Silica Gel Type-III
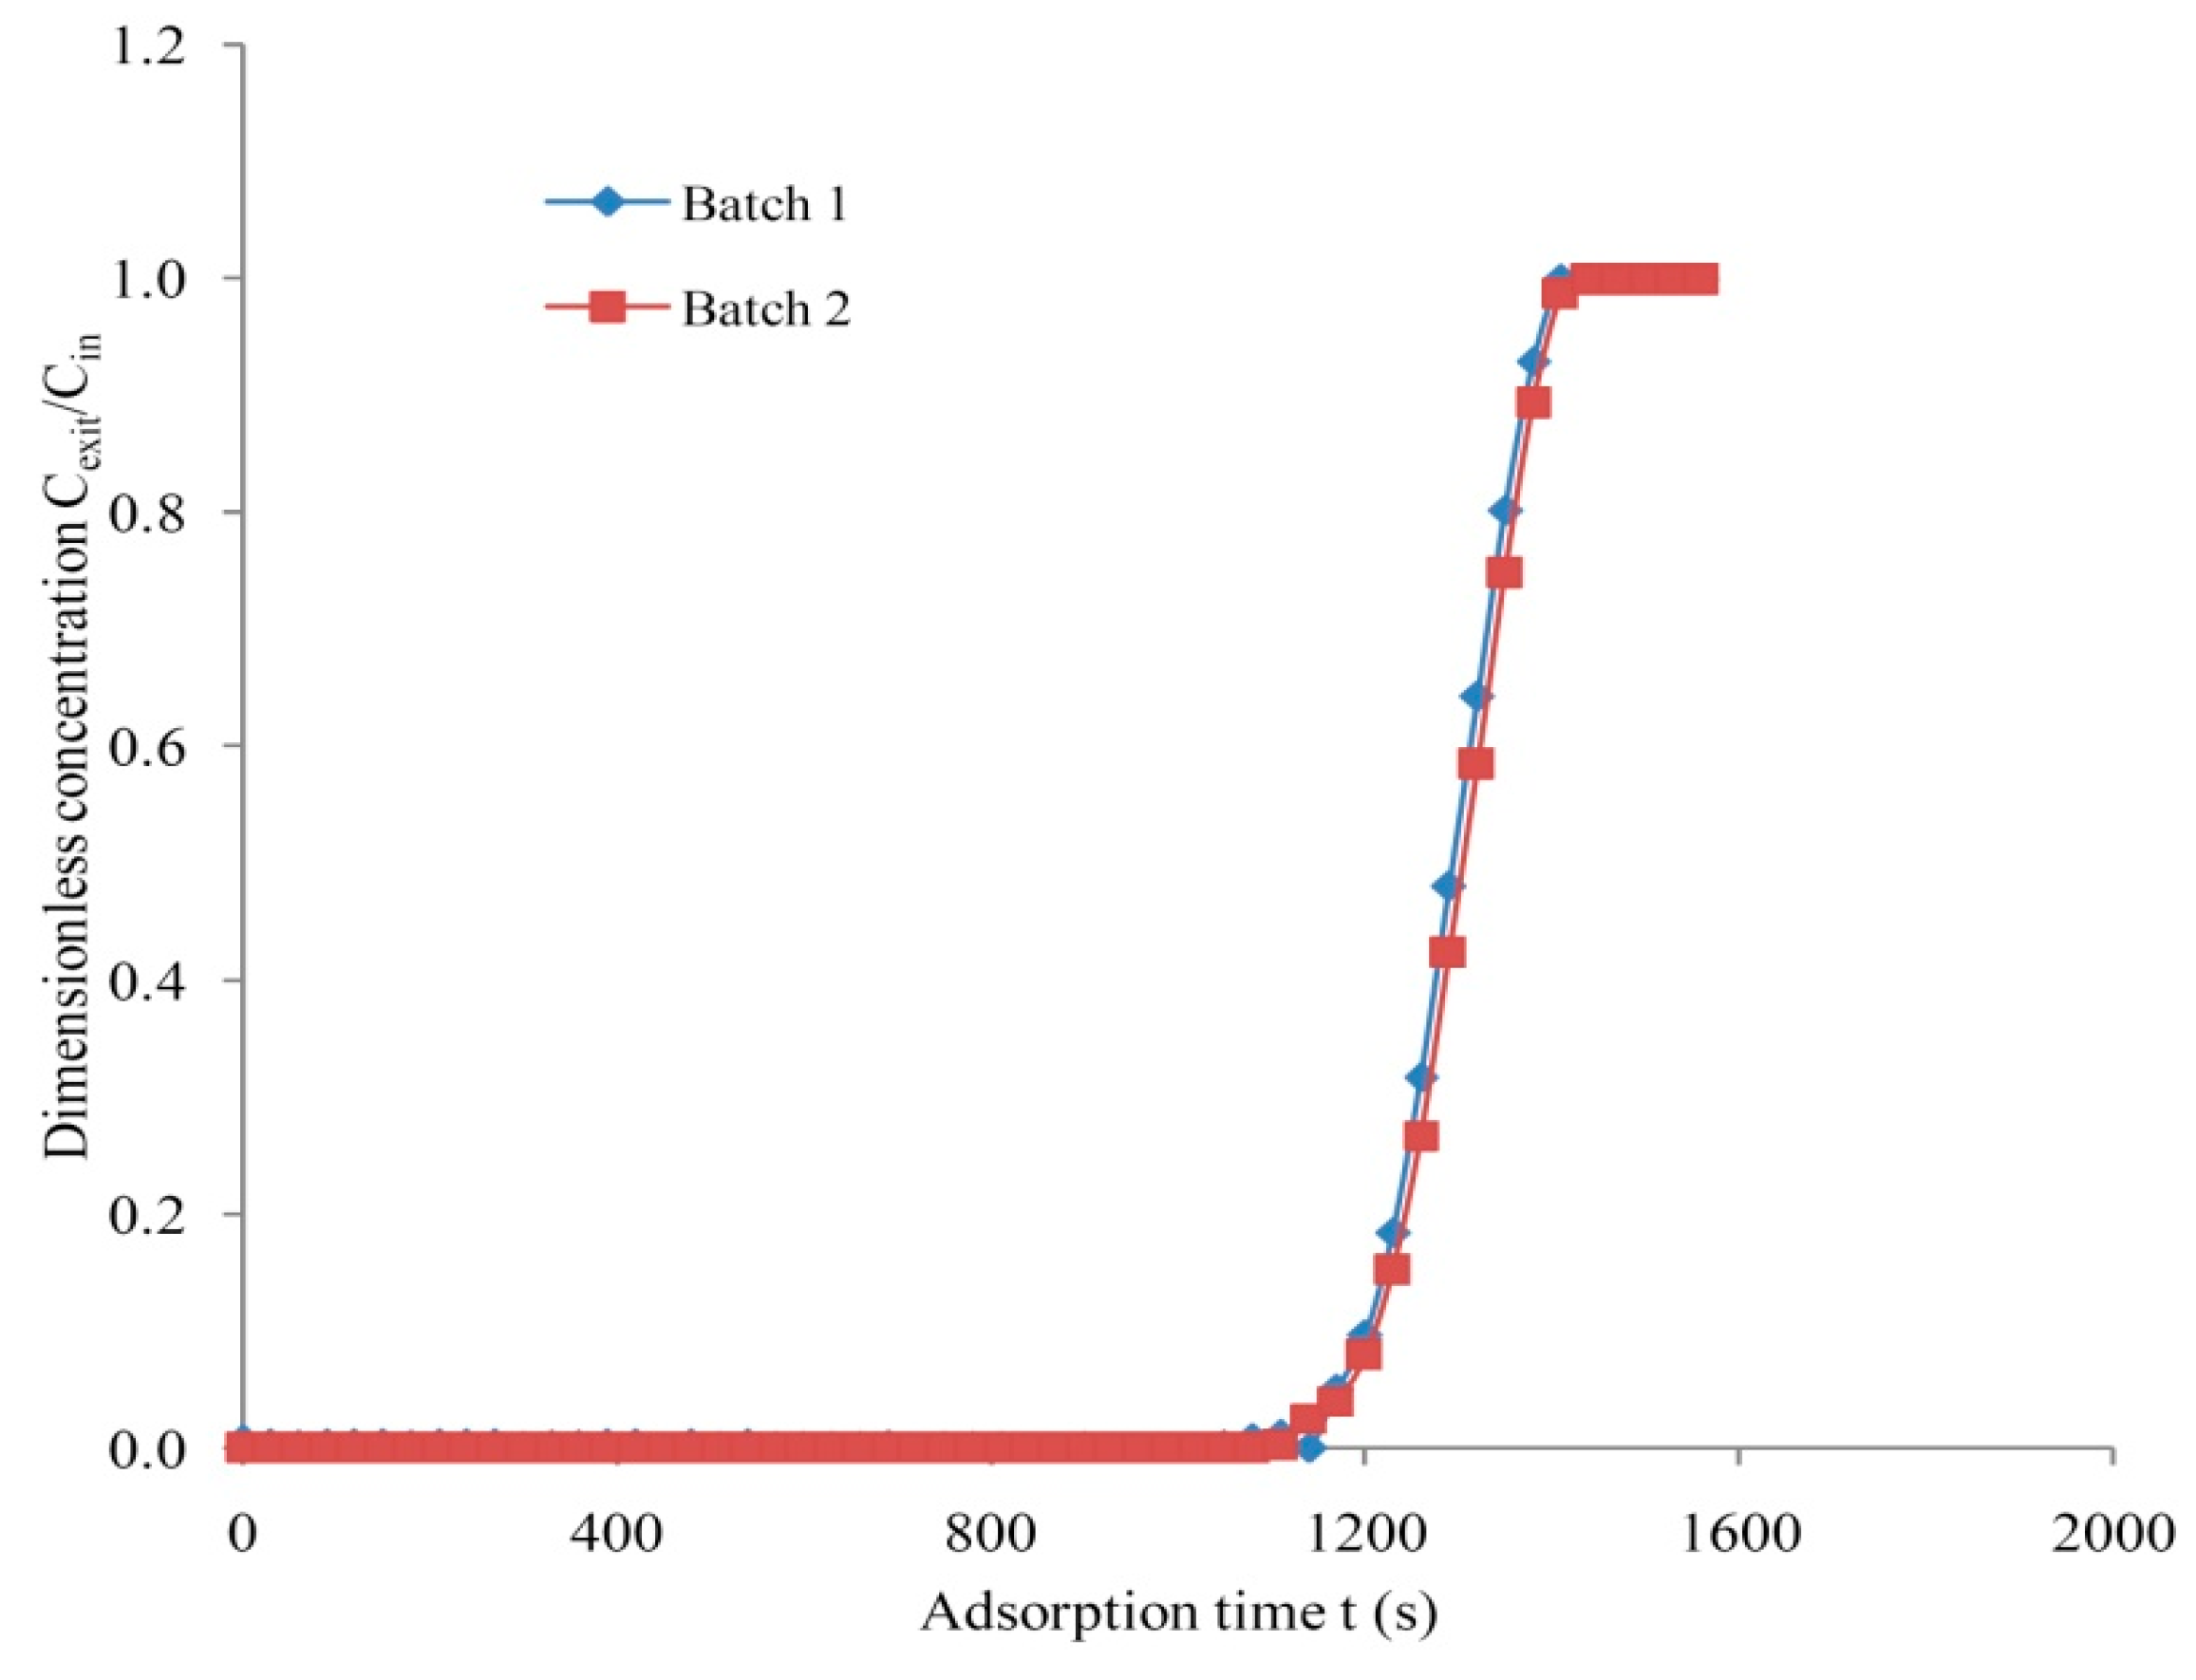
3.4. Repeatability and Accuracy Measurement
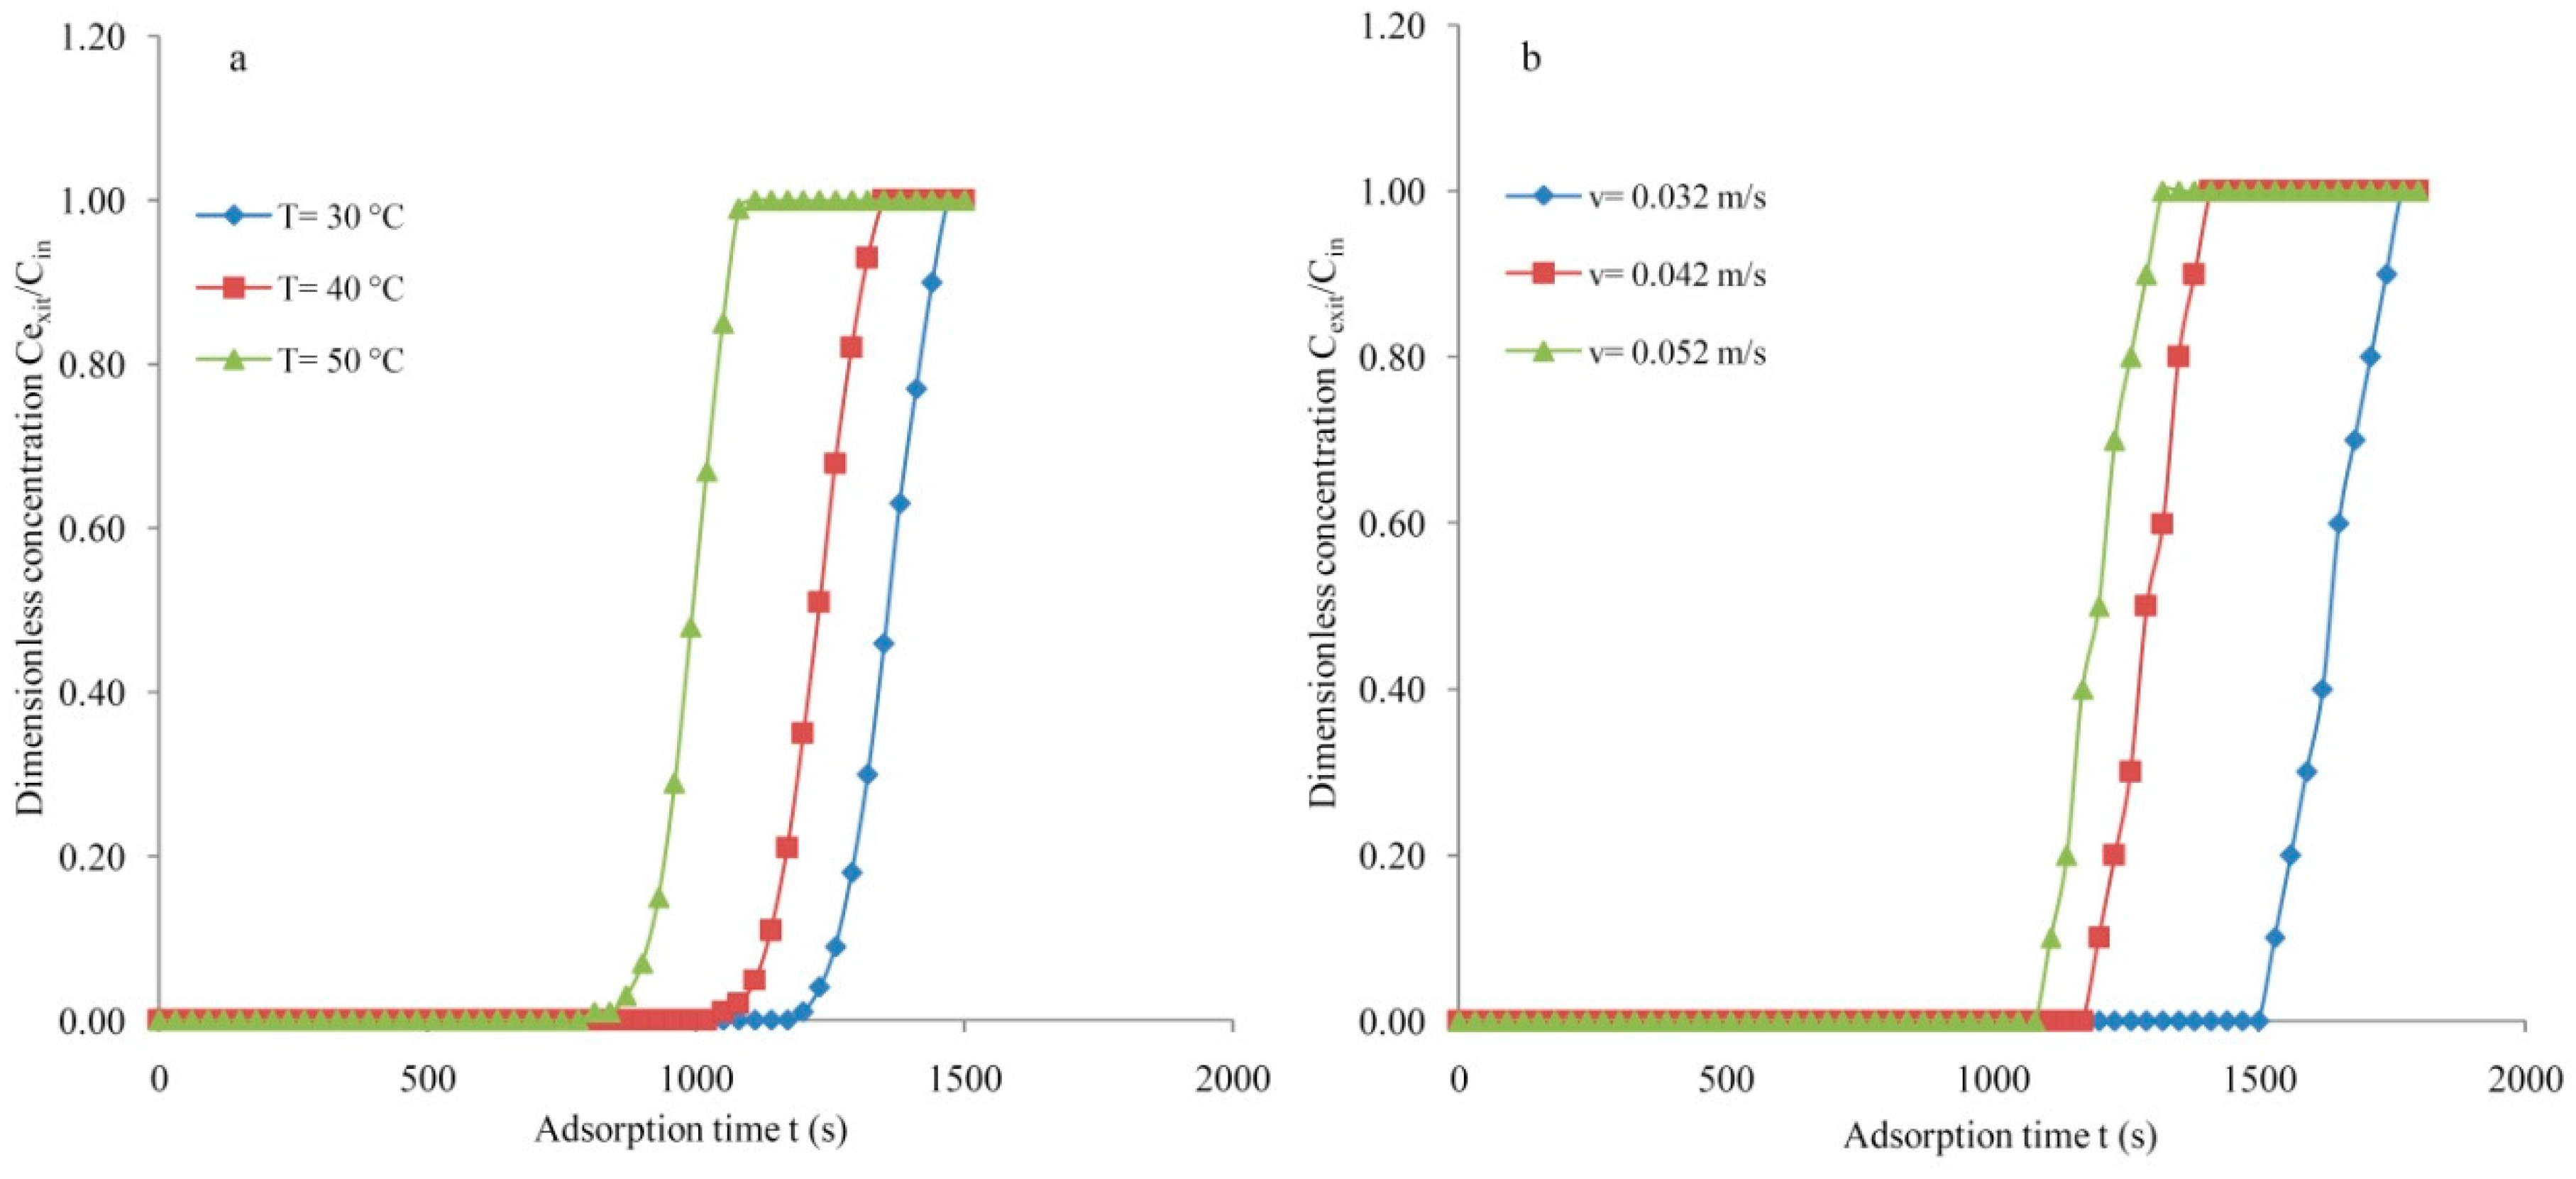
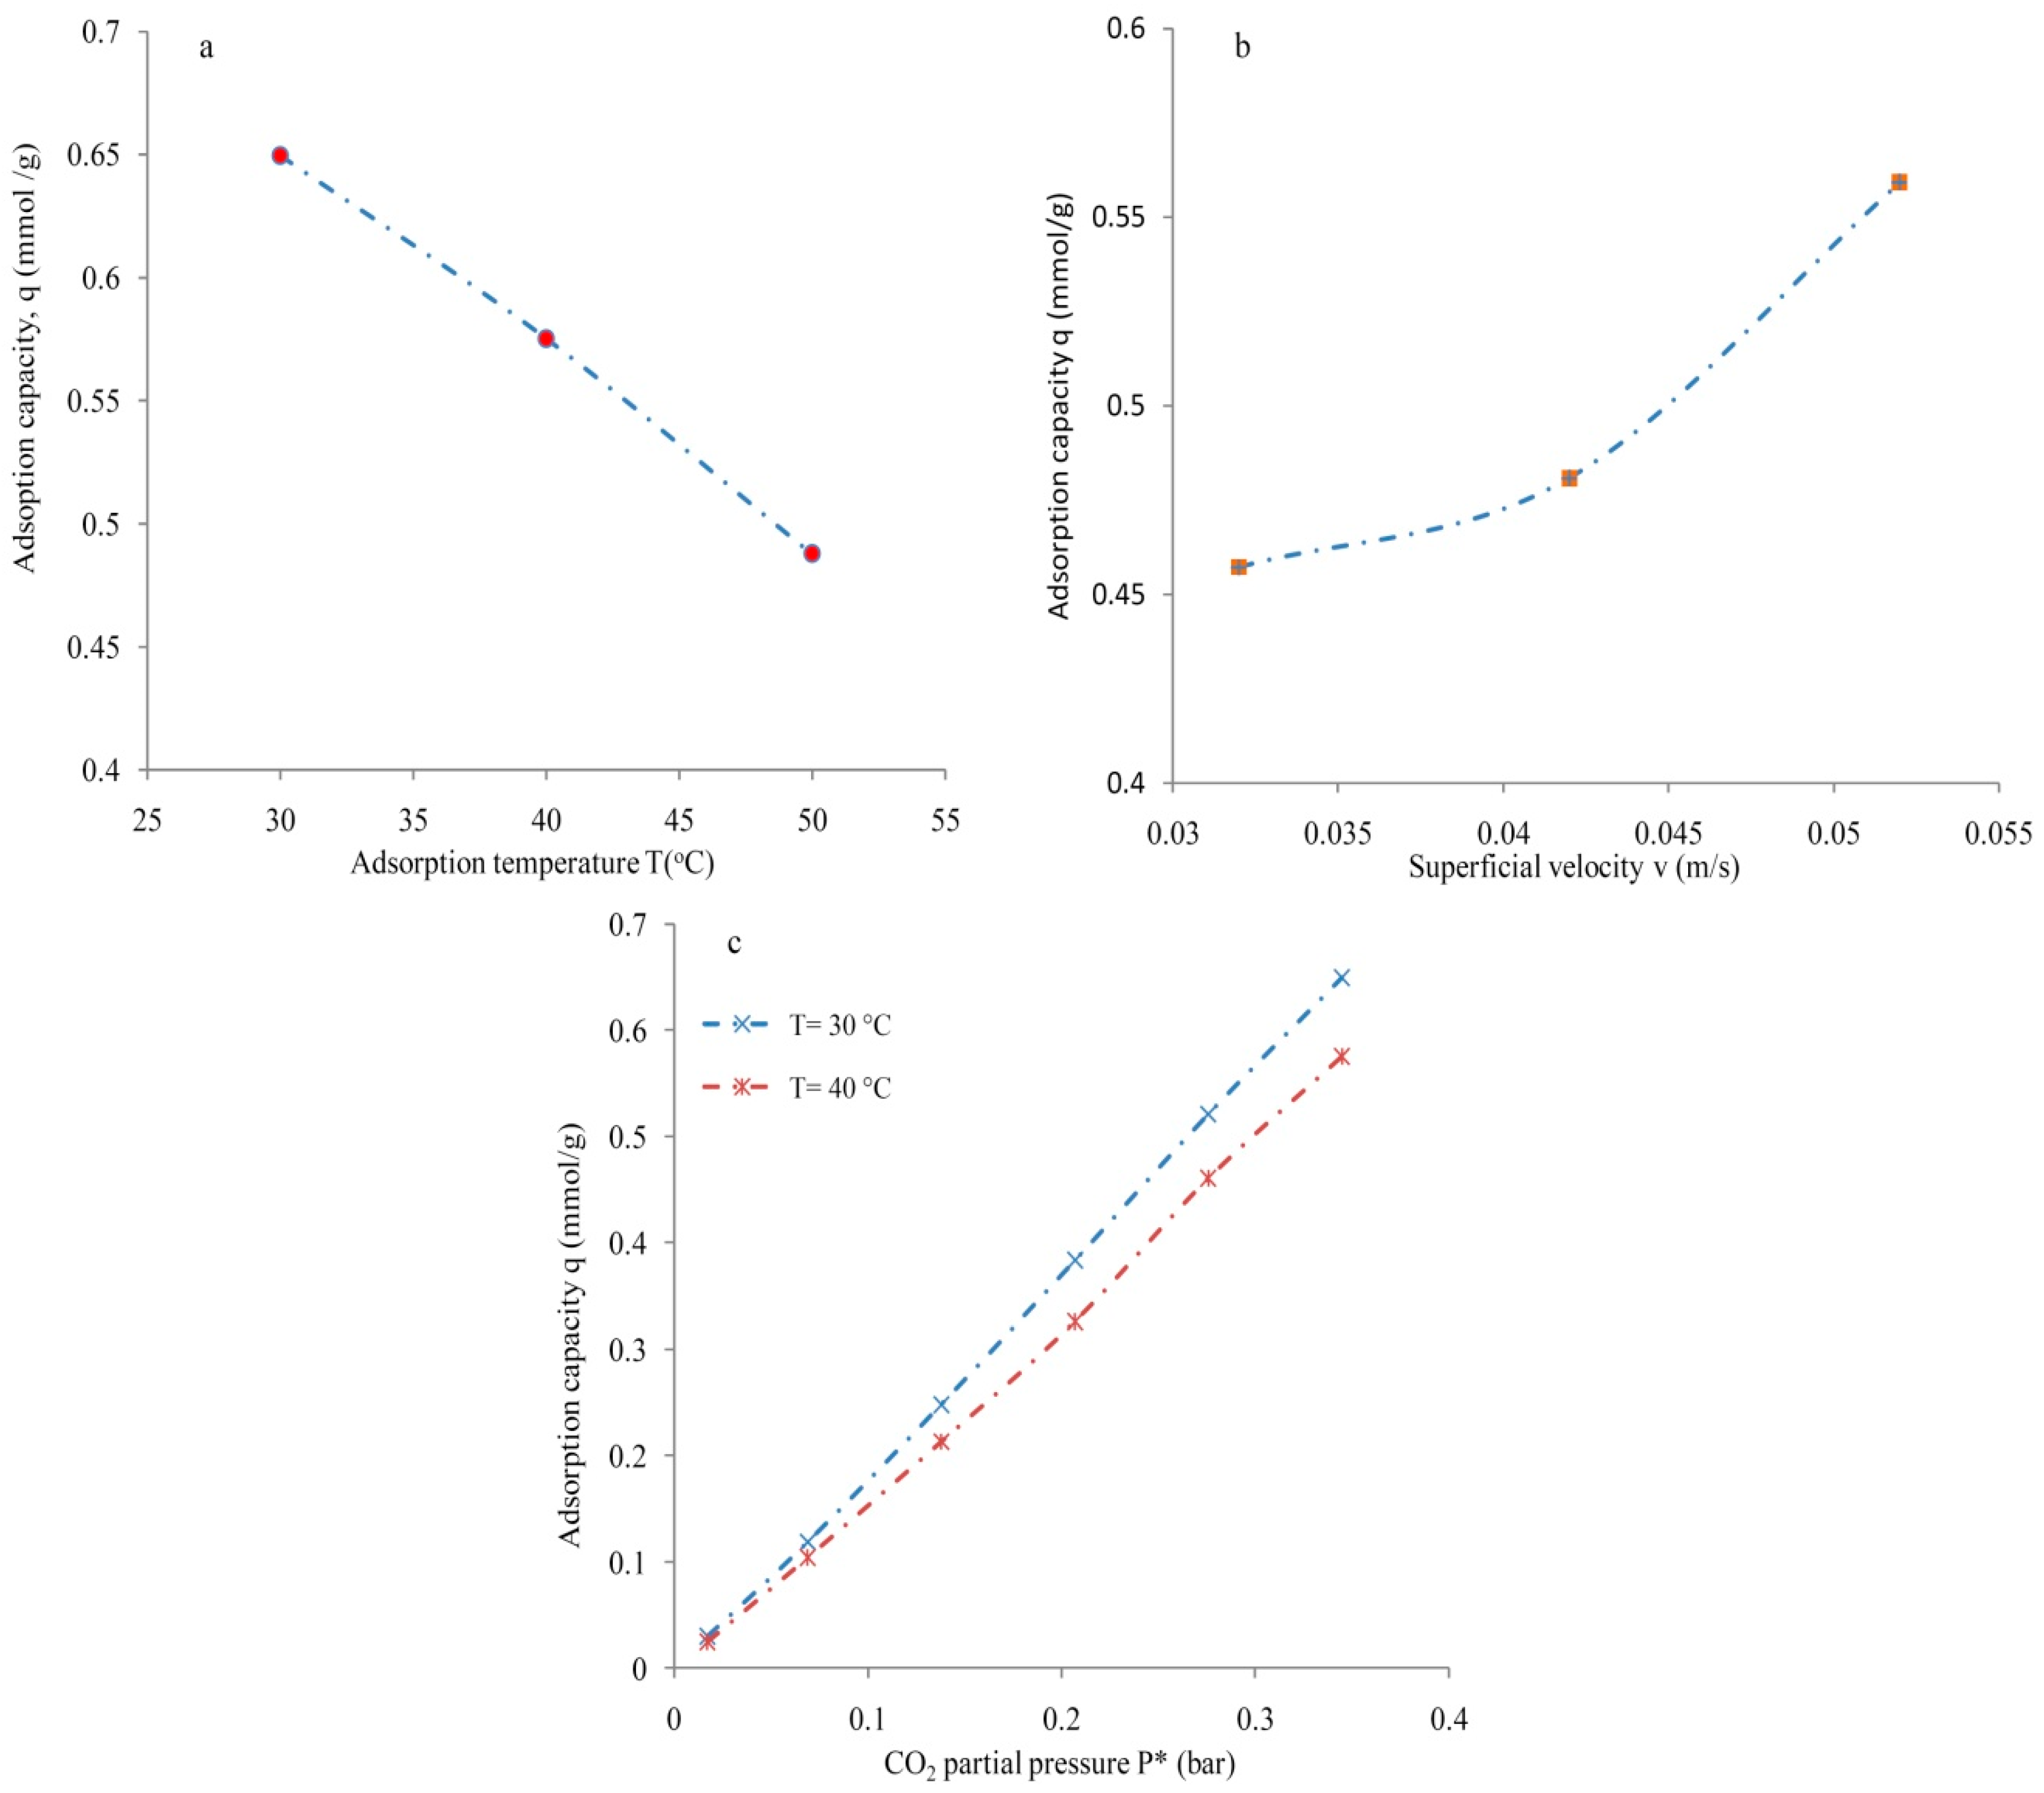
3.5. Mass Transfer Zone and Column Efficiency
4. Conclusions
Author Contributions
Funding
Conflicts of Interest
References
- Figueroa, J.D.; Fout, T.; Plasynski, S.; Mcllvried, H.; Srivastava, R.D. Advances in CO2 capture technology—The US Department of Energy’s Carbon Sequestration Program. Int. J. Greenh. Gas Control 2008, 2, 9–20. [Google Scholar] [CrossRef]
- Zhou, L.; Lio, X.; Li, J.; Wang, N.; Wang, Z.; Zhou, Y. Synthesis of ordered mesoporous carbon molecular sieve and its adsorption capacity for H2, N2, O2, CH4, and CO2. Chem. Phys. Lett. 2005, 413, 6–9. [Google Scholar] [CrossRef]
- Chou, C.T.; Chen, C.Y. Carbon dioxide recovery by vacuum swing adsorption. Sep. Purif. Technol. 2004, 39, 51–65. [Google Scholar] [CrossRef]
- Stewart, C.; Hessami, M.-A. A study of methods of carbon dioxide capture and sequestration-the sustainability of photosynthesis bioreactor approach. Energy Convers. Manag. 2005, 46, 403–420. [Google Scholar] [CrossRef]
- Duffy, A.; Walker, G.M.; Allen, S.J. Investigation on the adsorption of acidic gases using activated dolomite. Chem. Eng. J. 2006, 117, 239–244. [Google Scholar] [CrossRef]
- Thitakamol, B.; Veawab, A.; Aroonwilas, A. Environmental impacts of absorption-based CO2 capture unit for post-combustion treatment of flue gas from goal fired-fired power plant. Int. J. Greenh. Gas Control 2007, 1, 318–342. [Google Scholar] [CrossRef]
- Alabadi, A.; Razzaque, S.; Yang, Y.; Chen, S.; Tan, B. Highly porous activated carbon materials from carbonized biomass with high CO2 capturing capacity. Chem. Eng. J. 2015, 281, 606–612. [Google Scholar] [CrossRef]
- Gibbins, J.; Chalmers, H. Carbon capture and storage. Energy Policy 2008, 36, 4317–4322. [Google Scholar] [CrossRef]
- Blomen, E.; Hendriksa, C.; Neele, F. Capture technologies: Improvement and promising developments. Energy Procedia 2009, 1, 1505–1512. [Google Scholar] [CrossRef]
- Choi, W.J.; Seo, J.B.; Jang, S.Y.; Jung, J.H.; Oh, K.J. Removal characteristics of CO2 using aqueous MEA/AMP solutions in the absorption and regeneration process. J. Environ. Sci. 2009, 21, 907–913. [Google Scholar] [CrossRef]
- Brunetti, A.; Scura, F.; Barbieri, G.; Drioli, E. Membrane technologies for CO2 separation. J. Membr. Sci. 2010, 359, 115–125. [Google Scholar] [CrossRef]
- Xu, G.; Liang, F.; Yang, Y.; Hu, Y.; Zhang, K.; Liu, W. In improved CO2 separation and purification system based on cryogenic separation and distillation theory. Energies 2014, 7, 3484–3502. [Google Scholar] [CrossRef]
- Tiwari, D.; Goel, C.; Bhunia, H.; Bajpai, P.K. Novel nanostructured carbons derived from epoxy resin and their adsorption characteristics for CO2 capture. RSC Adv. 2016, 6, 97728–97738. [Google Scholar] [CrossRef]
- Yang, H.; Xu, Z.; Fan, M.; Gupta, R.; Slimane, R.B.; Bland, A.E.; Wright, I. Progress in carbon dioxide capture and separation: A review. J. Environ. Sci. 2008, 20, 14–27. [Google Scholar] [CrossRef]
- Yamasaki, A. An overview of carbon dioxide mitigation options for global warming emphasizing carbon dioxide sequestration options. J. Chem. Eng. Jpn. 2003, 36, 361–375. [Google Scholar] [CrossRef]
- MacDowell, N.; Florin, N.; Buchard, A.; Hallett, J.; Galindo, A.; Jackson, G.; Adjamin, C.; Williams, C.K.; Shah, N.; Fennel, P. An overview of carbon dioxide captures technologies. Energy Environ. Sci. 2010, 3, 1645–1669. [Google Scholar] [CrossRef]
- Cohen, S.M.; Chalmers, H.L.; Webber, M.E.; King, C.W. Comparing post-combustion carbon dioxide capture operation at retrofitted coal-fired power in the Texas and Great Britain electric grids. Environ. Res. Lett. 2011, 6, 024001. [Google Scholar] [CrossRef]
- Guo, B.; Chang, L.; Xie, K. Adsorption of carbon dioxide on activated carbon. J. Nat. Gas Chem. 2006, 15, 223–229. [Google Scholar] [CrossRef]
- Gracia, S.; Gil, M.V.; Martin, C.F.; Pis, J.J.; Rubiera, F.; Pevida, C. Breakthrough adsorption study of a commercial activated carbon for pre-combustion carbon dioxide capture. Chem. Eng. J. 2011, 171, 549–556. [Google Scholar] [CrossRef]
- Spin, M.J. Improving the gas solids contact efficiency in a fluidized bed of carbon dioxide adsorbent fine particles. Phys. Chem. Chem. Phys. 2011, 13, 4906–4909. [Google Scholar]
- Ammendola, P.; Raganati, F.; Chrone, R.; Miccio, F. Fixed bed adsorption affected by thermodynamics and kinetics: Yellow tuff for CO2 capture. Powder Technol. 2020, 373, 446–458. [Google Scholar] [CrossRef]
- Sreenivasulu, B.; Gayatri, D.V.; Sreedhar, I.; Raghvan, K.V. A journey into the process and engineering aspects of carbon capture technologies. Renew. Sustain. Energy Rev. 2015, 41, 1324–1350. [Google Scholar] [CrossRef]
- Li, J.; Ma, Y.; McCarthy, M.; Sculley, J.; Yu, J.; Jeong, H.; Balbuen, P.; Zhou, H. Carbon-dioxide-related gas adsorption and separation in metal-organic frameworks. Coord. Chem. Rev. 2011, 255, 1791–1823. [Google Scholar] [CrossRef]
- Goetz, V.; Pupier, O.; Guillot, A. Carbon dioxide-methane mixture adsorption on activated carbon. Adsorption 2006, 12, 55–63. [Google Scholar] [CrossRef]
- Al Mesfer, M.K. Synthesis and characterization of high-performance activated carbon from walnut shell biomass for CO2 capture. Environ. Sci. Pollut. Res. 2020, 27, 15020–15028. [Google Scholar] [CrossRef]
- Calvo-Munoz, E.M.; Garcia-Mateos, F.J.; Rosas, J.M.; Rodrigues-Mirasol, J.; Cordero, T. Biomass waste carbon materials as adsorbents for CO2 capture under post-combustion conditions. Front. Mater. 2016, 3, 23. [Google Scholar] [CrossRef]
- Raganati, F.; Alfe, M.; Gargiulo, V.; Chirone, R.; Ammendola, P. Kinetic study and breakthrough analysis of the hybrid physical/chemical CO2 adsorption/desorption behavior of magnetite-based sorbent. Chem. Eng. J. 2019, 372, 526–535. [Google Scholar] [CrossRef]
- Toprak, A.; Kopac, T. Carbon dioxide adsorption using high surface area activated carbons from local coals modified by KOH, NaOH and ZnCl2 agents. Int. J. Chem. React. Eng. 2017, 15. [Google Scholar] [CrossRef]
- Shen, C.; Yu, J.; Li, P.; Grande, C.A.; Rodrigues, A.E. Capture of CO2 from flue gas by vacuum pressure swing adsorption using activated carbon beads. Adsorption 2011, 17, 179–188. [Google Scholar] [CrossRef]
- Al Mesfer, M.K.; Danish, M.; Fahmy, M.Y.; Rashid, M.M. Post combustion CO2 capture with activated carbons using fixed bed adsorption. Heat Mass Transf. 2018, 54, 2715–2724. [Google Scholar] [CrossRef]
- Al Mesfer, M.K.; Danish, M. Breakthrough adsorption study of activated carbons for CO2 separation from flue gas. J. Environ. Chem. Eng. 2018, 6, 4514–4524. [Google Scholar] [CrossRef]
- Raganati, F.; Chirone, R.; Ammendola, P. CO2 capture by temperature swing adsorption: Working capacity as affected by temperature and CO2 partial pressure. Ind. Eng. Chem. Res. 2020, 59, 3593–3605. [Google Scholar] [CrossRef]
- Raganati, F.; Ammendola, P.; Chirone, R. Effect of acoustic field on CO2 desorption in fluidized bed of fine activated carbon. Particulology 2016, 23, 8–15. [Google Scholar] [CrossRef]
- Shen, C.; Grande, C.A.; Li, P.; Yu, J.; Rodrigues, A.E. Adsorption equilibria and kinetics of CO2 and N2 on activated carbon beads. Ind. Eng. Chem. Res. 2010, 47, 4883–4890. [Google Scholar] [CrossRef]
- Dantas, T.L.P.; Amorim, S.M.; Luna, F.M.T.; Silva, I.J., Jr.; Azevedo, D.C.S.; Rodrigues, A.E.; Morera, R.F.P.M. Adsorption of carbon dioxide onto activated carbon and nitrogen-enriched activated carbon-surface changes, equilibrium, and modeling of fixed bed adsorption. Sep. Sci. Technol. 2010, 45, 73–84. [Google Scholar] [CrossRef]
- Reboldi, L.; Bolland, O. Evaluating pressure swing adsorption as a CO2 separation technique in coal-fired power plants. Int. J. Greenh. Gas Control 2015, 39, 1–16. [Google Scholar] [CrossRef]
- Sarkar, A.I.; Aroonwilas, A.; Veawab, A. Equilibrium and kinetic behavior of CO2 adsorption onto zeolites, carbon molecular sieve and activated carbons. Energy Procedia 2017, 114, 2450–2459. [Google Scholar] [CrossRef]
- Al-Janabi, N.; Vakili, R.; Kalumpasut, P.; Gorgojo, P.; Siperstein, F.R.; Fan, X. Velocity variation effect in fixed bed columns: A case study of CO2 captures using porous solid adsorbents. AIChE J. 2018, 64, 2189–2197. [Google Scholar] [CrossRef]
- Lu, C.; Bai, B.; Wu, B.; Su, F.; Hwang, J.F. Comparative study of CO2 capture by carbon nanotubes, activated carbons, and zeolites. Energy Fuels 2008, 22, 3050–3056. [Google Scholar] [CrossRef]
- Regufe, M.J.; Ferreira, A.F.P.; Lourero, J.M.; Shi, Y.; Rodrigues, A.; Ribeiro, A.M. New hybrid composite honeycomb monolith with 13X zeolite and activated carbon for CO2 capture. Adsorption 2018, 24, 249–265. [Google Scholar] [CrossRef]
- Xiang, S.; He, Y.; Zhang, Z.; Wu, H.; Zhou, W.; Krishna, R.; Chen, B. Microporous metal-organic framework with potential for carbon dioxide capture at ambient conditions. Nat. Commun. 2012, 3, 954. [Google Scholar] [CrossRef]
- Yoro, K.O.; Singo, M.; Mulopo, J.L.; Daramola, M.O. Modeling and experimental study of the CO2 adsorption behavior of polyaspartamide as an adsorbent during post-combustion CO2 capture. Energy Procedia 2017, 112, 1643–1664. [Google Scholar] [CrossRef]
- Monazam, E.R.; Spenik, J.; Shadle, L.J. Fluid bed adsorption of carbon dioxide on immobilized polyethylenimine (PEI): Kinetic analysis and breakthrough behavior. Chem. Eng. J. 2013, 223, 795–805. [Google Scholar] [CrossRef]
- Harlick, P.J.E.; Tezel, F.H. An experimental adsorbent screening study for CO2 removal from N2. Microporous Mesoporous Mater. 2004, 76, 71–79. [Google Scholar] [CrossRef]
- Cavenati, S.; Grande, C.A.; Rodrigues, A.E. Adsorption equilibrium of methane, carbon dioxide, and nitrogen on zeolite 13X at high pressures. Chem. Eng. Data 2004, 49, 1095–1101. [Google Scholar] [CrossRef]
- Siriwardane, R.V.; Shen, M.S.; Fisher, E.P.; Poston, J.A. Adsorption of CO2 on molecular sieves and activated carbon. Energy Fuels 2001, 15, 279–284. [Google Scholar] [CrossRef]
- Kamiuto, K.; Abe, S. Effect of desorption temperature on CO2 adsorption equilibria of the honeycomb zeolite beds. Appl. Energy 2002, 72, 555–564. [Google Scholar] [CrossRef]
- Ertan, A. CO2, N2 and Ar Adsorption on Zeolites. Master’s Thesis, Izmar Institute of Technology, Izmir, Turkey, 2004. [Google Scholar]
- Li, Y.; Yi, H.; Tang, X.; Li, F.; Yuan, Q. Adsorption separation of CO2/CH4 gas mixture on the commercial zeolites at atmospheric pressure. Chem. Eng. J. 2013, 229, 50–56. [Google Scholar] [CrossRef]
- Geankoplis, C.J. Transport Processes and Unit Operations, 3rd ed.; Printice-Hall International Inc.: Upper Saddle River, NJ, USA, 1993. [Google Scholar]
- McCabe, W.L.; Smith, J.C.; Harriott, P. Unit Operation of Chemical Engineering, 5th ed.; McGraw-Hill Editions: Singapore, 1993. [Google Scholar]


| Adsorbent | Temperature (°C) | Pressure (atm) | Adsorption Capacity (mmol/g) | References |
|---|---|---|---|---|
| Zeolite 13X | 20 | 0.15 | 2.63 | [44] |
| Zeolite 13X | 22 | 1.5 | 4.90 | [44] |
| Zeolite 13X | 22 | 1 | 4.61 | [45] |
| Molecular sieve 13X | 25 | 1 | 3.2 | [45] |
| Molecular sieve 13X | 20 | 0.15 | 2.18 | [47] |
| Molecular sieve 4A | 25 | 1 | 2.7 | [46] |
| Molecular sieve 4A | 20 | 0.15 | 1.65 | [47] |
| 13X | 5 | 0.9 | 6.3 | [48] |
| 5A | 5 | 0.7 | 5.46 | [48] |
| ZSM-5 | 40 | 0.1 | 0.32 | [49] |
| ZSM-5 | 30 | 1 | 1.60 | [49] |
| Adsorbent | Surface Area A (m2/g) | Pore Volume Vp (cm3/g) | Pore Radius Sp (Å) |
|---|---|---|---|
| Molecular sieve | 362.2 | 4.11 × 10⁻² | 27.52 |
| Silica gel type-III | 556.4 | 6.731 × 10⁻² | 20.45 |
| T (°C) | V (m/s) | Cin | MS | SG | ||||
|---|---|---|---|---|---|---|---|---|
| η (%) | LMTZ (cm) | Lbr (cm) | η (%) | LMTZ (cm) | Lbr (cm) | |||
| 30 | 0.052 | 5 | 86.1 | 3.58 | 20.66 | 57.8 | 12.05 | 13.87 |
| 40 | 0.052 | 5 | 84.8 | 3.94 | 20.35 | 66.5 | 9.65 | 15.96 |
| 50 | 0.052 | 5 | 83.9 | 4.18 | 20.14 | 44.7 | 18.34 | 10.73 |
| 40 | 0.032 | 5 | 87.5 | 3.20 | 21.00 | 65.6 | 9.94 | 15.74 |
| 40 | 0.042 | 5 | 86.2 | 3.55 | 20.69 | 56.1 | 13.49 | 13.46 |
| 40 | 0.052 | 5 | 84.6 | 4.02 | 20.30 | 64.5 | 10.37 | 15.48 |
© 2020 by the authors. Licensee MDPI, Basel, Switzerland. This article is an open access article distributed under the terms and conditions of the Creative Commons Attribution (CC BY) license (http://creativecommons.org/licenses/by/4.0/).
Share and Cite
Mesfer, M.K.A.; Danish, M.; Khan, M.I.; Ali, I.H.; Hasan, M.; Jery, A.E. Continuous Fixed Bed CO2 Adsorption: Breakthrough, Column Efficiency, Mass Transfer Zone. Processes 2020, 8, 1233. https://doi.org/10.3390/pr8101233
Mesfer MKA, Danish M, Khan MI, Ali IH, Hasan M, Jery AE. Continuous Fixed Bed CO2 Adsorption: Breakthrough, Column Efficiency, Mass Transfer Zone. Processes. 2020; 8(10):1233. https://doi.org/10.3390/pr8101233
Chicago/Turabian StyleMesfer, Mohammed K. Al, Mohd Danish, Mohammed Ilyas Khan, Ismat Hassan Ali, Mudassir Hasan, and Atef El Jery. 2020. "Continuous Fixed Bed CO2 Adsorption: Breakthrough, Column Efficiency, Mass Transfer Zone" Processes 8, no. 10: 1233. https://doi.org/10.3390/pr8101233
APA StyleMesfer, M. K. A., Danish, M., Khan, M. I., Ali, I. H., Hasan, M., & Jery, A. E. (2020). Continuous Fixed Bed CO2 Adsorption: Breakthrough, Column Efficiency, Mass Transfer Zone. Processes, 8(10), 1233. https://doi.org/10.3390/pr8101233