The Effects of Port Water Injection on Spark Ignition Engine Performance and Emissions Fueled by Pure Gasoline, E5 and E10


 ,
,
Abstract
1. Introduction
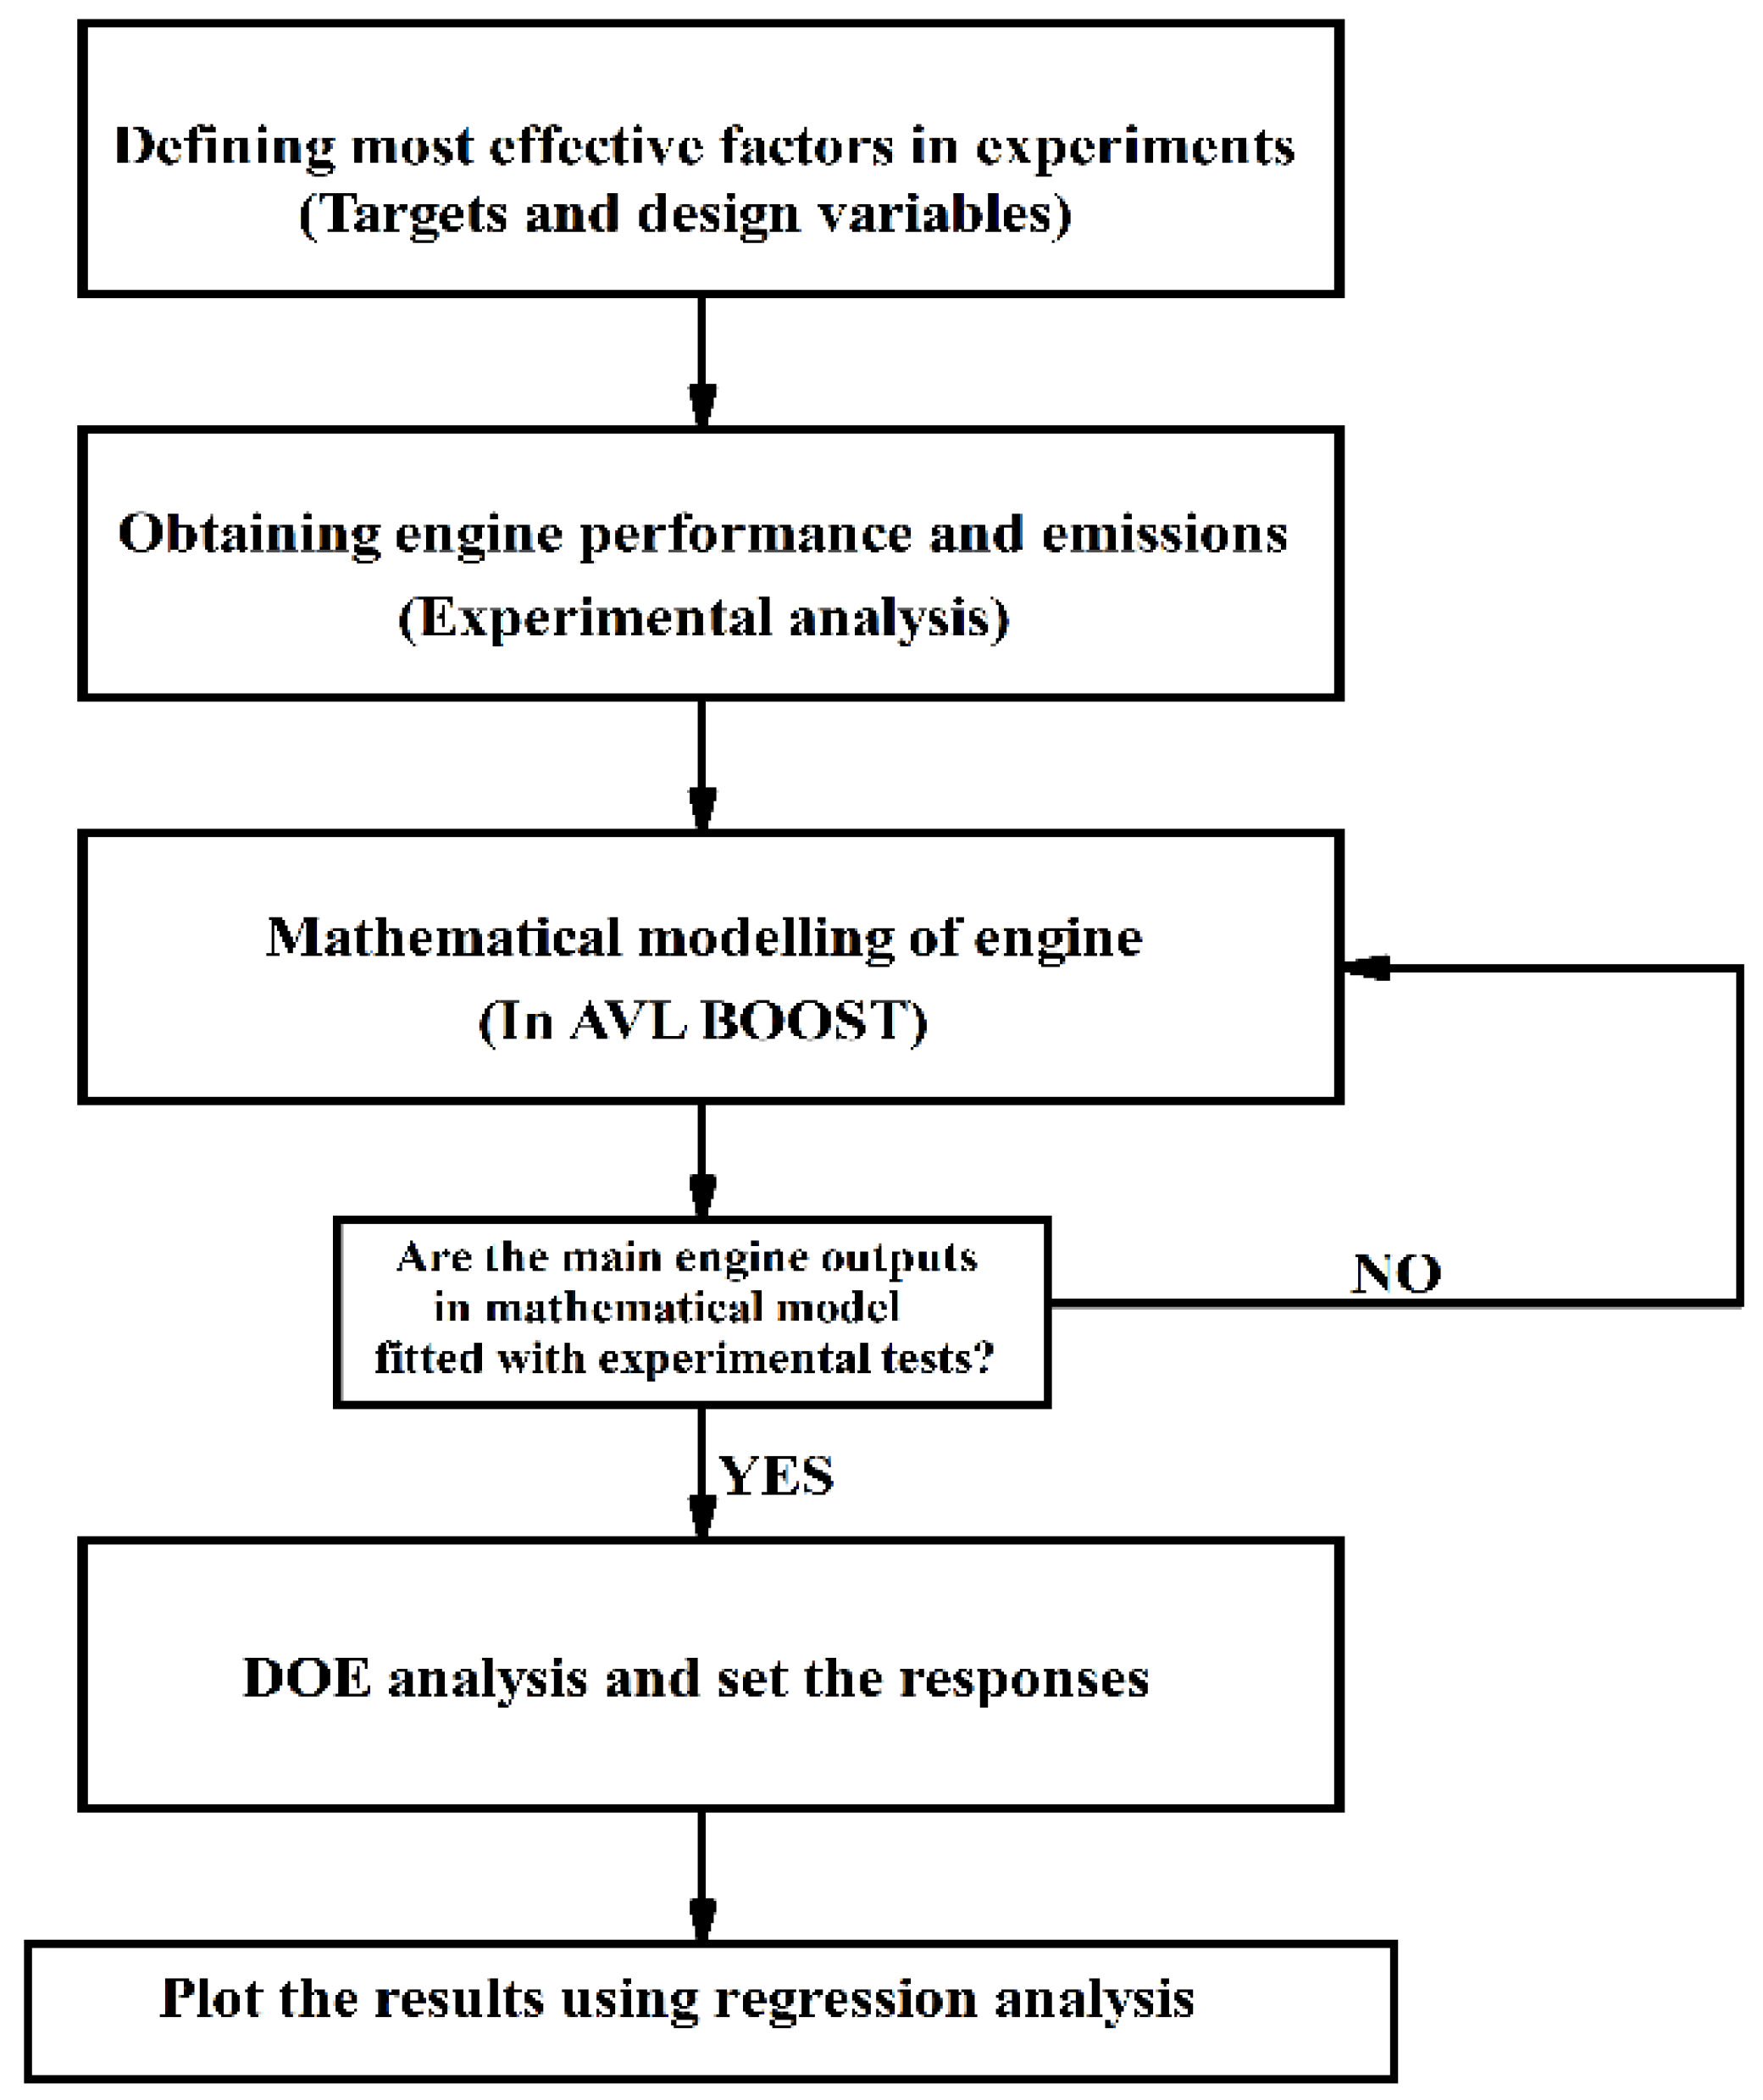
2. Methodology
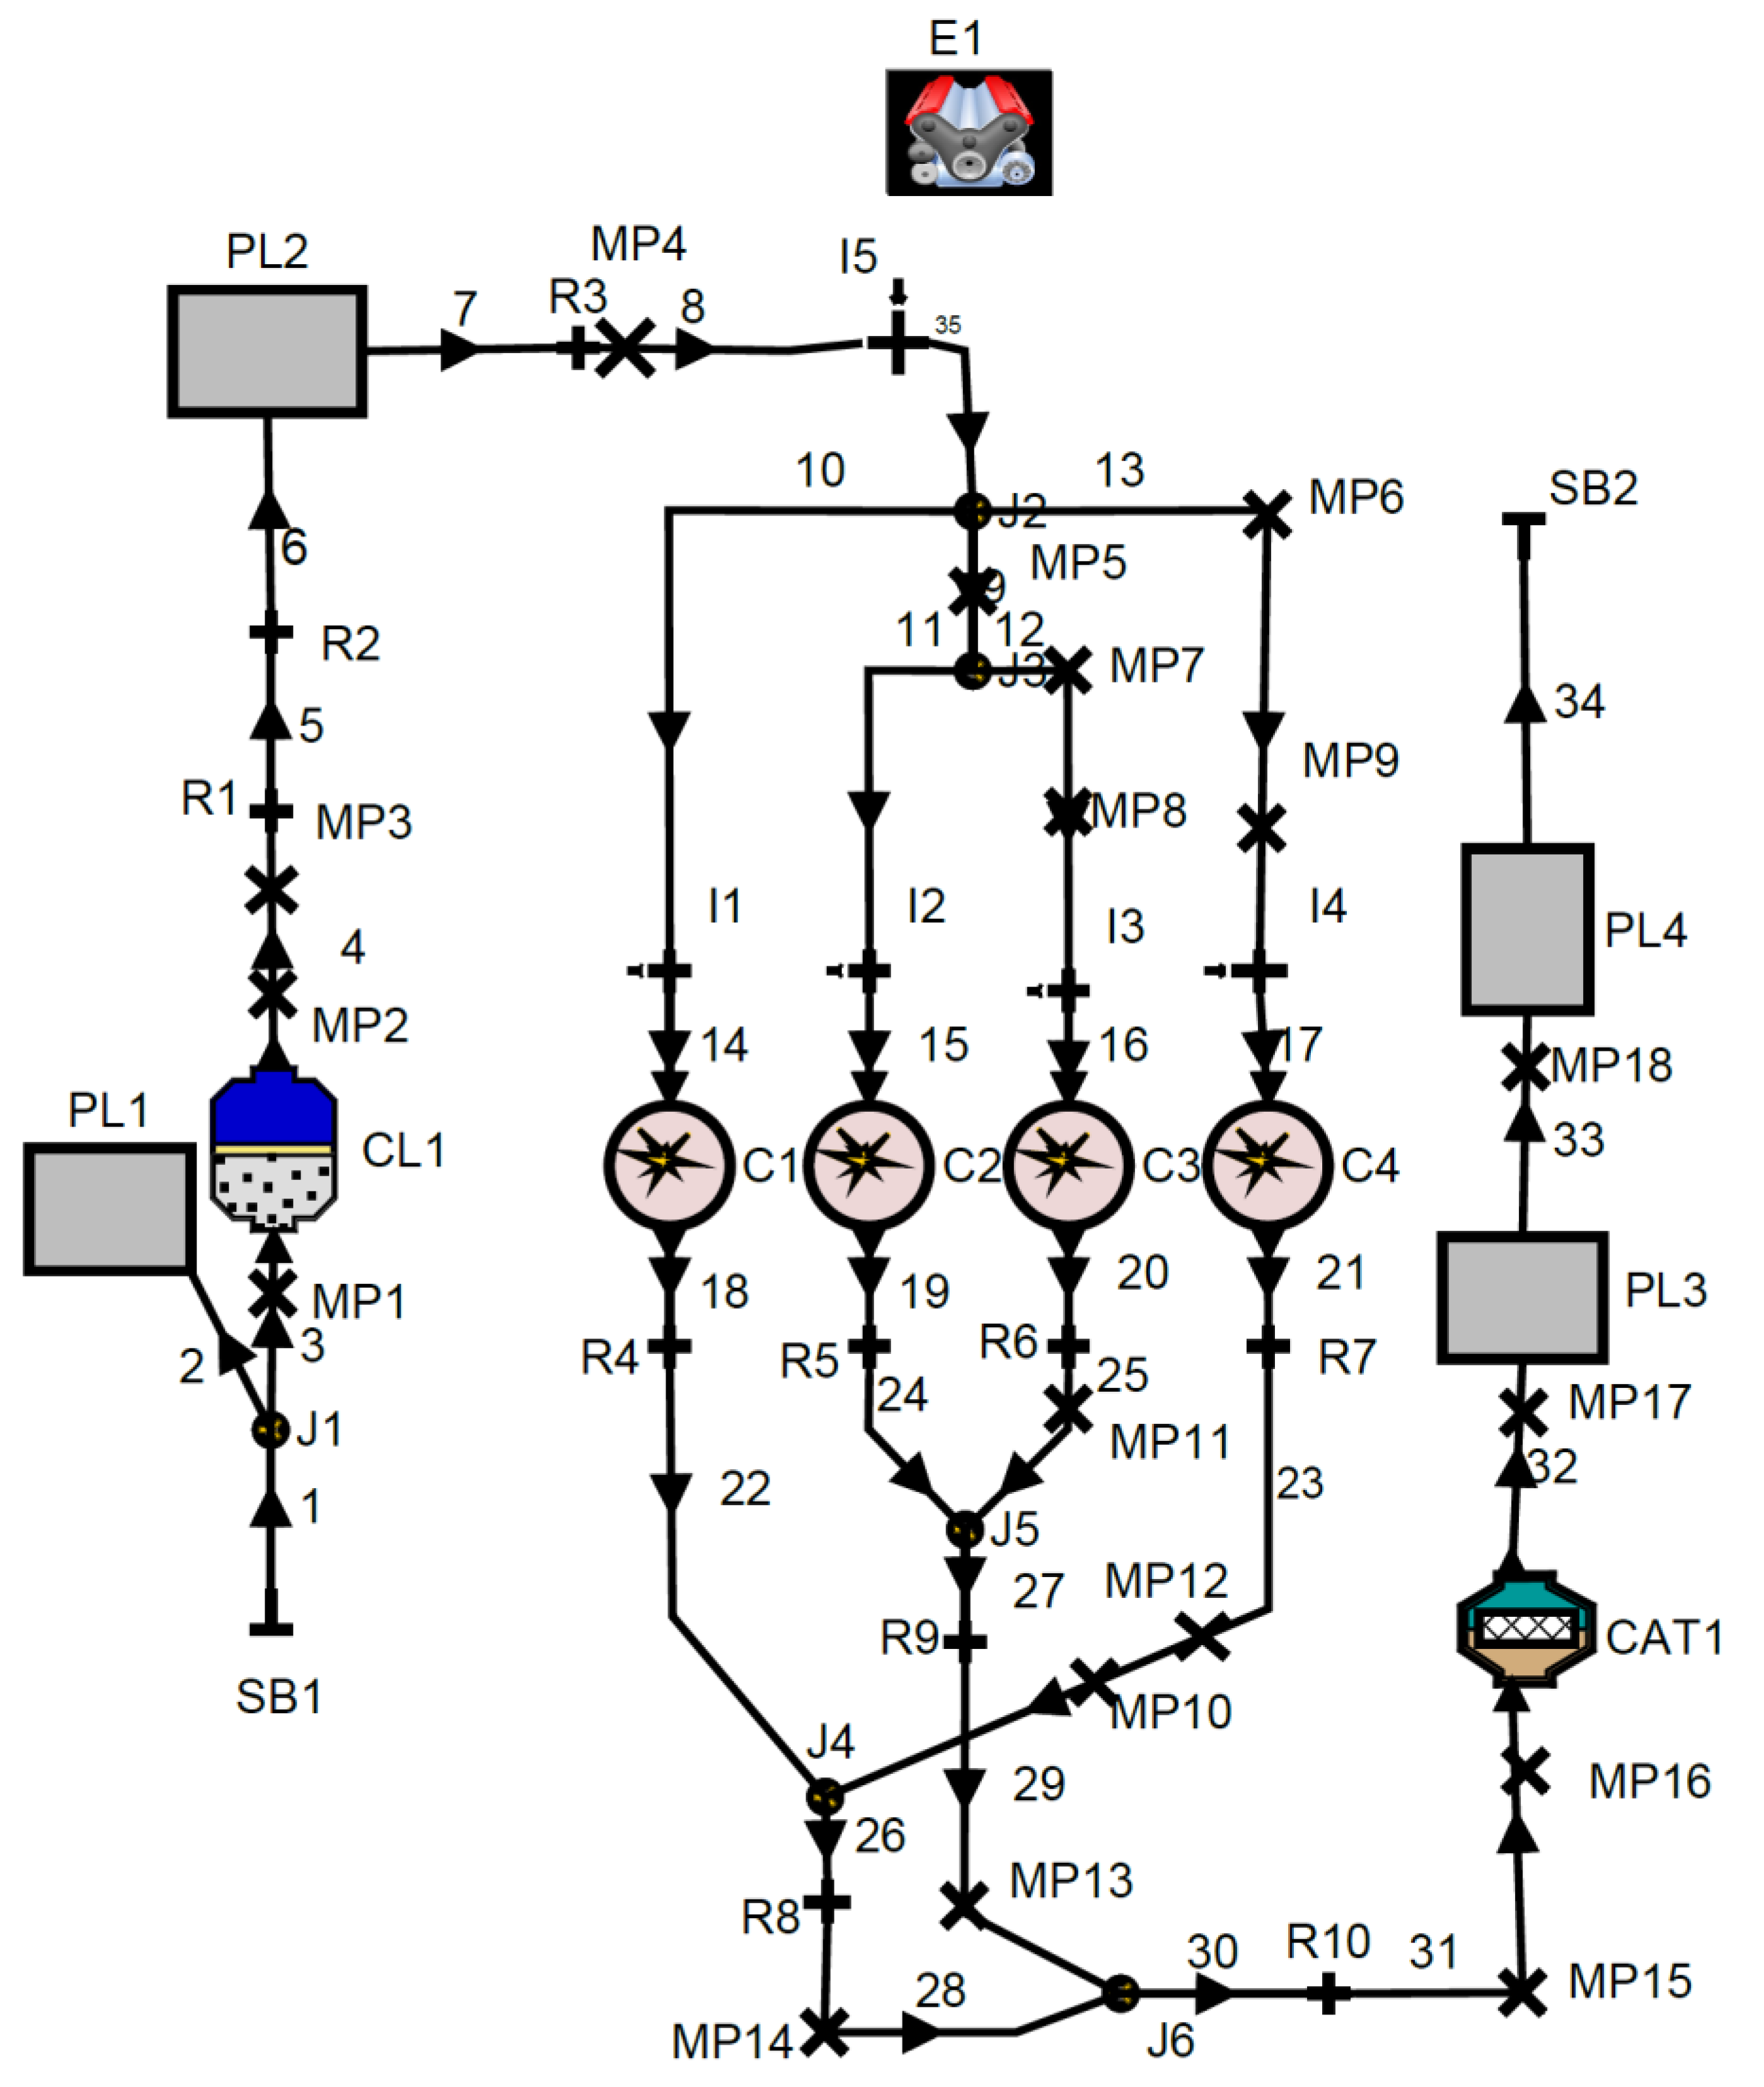
2.1. Experimental Study
2.2. Engine Mathematical Model
2.2.1. Combustion and Heat Transfer Models
2.2.2. Emission Model
2.2.3. Knock Model
2.3. Validation
2.4. Design of Experiments Method and Analysis
3. Results and Discussion
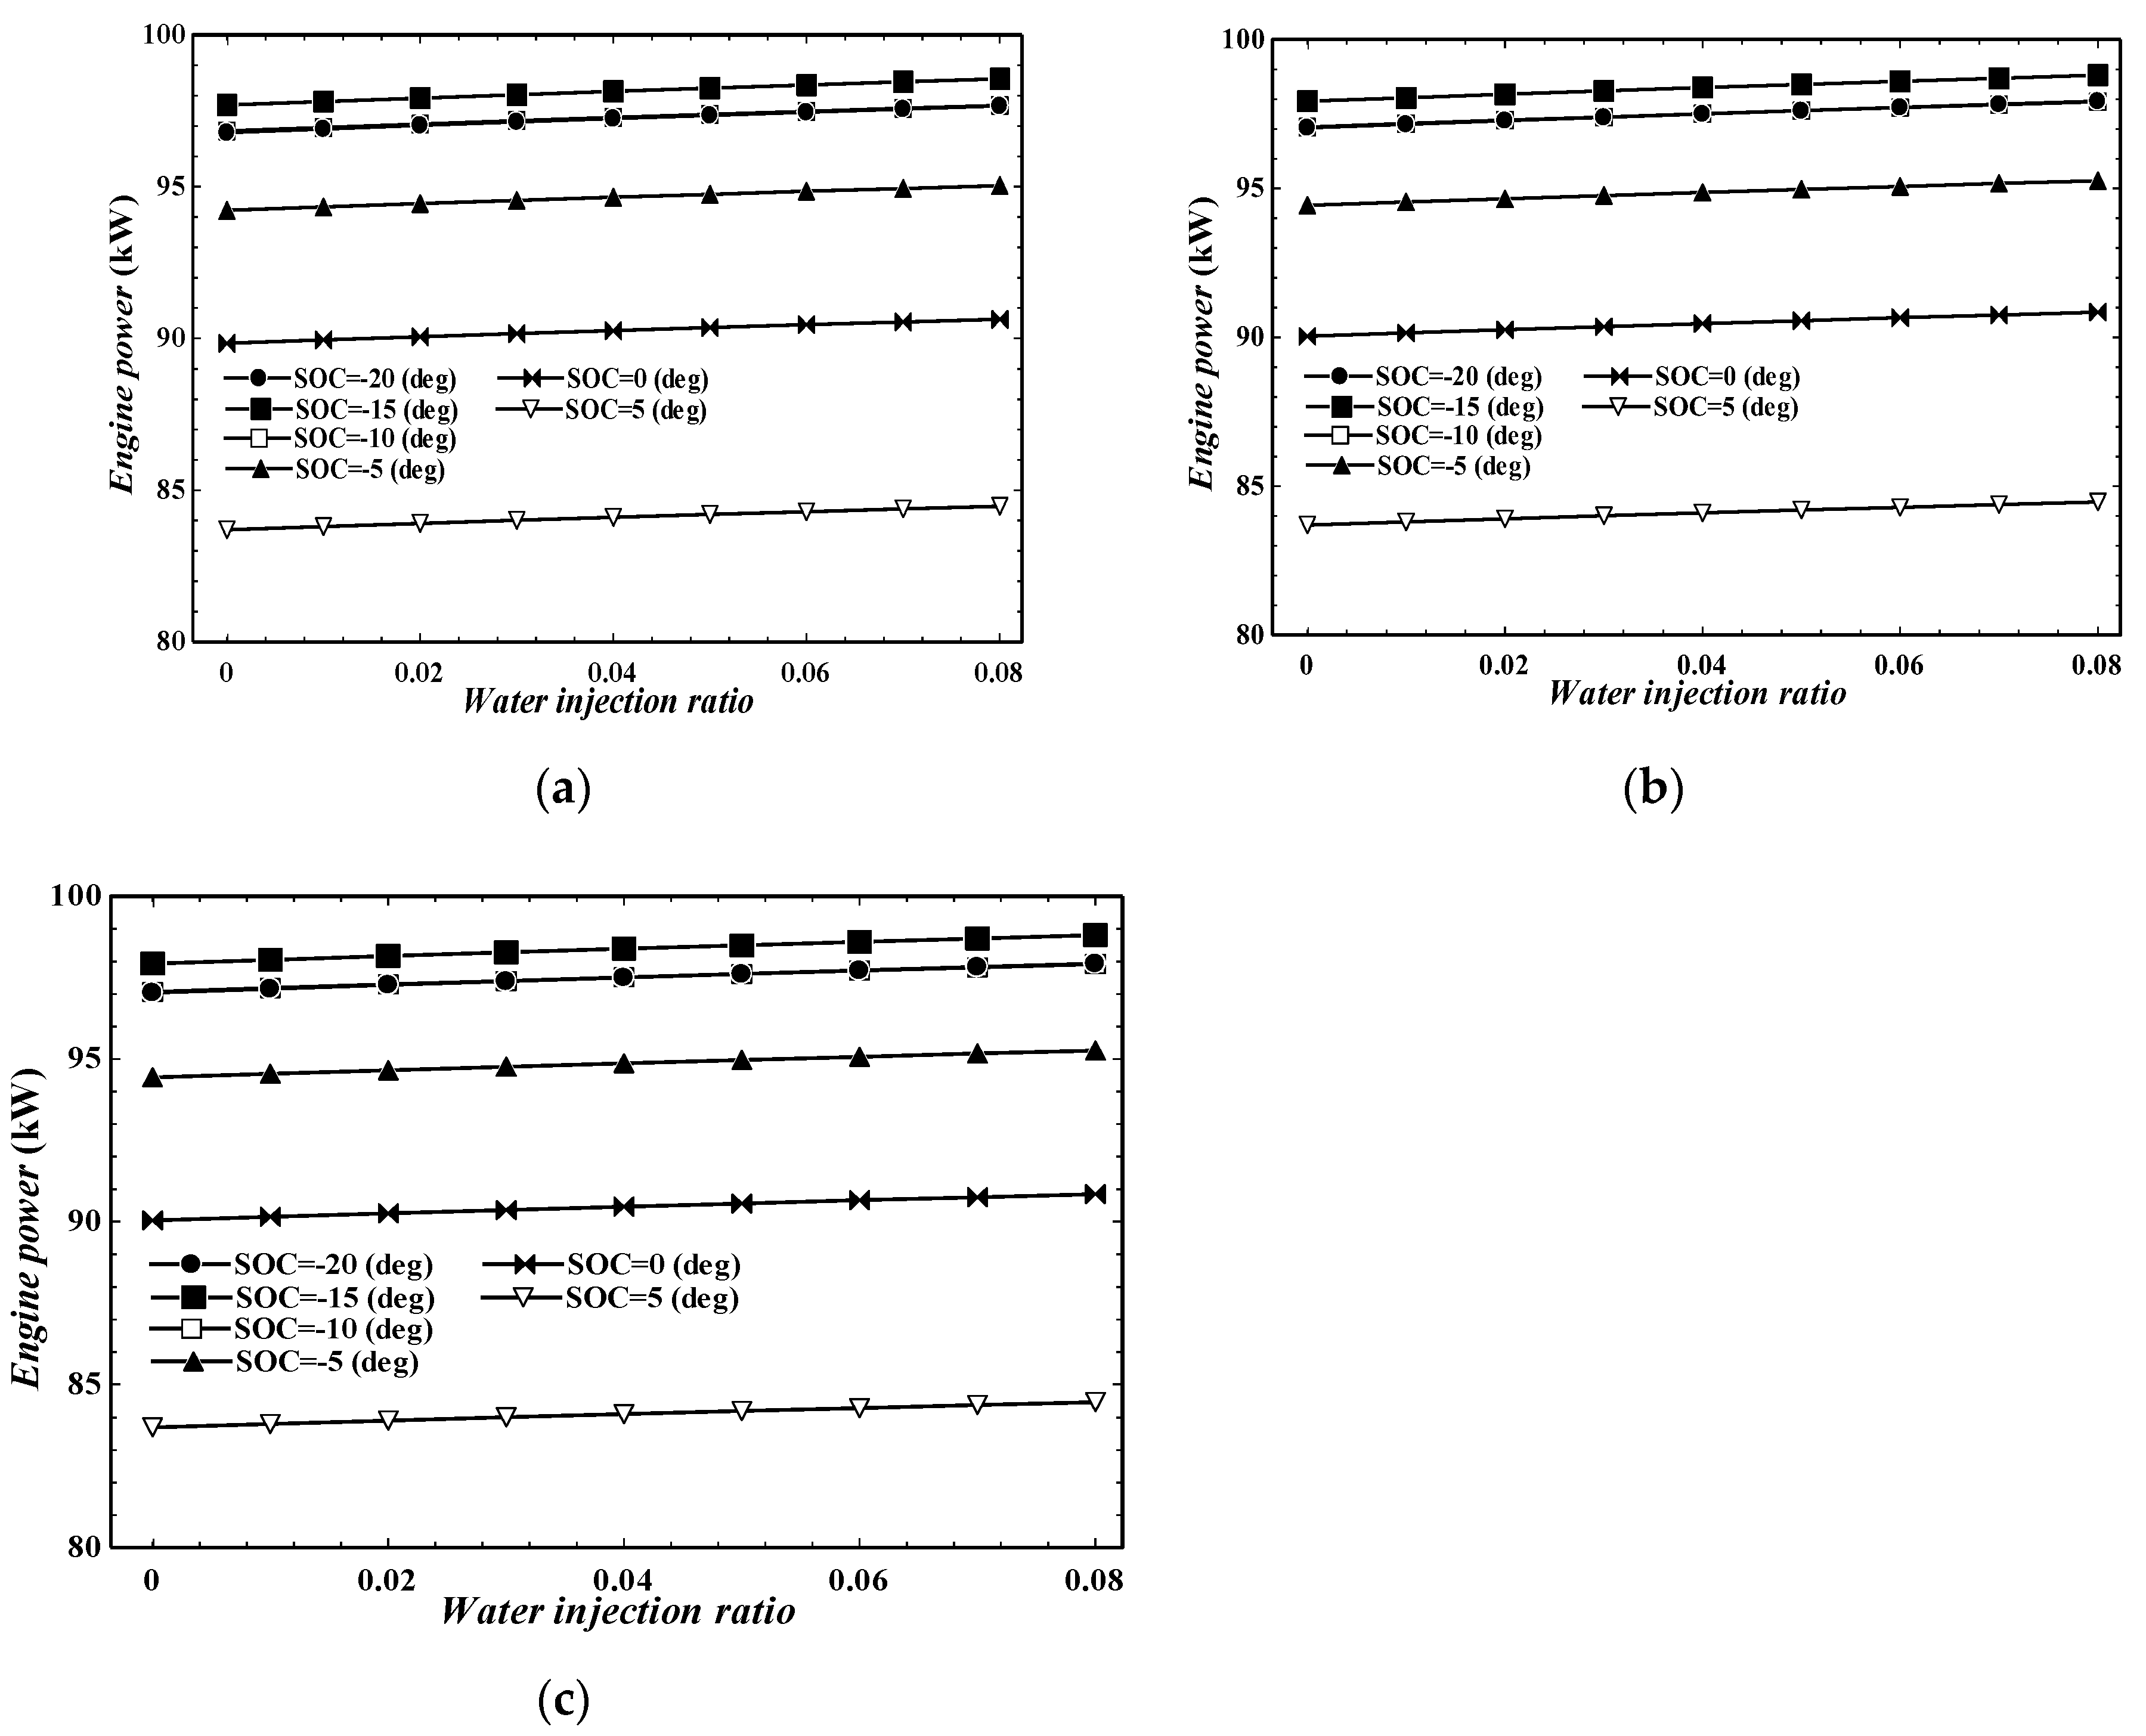
3.1. Engine Performance Parameters
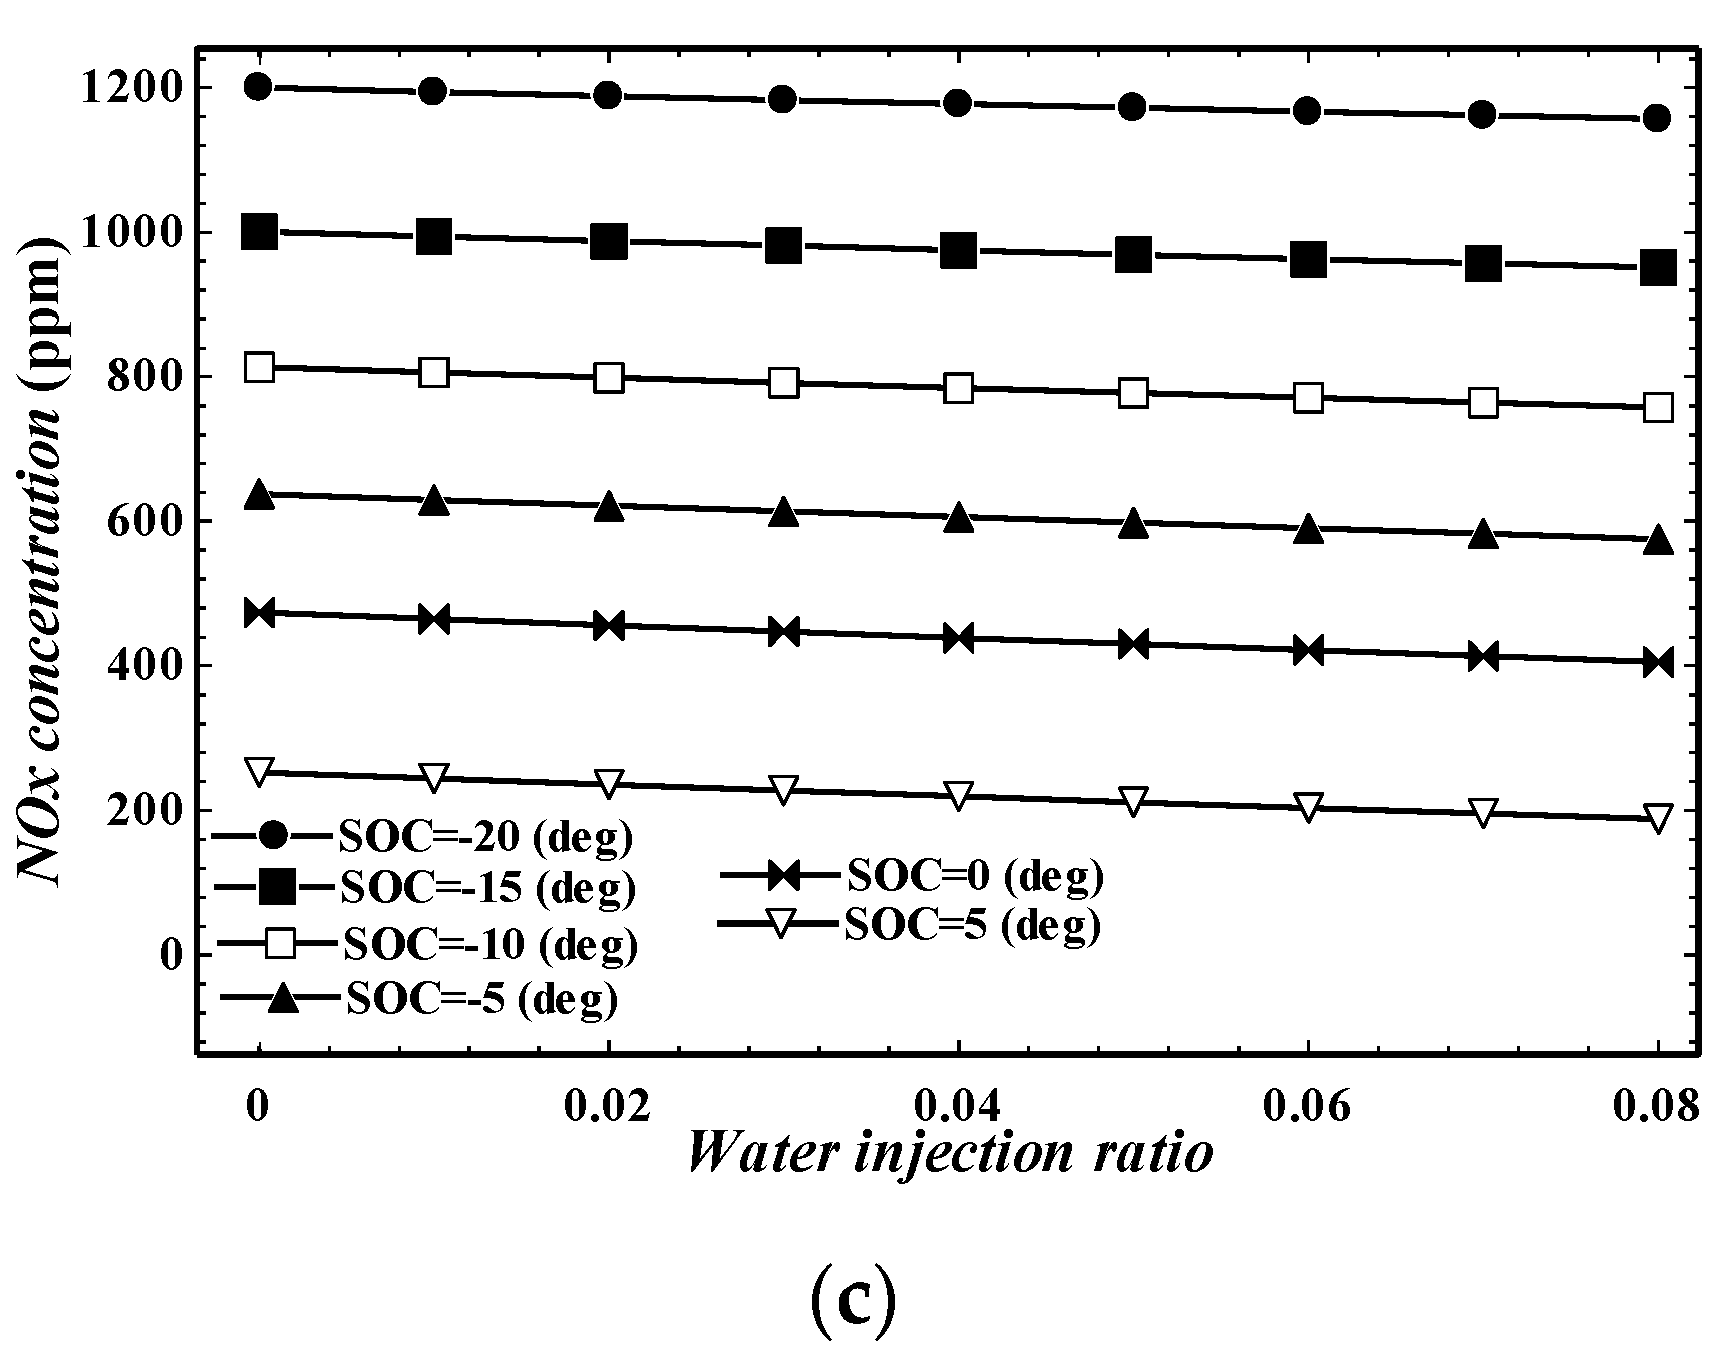
3.2. NOx Emissions and Peak Cylinder Temperature
3.3. The Effects of Start of Combustion Parameter
4. Conclusions
- -
- Increasing the ethanol fraction from E5 to E10 resulted in a small increase in the power output of the engine.
- -
- Adding ethanol also showed a small positive impact on BMEP.
- -
- Comparing E5 and E10 fuels with gasoline, the engine BSFC decreased by nearly 2.3% and 4.5%, respectively. So, a better fuel economy and reduction in greenhouse gas emissions are expected as a result of an increase in the ethanol content.
- -
- With the combination of E10 fuel and 8% water injection, an increase of approximately 1.3% in engine power output can be obtained, when compared with a gasoline fueled engine.
- -
- The break thermal efficiency was not changed significantly between E5 and E10. Compared with gasoline, the brake thermal efficiency increased by about 1% for E10. Water injection did not make any significant difference in improving the thermal efficiency for all fuels.
- -
- By using E10 instead of E5, BSFC decreased by approximately 2% to 307 g/kWh. Comparing E5 and E10 fuels with gasoline, the engine BSFC decreased by nearly 2.3% and 4.5%, consecutively.
- -
- Changing the fuel from gasoline to E5 and E10 resulted in an increase in peak cylinder temperature, which led to an increase in NOx formation of up to 22% and 48%, for E5 and E10, respectively.
- -
- Water injection can reduce the NOx formation rate by up to nearly 8%.
- -
- The engine power generation rate has changed slightly as a result of the injection of water at various ratios for different values of SOC.
Author Contributions
Funding
Acknowledgments
Conflicts of Interest
Nomenclature
| DOE | Design of experiment |
| I | Injector |
| C | Cylinder |
| CAT | Catalyst converter |
| CL | Air cleaner |
| MP | Measure point |
| PL | Plenium |
| BSFC | Brake specific fuel consumption [g/kWh] |
| WIR | Water injection ratio |
| mf | Mass fraction |
| SOC | Start of combustion |
| BDUR | Burn duration |
| ∝ | Crank shaft angle |
| m | Wiebe shape |
| a | Wiebe parameter |
| Overall efficiency | |
| E | Engine |
| SB | System boundary |
| CO | Carbon monoxide |
| NOx | Nitrogen oxide |
| COVID-19 | Corona virus |
| BMEP | Brake mean effective pressure [bar] |
| WLTP | Worldwide harmonised light vehicle test procedure |
| Subscripts | |
| eqv | Equivalent |
| u | Unburnt |
| b | Burnt |
| w | Wall heat loss |
| f | Fuel |
References
- Fagundez, J.L.; Sari, R.L.; Martins, M.E.; Salau, N.P. Experimental Evaluation of the Emissions in an Otto Cycle Engine Operating with Hydrous and Wet Ethanol under Different Compression Ratios; Report No.: 0148-7191; SAE International: Warrendale, PA, USA, 2018. [Google Scholar]
- Yu, X.; Guo, Z.; Sun, P.; Wang, S.; Li, A.; Yang, H.; Li, Z.; Liu, Z.; Li, J.; Shang, Z. Investigation of combustion and emissions of an SI engine with ethanol port injection and gasoline direct injection under lean burn conditions. Energy 2019, 189, 116231. [Google Scholar] [CrossRef]
- Hwang, J.T.; Nord, A.J.; Northrop, W.F. Efficacy of Add-On Hydrous Ethanol Dual Fuel Systems to Reduce NOX Emissions from Diesel Engines. J. Energy Resour. Technol. 2017, 139. [Google Scholar] [CrossRef]
- Carrington, D. Coronavirus Detected on Particles of Air Pollution 2020. Available online: https://www.theguardian.com/environment/2020/apr/24/coronavirus-detected-particles-air-pollution (accessed on 26 September 2020).
- Friedman, L. New Research Links Air Pollution to Higher Coronavirus Death Rates 2020. Available online: https://www.nytimes.com/2020/04/07/climate/air-pollution-coronavirus-covid.html (accessed on 24 April 2020).
- Kay, D.; Hill, N.; Newman, D. Powering Ahead: The Future of Low-Carbon Cars and Fuels; UK Petroleum Industry Association (UKPIA): London, UK; Royal Automobile Club Foundation: London, UK, 2013. [Google Scholar]
- Successfully Deploying E10 Petrol 2017. Available online: https://www.lowcvp.org.uk/assets/reports/Successfully%20Deploying%20E10%20Petrol%20(LowCVP%20final%20report).pdf (accessed on 26 September 2020).
- Alique, D.; Bruni, G.; Sanz, R.; Calles, J.A.; Tosti, S. Ultra-Pure Hydrogen via Co-Valorization of Olive Mill Wastewater and Bioethanol in Pd-Membrane Reactors. Processes 2020, 8, 219. [Google Scholar] [CrossRef]
- Cuevas, M.; Saleh, M.; García-Martín, J.F.; Sánchez, S. Acid and enzymatic fractionation of olive stones for ethanol production using Pachysolen tannophilus. Processes 2020, 8, 195. [Google Scholar] [CrossRef]
- Kongkeitkajorn, M.B.; Sae-Kuay, C.; Reungsang, A. Evaluation of Napier Grass for Bioethanol Production through a Fermentation Process. Processes 2020, 8, 567. [Google Scholar] [CrossRef]
- Mofijur, M.; Ong, H.C.; Jan, B.M.; Kusumo, F.; Sebayang, A.H.; Husin, H.; Silitonga, A.S.; Mahlia, T.M.I.; Rahman, S.M.A. Production Process and Optimization of Solid Bioethanol from Empty Fruit Bunches of Palm Oil Using Response Surface Methodology. Processes 2019, 7, 715. [Google Scholar]
- Zentou, H.; Abidin, Z.Z.; Yunus, R.; Biak, A.; Radiah, D.; Korelskiy, D. Overview of Alternative Ethanol Removal Techniques for Enhancing Bioethanol Recovery from Fermentation Broth. Processes 2019, 7, 458. [Google Scholar] [CrossRef]
- Emission Analytics. What’s the Problem with Biofuels? Available online: https://www.emissionsanalytics.com/news/whats-the-problem-with-biofuels (accessed on 26 September 2020).
- Canakci, M.; Ozsezen, A.N.; Alptekin, E.; Eyidogan, M. Impact of alcohol-gasoline fuel blends on the exhaust emission of an SI engine. Renew. Energy 2013, 52, 111–117. [Google Scholar] [CrossRef]
- Tutak, W.; Jamrozik, A. Comparative analysis of combustion stability of diesel/ethanol utilization by blend and dual fuel. Processes 2019, 7, 946. [Google Scholar] [CrossRef]
- Zhuang, Y.; Ma, Y.; Qian, Y.; Teng, Q.; Wang, C. Effects of ethanol injection strategies on mixture formation and combustion process in an ethanol direct injection (EDI) plus gasoline port injection (GPI) spark-ignition engine. Fuel 2020, 268, 117346. [Google Scholar] [CrossRef]
- Huang, Y.; Hong, G.; Huang, R. Effect of injection timing on mixture formation and combustion in an ethanol direct injection plus gasoline port injection (EDI + GPI) engine. Energy 2016, 111, 92–103. [Google Scholar] [CrossRef]
- Ratcliff, M.A.; Windom, B.; Fioroni, G.M.; John, P.S.; Burke, S.; Burton, J.; Christensena, E.D.; Sindlera, P.; McCormick, R.L. Impact of ethanol blending into gasoline on aromatic compound evaporation and particle emissions from a gasoline direct injection engine. Appl. Energy 2019, 250, 1618–1631. [Google Scholar] [CrossRef]
- Zhuang, Y.; Qian, Y.; Hong, G. The effect of ethanol direct injection on knock mitigation in a gasoline port injection engine. Fuel 2017, 210, 187–197. [Google Scholar] [CrossRef]
- Qian, Y.; Liu, G.; Guo, J.; Zhang, Y.; Zhu, L.; Lu, X. Engine performance and octane on demand studies of a dual fuel spark ignition engine with ethanol/gasoline surrogates as fuel. Energy Convers. Manag. 2019, 183, 296–306. [Google Scholar] [CrossRef]
- Bui, V.; Tran, V.; Nguyen, V.; Nguyen, Q.; Huynh, T. Octane number stratified mixture preparation by gasoline-ethanol dual injection in SI engines. Int. J. Environ. Sci. Technol. 2019, 16, 3021–3034. [Google Scholar] [CrossRef]
- Costa, R.C.; Sodré, J.R. Hydrous ethanol vs. gasoline-ethanol blend: Engine performance and emissions. Fuel 2010, 89, 287–293. [Google Scholar] [CrossRef]
- Talebizadeh, P.; Babaie, M.; Brown, R.; Rahimzadeh, H.; Ristovski, Z.; Arai, M. The role of non-thermal plasma technique in NOx treatment: A review. Renew. Sustain. Energy Rev. 2014, 40, 886–901. [Google Scholar] [CrossRef]
- Babaie, M.; Kishi, T.; Arai, M.; Zama, Y.; Furuhata, T.; Ristovski, Z.; Rahimzadeh, H.; Brown, R.J. Influence of non-thermal plasma after-treatment technology on diesel engine particulate matter composition and NOX concentration. Int. J. Environ. Sci. Technol. 2016, 13, 221–230. [Google Scholar] [CrossRef]
- Ahmed, S.A.; Zhou, S.; Zhu, Y.; Feng, Y.; Malik, A.; Ahmad, N. Influence of Injection Timing on Performance and Exhaust Emission of CI Engine Fuelled with Butanol-Diesel Using a 1D GT-Power Model. Processes 2019, 7, 299. [Google Scholar] [CrossRef]
- Iliev, S. A comparison of ethanol and methanol blending with gasoline using a 1-D engine model. Proc. Eng. 2015, 100, 1013–1022. [Google Scholar] [CrossRef]
- Iliev, S.P. Developing of a 1-D Combustion model and study of engine performance and exhaust emission using ethanol-gasoline blends. In Transactions on Engineering Technologies; Springer: Dordrecht, The Netherlands, 2015; pp. 85–98. [Google Scholar]
- Ogink, R.; Golovitchev, V. Gasoline HCCI modeling: Computer program combining detailed chemistry and gas exchange processes. SAE Trans. 2001, 110, 2338–2350. [Google Scholar]
- Kitanoski, F.; Puntigam, W.; Kozek, M.; Hager, J. An Engine Heat Transfer Model for Comprehensive Thermal Simulations; Report No.: 0148-7191; SAE International: Warrendale, PA, USA, 2006. [Google Scholar]
- Sharma, N. Knock Model Evaluation—Gas Engine. Master’s Thesis, School of Industrial Engineering and Management, Stockholm, Switzerland, 27 August 2018. [Google Scholar]
- Livengood, J. Correlation of autoignition phenomena in internal combustion engines and rapid compression machines. In Proceedings of the 5th Symposium (International) on Combustion: Combustion in Engines and Combustion Kinetics, Pittsburgh, PA, USA, 30 August–3 September 1954; pp. 347–356. [Google Scholar]


| Parameter | Unit | Value |
|---|---|---|
| Bore | mm | 86 |
| Stroke | mm | 86 |
| Connecting rod length | mm | 143.5 |
| Number of Cylinders | - | 4 |
| Displacement volume | cc | 2000 |
| Maximum RPM | RPM | 7000 |
| Rated RPM | RPM | 6000 |
| Compression Ratio | 10.5 |
| Fuel Type | Ethanol Volume Fraction (%) |
|---|---|
| Gasoline | 0 |
| E5 (5% ethanol, 95% gasoline) | 5 |
| E10 (10% ethanol, 90% gasoline) | 10 |
| Design Parameter | Unit | Minimum Value | Maximum Value |
|---|---|---|---|
| Ethanol volume fraction | - | 0 | 0.1 |
| Water injection ratio | - | 0 | 0.08 |
| Start of combustion | Degree | −20 | 5 |
| Responses | cte | a | b | c | D | e | f | g | h | i |
|---|---|---|---|---|---|---|---|---|---|---|
| Power | 89.840 | −1.053 | 3.807 | 10.930 | −0.056 | −0.053 | 3.817 | −0.035 | 2.957 | −12.480 |
| BMEP | 8.992 | −0.105 | 0.381 | 1.094 | −0.006 | −0.005 | 0.382 | −0.004 | 0.296 | −1.249 |
| Brake power efficiency | 25.120 | −0.294 | 8.725 | 2.744 | −0.067 | −0.008 | 1.797 | −0.010 | 6.177 | −4.030 |
| Peak cylinder temperature | 2511 | −5.705 | 230 | −256.400 | 3.682 | 0.904 | 36.830 | 0.211 | −170.600 | 87.120 |
| NOx concentration | 3.787 × 10⁻⁴ | −2.651 × 10⁻⁵ | 1.688 × 10⁻³ | −7.633 × 10⁻⁴ | −1.019 × 10⁻⁴ | −1.545 × 10⁻⁵ | −0.002 | 2.357 × 10⁻⁷ | 0.004 | 4.331 × 10⁻⁴ |
| Responses | p-Value | R2 |
|---|---|---|
| Power | <0.0001 | 0.99 |
| BMEP | <0.0001 | 0.99 |
| Brake power efficiency | <0.0001 | 0.99 |
| Peak cylinder temperature | <0.0001 | 0.99 |
| CO concentration | <0.0001 | 0.99 |
| HC concentration | <0.0001 | 0.99 |
| NOx concentration | <0.0001 | 0.99 |
© 2020 by the authors. Licensee MDPI, Basel, Switzerland. This article is an open access article distributed under the terms and conditions of the Creative Commons Attribution (CC BY) license (http://creativecommons.org/licenses/by/4.0/).
Share and Cite
Salek, F.; Babaie, M.; Redel-Macias, M.D.; Ghodsi, A.; Hosseini, S.V.; Nourian, A.; Burby, M.L.; Zare, A. The Effects of Port Water Injection on Spark Ignition Engine Performance and Emissions Fueled by Pure Gasoline, E5 and E10. Processes 2020, 8, 1214. https://doi.org/10.3390/pr8101214
Salek F, Babaie M, Redel-Macias MD, Ghodsi A, Hosseini SV, Nourian A, Burby ML, Zare A. The Effects of Port Water Injection on Spark Ignition Engine Performance and Emissions Fueled by Pure Gasoline, E5 and E10. Processes. 2020; 8(10):1214. https://doi.org/10.3390/pr8101214
Chicago/Turabian StyleSalek, Farhad, Meisam Babaie, Maria Dolores Redel-Macias, Ali Ghodsi, Seyed Vahid Hosseini, Amir Nourian, Martin L Burby, and Ali Zare. 2020. "The Effects of Port Water Injection on Spark Ignition Engine Performance and Emissions Fueled by Pure Gasoline, E5 and E10" Processes 8, no. 10: 1214. https://doi.org/10.3390/pr8101214
APA StyleSalek, F., Babaie, M., Redel-Macias, M. D., Ghodsi, A., Hosseini, S. V., Nourian, A., Burby, M. L., & Zare, A. (2020). The Effects of Port Water Injection on Spark Ignition Engine Performance and Emissions Fueled by Pure Gasoline, E5 and E10. Processes, 8(10), 1214. https://doi.org/10.3390/pr8101214