Article

Experimental Study on the Effect of Polymer Injection Timing on Oil Displacement in Porous Media

1
State Key Laboratory of Oil & Gas Reservoir Geology and Exploitation, Southwest Petroleum University, Chengdu 610500, China
2
Engineering Technology Research Institute, CNPC Coalbed Methane Co., Ltd., Xi’an 710082, China
3
State Key Laboratory of Offshore Oil Exploitation, Beijing 100027, China
*
Author to whom correspondence should be addressed.
Processes 2020, 8(1), 93; https://doi.org/10.3390/pr8010093
Submission received: 4 December 2019 / Revised: 7 January 2020 / Accepted: 8 January 2020 / Published: 10 January 2020

Abstract

:
It has been proven that polymer injection at early times is beneficial to offshore heavy oil recovery. It is of significant importance to optimize the polymer injection timing and decide the residual oil distribution after polymer flooding. Aiming at a specific offshore heavy oil reservoir in Bohai, China, the optimum polymer injection timing is investigated through laboratory experiments. The influence of polymer injection timing on oil displacement and remaining oil distribution is analyzed by combining macroscopic and microscopic flooding experiments. The results reveal that the optimum polymer injection timing should be close to the water breakthrough, i.e., just before the waterflooding front reaches the outlet of the core. In addition, the waterflooding front position is analytically solved by using the Buckley–Leverett method and verified by experimental results, which supply an approach to predict the polymer injection timing. When polymer is injected before the waterflood front reaches the outlet of the core, the mobility control ability of polymer solution can reduce the fraction of bypassed volume of the reservoir by waterflooding. The early injected polymer mainly enters the high permeability zone, which works positively in two ways. Firstly, it improves the oil displacement efficiency of the high permeability zone. Secondly, the polymer establishes a flow resistance in the high permeable zones, thus improving the sweep efficiency in the low and medium permeability zones. However, our residual oil distribution experiments illustrate that there is still a large amount of oil remaining in the low and medium permeability zones. Therefore, it is necessary to explore additional EOR methods to recover the abundant residual oil.

1. Introduction

In the early stage of heavy oil reservoir in Bohai Sea, water injection is used to supplement formation energy, and the unfavorable mobility ratio leads to the rapid rise of water cut. After that, polymer flooding is used to enhance oil recovery. Polymer flooding is to increase the viscosity of the displacement phase, reduce the permeability of the displacement phase, and achieve the fluidity control, so as to improve the displacement effect and sweep efficiency. Polymer flooding technology has developed for many years and has become a mature application technology. However, there are few studies on injection timing of polymer flooding [1,2,3]. In 2002, field tests on early polymer injection (when water cut was 60%) were carried out in China Offshore Heavy Oil S Oilfield. The results proved that early polymer injection could improve both the production rate and the final oil recovery [4,5,6]. Owing to the short lifespans of offshore platforms, the “faster and more” recovery of crude oil in offshore oilfields was proposed to reach the optimum profit [7,8]. Herein, more research work was carried out to investigate the optimum polymer injection timing in recent years.
By conducting laboratory experiments on oil displacement, He et al. [9] found that the earlier the polymer was injected, the higher the oil recovery was. Zhou [10] and Liu et al. [11] carried out numerical simulation studies of polymer flooding under different water cut conditions, i.e., the water cut ranged from 0% to 95%, and discovered that the highest oil recovery was achieved at water cut of 0%. Other researchers [11,12,13,14,15,16] also pinpointed the same conclusion that the best injection timing was the moment when water cut was 0%, by using both physical experiments and numerical simulations at various reservoir conditions. Meanwhile, Shi et al. [17] studied the polymer injection timing on Bohai offshore heavy oil fields by utilizing the relative permeability curves. Considering the short service life of offshore platforms, they concluded that the optimum polymer injection timing was corresponding to a water saturation when Δ J (the difference between the dimensionless productivity indexes in the water flooding and polymer flooding processes) reached maximum. Gao et al. [18] found that both the final oil recovery and injection pressure increased with earlier polymer injection, by conducting core flooding tests on both homogeneous and heterogenous artificial cores. Thereby, by taking into account the practicality, performance, and economic viability, the authors recommend the water cut of 60% as the optimal injection timing. The success of oilfield tests has proven that the conclusions of early polymer flooding obtained through laboratory experiments and numerical simulations were valid, which motivated further investigation into establishing an optimum injection timing range for polymer flooding and shedding light on more efficient offshore oilfield development. Kang et al. [19] described an early polymer injection in the offshore oilfield JZW and emphasized that there was still tremendous remaining oil after early polymer injection. The author proposed that a full understanding of the distribution of remaining oil in reservoirs could guide further improvement in oil recovery.
The study of the optimal polymer flooding time is beneficial to the application of polymer flooding in offshore oil fields. Recognizing the distribution characteristics of remaining oil after early polymer injection is conducive to the selection of production mode of offshore oil after polymer flooding. Then, in this paper, the optimum injection timing of polymer flooding was investigated by conducting both macro and micro laboratory experiments based on our previous study [17]. In addition, the polymer injection timing was predicted analytically by using the Buckley–Leverett method. Finally, characteristics of the remaining oil were decided by means of saturation monitoring [20,21], which directed ways to further enhance oil recovery after early polymer injection.

2. Experimental Section

2.1. Materials and Apparatus

2.1.1. Materials

Oil sample. A crude oil was diluted by diesel to obtain a viscosity of 70 mPa·s at 65 ℃.
Brine. The composition of both formation brine and injection brine used in our experiments is listed in Table 1.
Polymer. An associative polymer (AP-P4) was purchased from Guangya Company, Sichuan, China. The polymer solution with a concentration of 1750 mg/L has an apparent viscosity of 18 mPa·s after being pre-sheared by a Waring Blender (3500 rpm for 20 s). For more information, refer to Li et al. [22] and Guo et al. [23].
Core samples. Three types of sandstone core samples were made in our lab using quartz sand with different particle sizes. More detailed descriptions are as follows:
(1)
Homogeneous cores. The dimensions are 25 mm in diameter and 500 mm in length. Gas permeability is 2500 mD. Water permeability is 810 mD.
(2)
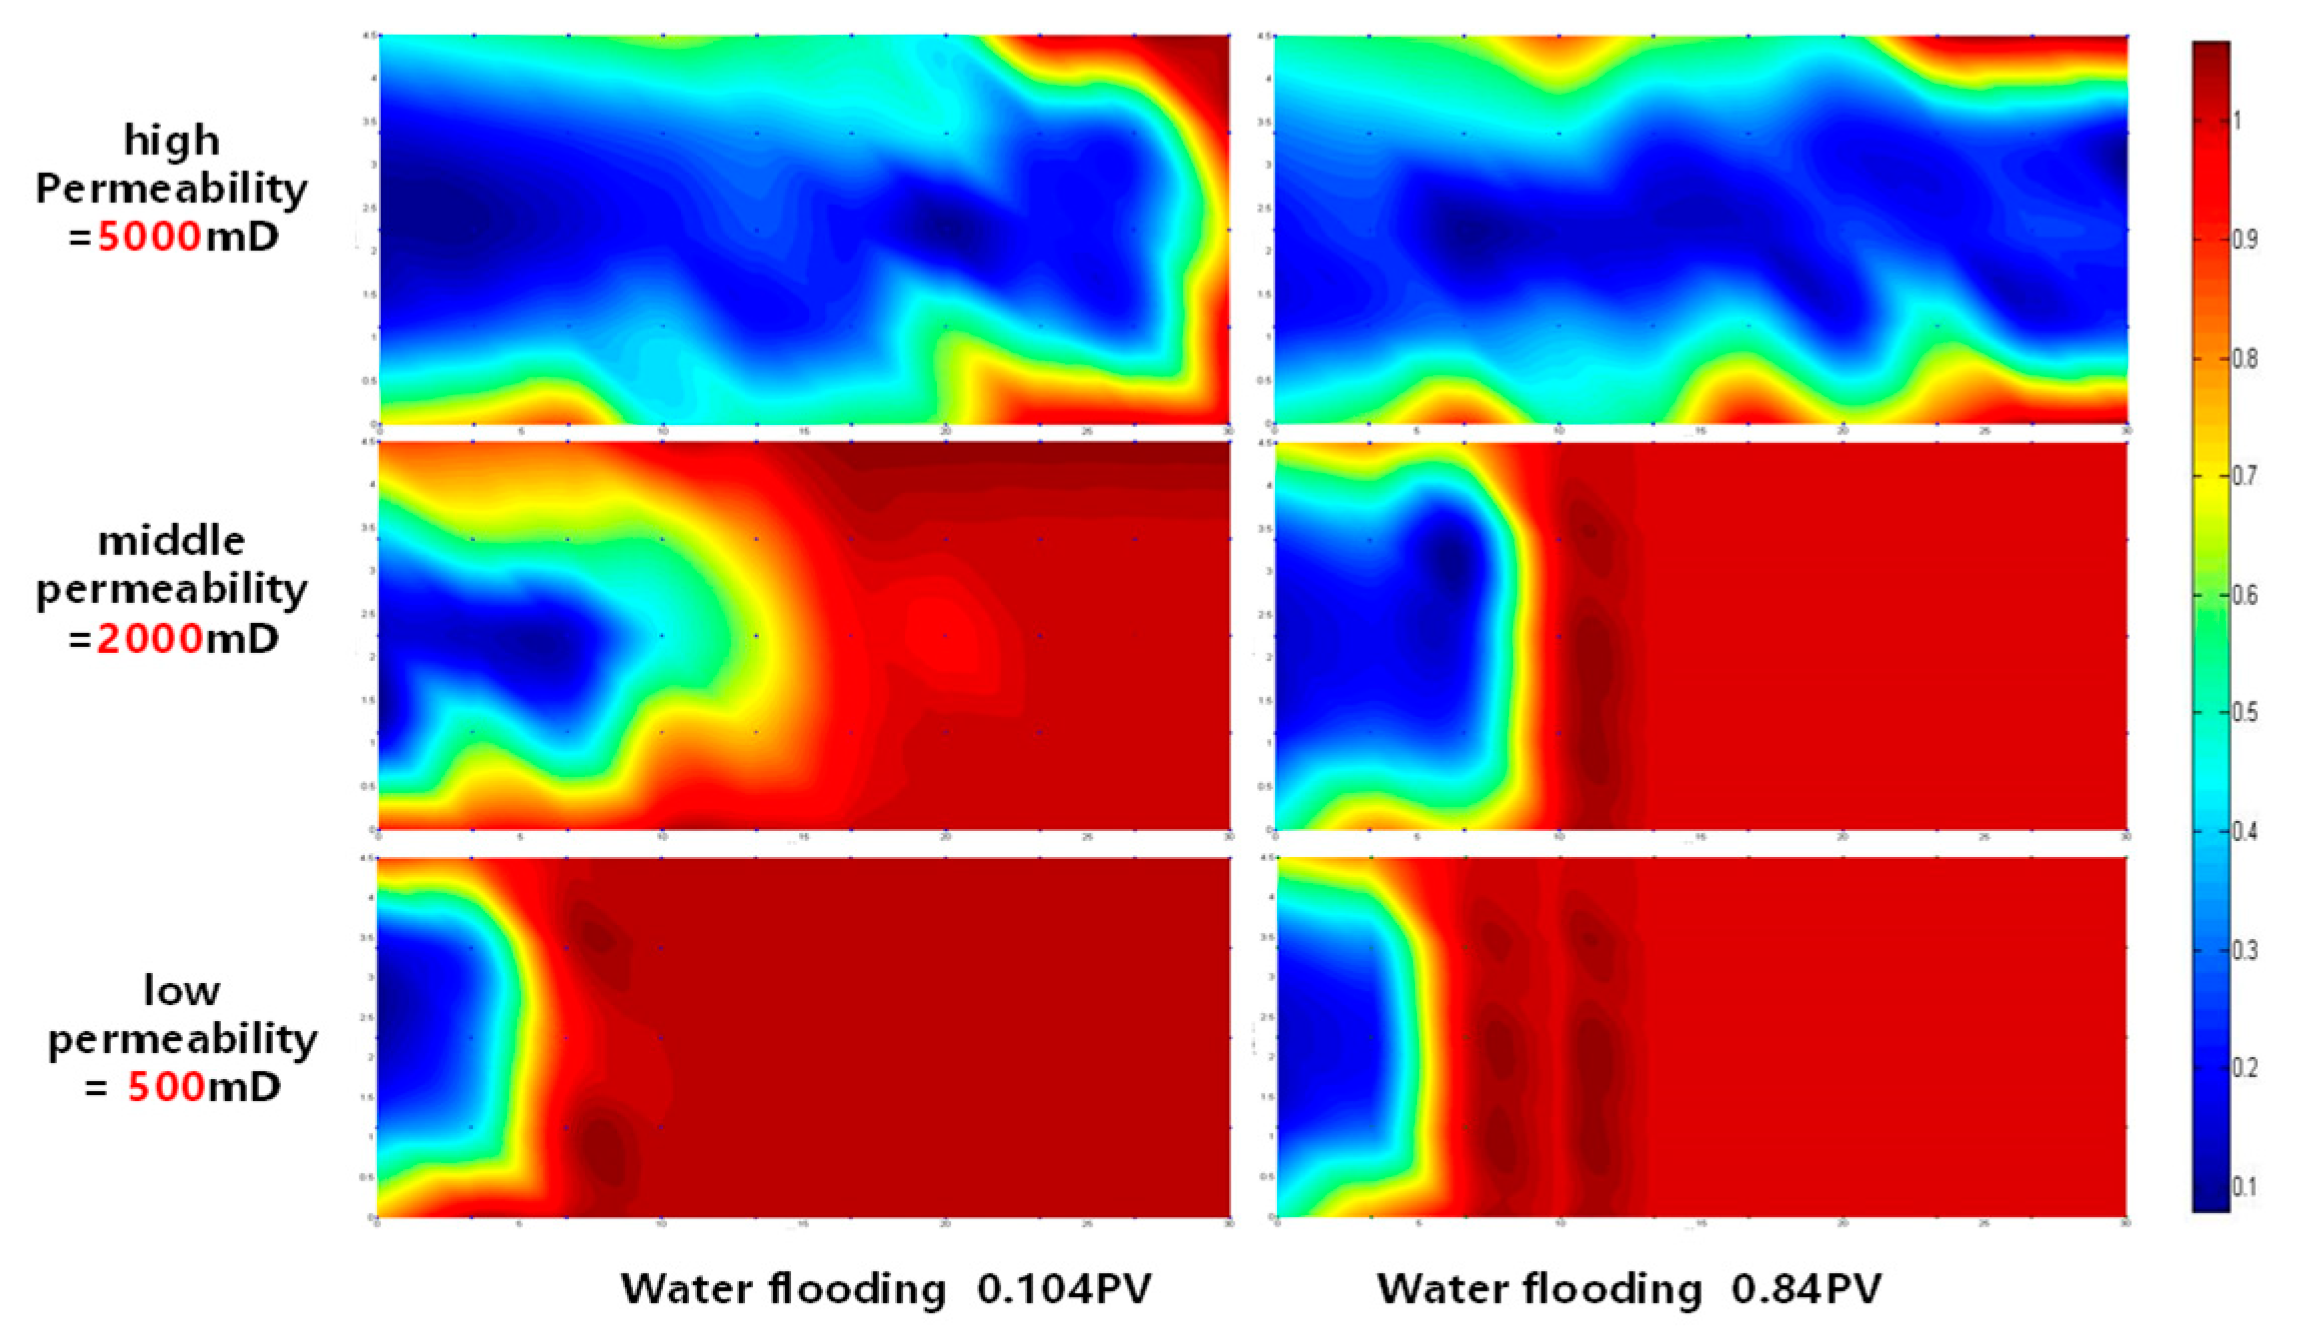
Three-layered heterogeneous cores. The dimensions are 45 mm in width, 45 mm in height, and 300 mm in length. The permeabilities of three layers from top to bottom are 5000/2000/500 mD, respectively.
(3)
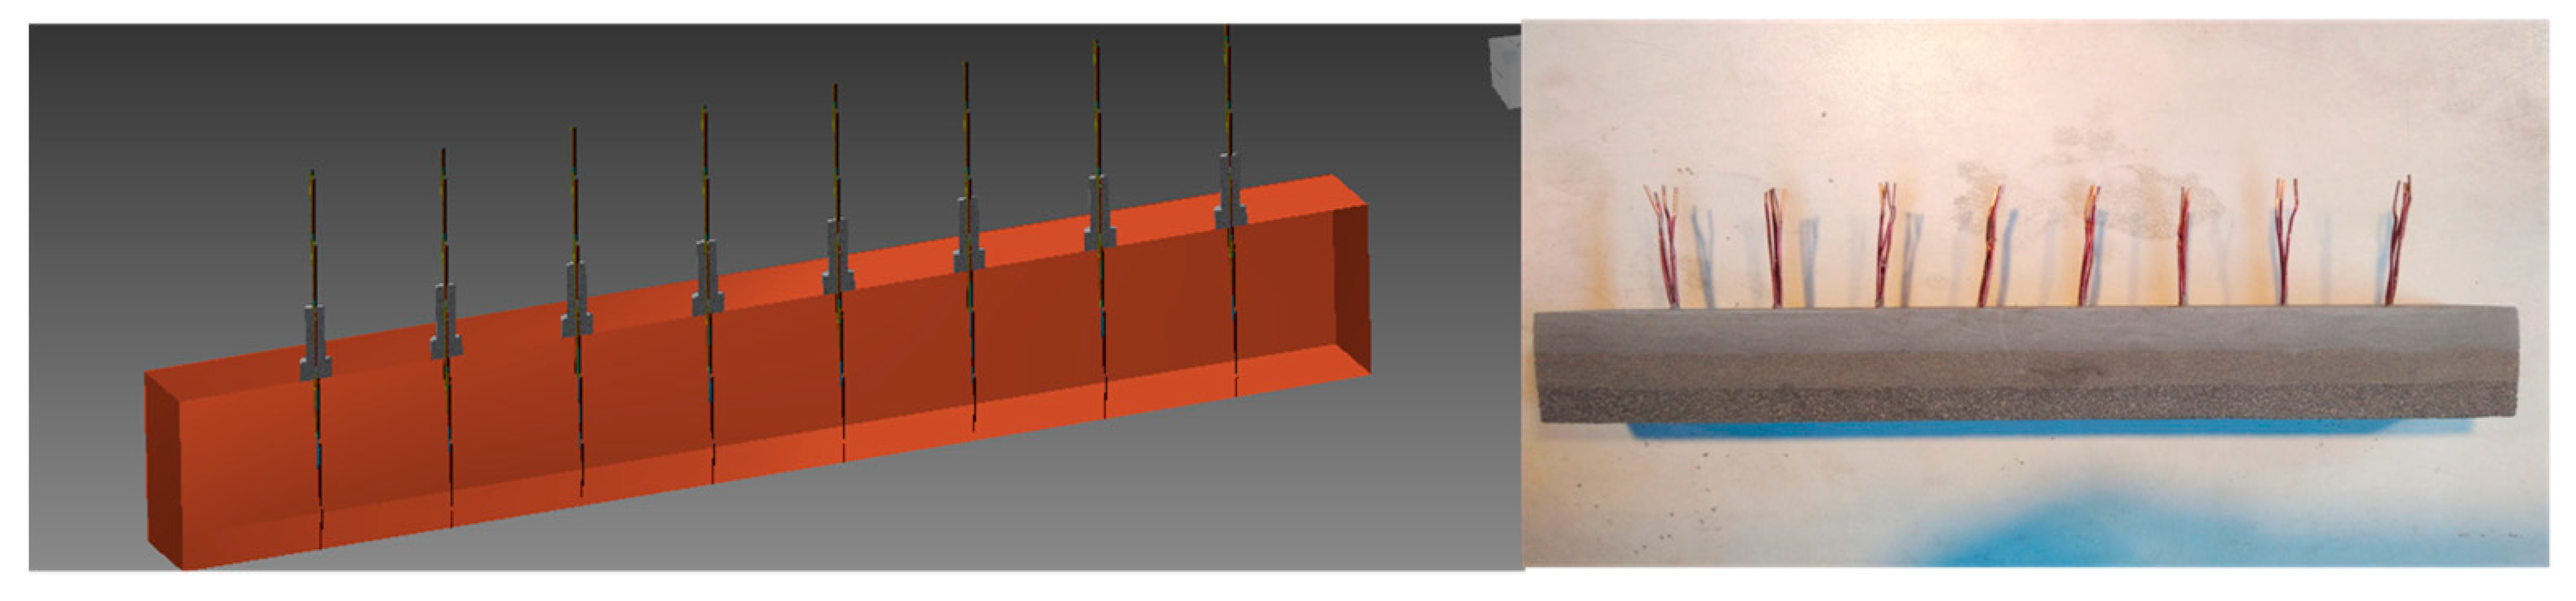
Electrode-bearing core. This type of core is used to measure the remaining oil distribution. A schematic and a picture of the core sample setup are shown in Figure 1. Copper electrodes were installed along the core samples, at an interval of 3.3 cm.
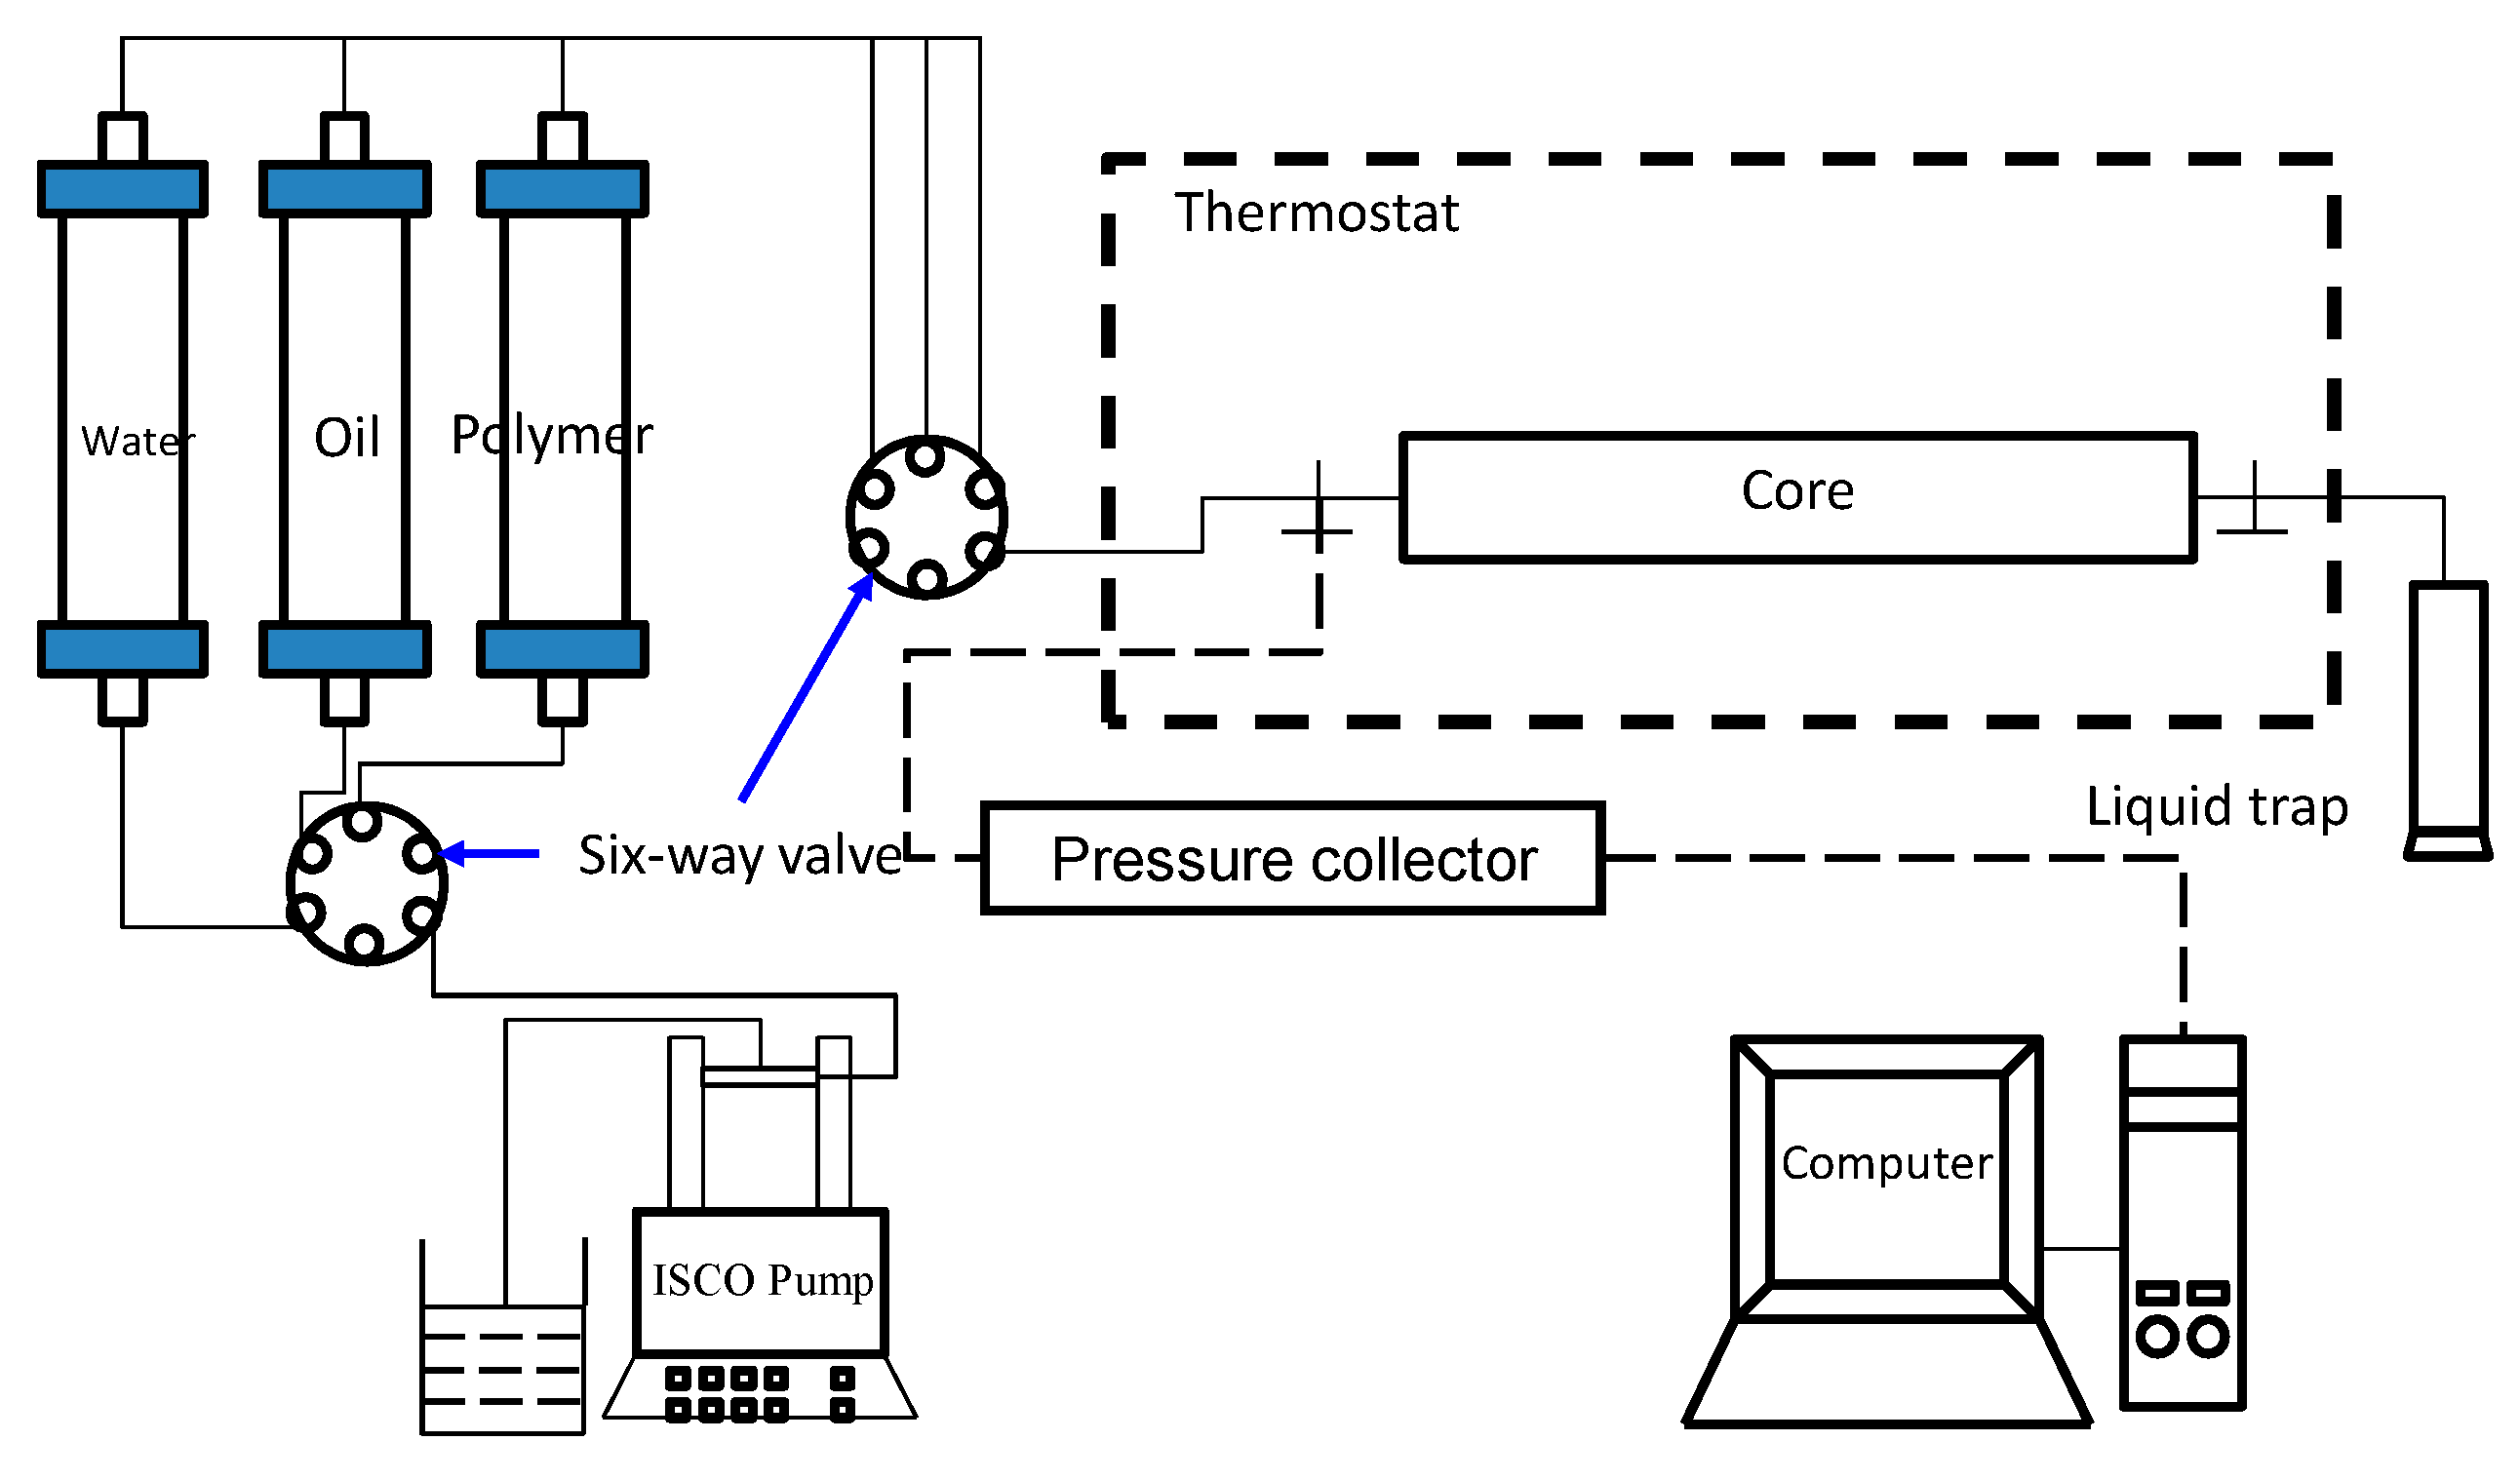
Micromodels. Three layered heterogenous micromodels (as shown in Figure 2, left and middle) were prepared by etching on ultra-white polished glass sheets (30 × 30 × 2.1 mm, made in China) [24]. The average pore diameters of the high, medium, and low permeability zones are approximately 104, 64, and 21 μm, respectively. The micromodel holder is shown in Figure 2, right.

2.1.2. Apparatus

Apparatus used in macroscopic oil displacement experiments: ISCO pump, thermostatic oven, pressure transducer, transfer cylinders, data acquisition system developed by the Southwest Petroleum University (SWPU), RW 20 digital II stirrer, Fann676 Waring Blender, DV-III Brookfield viscometer, electronic balance, electrode measuring device. The flow chart is shown in Figure 3.
Apparatus used in microscopic oil displacement experiments: air compressor, pressure buffering tank, Zeiss Stereo Microscope with a camera, desktop computer.

2.2. Experimental Procedures

All experiments were conducted at 65 °C unless otherwise specified.

2.2.1. Macroscopic Oil Displacement Experiment

The experimental procedures to conduct the macroscopic oil displacement test are as follows:
(1)
Measure the gas permeability.
(2)
Vacuum saturate the core sample with brine in Table 1 and calculate the porosity according to the weight difference.
(3)
Measure the water permeability by injecting brine at different flow rates.
(4)
Inject oil at successive flow rates of 0.1, 0.2, 0.5, and 1.0 mL/min, to displace water until no more water is produced. Age the core at 65 °C for 72 h.
(5)
Polymer solution (0.3 PV) is injected at 1.0 mL/min, at different water saturations.
(6)
A post-waterflooding is carried out at a flow rate of 1.0 mL/min till the instantaneous water cut reaches 95%. Throughout the displacement test, a 10 mL glass tube is used to collect the effluent every 5 min.

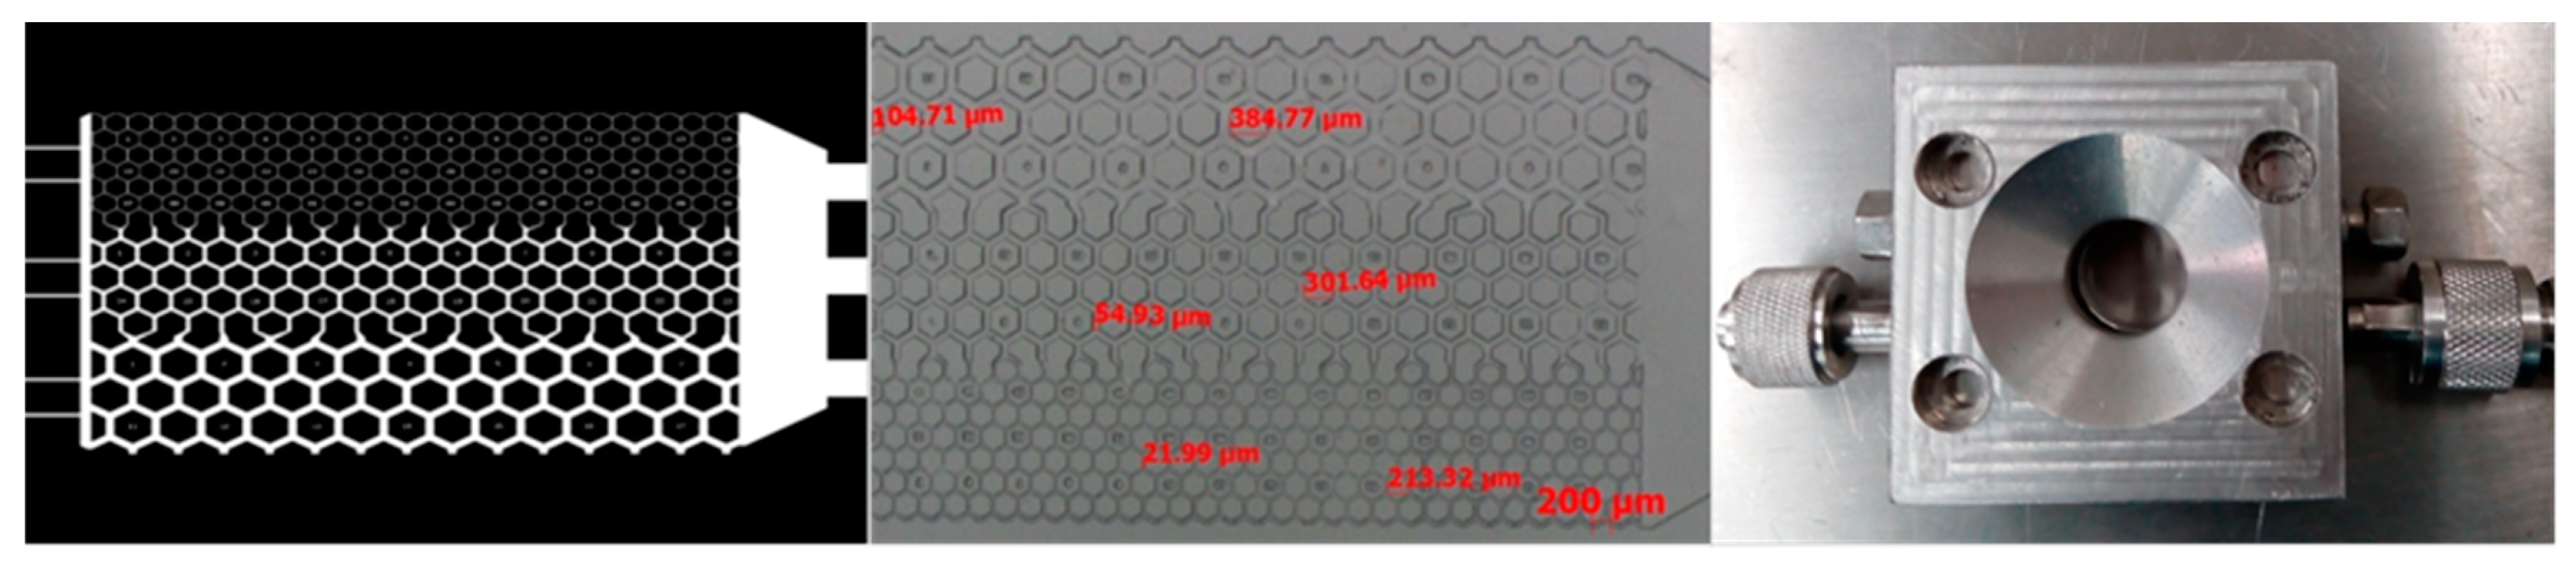
2.2.2. Microscopic Oil Displacement Experiment

The microscopic oil displacement test procedures are:
(1)
Setup the microfluidic system and check its leakage. Then fill the micromodel with brine.
(2)
Inject oil at a rate of 0.001 mL/min.
(3)
Then inject brine at 0.001 mL/min and the whole process is recorded by using a computer and a camera.
(4)
Inject polymer solution at 0.001 mL/min for 0.3 PV.
(5)
A post-waterflooding is conducted at 0.001 mL/min until water cut reaches 95%.
(6)
Data processing: the oil saturation change in each pore of the micromodel is calculated according to the pixel value which is processed by Photoshop and Image J.

3. Results and Discussion

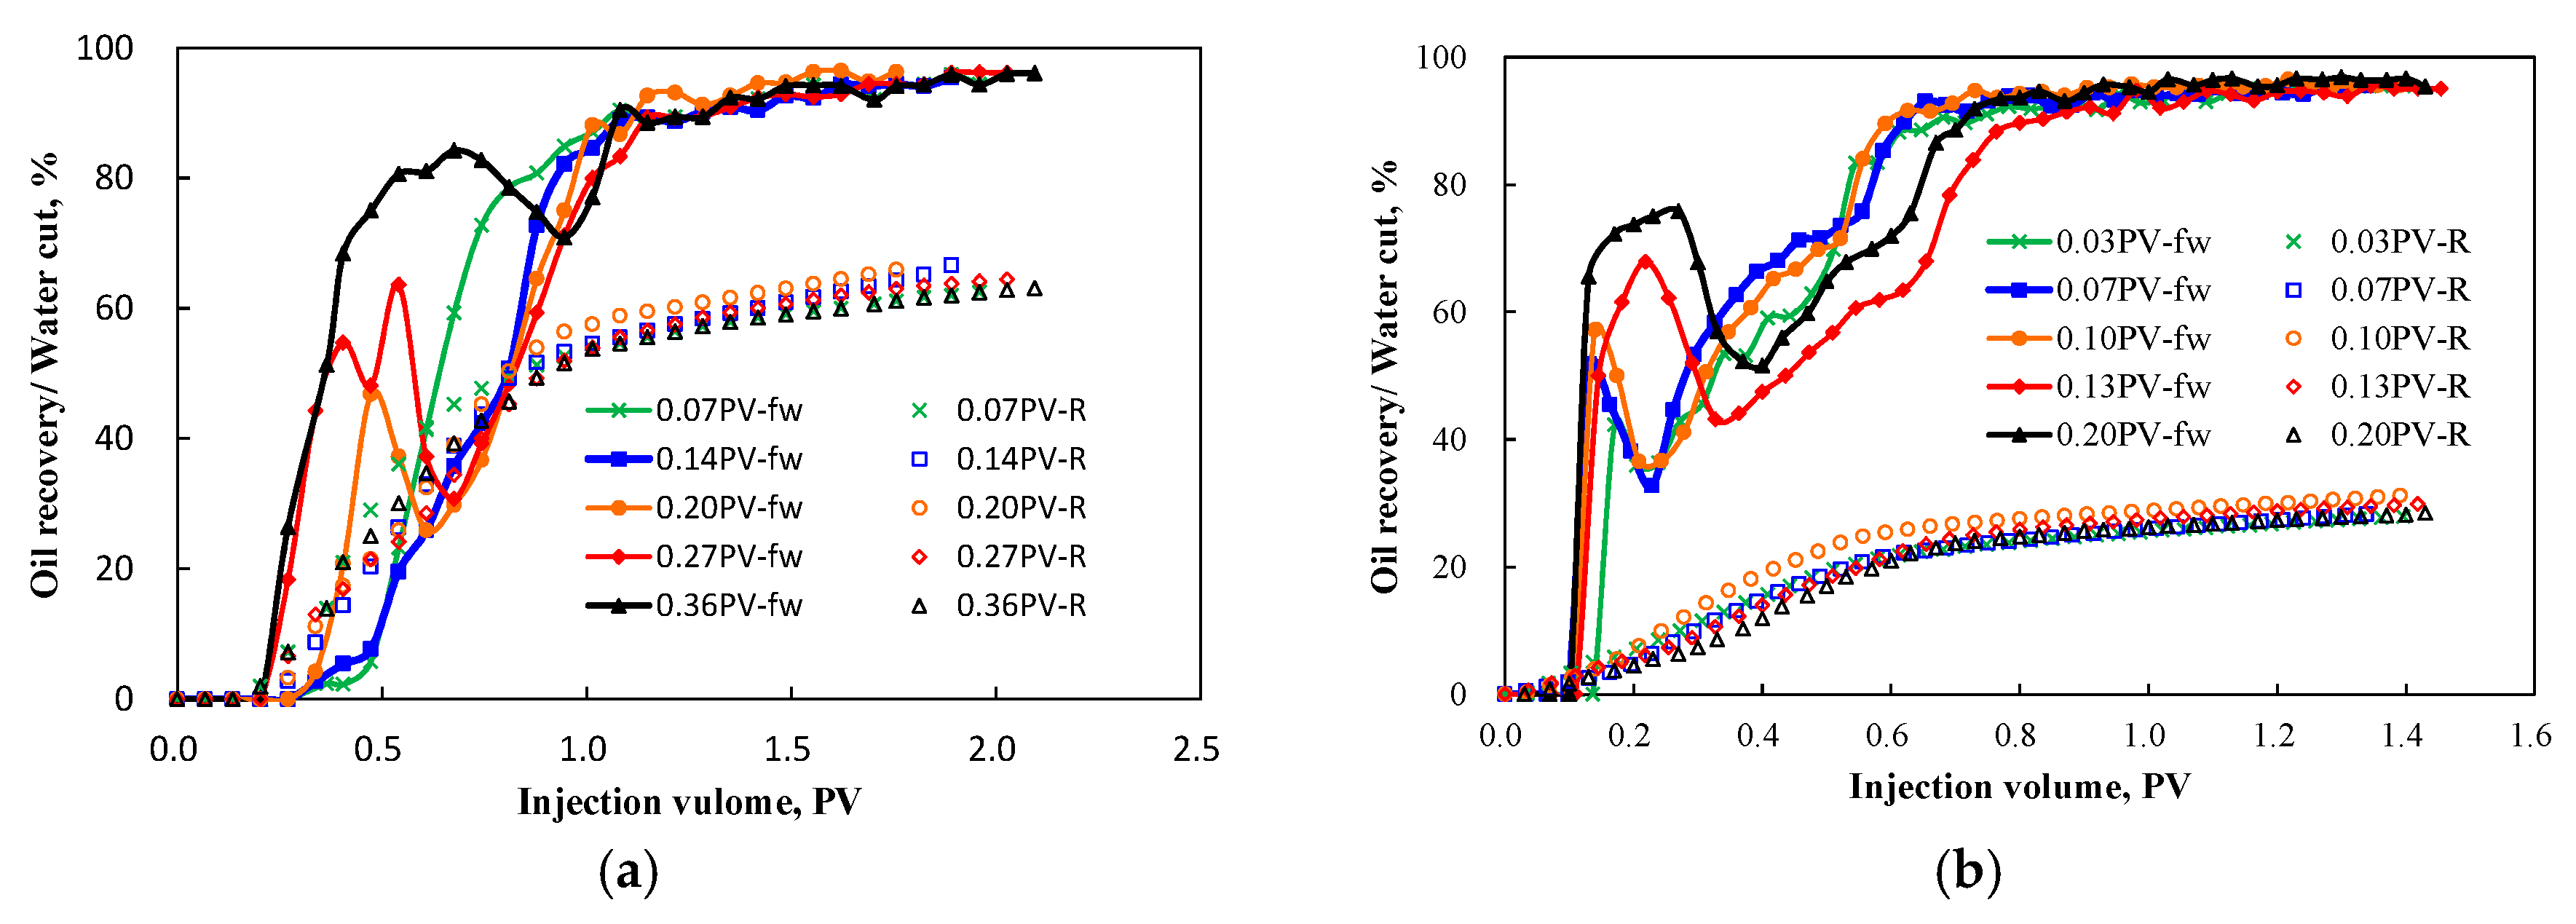
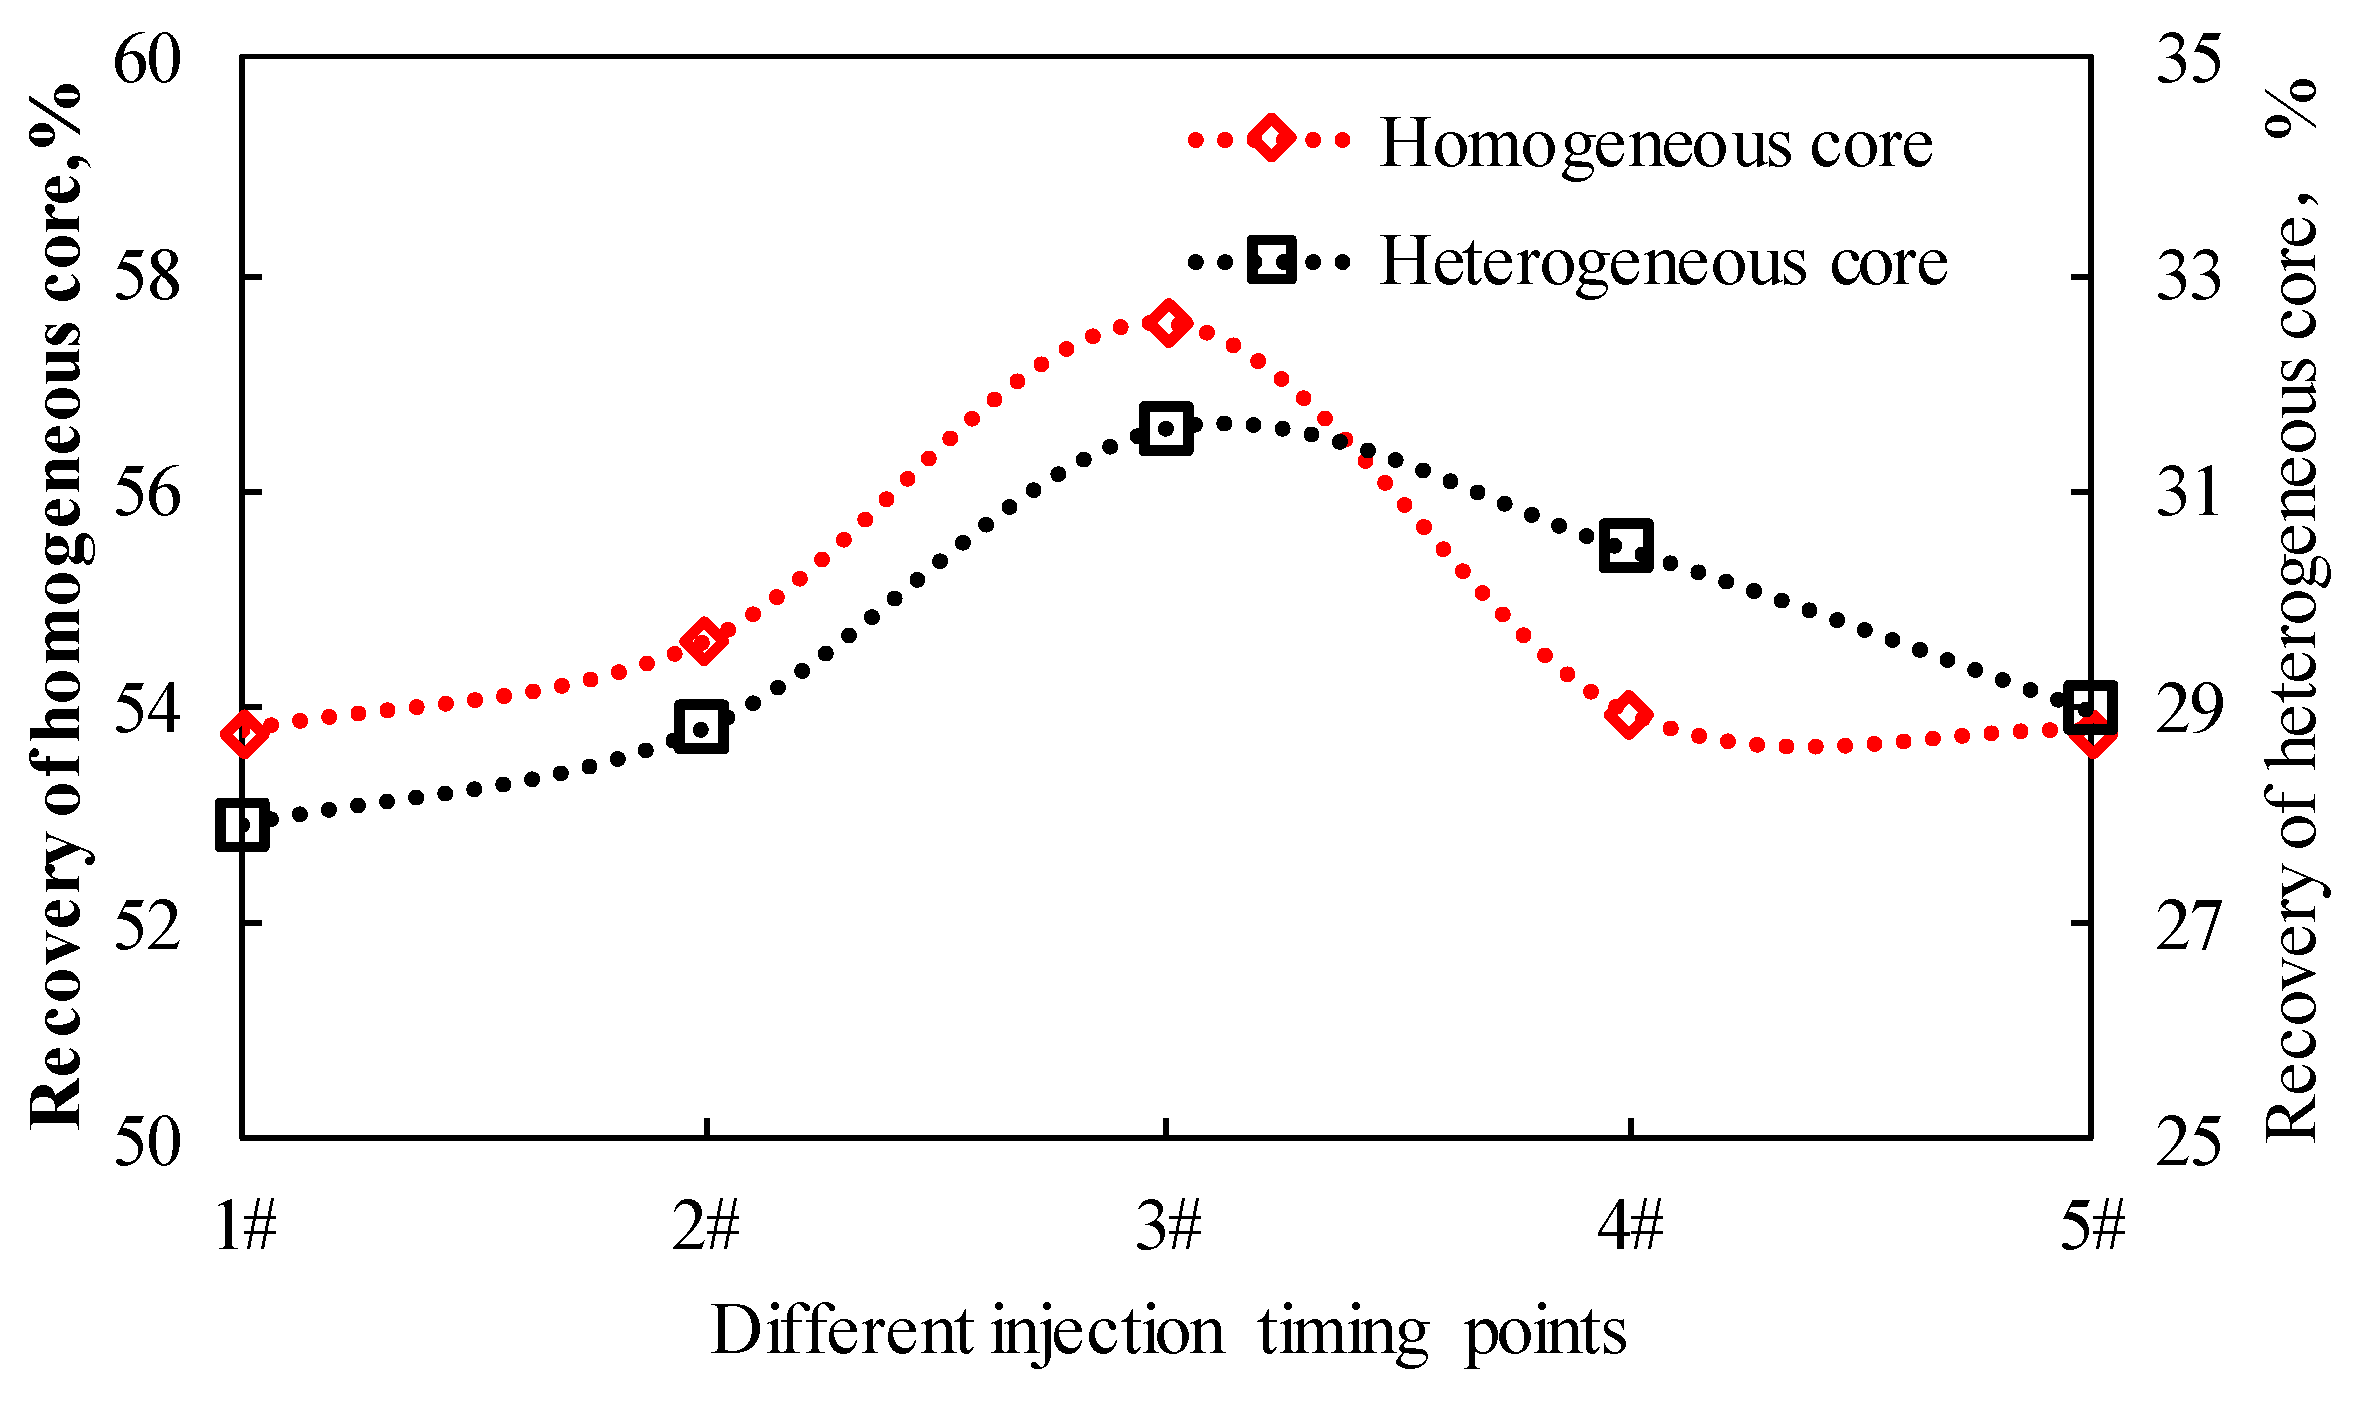
3.1. Polymer Injection Timing Analysis by Macroscopic Oil Displacement Tests

In our previous work [17], it was concluded that the optimum injection timing for a 70 mPa·s heavy oil was when the water saturation was in the range of 0.204–0.256. In our other study [13], polymer injection timing was decided at the water breakthrough. By considering the other scholars’ conclusions that “polymer flooding is the most efficient for oil displacement when the water cut is 0%” [12,13,14,15], a series of polymer flooding tests were carried out before and after water breakthrough. The polymer injection timing is listed in Table 2. In addition, it was observed that the water breakthrough time for homogeneous and layered heterogeneous cores were 0.20 and 0.10 PV of water injected, respectively.
The water-cut and oil recovery in all oil displacement tests are shown in Figure 4. Comparing Figure 4a,b, it is obvious that homogenous and heterogenous cores behaved distinctively: (1) Water-cut response. For homogeneous cores, when the polymer injection timing was at 0.07 and 0.14 PV, the water-cut curves did not display the typical V-shape. In contrast, no matter how early the polymer solution was injected in the heterogeneous cores, they were V-shaped in the water-cut response. This demonstrates that in homogeneous cores, when polymer solution was injected early enough, the displacement front was stable, and the sweep efficiently was improved dramatically. However, in our artificial heterogenous core samples, the severe permeability contrast could not be overcome by the polymer mobility control capacity. (2) Oil recovery response. The oil recovery varied with polymer injection timing. In addition, the average recovery factor of homogeneous core was 60%, which is much higher than that of heterogeneous cores (30%). This indicates that there is a more urgent need for mobility control in heterogeneous reservoirs.
Furthermore, in order to find the polymer injection timing effect on oil recovery, the curves of oil recovery versus polymer injection timing for both homogeneous and heterogeneous cores were plotted as in Figure 5. It is worth emphasizing that there exists an optimum injection timing which is close to the water breakthrough time regardless of homogeneous or heterogeneous cores.

3.2. Polymer Injection Timing Analysis by Microscopic Oil Displacement Tests

In order to further investigate the rational under which polymer injection timing affects the oil recovery, a series of microfluidic experiments were performed.

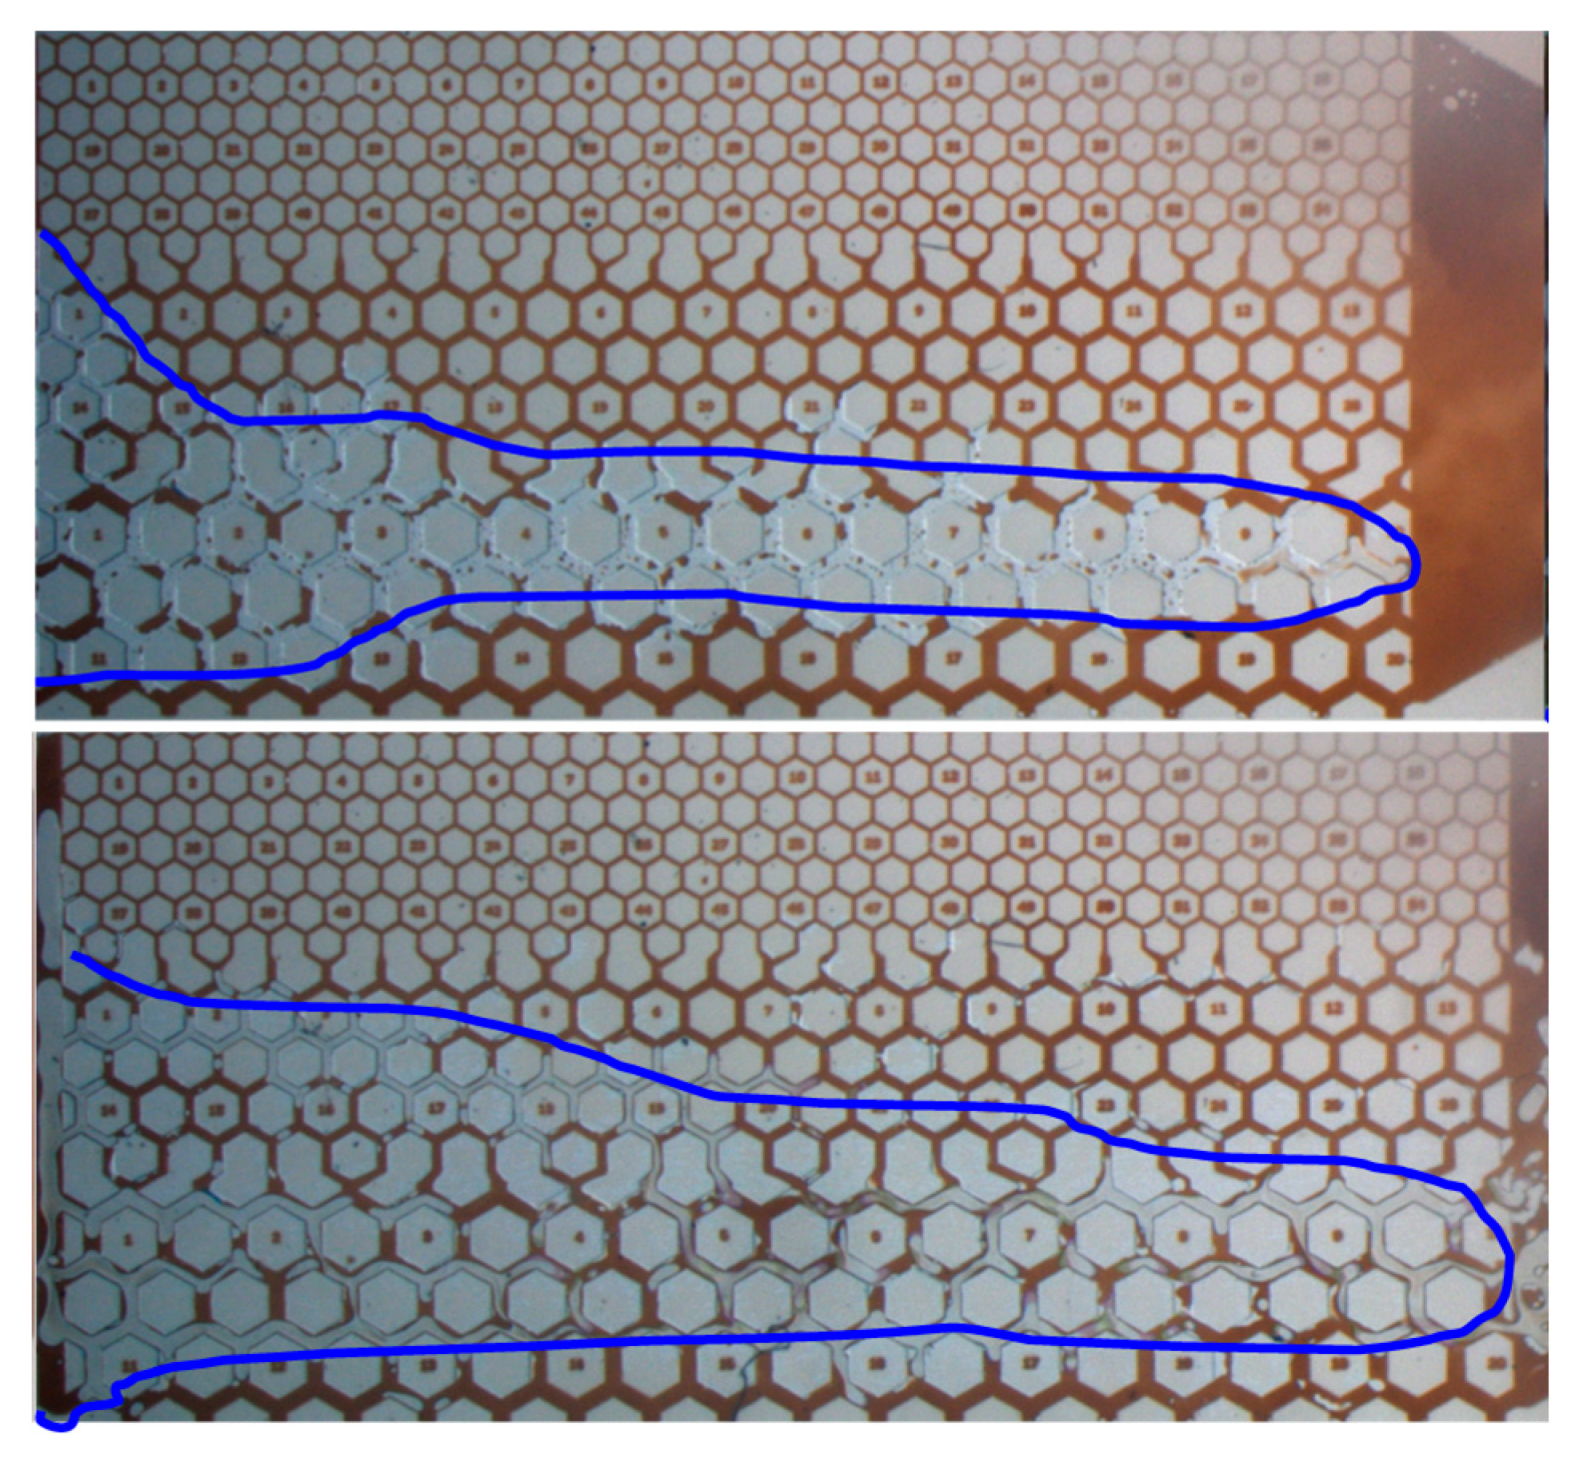
3.2.1. Comparison of Waterflooding with Polymer Flooding at Secondary Mode before Water Breakthrough

Firstly, two microfluidic experiments were conducted at secondary modes: one was waterflooding, the other was polymer flooding. Both experiments ceased at water breakthrough and the snapshots at the final moment are shown in Figure 6. One can see that for both cases, water and polymer flew through the high permeability zone mostly. Only a small amount of fluids entered the medium and low permeability zones close to the entrance. The oil recovery for waterflooding and polymer flooding before water breakthrough were 9.3% and 14.2%, respectively. This relatively small difference in oil recovery indicates that there is no need to inject polymer too early before water breakthrough, since water also works as an effective displacing agent before breakthrough.

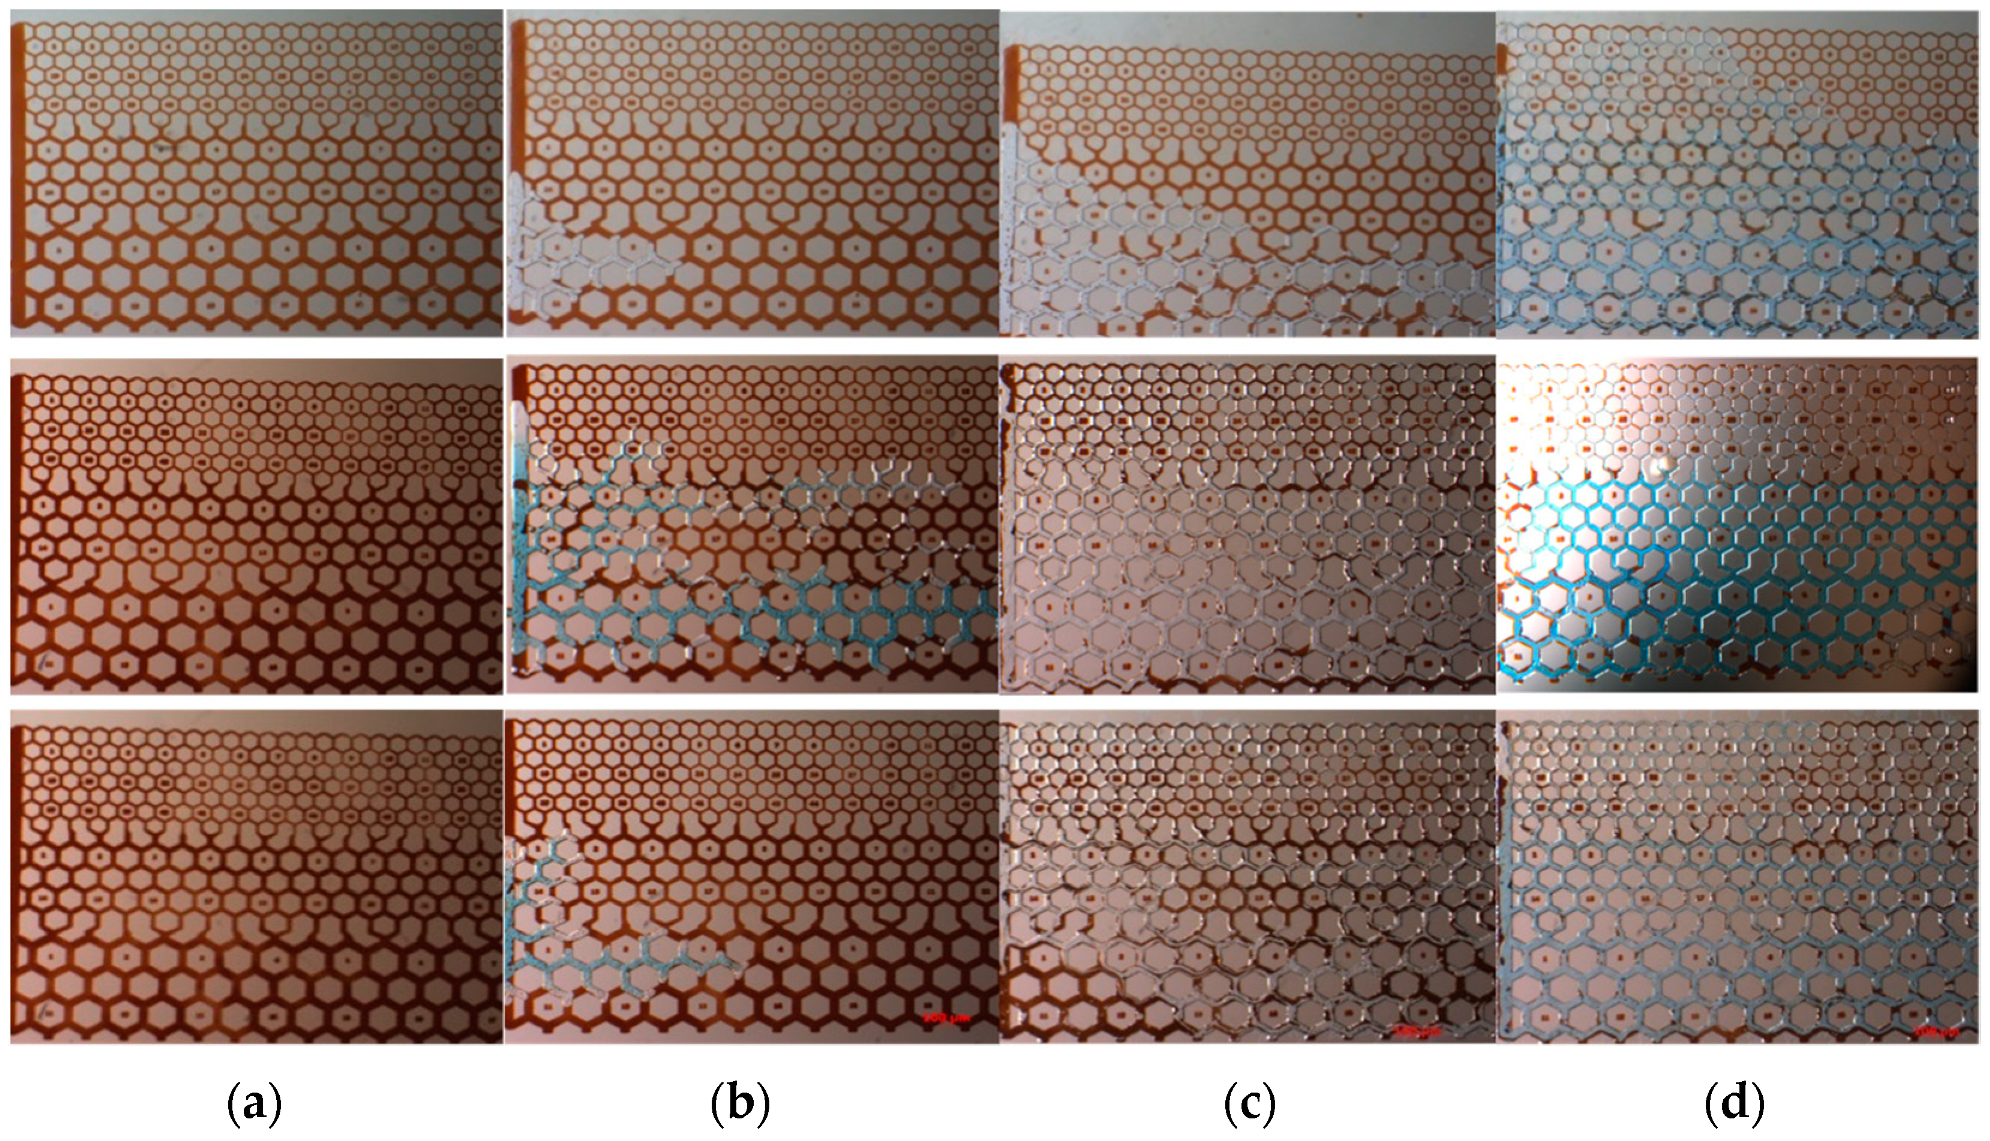
3.2.2. Microscopic Displacement at Different Polymer Injection Timing

In this subsection, another three microscopic displacement tests concerned on polymer injection timing were carried out. These three microfluidic experiments were initiated at Sw = 15.42%, Sw = 42.79% (just after water breakthrough), and Sw = 38.83% (just before water breakthrough). After 0.3 PV of polymer solution was injected, a post-water flooding was switched on. The results are displayed in Figure 7 (Upper: Sw = 15.42%; Middle: Sw = 42.79%; Lower: Sw = 38.83%) and Table 3. One can see that the final oil recovery when polymer was injected at Sw = 38.83% was 26% higher than that at Sw = 42.79%, and 17% higher than that at Sw = 15.42%, which implied the optimum polymer injection timing just before water breakthrough. The analysis shows that the displacement effect of Sw = 15.42% is not as good as that of Sw = 38.83%, because the water injection does not fully communicate with the water flow channel, resulting in the loss of effective polymer concentration for some polymers to communicate with the water flow channel, resulting in poor displacement effect. The displacement effect of Sw = 42.79% is not as good as that of Sw = 38.83%, because the higher the water content, the lower the mobility control ability of the polymer, and the worse the displacement effect.
One microscopic waterflooding was carried out to find out the sweep efficiency changes with time. The result is depicted in Figure 8. It is obvious that before water breakthrough, the sweep efficiency (blue curve) decreased linearly with injected PV (pore volume). After a preference flow path was built, the sweep efficiency decrease slowed down. In addition, from the sweep efficiency decreasing rate (red curve), one can see that water breakthrough is a turning point. Before water breakthrough, the decreasing rate is approximately 100%, which implied that the injected water displaced almost the same amount of oil. However, after water breakthrough, the decreasing rate decreased sharply and continuously. This is attributed to the formation of a water preference flow path.

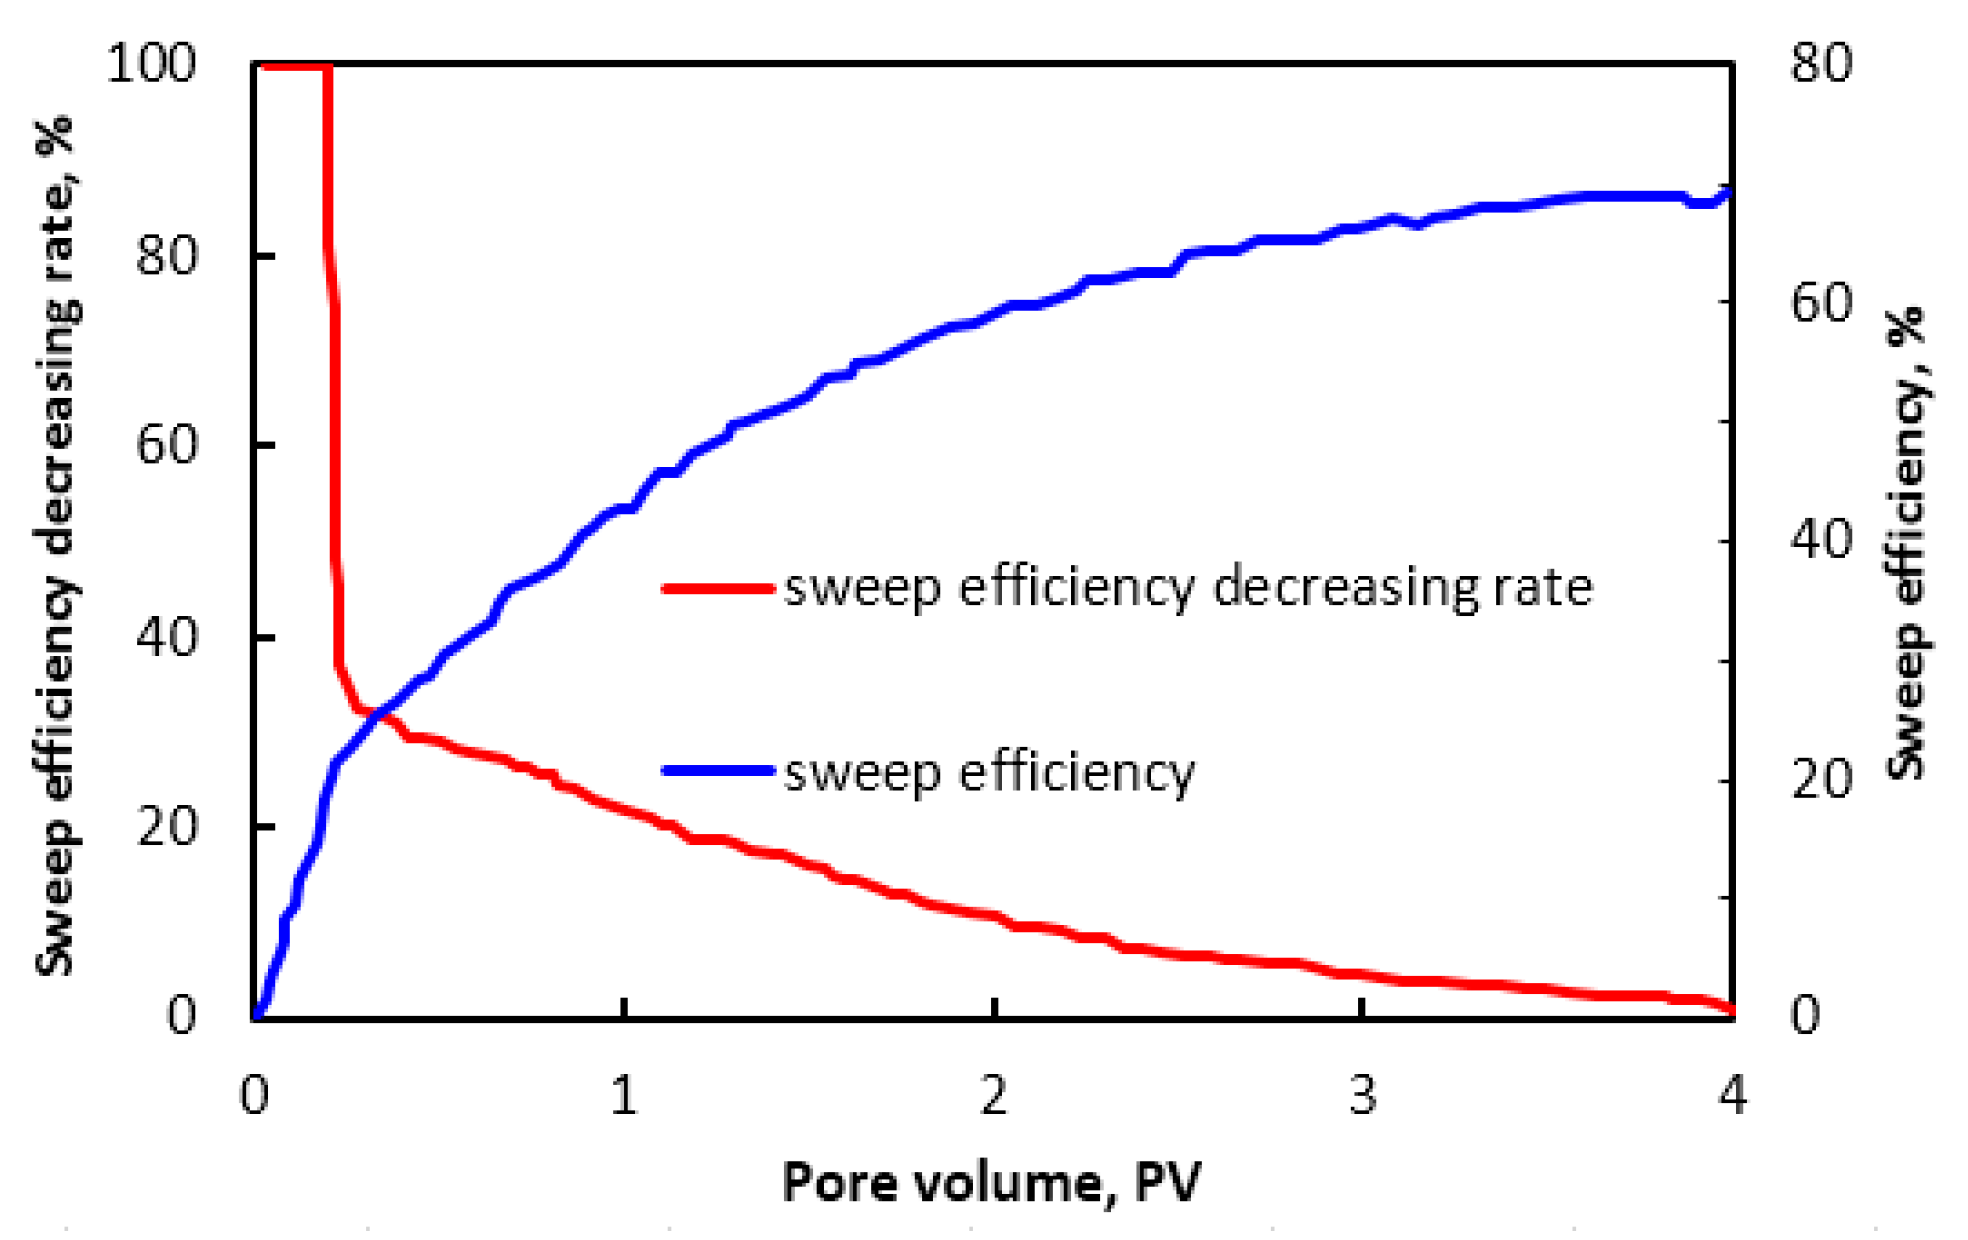
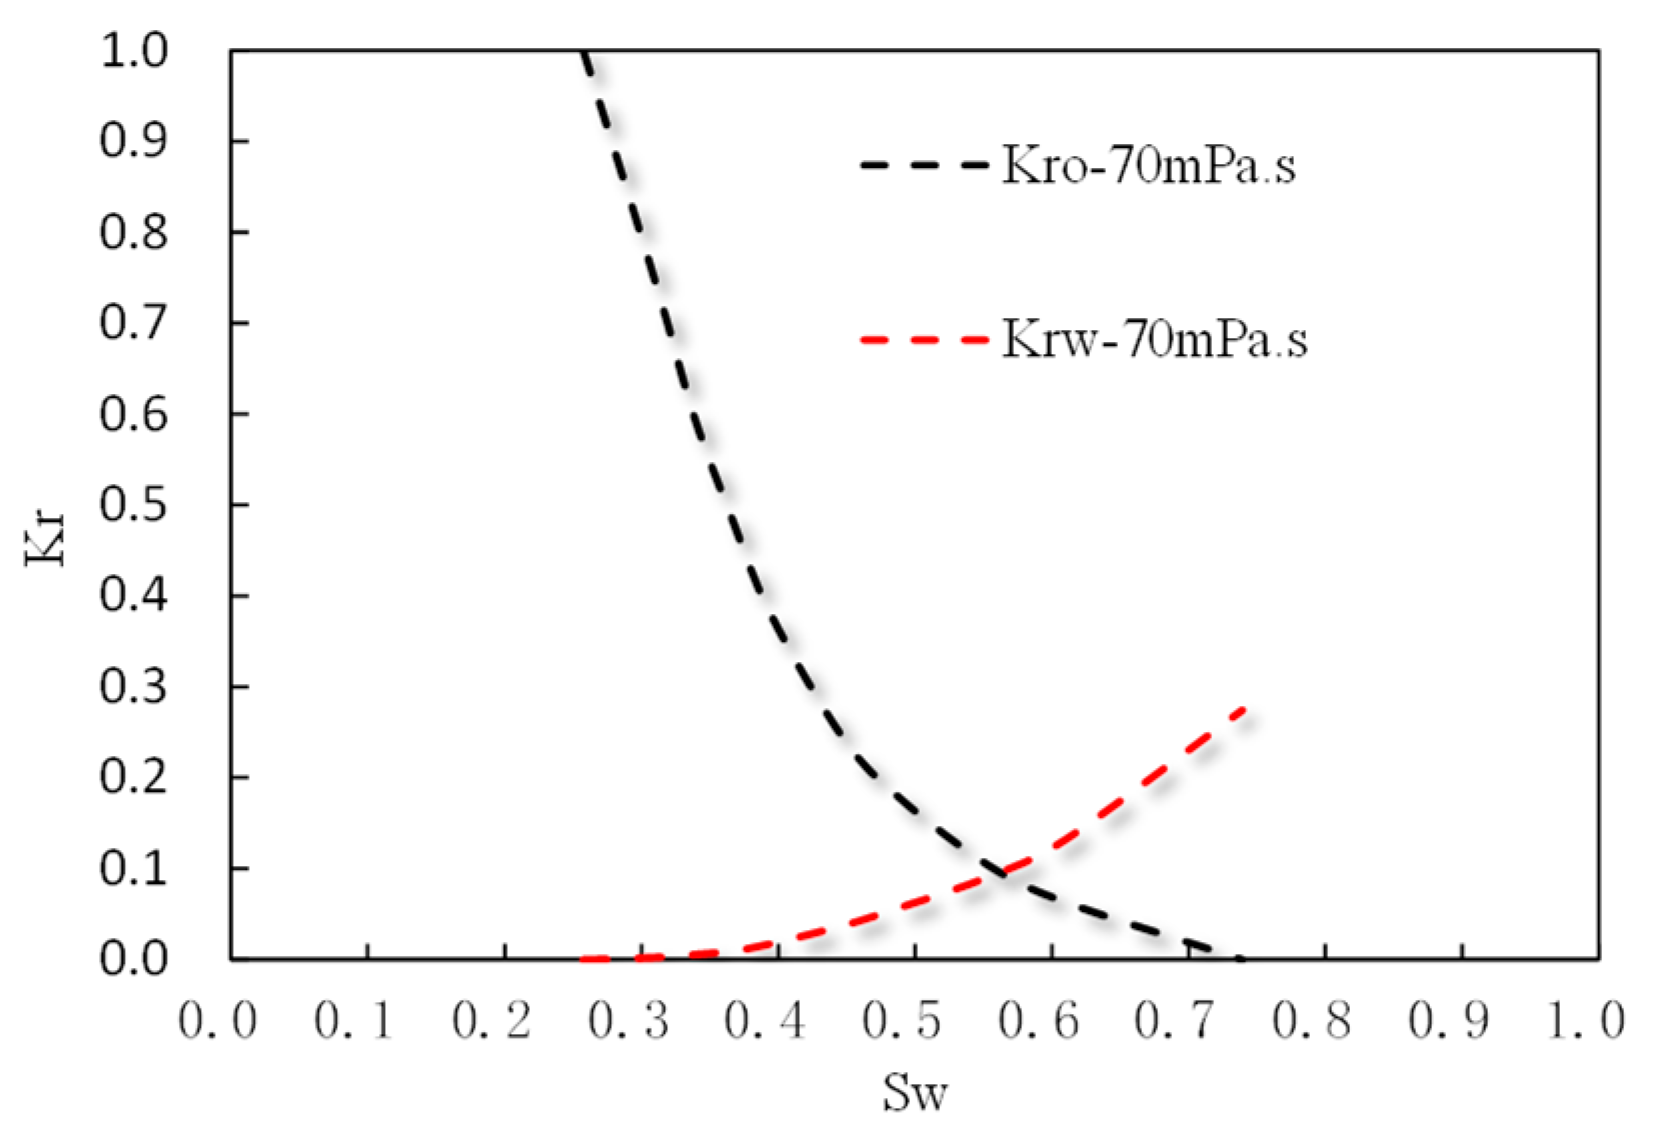
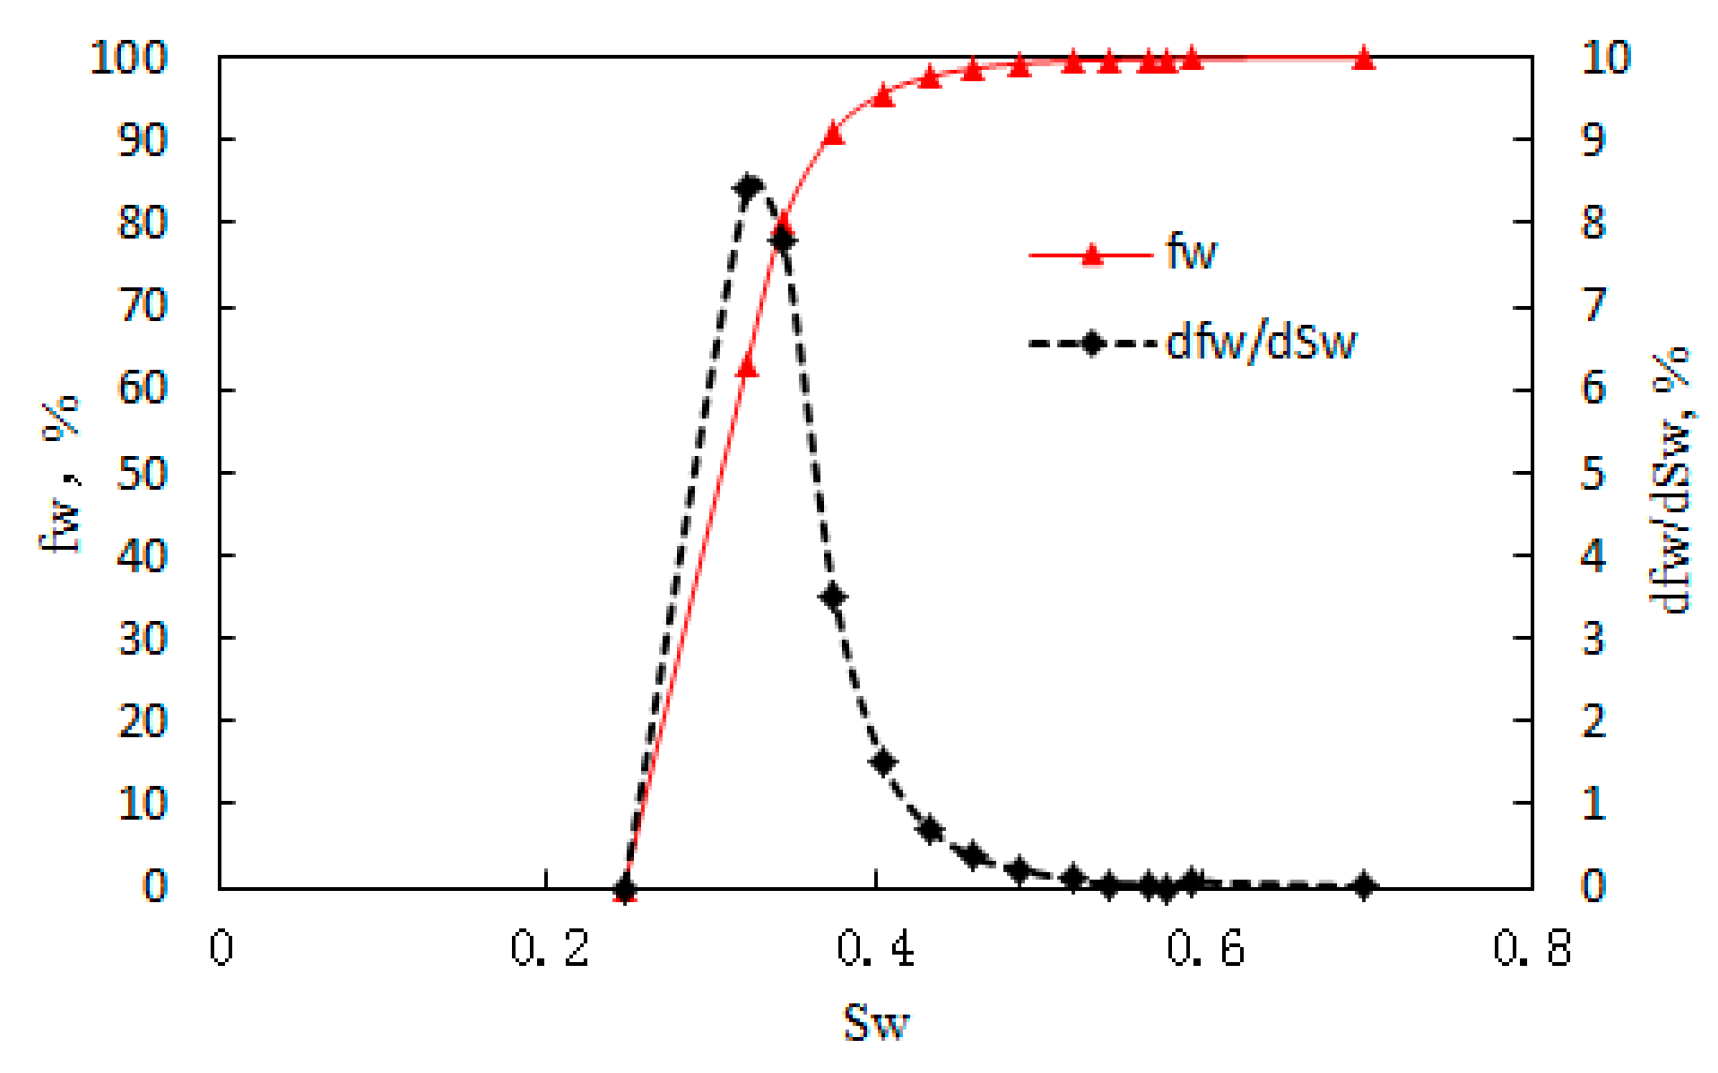
3.3. Polymer Injection Timing Determination by Buckley–Leverett Method

The results of macro and micro laboratory experiments demonstrated that injecting a specific amount of water was conducive to subsequent polymer flooding. It could save the cost of polymer and help maintain the polymer solution’s effective concentration. Thereby, the optimum injection timing was close to the water breakthrough.
The waterflood front, calculated by the Buckley–Leverett method, has been used to characterize waterflooding [25,26]. The position of waterflood front is described by Equation (1). Additionally, the water saturation at the front is calculated by Equation (2) as follows:
x f x 0 = f w ( S w f ) φ A Q ( t ) ,
f w ( S w f ) = f w ( S w f ) S w f S w i r ,
where x f is the waterflood front position (cm); x 0 is the initial position (cm); f w ( S w f ) is the water cut at waterflood (%); S w f is the water saturation at waterflooding front (%); S w i r is the irreducible water saturation (%); Q(t) is the flow rate (cm3/min) at time t.
For our homogeneous core sample, the oil-water relative permeability curve and the derived fraction flow results are displayed in Figure 9. Other parameters used in our calculation include the porosity of 30%, water injection rate of 1.0 mL/min, the cross-section area of 20.25 cm2. The other calculated parameter values are tabulated in Table 4. One can see that at time 14–15 min, water is going to break through soon. Correspondingly, the injected water is between 0.1901 and 0.2037 PV, which is close to our experimental result—0.203 PV. This verifies that the Buckley–Leverett method is valid to determine the water breakthrough time or polymer injection timing.

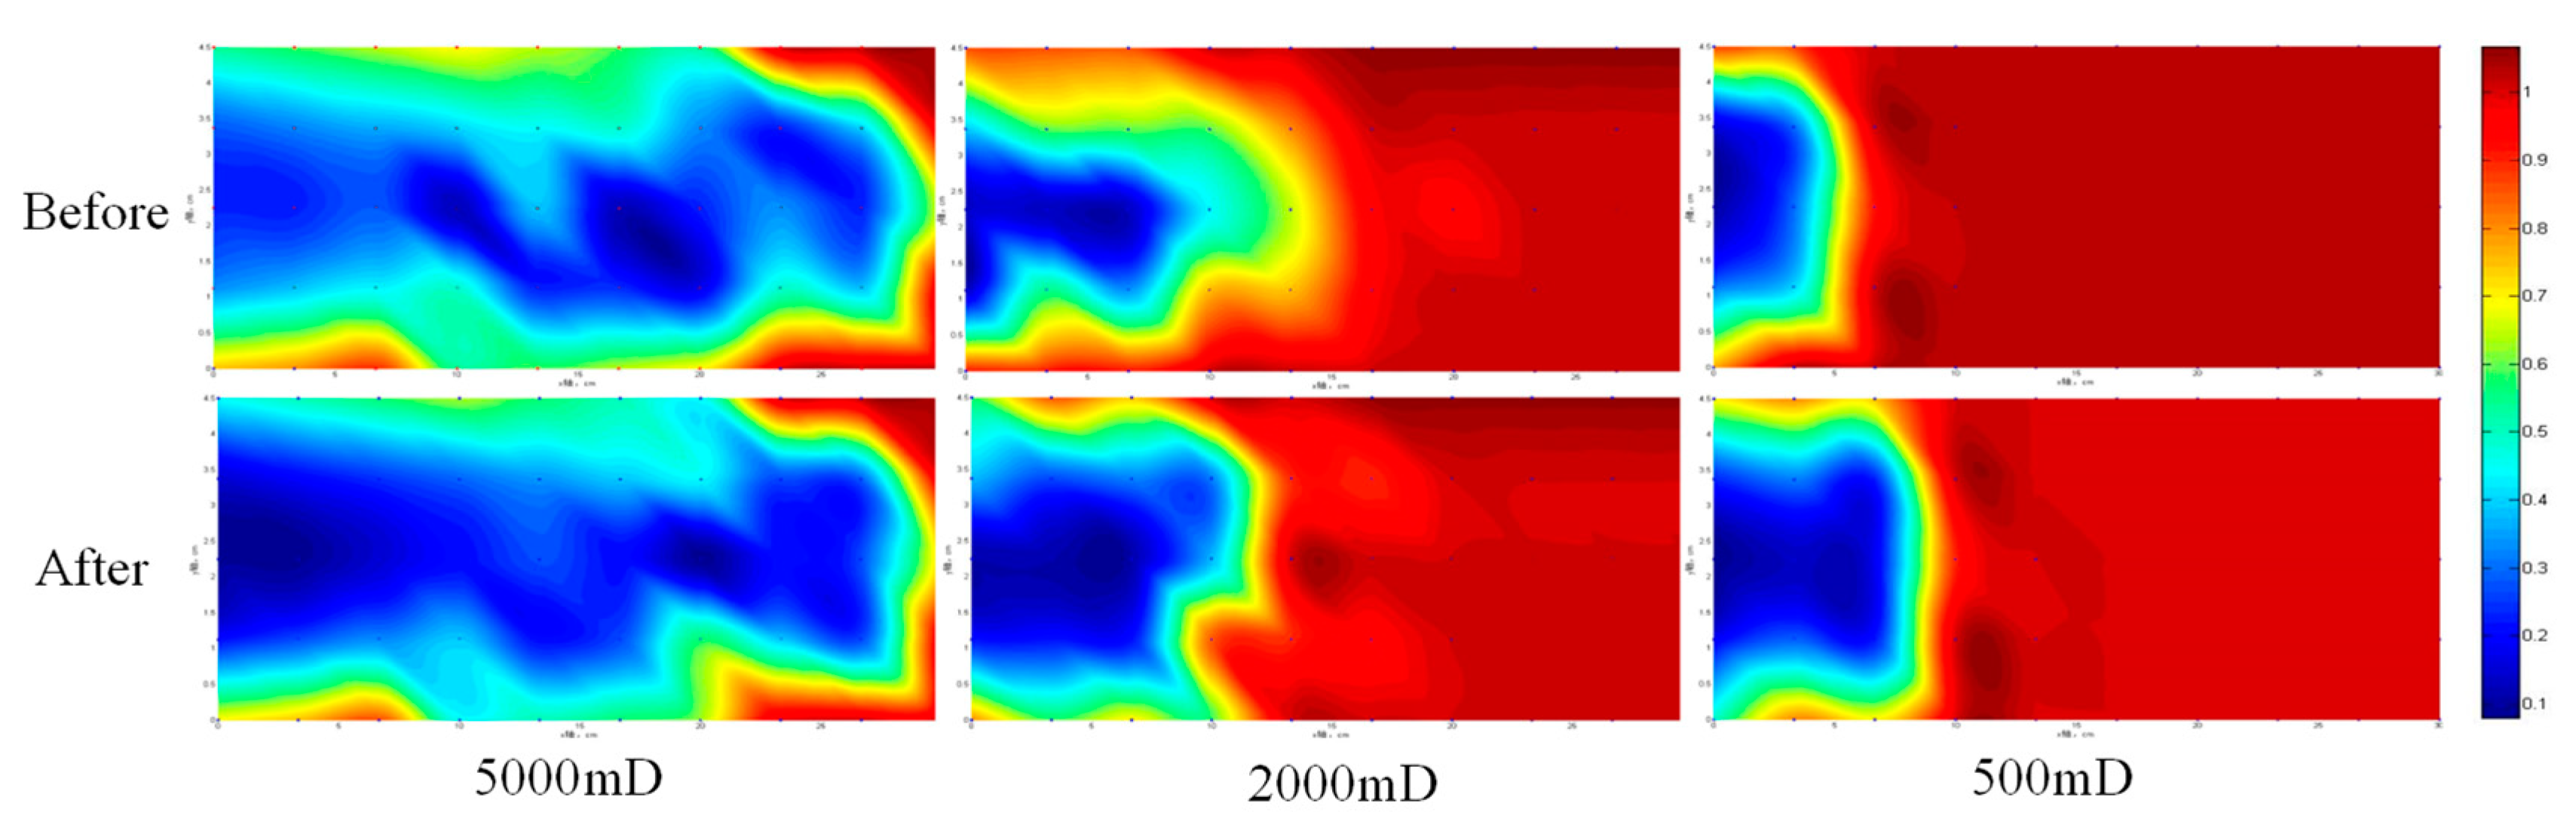
3.4. Effect of Polymer Injection Timing on Residual Oil Distribution

In our study, residual oil distribution could be obtained by using electrode-bearing core samples and MATLAB software (data processing). Firstly, waterflooding was performed on one layered heterogenous core. Two snapshots were captured at different times, as shown in Figure 10. One can see that water mainly flows through high permeability zone, and only a small amount enters the medium and low permeability zones. After water breakthrough, additional water injection could only increase the sweep efficiency slightly, to a large extent, it serves to improve the oil displacement efficiency in the swept area.
Secondly, another macroscopic core flooding was conducted on layered electrode-bearing core. In this test, at water breakthrough (0.104 PV water injected), polymer flooding was initiated and lasted for 0.3 PV. The residual oil distributions before (upper) and after (lower) polymer flooding are displayed in Figure 11. From the upper three figures, one can see that water broke through at 0.104 PV from the high permeability zone. The subsequent-injected polymer penetrates into the low and medium permeability zones, decreasing the remaining oil saturation. For the high permeability zone, polymer mainly increased the displacement efficiency. In summary, after polymer flooding, the remaining oil mainly distributed in the medium and low permeability zones far from the entrance, and the edges in the high permeability zone.
Thirdly, we utilized the snapshots collected in microfluidic tests to analyze the polymer injection timing effect on residual oil distribution. Two polymer flooding were initiated at different times: one is at Sw = 42.79% (just after water breakthrough), the other is at Sw = 38.83% (just before water breakthrough). The remaining oil distribution after polymer flooding is shown in Figure 12. It is obvious that the remaining oil distribution varied with the polymer injection timing. Furthermore, one can pinpoint the following conclusions: (1) after early polymer injection, most of the high permeability zone was swept and the distribution of remaining oil was scattered and isolated in the swept area. The polymer fluid control ability was improved when it was injected before water breakthrough. (2) The medium permeability zone was swept to some extent and the remaining oil was mainly located in the intersected area of the medium/high permeability zones close to the outlet of the core. (3) Meanwhile, for the low permeability zone, only a small part adjacent to the entrance of the core was swept. In addition, it is worth mentioning that the early injection of 0.3 PV polymer was not enough to establish a flow resistance in the areas far away from the injection end so as to improve the sweep efficiency.

4. Conclusions

Our macroscopic and microscopic experimental studies revealed that the optimum polymer injection timing is close to the water breakthrough. Too early injection of polymer is not necessary since the water injected before water breakthrough can also establish a comparable sweep efficiency as polymer solution. Furthermore, the water breakthrough time can be solved analytically by Buckley–Leverett Method, which supports the prediction of polymer injection timing. An early injection of polymer close to the water breakthrough can establish the flow resistance in preference flow path in the high permeability zone, which helps increase the sweep efficiently in the low and medium permeability zones adjacent to the injection end. However, the mobility control capacity of polymer solution gradually weakens as subsequent waterflooding is ongoing. In addition, the sweep efficiency in the low and medium permeability zones, especially in the areas far away from the injection end, are extremely low. Therefore, further EOR methods are required to improve oil recovery in low and medium permeability zones.

Author Contributions

Conceptualization, L.S. and Z.Y.; methodology, Z.Y.; formal analysis, Z.G., X.W.; investigation, L.S., X.X.; resources, W.Z.; data curation, S.Z., X.X.; writing—original draft preparation, S.Z., X.W.; writing—review and editing, S.Z.; visualization, L.S. funding acquisition, Z.Y. All authors have read and agreed to the published version of the manuscript.

Funding

This research was funded by the Chinese “13th Five-Year” National Science and Technology Major Project 25 task 3 “offshore oilfield chemical flooding technology” grant number 2016ZX05025-003.

Conflicts of Interest

The authors declare no conflict of interest.

References

  1. Delamaide, A.; Zaitoun, G.; Renard, G.; Tabary, R. Pelican lake field: First successful application of polymer flooding in a heavy-oil reservoir. SPE Reserv. Eval. Eng. 2014, 17, 340–354. [Google Scholar] [CrossRef]
  2. Bashir, A.; Haddad, A.S.; Rafati, R. Nanoparticle/polymer-enhanced alpha olefin sulfonate solution for foam generation in the presence of oil phase at high temperature conditions. Colloids Surf. A Physicochem. Eng. Asp. 2019, 582, 123875. [Google Scholar] [CrossRef]
  3. Saboorian-Jooybari, H.; Dejam, M.; Chen, Z. Heavy oil polymer flooding from laboratory core floods to pilot tests and field applications: Half-century studies. J. Pet. Sci. Eng. 2016, 142, 85–100. [Google Scholar] [CrossRef]
  4. Han, M.; Xiang, W.; Zhang, J.; Jiang, W.; Sun, F. Application of, EOR Technology by Means of Polymer Flooding in Bohai Oilfields, SPE104432. In Proceedings of the International Oil & Gas Conference and Exhibition in China 2006, Beijing, China, 5–7 December 2006. [Google Scholar] [CrossRef]
  5. Jiang, H.; Chen, F.; Li, Y.; Zheng, W.; Sun, L. A Novel Model to Evaluate the Effectiveness of Polymer Flooding in Offshore Oilfield, OTC-24777-MS. In Proceedings of the Offshore Technology Conference-Asia, Kuala Lumpur, Malaysia, 25–28 March 2014. [Google Scholar] [CrossRef]
  6. Lu, X.A.; Liu, F.; Liu, G.W.; Pei, Y.L.; Jiang, H.Q.; Chen, J.S. A Polymer Injectivity Model Establishment and Application for Early Polymer Injection. Arab. J. Sci. Eng. 2018, 43, 2625–2632. [Google Scholar] [CrossRef]
  7. Zhou, S.W. Exploration and practice of offshore oilfield effective development technology. Eng. Sci. 2009, 10, 55–60. [Google Scholar]
  8. Liu, R.; Jiang, H.Q.; Zhang, X.S.; Chen, M.F.; Yang, J.R.; Hu, H.Q. Effective characteristics of early polymer flooding in mid-to-low viscosity offshore reservoir. Acta Pet. Sin. 2010, 31, 280–283. [Google Scholar]
  9. He, C.B.; Feng, G.Z.; Kang, X.D.; Liang, D.; Li, Y.Q. Indoor Contrastive Evaluation of Injection Modes of Polymer Flooding in Offshore Oilfields. Pet. Geol. Eng. 2014, 28, 136–138. [Google Scholar]
  10. Zhou, C.J. Polymer Flooding in Bohai Conventional Heavy Oil Reservoir at Early Stage; Southwest Petroleum University: Chengdu, China, 2009. [Google Scholar]
  11. Liu, X.Z.; Zhang, L.J.; Yue, X.A.; Hu, Q.H.; Wang, R.; Ke, W.Q. A Study on the Time of Polymerization Injection in a Class of Typical Reservoirs. J. Oil Gas Technol. 2012, 34, 136–138, 143, 169. [Google Scholar]
  12. Jose, L.J.M.; Henri, B.; Aziz, O.; Gerald, H.; Christophe, C.; Danielle, M.; Romero, C.; Bourdarot, G. A New Approach to Polymer Flooding: Effects of Early Polymer Injection and Wettability on Final Oil Recovery. SPE J. 2019, 24, 129–139. [Google Scholar] [CrossRef] [Green Version]
  13. Zhu, S.J. Study on Transfer Injection Timing of Polymer Flooding in Ordinary Heavy Oil Reservoir; Southwest Petroleum University: Chengdu, China, 2015. [Google Scholar]
  14. Jiang, S.S.; Yang, J.R.; Sun, F.J.; Zhang, X.S.; Wang, H.J.; Tang, E.G. Research and application of early polymer flooding technology in offshore oil field. Offshore Oil 2009, 3, 37–42. [Google Scholar]
  15. Zheng, W.; Zhang, X.S.; Chen, F.Z.; Jiang, H.Q.; Chen, M.F. Study on Polymer Flooding Effect at Different Times in Bohai Oilfield. J. Xi’an Shiyou Univ. (Nat. Sci. Ed.) 2015, 30, 60–64. [Google Scholar]
  16. Long, F.; Zhong, Q.; Zhang, Y.B.; Lu, X.G. Study on physical simulation of chemical flooding in Lvda 10-1 Oilfield. Offshore Oil 2007, 26, 36–40. [Google Scholar]
  17. Shi, L.-T.; Zhu, S.-J.; Zhang, J.; Wang, S.-X.; Xue, X.-S.; Zhou, W.; Ye, Z.-B. Research into polymer injection timing for Bohai heavy oil reservoirs. Pet. Sci. 2015, 12, 129–134. [Google Scholar] [CrossRef] [Green Version]
  18. Gao, J.X.; Li, Y.Q.; Li, J.; Yan, D.D.; Wang, H.F. Experimental Study on Optimal Polymer Injection Timing in Offshore Oilfields, OTC-24694-MS. In Proceedings of the Offshore Technology Conference-Asia, Kuala Lumpur, Malaysia, 25–28 March 2014. [Google Scholar] [CrossRef]
  19. Kang, X.D.; Zhang, J. Offshore Heavy Oil Polymer Flooding Test in, JZW Area, SPE 165473. In Proceedings of the SPE Heavy Oil Conference-Canada, Calgary, AB, Canada, 11–13 June 2013. [Google Scholar] [CrossRef]
  20. Tietze, K.; Ritter, O.; Patzer, C.; Veeken, P.C.H.; Verboom, B. Borehole Controlled-Source Electromagnetics for Hydrocarbon-Saturation Monitoring in the Bockstedt Oil Field, Onshore Northwest Germany. SPE Reserv. Eval. Eng. 2018, 21, 364–372. [Google Scholar] [CrossRef]
  21. Ghommem, M.; Qiu, X.; Aidagulov, G.; Abbad, M. Streaming potential measurements for downhole monitoring of reservoir fluid flows: A laboratory study. J. Pet. Sci. Eng. 2018, 161, 38–49. [Google Scholar] [CrossRef]
  22. Li, R.; Tan, G.; Zhang, J. An Experimental Method of Distribution Behavior of Hydrophobically Associated Polymer AP-P4 in Three-Phase Systems. J. Chem. 2013, 2013, 1–7. [Google Scholar] [CrossRef]
  23. Guo, Y.; Hu, J.; Zhang, X.; Feng, R.; Li, H.B. Flow Behavior Through Porous Media and Microdisplacement Performances of Hydrophobically Modified Partially Hydrolyzed Polyacrylamide. SPE J. 2016, 21, 0688–0705. [Google Scholar] [CrossRef]
  24. Hamid, E.M.; Riyaz, K.; Majid, N.A. Experimental studying of pore morphology and wettability effects on microscopic and macroscopic displacement efficiency of polymer flooding. J. Pet. Sci. Eng. 2011, 78, 347–363. [Google Scholar] [CrossRef]
  25. He, Y.; Cheng, S.; Mu, G.; Xu, H.; Li, L.; Zhang, T.; Qin, J.; Yu, H. Waterflood Direction and Front Characterization With Four-Step Work Flow: A Case Study in Changqing Oil Field, China. SPE Reserv. Eval. Eng. 2017, 20, 708–725. [Google Scholar] [CrossRef]
  26. Zhao, F.; Shen, R.; Gao, S.S.; Xu, G. Application and Calculation Method of Waterflood Front in Low Permeability Reservoir. J. Jpn. Pet. Inst. 2014, 57, 271–275. [Google Scholar] [CrossRef] [Green Version]
Figure 1. Schematic diagram of the core model (left) and a core sample (right).
Processes 08 00093 g001
Figure 2. Glass etched micromodel and its holder.
Processes 08 00093 g002
Figure 3. The flow chart.
Processes 08 00093 g003
Figure 4. Macroscopic oil displacement results for (a) homogenous cores and (b) layered heterogeneous cores. (fw—water cut, R—oil recovery).
Processes 08 00093 g004
Figure 5. Polymer injection timing effect on oil recovery effect.
Processes 08 00093 g005
Figure 6. Microscopic oil displacement of waterflooding (upper) and polymer flooding (lower) before water breakthrough.
Processes 08 00093 g006
Figure 7. Microscopic oil displacement at different polymer injection timing (Upper: Sw = 15.42%; Middle: Sw = 42.79%; Lower: Sw = 38.83%). (a) Initial state; (b) after waterflooding; (c) after polymer flooding; (d) after post-waterflooding.
Processes 08 00093 g007
Figure 8. Sweep efficiency of waterflooding.
Processes 08 00093 g008
Figure 9. Water-oil relative permeability (upper) and fractional flow (lower) curves.
Processes 08 00093 g009aProcesses 08 00093 g009b
Figure 10. Residual oil distribution of waterflooding when injecting 0.101 PV (left, water breakthrough) and 0.84 PV (right) of water.
Processes 08 00093 g010
Figure 11. Distribution of remaining oil before and after injection of 0.104 PV water.
Processes 08 00093 g011
Figure 12. Remaining oil distribution after polymer flooding initiated at Sw = 42.79% (left) and 38.83% (right).
Processes 08 00093 g012
Table 1. Formation brine and injection brine composition.
Ion TypesNa+ and K+Ca2+Mg2+CO32−HCO3SO42−ClTDS
Concentration mg/L3091.96276.17158.6814.21311.4885.295436.349374.12
Table 2. Polymer injection timing.
Water Volume Injected Before Polymer Flooding
Test#1#2#3#4#5#
Homogeneous core0.07 PV0.14 PV0.20 PV0.27 PV0.36 PV
Heterogeneous core0.03 PV0.07 PV0.10 PV0.13 PV0.20 PV
Table 3. Comparison of recovery rates.
Polymer Injection TimingOil Recovery of WaterfloodingOil Recovery of Polymer FloodingFinal Oil Recovery
Sw = 15.42%15.42%37.92%69.17%
Sw = 42.79%42.79%47.15%60.12%
Sw = 38.83%38.83%52.27%86.33%
Table 4. Related calculation of the homogeneous core.
Time (min)Water Front Position (cm)Injection PV
12.32 0.0136
24.65 0.0272
36.97 0.0407
49.30 0.0543
511.62 0.0679
613.94 0.0815
716.27 0.0951
818.59 0.1087
920.91 0.1222
1023.24 0.1358
1129.58 0.1494
1235.91 0.1630
1342.25 0.1766
1448.59 0.1901
1568.31 0.2037

