Article

Assessment of the Use of Natural Extracted Dyes and Pancreatin Enzyme for Dyeing of Four Natural Textiles: HPLC Analysis of Phytochemicals

by
Mohamed Z. M. Salem
1,*,
Ibrahim H. M. Ibrahim
2,
Hayssam M. Ali
3,4 and
Hany M. Helmy
5
1
Forestry and Wood Technology Department, Faculty of Agriculture (EL-Shatby), Alexandria University, Alexandria 21545, Egypt
2
High Institute of Tourism, Hotel Management and Restoration, Abu Qir, Alexandria 21526, Egypt
3
Botany and Microbiology Department, College of Science, King Saud University, P.O. Box 2455, Riyadh 11451, Saudi Arabia
4
Timber Trees Research Department, Sabahia Horticulture Research Station, Horticulture Research Institute, Agriculture Research Center, Alexandria 21526, Egypt
5
Textile Research Division, National Research Centre, El-Buhouth st., Dokki, Cairo 12311, Egypt
*
Author to whom correspondence should be addressed.
Processes 2020, 8(1), 59; https://doi.org/10.3390/pr8010059
Submission received: 10 December 2019 / Revised: 27 December 2019 / Accepted: 30 December 2019 / Published: 2 January 2020
(This article belongs to the Special Issue Green Separation and Extraction Processes)

Abstract

:
In the present study, four natural textiles (cotton, linen, wool, and silk) were dyed with 14 naturally extracted dyes, and pancreatin enzyme was used in the dyeing process. The effects of pancreatin enzyme and its buffer on naturally dyed textile samples were evaluated. Two concentrations of pancreatin enzyme and buffer were used as pretreatments for dyed textiles. Proteinic fabrics showed the highest relative color strength (RCS) values of 137.23% and 132.2% when the pancreatin enzyme was applied on wool and silk dyed with pomegranate skin and bloodroot at concentrations A and B, respectively. Linen fiber dyed with catechu tree showed the highest total color difference (TCD) values with buffer (6.83) and pancreatin enzyme A (5.7) and B (6.3). This shows that there were no side effects of the pancreatin enzyme on the studied dyed textiles. By high-performance liquid chromatography (HPLC) analysis, the root extract from madder showed the presence of salicylic acid (1758.91 mg/kg extract), quercetin (844.23 mg/kg extract), ellagic acid (784.86 mg/kg extract) and benzoic acid (582.68 mg/kg extract) as main compounds. In cochineal extract the main compounds were rutin (37.732 mg/kg extract), kampherol (1915.98 mg/kg extract), myricetin (809.97 mg/kg extract), quercetin (496.76 mg/kg extract) and salicylic acid (193.87 mg/kg extract).

1. Introduction

High-performance liquid chromatography (HPLC), an analytical chemistry technique, was widely use to separate as well as to identify and quantify the components in a mixture of phenolics, flavonoids, alkaloids, polysaccharides and saponins [1,2,3,4]. Phenolic and flavonoids compounds extracted from natural materials play a potential role in dyeing of natural fibers under the work enzymes [5,6]. Enzymes such as amylases, catalase, and laccase used in the textile industry are highly specific and efficient in the removal of starch, degradation of lignin and removal of excess hydrogen peroxide used in the bleaching of textile fabrics [7]. They are considered nontoxic and eco-friendly, which is important for manufacturers endeavoring to reduce pollution in textile production [8,9,10].
Textile conservators have long recognized the benefits of enzymes in the conservation of works of art. About 7000 enzymes are known, and among them, 75 are commonly used in the textile industry [11]. The production of enzymes with potential industrial application in textiles is greatly needed [12,13]. Hydrolases and oxidoreductases are the principal enzymes applied in the textile industry [14]. These enzymes are capable of oxidizing phenols by hydrogen atom abstraction with formation of corresponding phenoxyl radicals that improve the fixation of natural dyes on fabric [15,16].
The most recent commercial advances in the application of enzymes in textiles are cellulases for denim finishing and laccases for decolorization of textile effluents resulting from the bleaching process [17]. Most commonly, hydrolase-type enzymes are employed in the conservation of textile works to assist in the breakdown of adhesive residues from previous restorations or to facilitate the removal of some stains. The principal advantages of these enzymes are their specificity and efficiency in catalyzing the hydrolytic cleavage of polymers such as proteins, polysaccharides, and lipids [18].
Many studies have used various enzymes such as laccase, lipase, amylase, protease, and diastase in textile conservation [19,20]. Laccase plays a dominant role in the fixation of natural flavonoid dye (rutin), because laccases act on phenols and similar substrates, performing one-electron oxidation, leading to crosslinking with textile fabrics [21]. Proteases, amylases, and lipases are used to remove proteinaceous, starchy, and fatty stains, respectively, at low temperatures and on cotton/polyester blends [22]. Several commercial lipases/esterases have been tested for their ability to hydrolyze oligomers formed during the manufacture of synthetic fibers (e.g., polyethyleneterephthalate) [23]. However, the use of enzymes from animal sources had limited success, as those enzymes were not suited to the prevailing washing conditions. The first detergent containing a bacterial enzyme was introduced to the market in the 1960s [24]. The exocrine cells of porcine pancreas produce pancreatin, which contains enzymatic components of trypsin, amylase, lipase, ribonuclease, and protease, which are able to hydrolyze proteins, starches, and fats [25,26].
Natural dyes or colorants obtained from animals or vegetable matter without chemical processing are widely used in the paper and textile industries [27,28]. Different parts of plants such as leaves, roots, fruits, flowers, and seeds are sources of natural dyes [27].
Crushed female cochineal insects give a natural deep crimson dye (carmine) that can be used to produce a range of scarlet, red, pink, and orange shades [29,30,31]. Madder roots have been reported to contain various anthraquinone compounds, which in Indian madder (Rubia cordifolia) are purpurin, munjistin, and nordamnacanthal, and in European madder (R. tinctoriun) is alizarin [32,33,34,35].
Sumacs, the woody shrub or small tree of staghorn sumac can reach 5–10 m in height. Their fruits (drupes) are typically ground into a reddish-purple powder that can be used as a spice for tarts or to add a lemony taste to salads or meats [36]. Cutch, a natural brown dye obtained from the heartwood of Acacia catechu, found in most of the Indian sub-Himalayas. The content of catechin in cutch varies from 4% to 7%. The extracted material is widely used for textile dyeing. Pharmacological research has verified that cutch is utilized in traditional medicines, with anti-inflammatory and anticancer activities. Cutch is usually used in India, Indonesia, and Peru [37,38]. The outer layer of onion, onion peel, is a natural byproduct of the food industry. It gives a bright reddish-brown color in textile coloration. It is grown all over the world [39,40].
The aim of this study was to shed light on the usage of pancreatic enzyme and its buffer in the conservation of naturally dyed fabrics. Moreover, the effectiveness of dyes was analyzed for their phytochemical using HPLC.

2. Materials and Methods

2.1. Natural Dyes and Textiles

This study used the most common natural dye sources known from ancient Egyptian dyeing of fabrics. Fourteen natural dyes extracted from madder roots (Rubia tinctoriun L.), common hop leaves (Humulus lupulus L.), bloodroot seeds (Potentilla erecta Uspenski ex Ledeb.), onion skin or peel (Allium cepa L.), pomegranate skin or peel (Punica granatum L.), catechu bark (Acacia catechu Willd.), common juniper tree seeds (Juniperus communis L.), dyer’s sumac seeds (Rhus coriaria L.), goldenrod leaves (Bongardia chrysogonum boiss), Egyptian acacia seeds (Acacia arabica Willd.), annatto seeds (Bixa orellana L.), common sage leaves (Salvia officinalis L.), dog’s fennel flowers (Anthemis cotula L.), and American cochineal or body insect (Dactylopius coccus). These 14 natural dyes were used to dye 4 natural fabrics (linen, cotton, wool, and silk) that were purchased from Manstex Textile Company, Alexandria, Egypt; Misr Spinning & Weaving Company, Mahala El Kobra, Egypt; Goldentex Wool Textile Company, 10th of Ramadan, Egypt; and Awlad Khattab Company for Handmade Silk Textile, Akhmim, Egypt, respectively (Table 1).

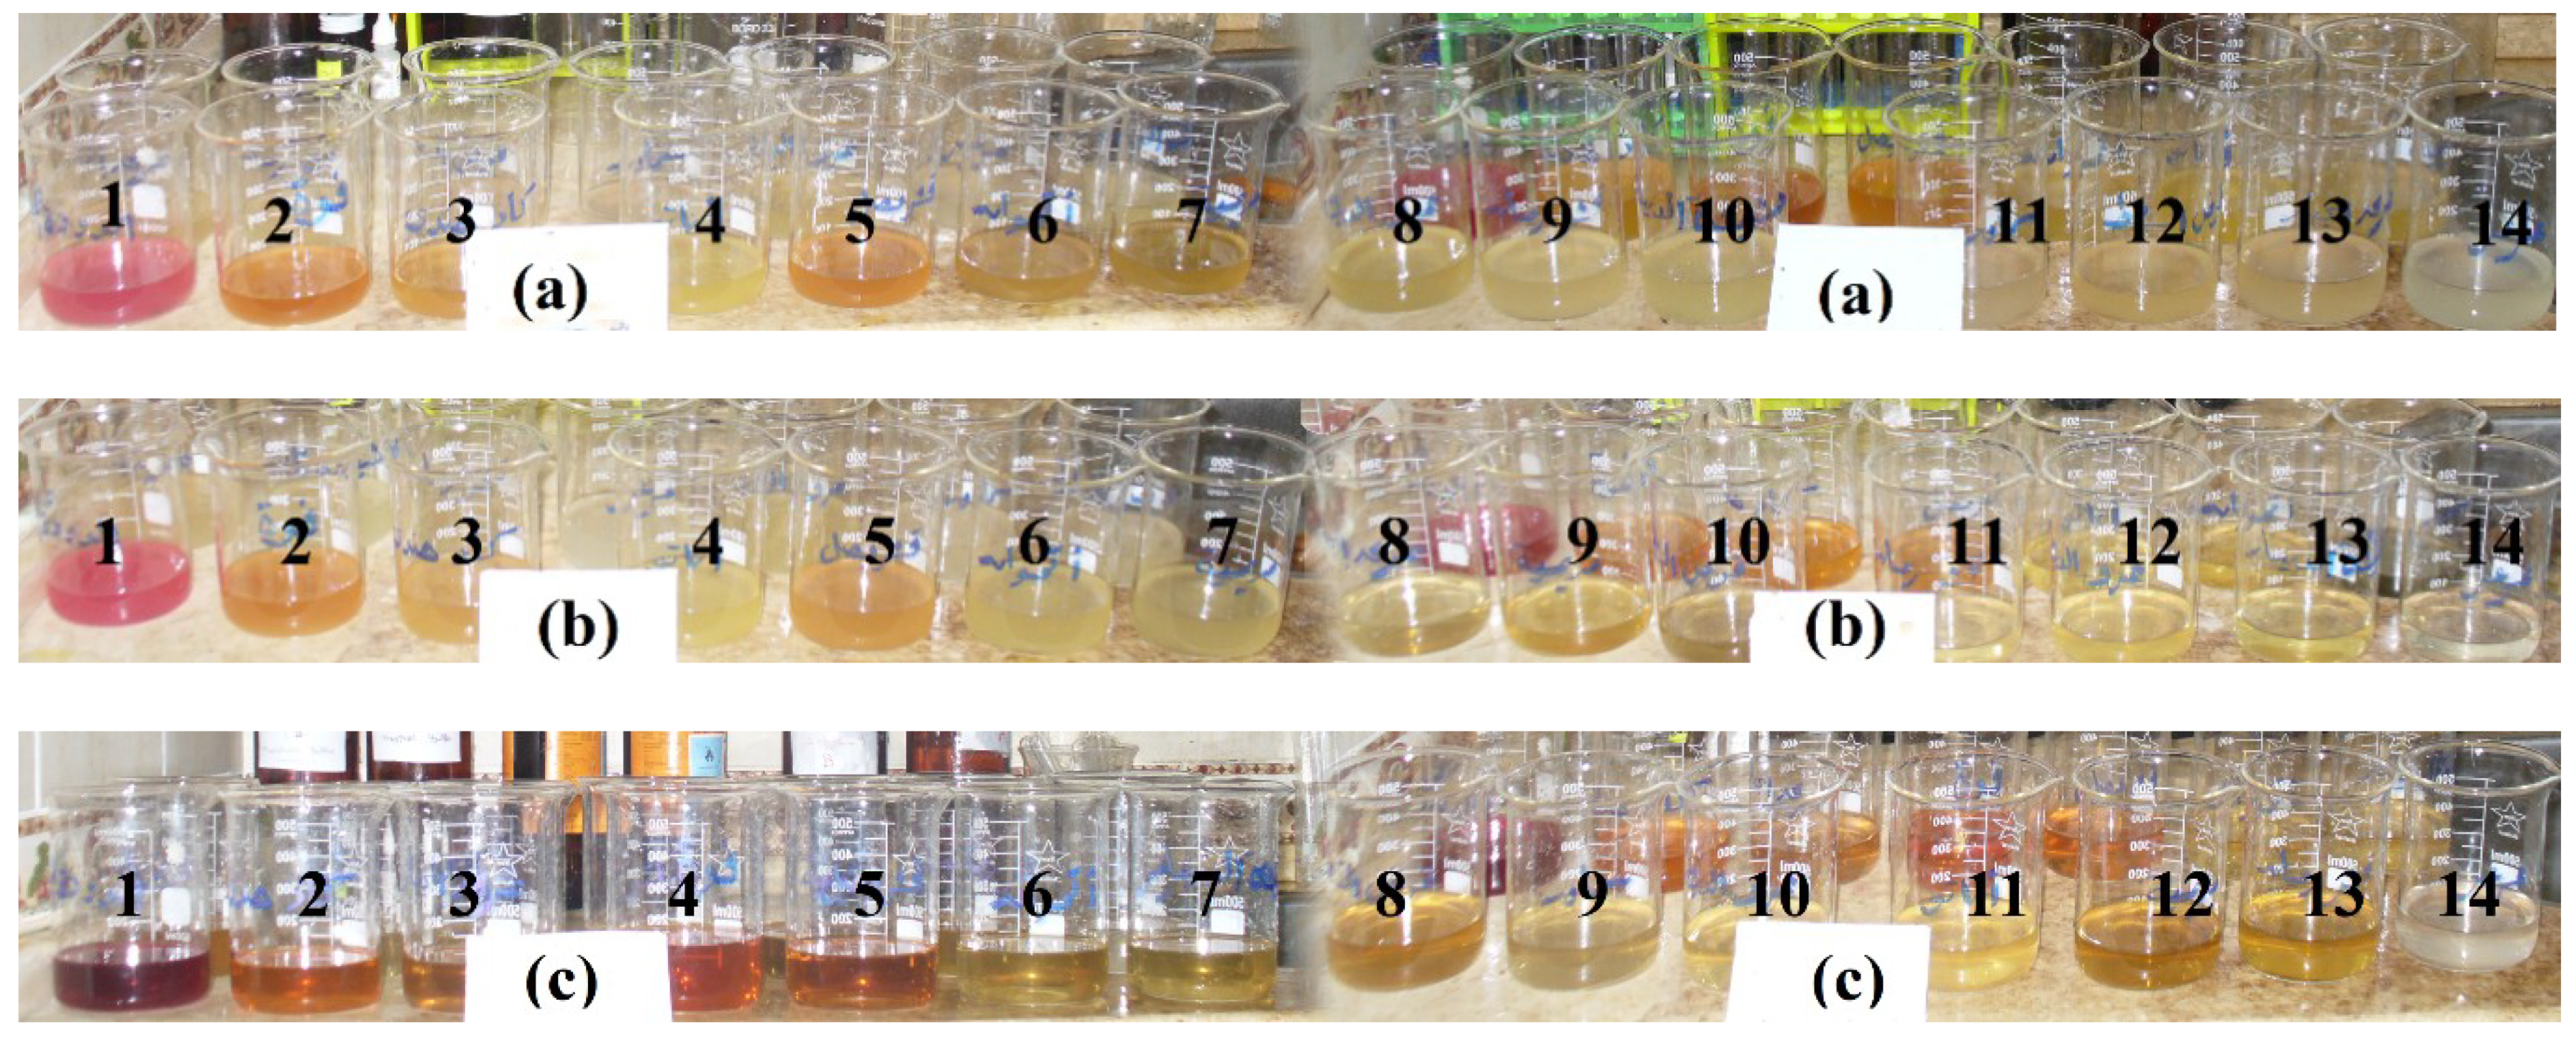
2.2. Extraction Method

Aqueous extraction was used as mentioned by Ibrahim et al. [20], with some modification. Dye materials were ground into fine powder, soaked in cold water for 24 h, then boiled in water for 15 min with continuous stirring to ensure the extraction process. The extraction was allowed to cool and then filtered to get a clear solution. The dye solution was adjusted to a definite volume to give a suitable ratio of 20 mL of dye solution to 1 g of fiber (liquor ratio).

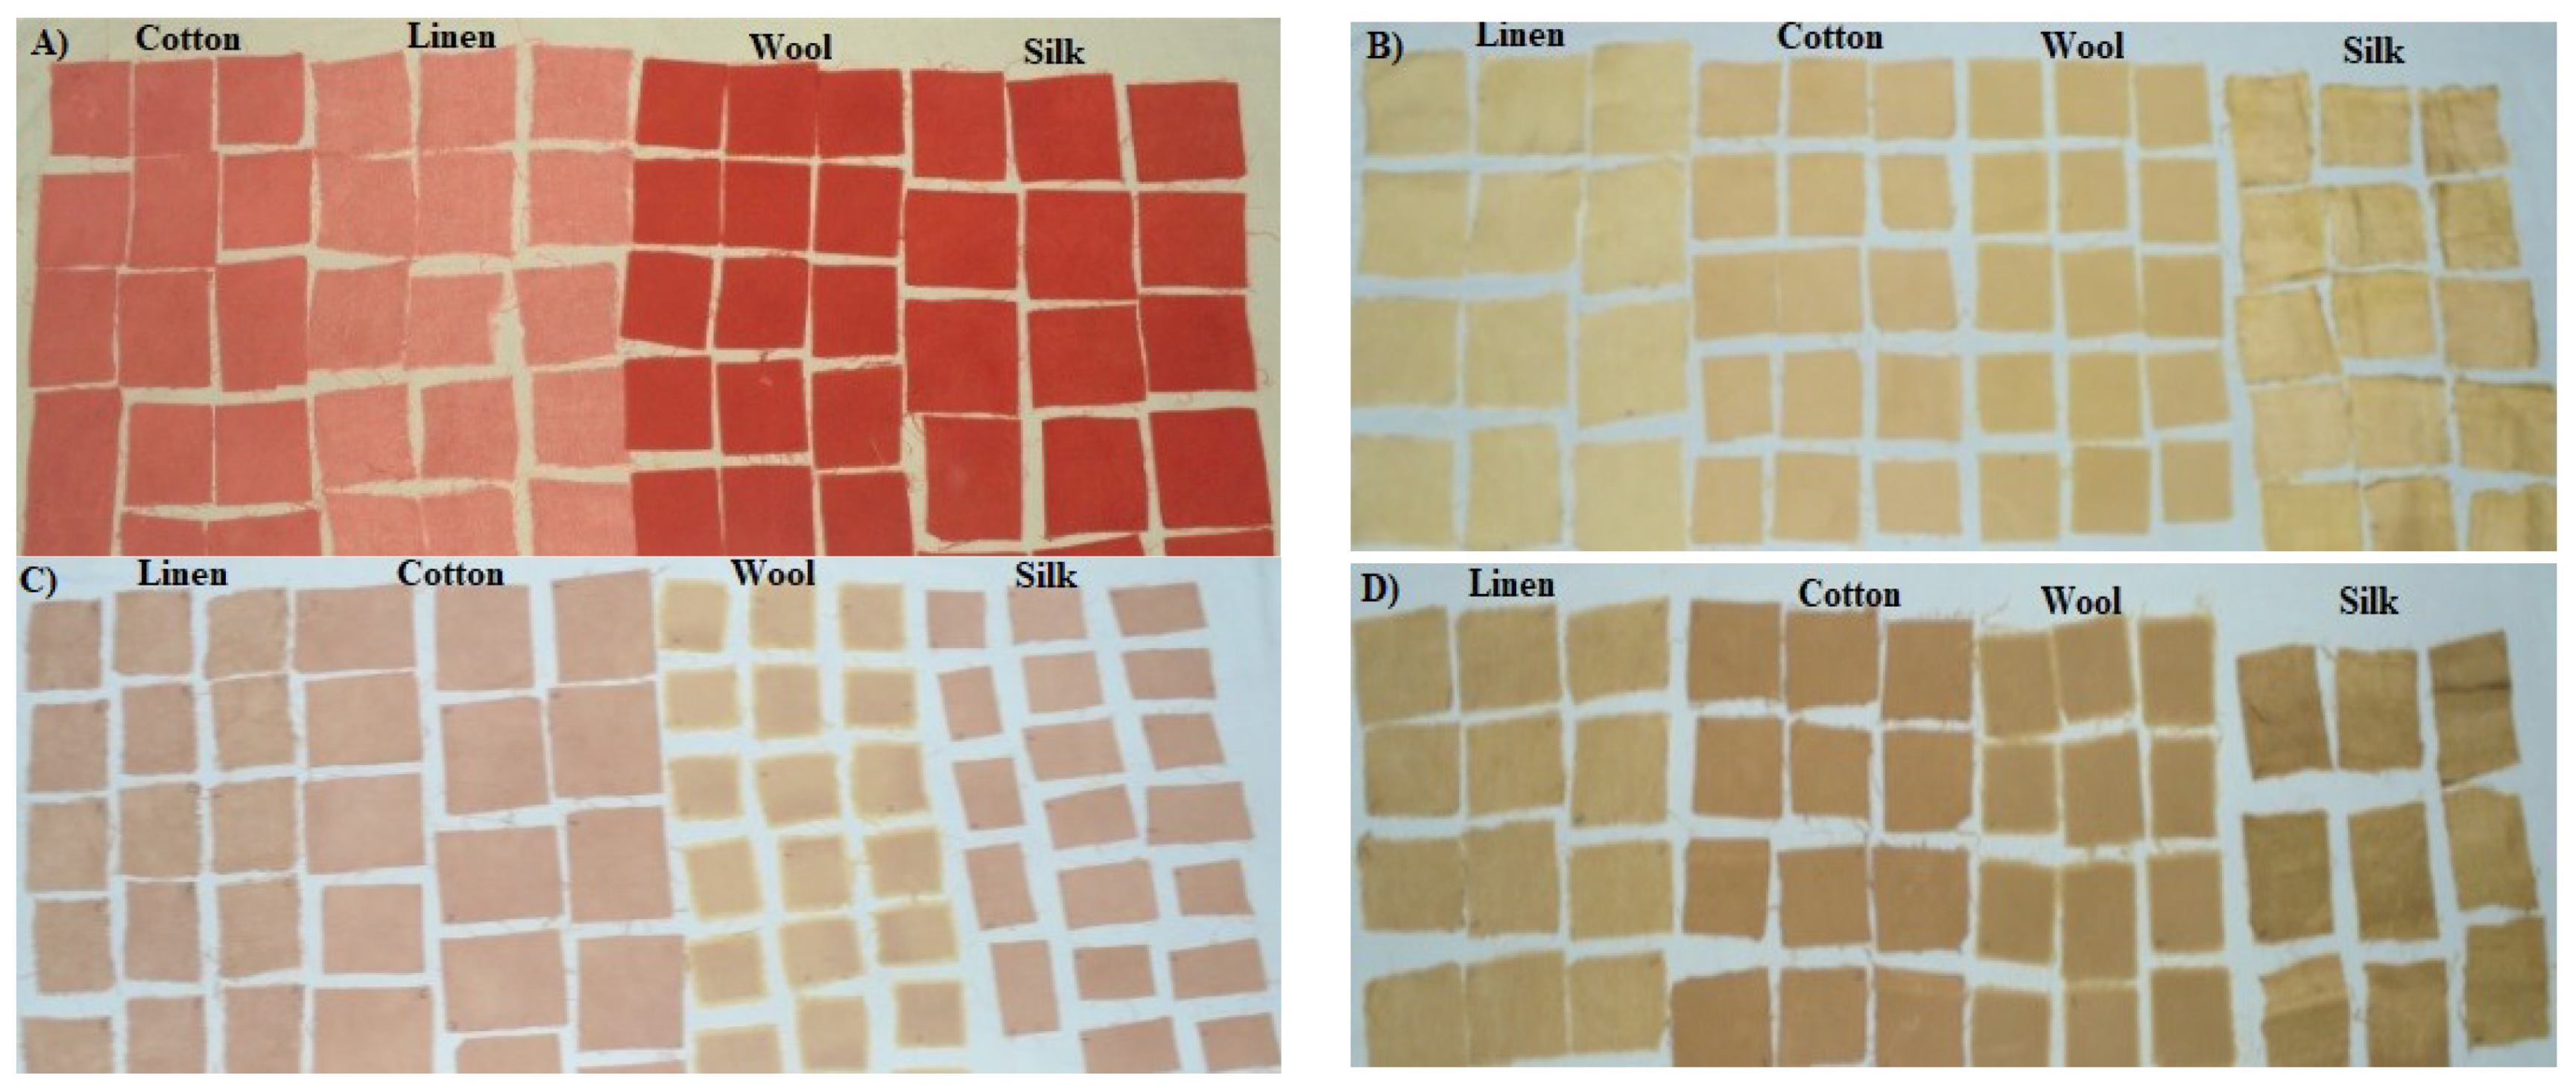
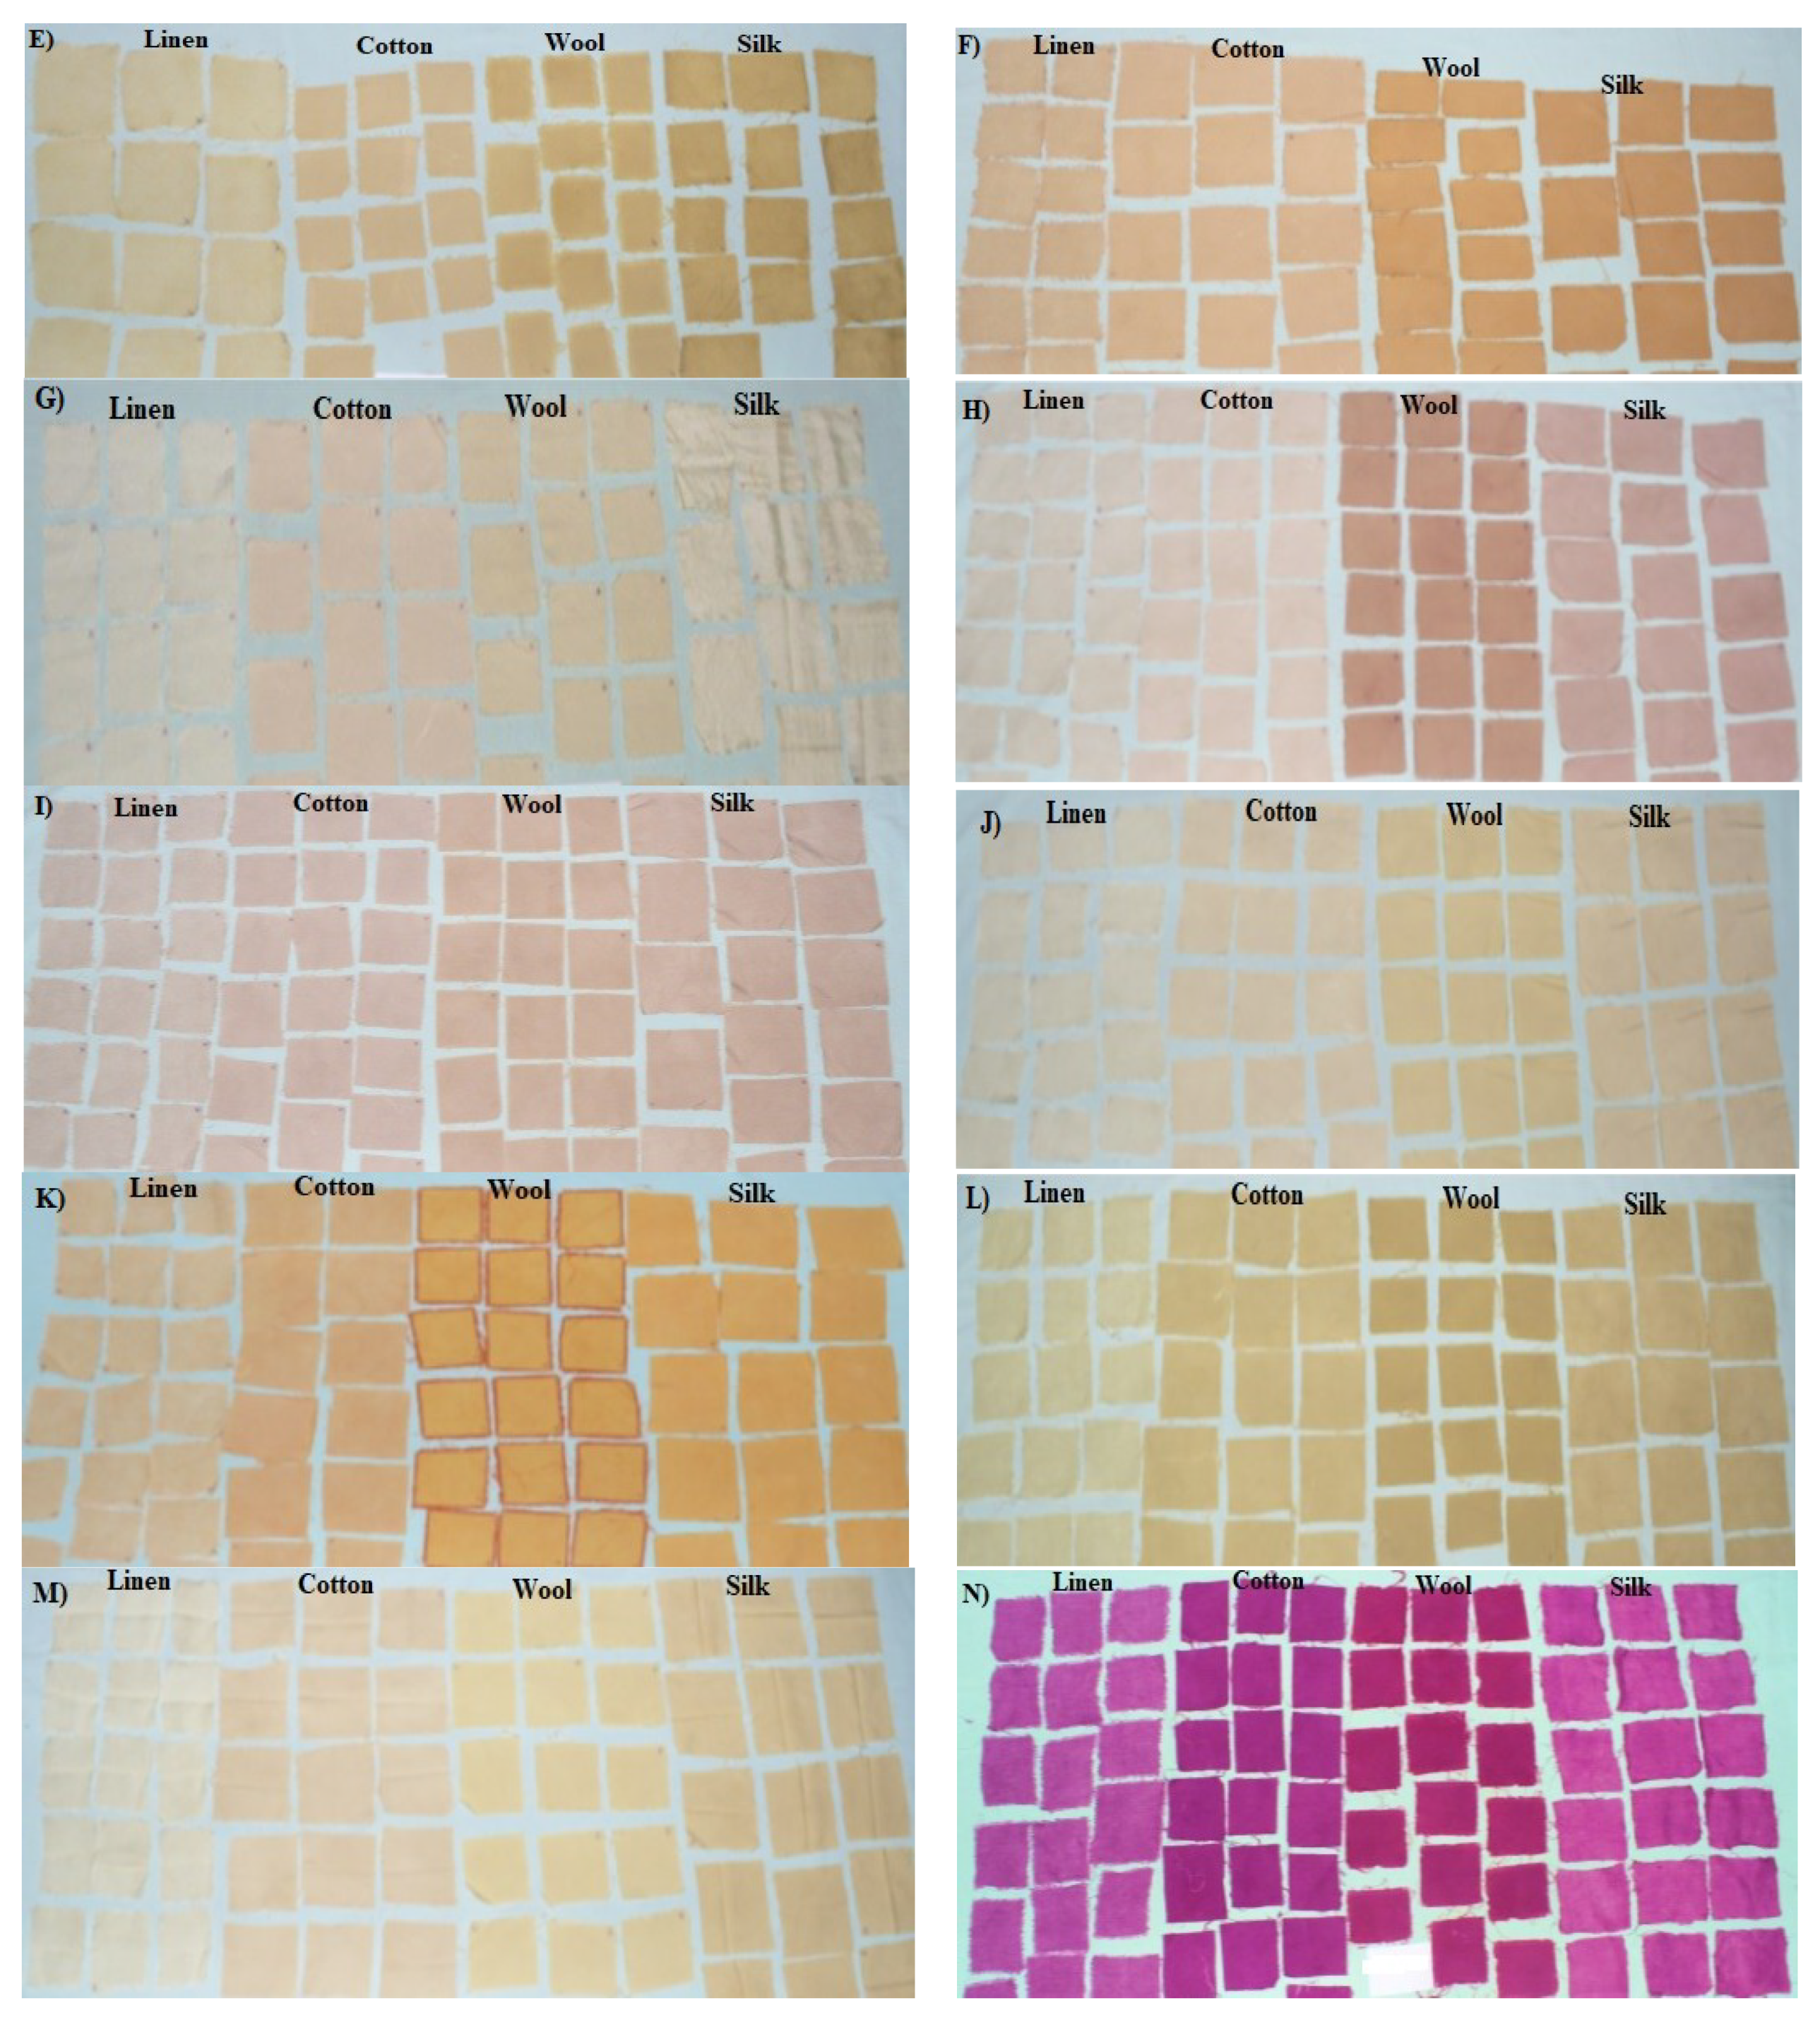
2.3. Dyeing Procedures

The dyeing process was performed in glass beakers at 80 °C for cotton and linen and at 70 °C for wool and silk, with continuous stirring while adding a small amount of sodium chloride to the cellulosic fabric (cotton, linen) dye bath and a small amount of weak acid to the proteinic fabric (wool, silk) dye bath. The dyed fabrics were rinsed with cold water and washed for 30 min in a bath containing 3 g/L of nonionic detergent at 45 °C. Finally, the fabrics were rinsed and air-dried [41] (Figure 1).

2.4. Mordanting Procedures

The fabrics were mordanted prior to dyeing by treating with alum as a metal salt (to produce an affinity between the fiber and the dye in order to develop color on the fiber) with a liquor ratio of 1:50 and 0.1% concentration at 90 °C for cellulosic fabrics and at 80 °C for proteinic fabrics for 30 min. Then they were allowed to cool at room temperature, and the cellulosic and proteinic fabrics were removed and squeezed [31,41,42,43].

2.5. Treatment of Fabrics with Natural Dyes Using Pancreatin Enzyme and Its Buffer Solution

Pancreatin enzyme (E.C. 232-468-9, Sigma–Aldrich, Darmstadt, Germany) solute and phosphate buffer solution (pH 7.8) were used. Phosphate buffer was used alone to study the role of buffer solution pH in the bleeding of natural dyes. In addition to the buffer medium, 2 concentrations of pancreatin enzyme (concentration A: 226 mg pancreatin enzyme in 250 mL buffer solution; concentration B: 1130 mg pancreatin enzyme in 250 mL buffer solution) were used. After all treatments, the dyed fabrics with different concentrations of enzymes (buffer only, concentration A, and concentration B) were measured for relative color strength (%) and total color difference (TCD) by using a portable spectrophotometer (Misr Amreya Company for Spinning & Weaving Laboratories, Alexandria, Egypt). Buffer solution in the absence of enzyme was used for comparison (Figure 2). The enzyme was applied at a temperature of 40 °C for 4 h [44].

2.6. Measurement of Color Strength and Color Differences of Dyed Fabrics

The color strength of dyed fabrics was measured using a reflectance curve between 350 and 750 nm using a reflectance spectrophotometer with illuminant D65 at 10° observer. The minimum of the curve (Rmin) was used to determine the ratio of light absorption (K) and scatter (S) (K/S) via the Kubelka–Munk equations [45]:
( K S ) D y e d ( 1 R min ) 2 2 R min
R C S = ( K S ) E x t r a c t e d ( K S ) R a w
where relative color strength (RCS) was determined comparing the K/S ratio of the sample and a standard reference. RCS determination gives an indirect indication of the pigment dispersion inside the matrix: the higher the RCS value, the better the dispersion.

2.7. Color Difference Formula (L*a*b*)

The total CIE L*a*b* difference was measured using a HunterLab spectrophotometer (model DP-9000, Sunset Hills Road, Reston, VA, USA). Color difference was expressed as ∆E, calculated by the following equation:
ΔE* = [(ΔL*) 2 + (Δa*) 2+ (Δb*)2] ½
CIE L*a*b* between two colors given in terms of L*a*b* is calculated.
where ΔE* is the color difference between the sample and the standard; L* value indicates lightness; (+) if sample is lighter than standard, (−) if darker; a* and b* values indicate the relative positions in CIELAB space of the sample and the standard, from which some indication of the nature of the difference can be seen.

2.8. HPLC Analyses of Phenolics/Flavonoids and Caffeine Contents

HPLC analysis for the most effective dyes were measured according to our previous works [46,47,48]. An HPLC instrument (Agilent1260 infinity HPLC Series; Agilent, Santa Clara, CA, USA), equipped with quaternary pump, aKinetex®5lJm EVO C18 100 mm × 4.6 mm, (Phenomenex, Santa Clara, CA, USA), operated at 30 °C was used to analysis the phenolic compounds. The separation is achieved using a ternary linear elution gradient with (A) HPLC grade water 0.2% H3P04 (v/v), (B) methanol and (C) acetonitrile. The injected volume was 20 µL. Detection: VWD detector set at 284 nm.

2.9. Statistical Analysis

In the present study, properties of naturally dyed samples (relative color strength (%) and total color difference) were affected by three factors: enzyme concentration, dye type, and fiber type. Thus, the data were statistically analyzed in factorial design using three factors with an ANOVA procedure in SAS version 8.2 [49] according to the model:
Yijkl = μ + Ai + Bj + Ck + (A × B)ij + (A × C)ik + (B × C)jk + (A × B × C)ijk + eijkl
where Yijkl represents result of the ith enzyme concentration (Ai) with jth dye type (Bj) with kth fiber type (Ck); μ is the general mean; (A × B)ij is the interaction between enzyme concentration and dye type; (A × C)ik is the interaction between enzyme concentration and fiber type; (B × C)jk is the interaction between dye type and fiber type; (A × B × C)ijk is the interaction among enzyme concentration, dye type, and fiber type; and eijkl is the experimental error. Significance levels were chosen at p < 0.05.

3. Results

3.1. Effects of Pancreatin Enzyme Concentration, Type of Dye, and Fiber on the Properties of Naturally Dyed Fabrics

ANOVA results in Table 2 show that the concentration of pancreatin enzyme, type of dye, and type of fiber have highly significant values regarding the properties of naturally dyed fabrics.
In addition, the interactions enzyme concentration × dye type, dye type × fiber type, and enzyme concentration × dye type × fiber type showed highly significant effects on relative color strength (%) and total color difference of naturally dyed textiles (Figure 3 and Figure 4). On the other hand, the interaction between enzyme concentration and fiber type did not show a significant effect on relative color strength (%) and total color difference (Figure 5).
Figure 3a shows that the dyes with the highest relative color strength values were bloodroot, pomegranate skin, catechu tree, dyer’s sumac, Egyptian acacia, and annatto; as a result, these dyes have a high affinity for natural fibers and thus have high stability with enzyme treatment. The dyes with moderate relative color strength were madder, common hops, onion skin, common juniper tree, goldenrod, common sage, and cochineal; as a result, these dyes have a moderate affinity for natural fibers and low stability with enzyme treatment. The dye with the lowest relative color strength was dog’s fennel; as a result, this dye has a low affinity for natural fibers and the lowest stability with enzyme treatment.
Figure 3b shows that lower total color difference values indicate the stability of the dye color with treatment (madder, pomegranate skin, common juniper tree, dyer’s sumac, Egyptian acacia, annatto, common sage, and dog’s fennel). On the other hand, higher color difference values indicate instability of the dye color with treatment (onion skin and catechu tree).
In Figure 4a, it is clear that the material with the highest affinity for natural dyes is wool, followed by silk, cotton, and linen. The structure of animal fibers (wool and silk) contains both –NH2 and –COOH groups. Therefore, it is expected that chemical interactions between the extracts of natural dyes and wool or silk fabrics occur between the –OH (hydroxyl) group of the dye molecules and the oxygen and nitrogen atoms of the wool or silk fabric via H-bonding. On the other hand, plant fibers (cotton and linen) consist of CH2O– units due to their cellulosic structure. Therefore, it is better to use mordant with cellulosic fabrics to increase the reaction between the dye and the fabric to form a complex between the CH2O– groups of cellulose and metal cations via coordinate covalent bonding. This is consistent with what was found in ancient Egyptian, Greek, Roman, and Islamic textiles. Manufacturers used animal fibers (wool, silk) in dyed parts, and plant fibers (linen, cotton) in undyed parts. In Figure 4b, the lower rate of total color difference for wool emphasizes the analysis in previous figures.
Figure 5a shows that wool has the best result in terms of relative color strength compared to silk, cotton, and linen, as depicted by average values. The increase in color strength of dyed wool may be due to fiber swelling and greater breakdown of dye molecule aggregates in the solution, causing easier diffusion of dye molecules into the fiber. It is clear from this figure that the RCS results of different dyed fabrics depend on the type of natural dye used. Figure 5b shows that the TCD of different dyed fabrics depends on the type of natural dye used. In addition, it is clear from this figure that the best TCD results were obtained with wool fabrics and the worst with cotton and linen, as these cellulosic fabrics are negatively charged in water, thus exhibiting poor absorption of natural dyes due to the repulsion effect, causing poor color strength compared to the other fabrics.

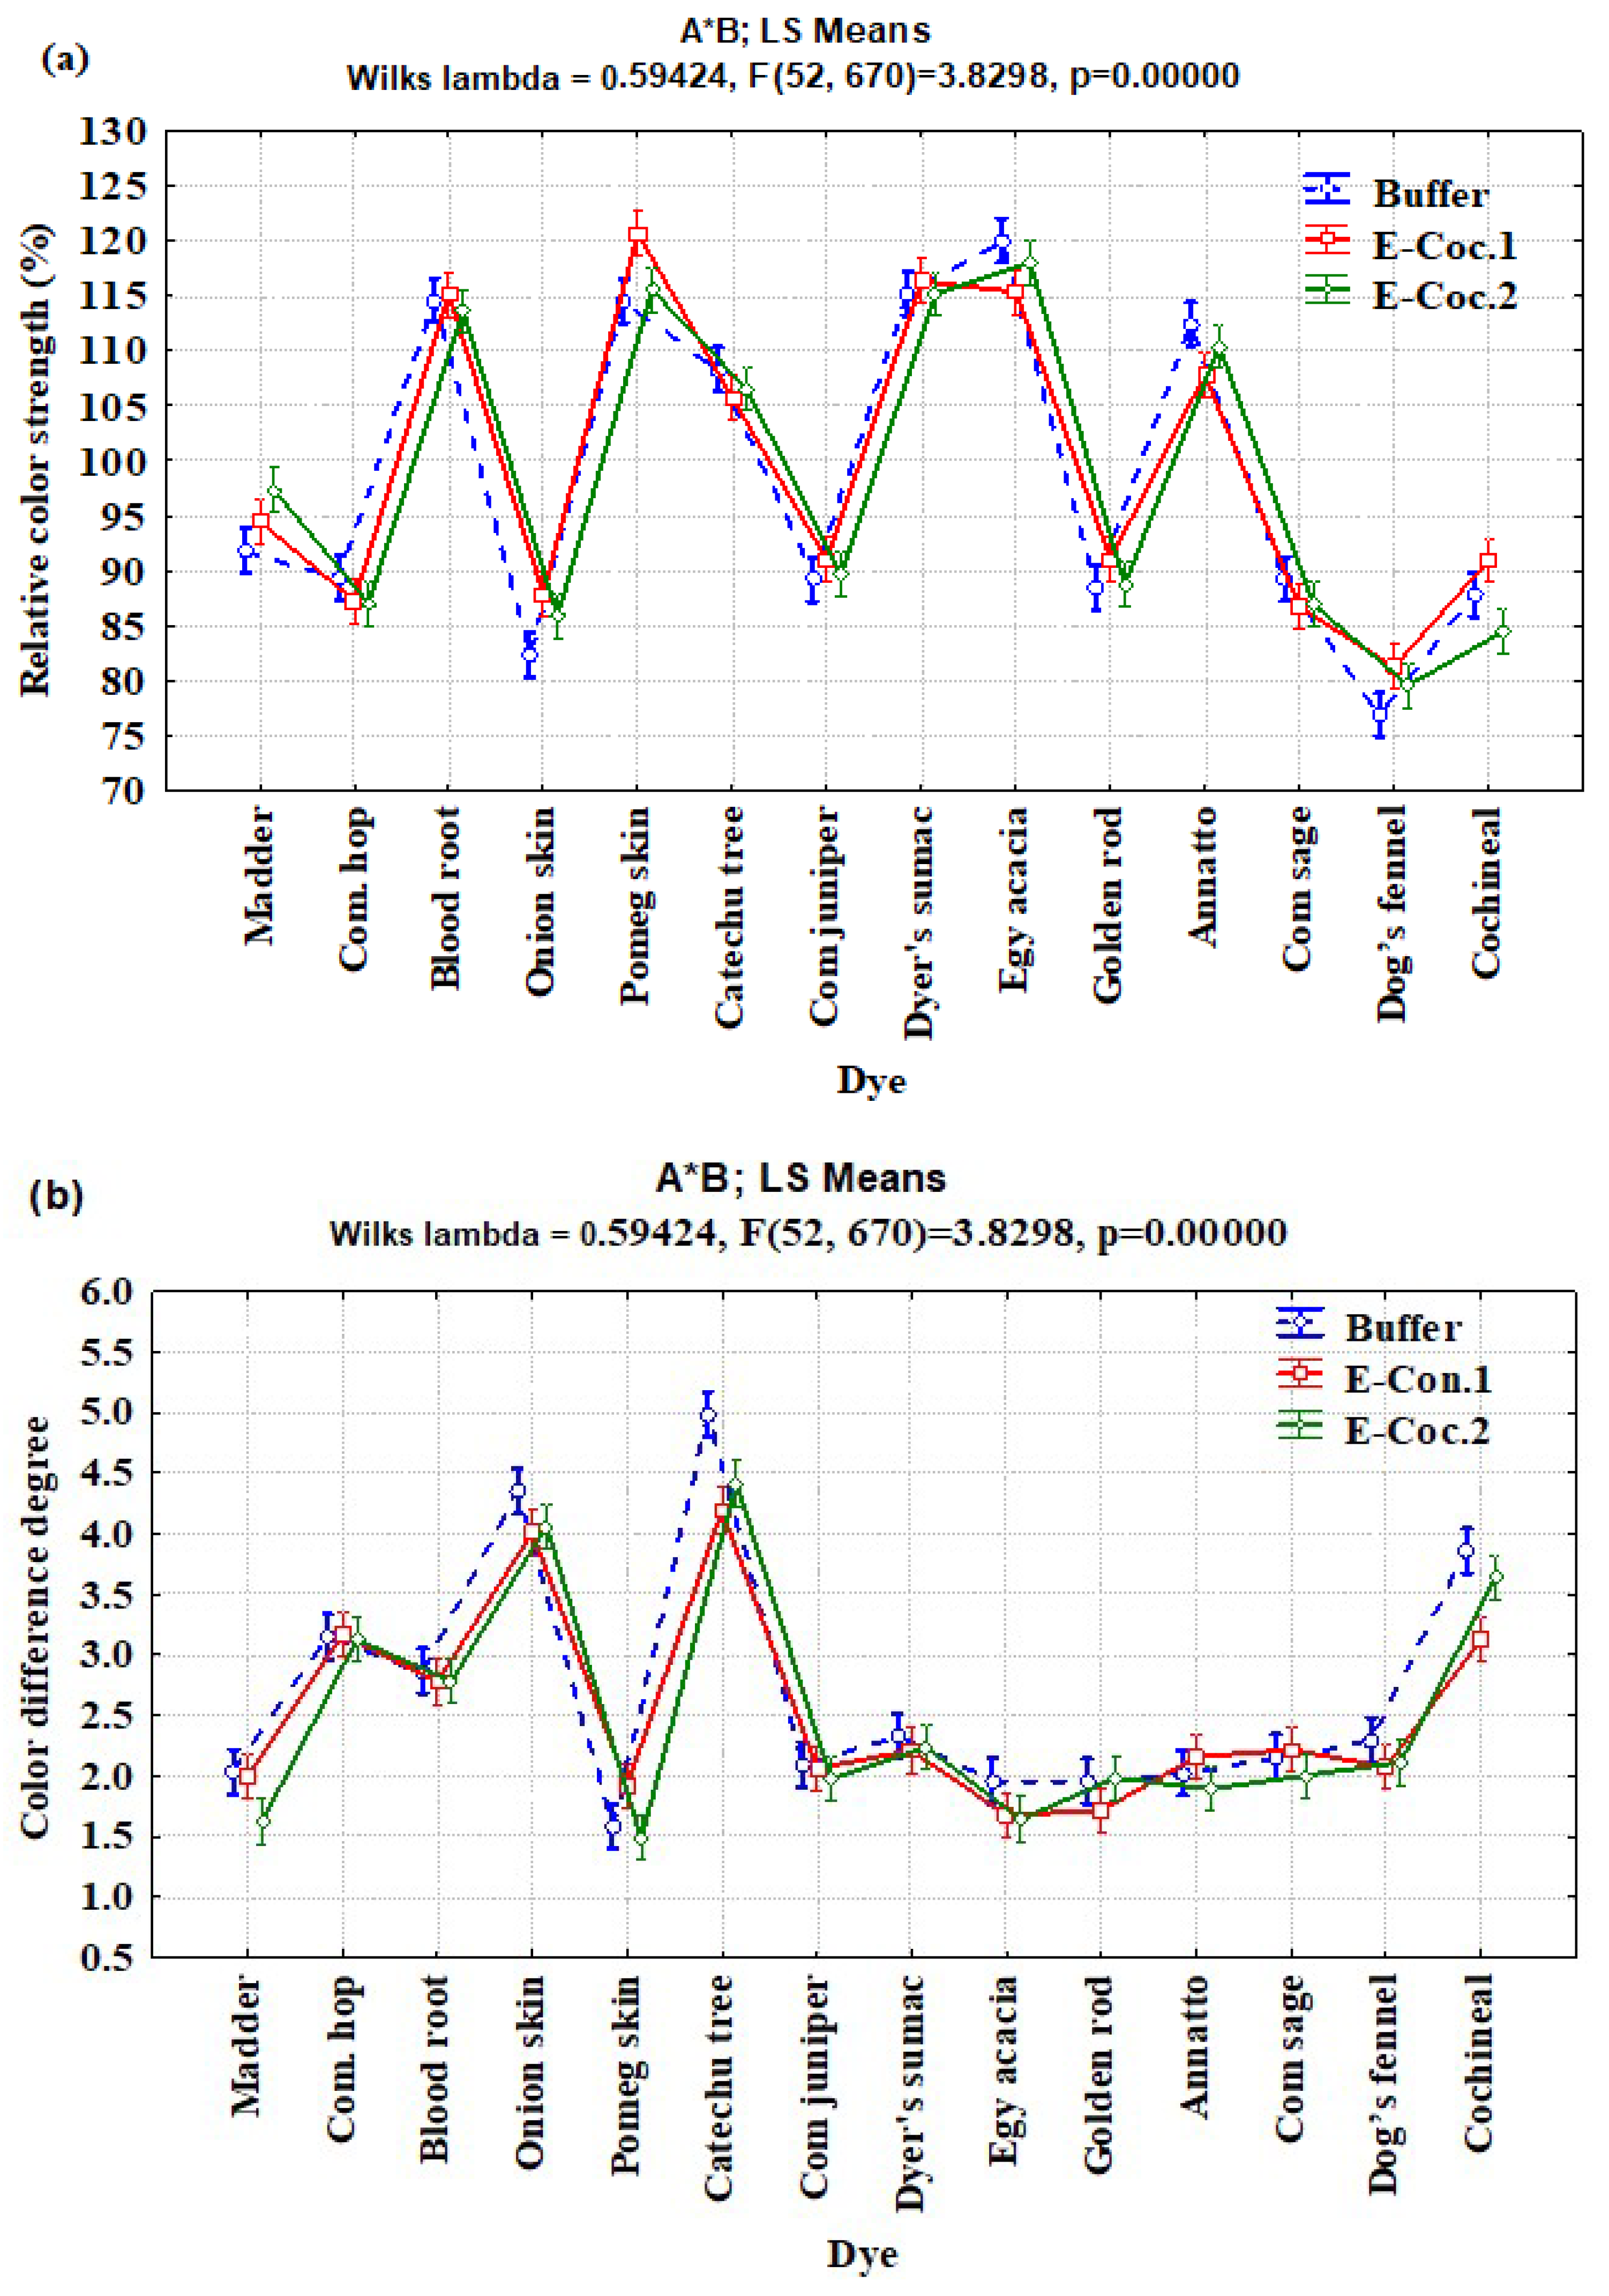
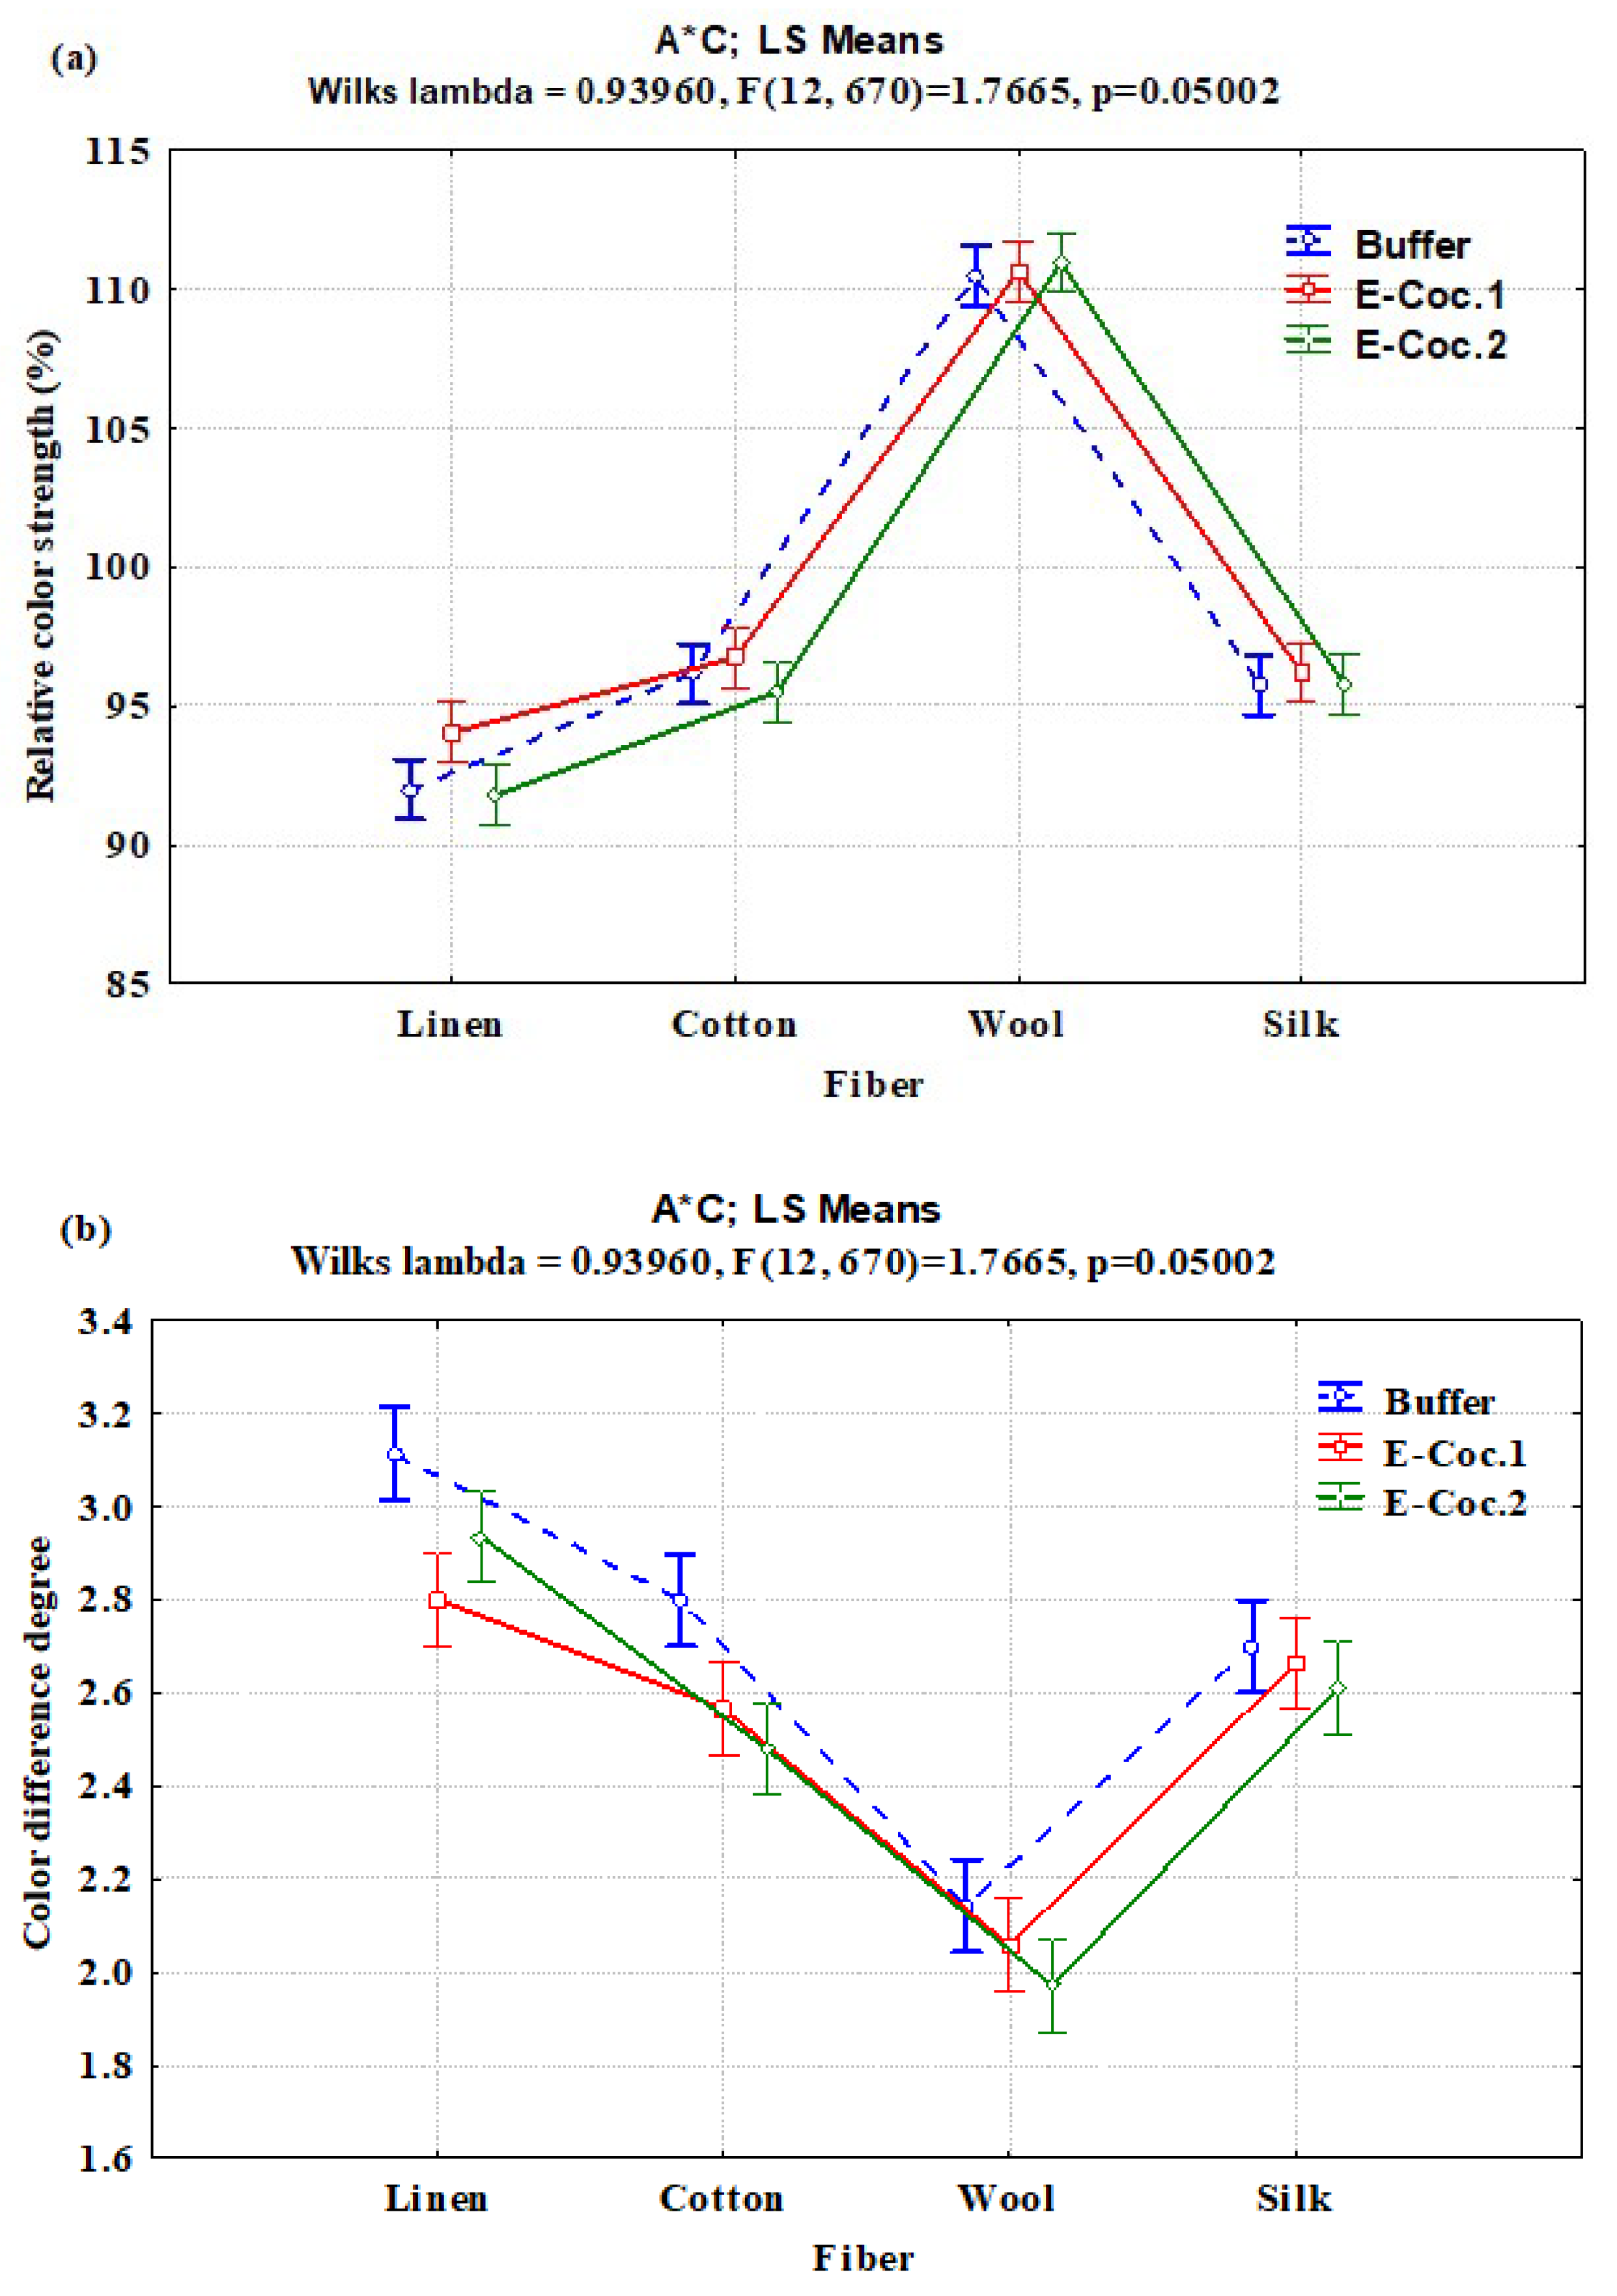
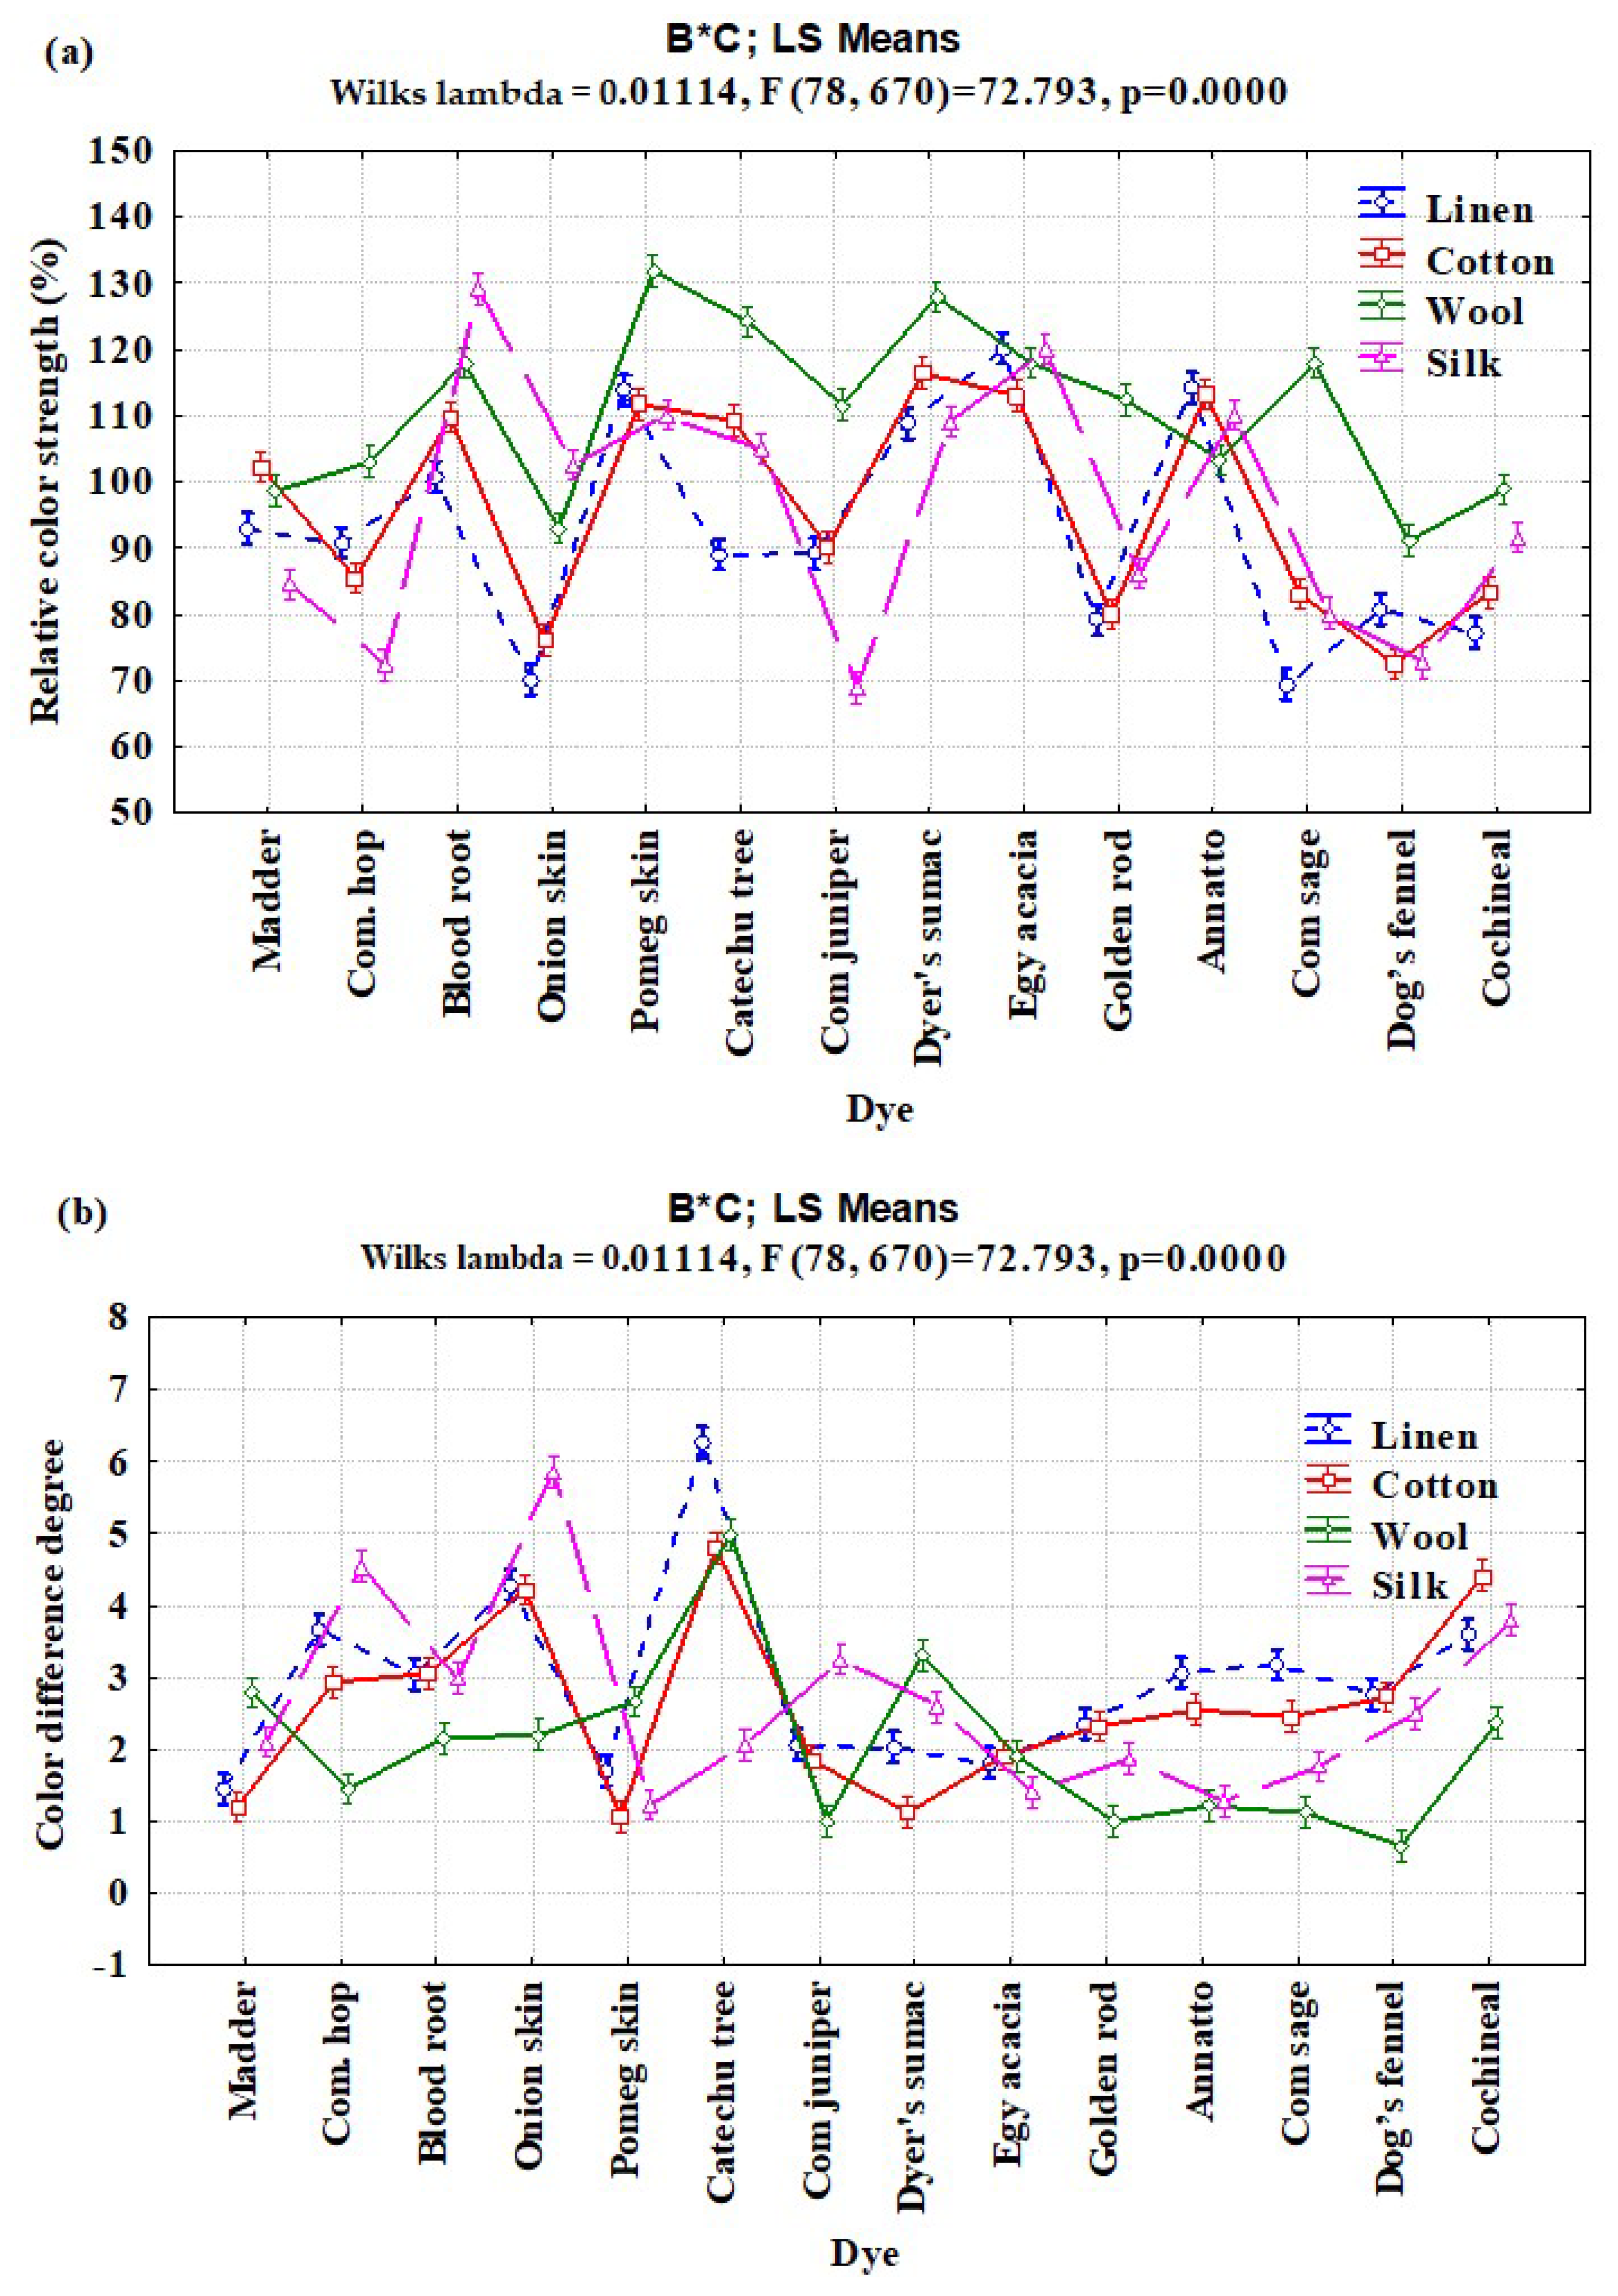
3.2. Interaction Effects of Enzyme Concentration, Dye Type, and Fiber Type on Relative Color Strength (%) and Total Color Difference

Table 3 shows the interactions among enzyme concentration × dye type × fiber type of the RCS and TCD of the product. Using buffer solution, the highest RCS values were observed with the following treatments: wool textile dyed with pomegranate skin (129.13%), catechu tree (128.73%), and sumac (126.53%), followed by silk textile dyed with bloodroot (125.56%) and Egyptian acacia (122.66%). The lowest values were found in the treatment of silk textile with common juniper (71.60%) and dog’s fennel (70.53%) dyes.
Using concentration A of pancreatin enzyme, the highest RCS values were found for the following combination treatment: wool, silk, cotton, and linen dyed with pomegranate skin (137.23%), bloodroot (129.73%), sumac (128%), and Egyptian acacia (123.33%), respectively. The lowest values were found for the combination treatment of linen dyed with common sage (70.4%) and onion skin (72.2%), followed by silk and cotton dyed with common hops (72.9%) and dog’s fennel (73.56%).
Using pancreatin enzyme in concentration B, the highest RCS values were found for silk dyed with bloodroot (132.2%), followed by wool dyed with pomegranate skin (129.3%), sumac (129.16%), and catechu tree (126.5%). The lowest values were observed for silk dyed with dog’s fennel (72.16%) and common hops (70.03%), followed by linen dyed with onion skin (69.7%) and common sage (69.16%).
Using buffer solution without enzyme, the highest TCD values of 6.83, 5.33, and 5.4 were observed with the combination treatment of linen, cotton, and wool, respectively, dyed with catechu tree, followed by silk dyed with onion skin (5.93%). The lowest values were observed for wood textile dyed with goldenrod (1) and dog’s fennel (0.67).
With the use of pancreatin enzyme in concentration A, the highest TCD values were observed for linen and silk textiles dyed with catechu tree (5.7) and onion skin (5.66), while the lowest values were observed in wool dyed with common sage (1.2), common juniper (1.15%), annatto (1.06), goldenrod (1.03), and dog’s fennel (0.61), and cotton dyed with pomegranate skin (1.08) and sumac (1.03). With enzyme concentration B, the highest TCD values were found in linen and silk dyed with catechu tree (6.3) and onion skin (5.96). The lowest values were observed in wool dyed with common hops (1.33), goldenrod (0.96), common sage (0.95), common juniper (0.9), and dog’s fennel (0.68); cotton dyed with madder (1.1), pomegranate skin (1.05), and sumac (0.96); silk dyed with annatto (103) and pomegranate skin (0.95); and linen dyed with madder (1.3).
In general, from the above-mentioned results, the highest RCS values were found with pancreatin enzyme for protein fibers of wool (137.23%) and silk (132.2%) dyed with pomegranate skin and bloodroot at concentrations A and B, respectively. On the other hand, the highest TCD values were found in the treated linen fiber with buffer (6.83), pancreatin enzyme A (5.7) and B (6.3) dyed with catechu tree.

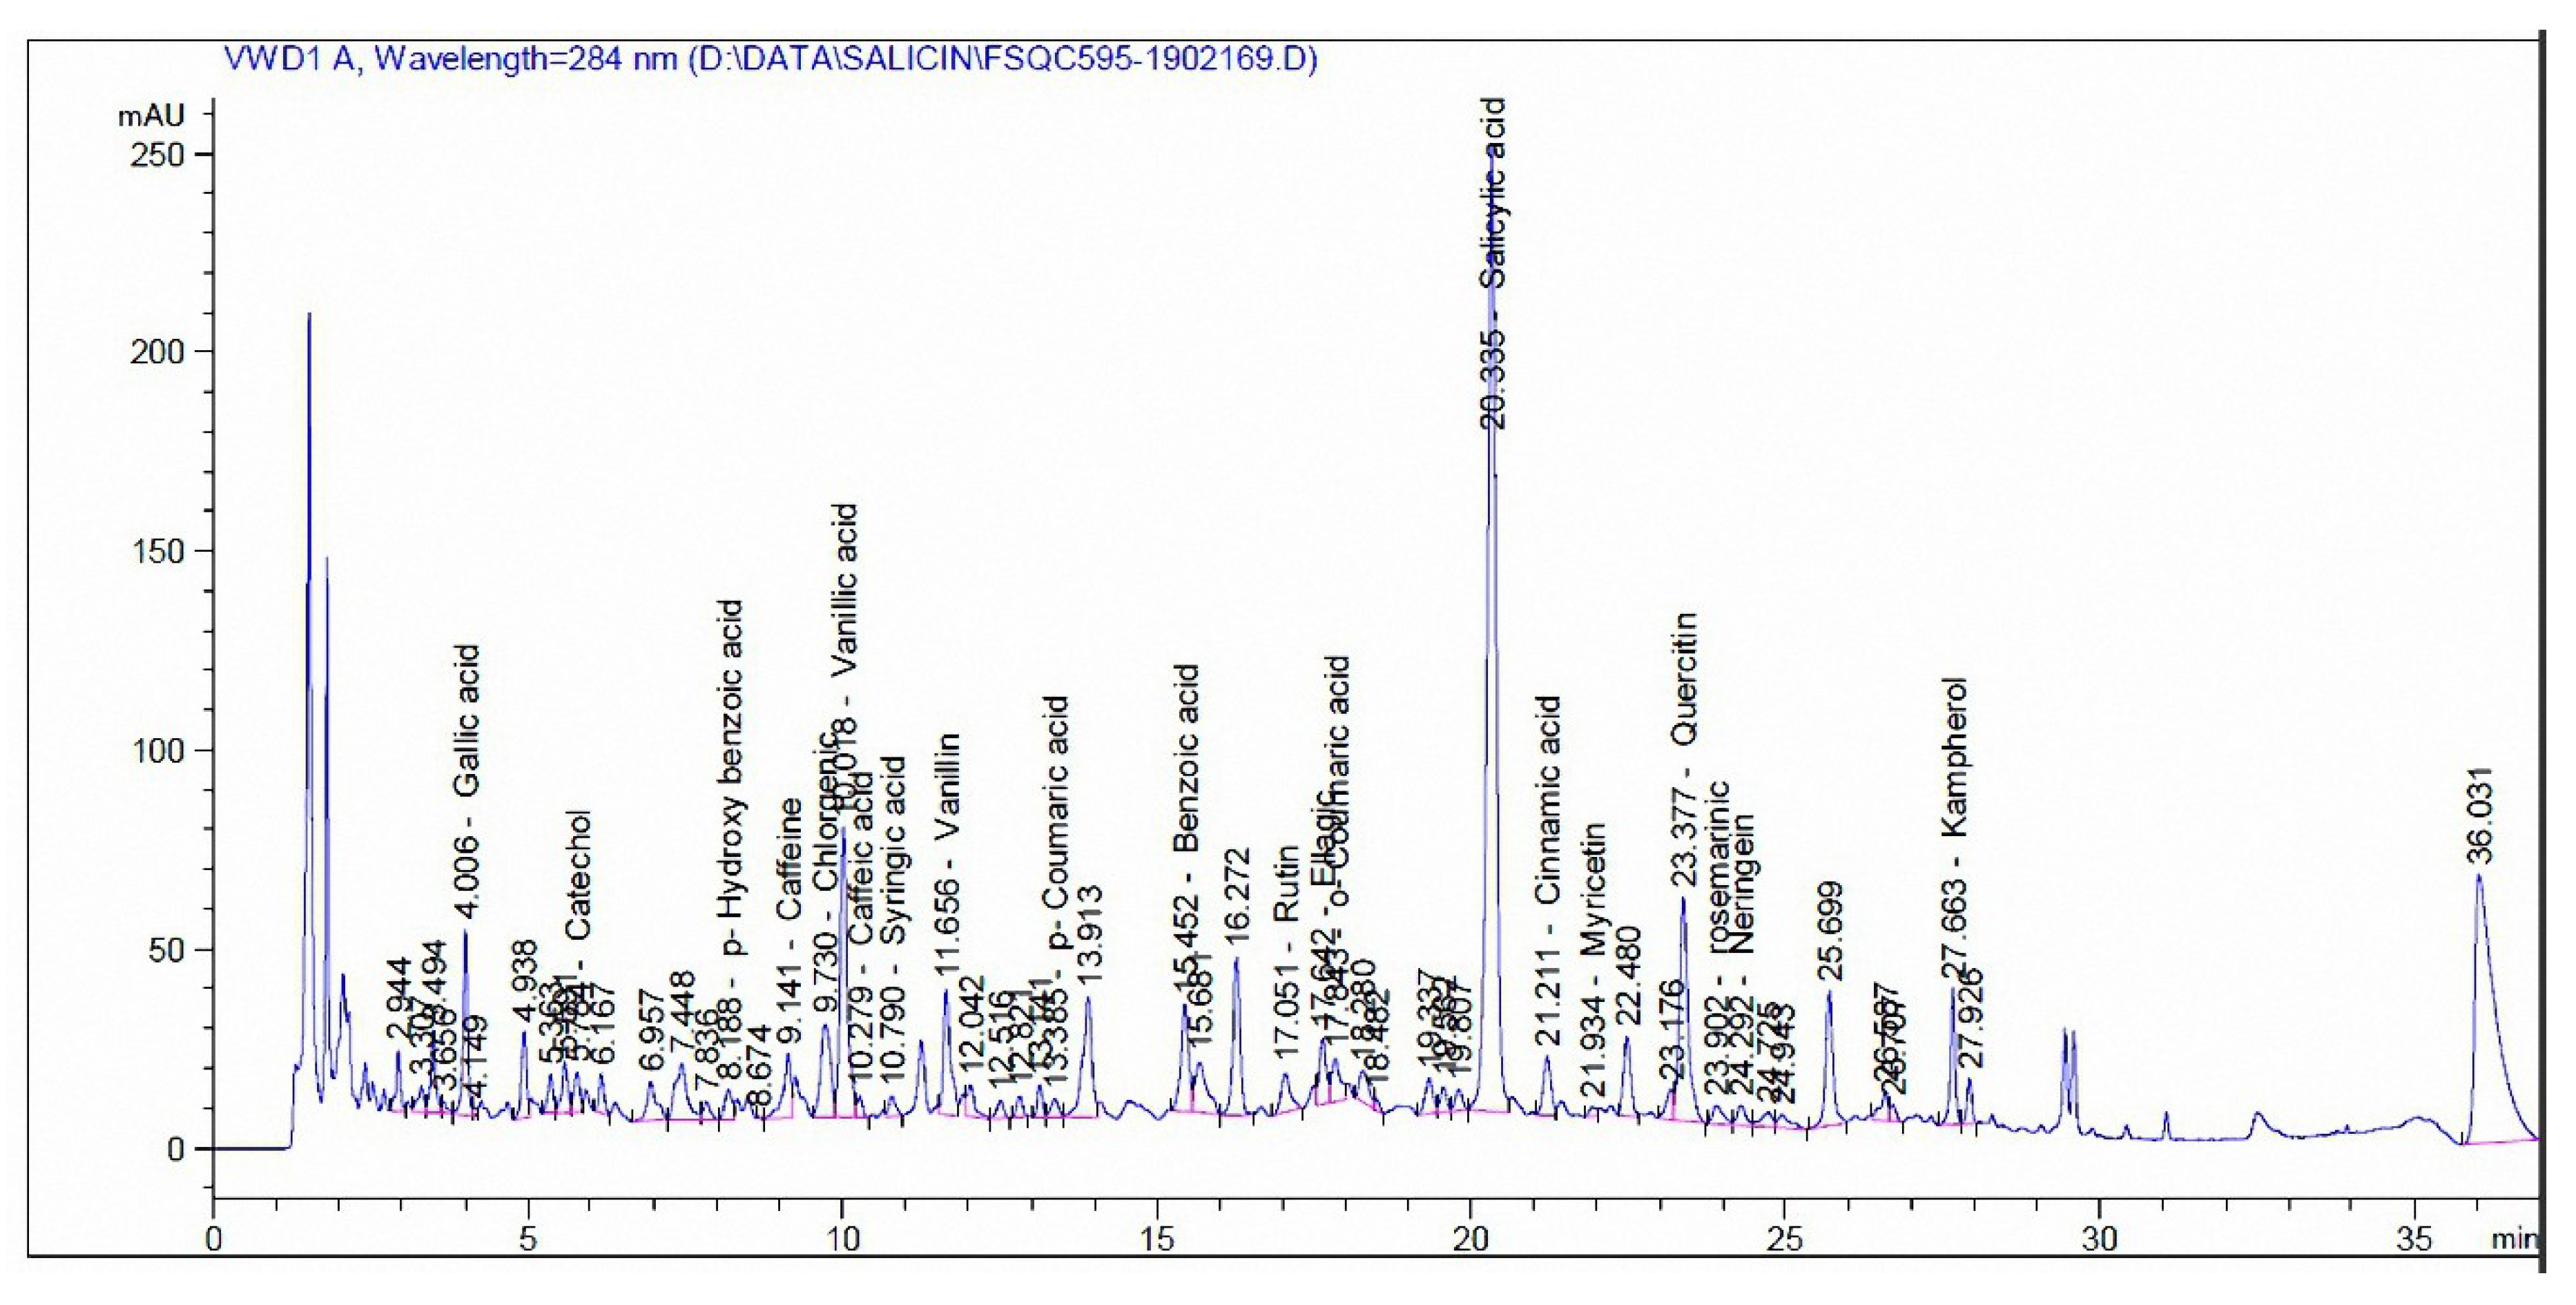
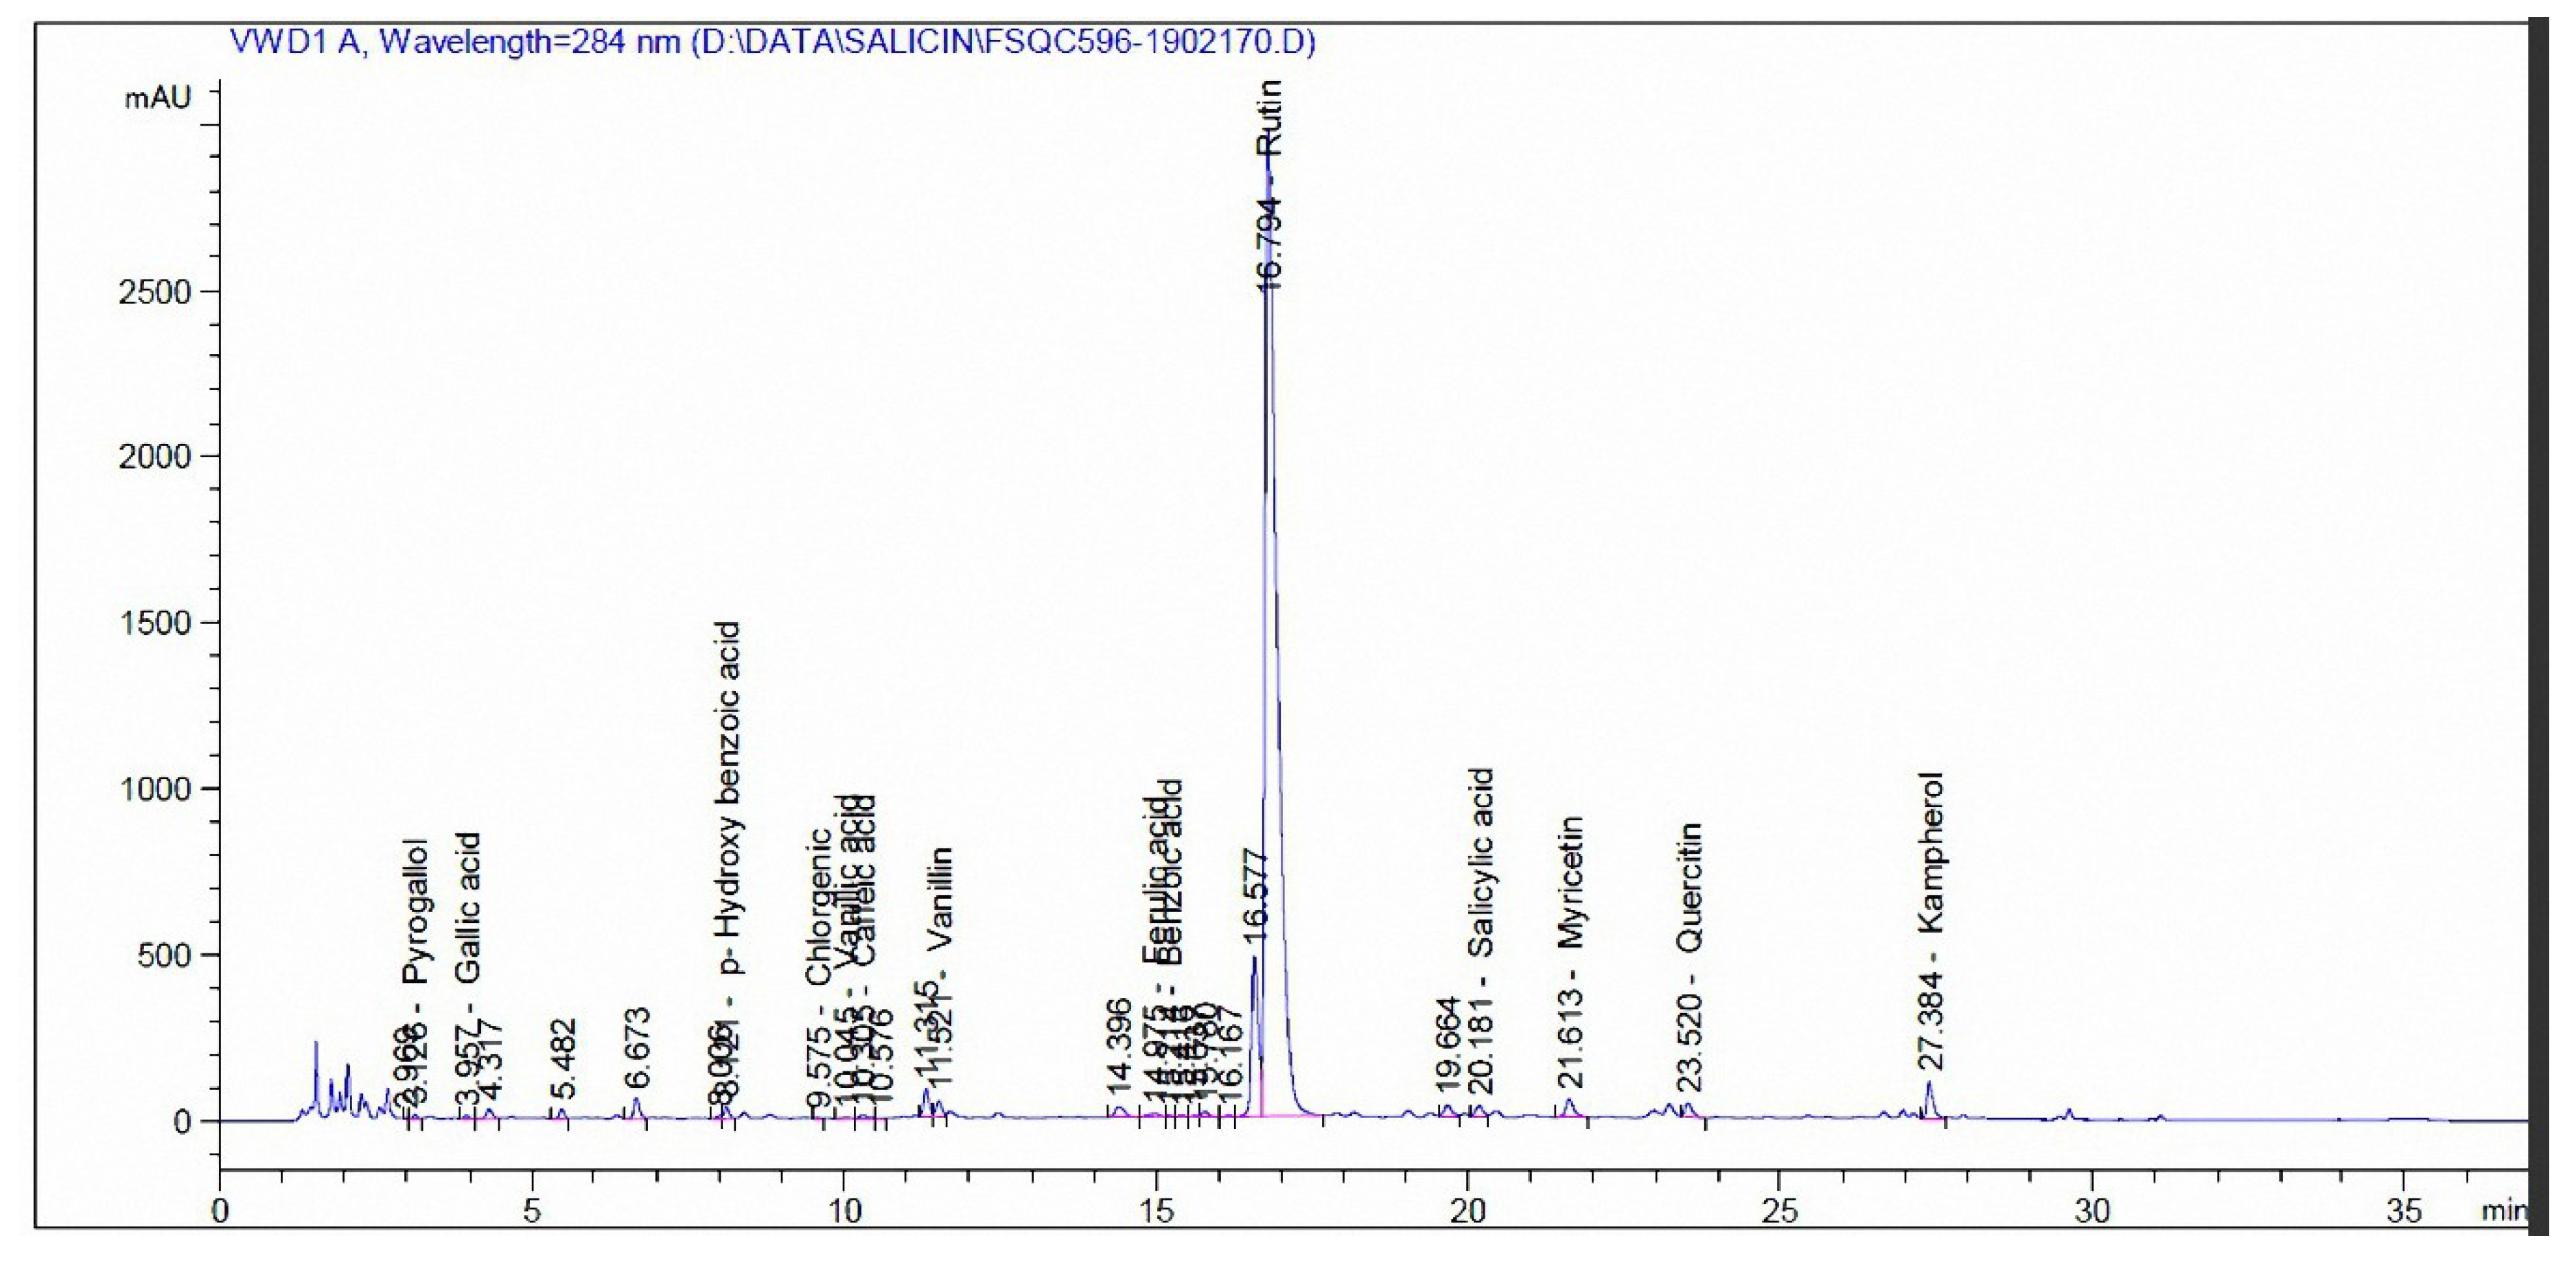
3.3. Phenolic and Flavonoid Compounds by HPLC Analysis

HPLC analysis (Figure 6) of root extract from madder shows the presence of salicylic acid, quercetin, ellagic and benzoic acid as main compounds with amounts of 1758.91, 844.23, 784.86 and 582.68 mg/kg extract, respectively (Table 4). HPLC in Figure 7 shows the analysis of extract of cochineal with the presence of large amounts of compounds with 37732, 915.98, 809.97, 496.76 and 193.87 mg/kg extract which correspond, respectively to rutin, kampherol, myricetin, quercetin and salicylic acid (Table 4).

4. Discussion

4.1. Chemical Structures of Different Natural Dyes and Their Properties

The four fabrics (cotton, linen, wool, and silk) were dyed with 14 natural dyes. Carminic acid is the main cochineal pigment with good light stability and its color varies from orange to red depending on the pH [50,51]. The constituents of madder are anthraquinone compounds containing hydroxyl auxochromic groups that are able to form complex compounds with the metal ions [52,53].
Annatto (carotenoid pigments) is found in the reddish waxy coating of the seeds of B. orellana. The yellow color of annatto comes from the norbixin component, while a more-orange shade comes from bixin compounds [54,55,56].
Sumac contains proteins, minerals, vitamins, unsaturated fatty acids, tannins, flavonoids, anthocyanins, organic acids, flavones, volatile oils, nitrates, and nitrites; some of them are useful as antimicrobial agents [57,58,59,60]. Various phenol acids and flavonoids, such as methyl gallate, kaempferol, hydrolysable tannins, quercetin, and gallic acid with potent antioxidant properties [61,62] were identified in sumac.
Peel of pomegranate contains high amounts of polyphenol compounds such as gallocatechins, tannins, prodelphinidins and catechins with antibacterial finishing of cotton fabric [63,64]. Recently, acetone extract of Punica granatum air-dried peels showed weak activity as antifungal agent against Fusarium oxysporum, Rhizoctonia solani, and Alternaria solani, and against mosquito larvae (Culex pipiens) [65].
Catechol and catechin are the chemical compounds of catechu pigment with yellow-brown color that are used for dyeing and tanning of cotton, wool, and silk [66]. Non-mordanted or mordanted dyed woolen fabrics using cutch showed a promising antimicrobial bioactive agent for textile fabrics [67,68].
Onion peel extract with reddish brown color is rich in flavonoids (flavones, flavonols, quercetin, kaempferol), polyphenols, and anthocyanidins, where anthocyanins are mainly cyanidin glucosides acylated with malonic acid [69,70].

4.2. Effects of Enzyme

Pretreatment with enzymes such as protease, α-amylase, lipase, and diasterase is done primarily for better absorbency, adherence, and dyeability of dyes from Acacia catechu and Tectona grandis on cotton fabric, which led to complete replacement of metal mordants with enzymes for adherence of natural dyes to cotton [71]. Protease–amylase, diasterase, and lipase enzyme treatment gave cotton and silk fabrics rapid dye absorption kinetics and total higher absorption than untreated samples with dyes from Terminalia arjuna, Punica granatum, and Rheum emodi [72].
Previous studies showed that there are slight changes in the color of treated uncolored linen and cotton fabrics dyed with madder or turmeric after enzyme protease treatment in different concentrations [19].
The color strength of woolen fabrics dyed with extract of pomegranate rind is higher than that of its raw dyestuff in different concentrations [73]. Color strength in terms of the chroma of wool dyed with Canadian goldenrod and pomegranate peel was enhanced [74]. According to K/S values, premordanted wool fabrics dyed with madder had good color strength compared with other dyes [75].
The color strength with dyes in each of the four types of fiber (wool, silk, linen, and cotton) was not similar, but madder and cochineal exhibited stronger dyeing shades on the four fibers. The structure of both of these includes many hydroxyl groups, e.g., alizarin, purpurin, and dihydroxyanthraquinones, resulting in adsorption of both dyes onto the four types of fiber through bonding, H-bonding, dispersion forces, and polar van der Waals forces of interaction.
Some studies have reported that total phenolic content does not adsorb on textile fibers and thus is not useful in textile dyes [76,77]. On the other hand, pelargonidin (3,5,7,4-tetrahydroxyanthocyanidin) dyes from outer onion skins work like acid dyes that can dye protein fibers with high efficiency and exhibit good properties for the dyeing of natural fibers [78,79,80]. The coloring in sumac is derived from hydrolysable tannins, which under acid hydrolysis conditions yield gallic acid and glucose [81]. The dyeing of silk and wool with pomegranate solution is found to be effectively accomplished at pH 4.0 [82,83]. For conservation purposes and according to Agnes and Eastop [18], the isoelectric region of protein materials is considered to be at pH 5–7. Therefore, pancreatin enzyme is relatively safe for use in textile conservation.
From our results and the data reported from the literature, it is easier to dye protein fibers than cellulosic fibers with natural dyes, and there is more coherence with protein fibers than cellulosic fibers; also, there is low bleeding of natural dyed samples treated with enzyme concentrations and buffer solution. The ancient Egyptians learned that wool is more receptive to natural dyes. Therefore, they wove decorative fabrics with dyed wool fibers and the rest with linen fibers. This has been found in most ancient Egyptian textiles in museums. This practice was not limited to ancient Egyptian textiles, but also occurred in Egyptian textiles in the Greco-Roman era as well as in Coptic and Islamic textiles.

5. Conclusions

In the present study, each of the studied natural dyes has individual behavior in treatment solutions, which differs according to the kind of dyed fabric (linen, cotton, wool, or silk). Changes in relative color strength and total color difference (ΔE) are largely convergent within the framework of one textile fabric treated with the first and second concentrations of enzyme or buffer solution. The changes (ΔE) are due to the buffer solution, not to the pancreatin enzyme. Low bleeding of natural dyes used in this study is due to the pH value of buffer enzyme solution used (pH 7.8), approaching the isoelectric point of textile fiber. Additionally, it was clear that protein fibers had greater affinity than cellulosic fibers to natural dyes. The data generated from these studies may help in designing a basis for the utilization of bioresources and pancreatin enzyme in the conservation of works of art. The highest TCD values were found in the treated linen fiber with buffer, pancreatin enzyme A and B dyed with catechu tree. The analysis of root extract from madder by HPLC observed the presence of salicylic acid, quercetin, ellagic and benzoic acid as main compounds, while in cochineal extract the components included rutin, kampherol, myricetin, quercetin and salicylic acid.

Author Contributions

M.Z.M.S., I.H.M.I. and H.M.H. designed the experiments, wrote parts of the manuscript, conducted laboratory analyses, and interpreted the results; H.M.A. revised the article; all coauthors are contributed in writing and revising the article. All authors have read and agreed to the published version of the manuscript.

Funding

This research was funded by Researchers Supporting Project number (RSP-2019/123) King Saud University, Riyadh, Saudi Arabia.

Acknowledgments

Researchers Supporting Project number (RSP-2019/123) King Saud University, Riyadh, Saudi Arabia.

Conflicts of Interest

The authors declare no conflict of interest.

References

  1. Negi, J.S.; Singh, P.; Pant, G.J.N.; Rawat, M.S.M. High-performance liquid chromatography analysis of plant saponins: An update 2005–2010. Pharmacogn. Rev. 2011, 5, 155–158. [Google Scholar] [CrossRef] [Green Version]
  2. Spáčil, Z.; Nováková, L.; Solich, P. Analysis of phenolic compounds by high performance liquid chromatography and ultra performance liquid chromatography. Talanta 2008, 76, 189–199. [Google Scholar] [CrossRef]
  3. Johansen, K.T.; Ebild, S.J.; Christensen, S.B.; Godejohann, M.; Jaroszewski, J.W. Alkaloid analysis by high-performance liquid chromatography-solid phase extraction-nuclear magnetic resonance: New strategies going beyond the standard. J. Chromatogr. A 2012, 1270, 171–177. [Google Scholar] [CrossRef]
  4. Chen, Y.; Zhang, Z.; Zhang, Y.; Zhang, X.; Zhang, Z.; Liao, Y.; Zhang, B. A new method for simultaneous determination of phenolic acids, alkaloids and limonoids in Phellodendri Amurensis Cortex. Molecules 2019, 24, 709. [Google Scholar] [CrossRef] [Green Version]
  5. Sid, N.; EL-Hawary, S. High-Performance Natural Dyes for Cellulosic Fibers: Review—part 1. J. Text. Color. Polym. Sci. 2019, 16, 21–33. [Google Scholar]
  6. Kim, S.; Moldes, D.; Cavaco-Paulo, A. Laccases for enzymatic colouration of unbleached cotton. Enzy. Microb. Technol. 2007, 40, 1788–1793. [Google Scholar] [CrossRef] [Green Version]
  7. Mojsov, K. Application of enzymes in the textile industry: A review. In Proceedings of the II International Congress “Engineering, Ecology and Materials in the Processing Industry”, Jahorina, Bosnia and Hercegovina, 9–11 March 2011; pp. 1–17. [Google Scholar]
  8. Kim, H.R.; Seo, H.Y. Enzymatic hydrolysis of polyamide fabric by using acylase. Text. Res. J. 2013, 83, 1181–1189. [Google Scholar] [CrossRef]
  9. Shim, E.J.; Lee, S.H.; Song, W.S.; Kim, H.R. Development of an enzyme-immobilized support using a polyester woven fabric. Text. Res. J. 2017, 87, 3–14. [Google Scholar] [CrossRef]
  10. Wang, F.; Gong, J.; Zhang, X.; Ren, Y.; Zhang, J. Preparation of biocolorant and eco-dyeing derived from polyphenols based on laccase-catalyzed oxidative polymerization. Polymers 2018, 10, 19. [Google Scholar] [CrossRef] [Green Version]
  11. Quandt, C.; Kuhl, B. Enzymatic processes: Operational possibilities and optimization (Enzymes Possibilités et perspectives). L’Industrie Tex. 2001, 1334–1335, 116–119. [Google Scholar]
  12. Korf, U.; Kohl, T.; van der Zandt, H.; Zahn, R.; Schleeger, S.; Ueberle, B.; Wandschneider, S.; Bechtel, S.; Schnolzer, M.; Ottleben, H.; et al. Large-scale protein expression for proteome research. Proteomics 2005, 5, 3571–3580. [Google Scholar] [CrossRef] [PubMed]
  13. Li, P.; Anumanthan, A.; Gao, X.G.; Ilangovan, K.; Suzara, V.V.; Düzgünes, N.; Renugopalakrishnan, V. Expression of recombinant proteins in Pichia pastoris. Appl. Biochem. Biotechnol. 2007, 142, 105–124. [Google Scholar] [CrossRef] [PubMed]
  14. Lenting, H.B.M. Enzymes in textile production. In Enzymes in Industry, Production and Applications, 3rd ed.; Aehle, W., Ed.; Wiley-VCH Verlag GmbH & Co: Weinheim, Germany, 2007; pp. 218–230. [Google Scholar]
  15. Ahmed, H.E.; Kolisis, F.N. An investigation into the removal of starch paste adhesives from historical textiles by using the enzyme α-amylase. J. Cult. Herit. 2011, 12, 169–179. [Google Scholar] [CrossRef]
  16. Chand, N.; Nateri, A.S.; Sajedi, R.H.; Mahdavi, A.; Rassa, M. Enzymatic desizing of cotton fabric using a Ca2+-independent α-amylase with acidic pH profile. J. Mol. Catal. B Enzym. 2012, 83, 46–50. [Google Scholar] [CrossRef]
  17. Araújo, R.; Casal, M.; Cavaco-Paulo, A. Application of enzymes for textile fibres processing. Biocatal. Biotransform. 2008, 26, 332–349. [Google Scholar] [CrossRef] [Green Version]
  18. Agnes, T.B.; Eastop, D. Chemical Principles of Textile Conservation, 1st ed.; Butterworth, Heinemann: London, UK, 1998. [Google Scholar]
  19. Ahmed, H.E. Protease enzyme used for artificial ageing on modern cotton fabric for historic textile preservation and restoration. Int. J. Conserv. Sci. 2013, 4, 177–188. [Google Scholar]
  20. Ibrahim, N.A.; El-Gamal, A.R.; Gouda, M.; Mahrous, F. A new approach for natural dyeing and functional finishing of cotton cellulose. Carbohydr. Polym. 2010, 82, 1205–1211. [Google Scholar] [CrossRef]
  21. El-Hennawi, H.M.; Ahmed, K.A.; Abd El-Thalouth, I. A novel bio-technique using laccase enzyme in textile printing to fix natural dyes. Ind. J. Fibre Text. Res. 2012, 37, 245–249. [Google Scholar]
  22. Bettiol, J.L.P.; Showell, M.S. Detergent Compositions Comprising a Mannanase and a Protease. Patent WO 99/009128, 25 February 1999. [Google Scholar]
  23. Nechwatal, A.; Blokesch, A.; Nicolai, M.; Krieg, M.; Kolbe, A.; Wolf, M.; Gerhardt, M. A contribution to the investigation of enzyme-catalysed hydrolysis of poly(ethylene eterephthalate) oligomers. Macromol. Mater. Eng. 2006, 291, 1486–1494. [Google Scholar] [CrossRef]
  24. Maurer, K.H. Detergent proteases. Curr. Opin. Biotechnol. 2004, 5, 330–334. [Google Scholar] [CrossRef]
  25. Nakajima, K.; Oshida, H.; Muneyuki, T.; Kakei, M. Pancrelipase: An evidence-based review of its use for treating pancreatic exocrine insufficiency. Core Evid. 2012, 7, 77–91. [Google Scholar] [CrossRef] [PubMed] [Green Version]
  26. DeLano, F.A.; Hoyt, D.B.; Schmid-Schönbein, G.W. Pancreatic digestive enzyme blockade in the intestine increases survival after experimental shock. Sci. Transl. Med. 2013, 5, 169ra11. [Google Scholar] [CrossRef] [PubMed] [Green Version]
  27. Adeel, S.; Ali, S.; Bhatti, I.A.; Zsila, F. Dyeing of cotton fabric using pomegranate (Punica granatum) Aqueous Extract. Asian J. Chem. 2009, 21, 3493–3499. [Google Scholar]
  28. Kalimuthu, J.; Sekar, M.; Subramanian, R.; Shanmugam, K. Natural dyeing process for recycled paper from the waste vegetables. Int. J. ChemTech Res. 2016, 9, 151–157. [Google Scholar]
  29. Dapson, R.W.; Frank, M.; Penney, D.P.; Kiernan, J.A. Revised procedures for the certification of carmine (C.I. 75470, Natural red 4) as a biological stain. Biotech. Histochem. 2007, 82, 13–15. [Google Scholar] [CrossRef]
  30. Greenhawt, M.; McMorris, M.; Baldwin, J. Carmine hypersensitivity masquerading as azithromycin hypersensitivity. Allergy Asthma Proc. 2009, 30, 95–101. [Google Scholar] [CrossRef]
  31. Gawish, S.M.; Farouk, R.; Ramadn, A.M.; Mashaly, H.M.; Helmy, H.M. Eco-friendly multifunctional properties of cochineal and weld for simultaneous dyeing and finishing of proteinic fabrics. Int. J. Eng. Technol. 2016, 8, 2246–2253. [Google Scholar]
  32. Derksen, G.C.H. Red, Redder, Madder. Analysis and Isolation of Anthraquinones from Madder Roots (Rubia tinctorum). Ph.D. Thesis, Wageningen Universiteit, Wageningen, The Netherlands, 2001. [Google Scholar]
  33. Marczylo, T.; Arimoto-Kobayashi, S.; Hayatsu, H. Protection against Trp-p-2 mutagenicity by purpurin: Mechanism of in vitro antimutagenesis. Mutagenesis 2000, 15, 223–228. [Google Scholar] [CrossRef] [Green Version]
  34. Westendorf, J.; Pfau, W.; Schulte, A. Carcinogenicity and DNA adduct formation observed in ACI rats after long-term treatment with madder root, Rubia tinctorum L. Carcinogenesis 1998, 19, 2163–2168. [Google Scholar] [CrossRef] [Green Version]
  35. Li, X.; Liu, Z.; Chen, Y.; Wang, L.J.; Zheng, Y.N.; Sun, G.Z.; Ruan, C.C. Rubiacordone A: A New Anthraquinone Glycoside from the Roots of Rubia cordifolia. Molecules 2009, 14, 566–572. [Google Scholar] [CrossRef]
  36. Wang, S.; Zhu, F. Chemical composition and biological activity of staghorn sumac (Rhus typhina). Food Chem. 2017, 237, 431–443. [Google Scholar] [CrossRef] [PubMed]
  37. Zarkogianni, M.; Mikropoulou, E.; Varella, E.; Tsatsaroni, E. Colour and fastness of natural dyes: Revival of traditional dyeing techniques. Color Technol. 2011, 127, 18–27. [Google Scholar] [CrossRef]
  38. Bechtold, T.; Mussak, R. Handbook of Natural Colorants; Wiley: Chichester, UK, 2009. [Google Scholar]
  39. Hussein, A.; Elhassaneen, Y. Natural dye from red onion skins and applied in dyeing cotton fabrics for the production of women’s headwear resistance to ultraviolet radiation (UVR). J. Am. Sci. 2014, 10, 129–139. [Google Scholar]
  40. Oancea, S.; Draghici, O. pH and thermal stability of anthocyanin-based optimised extracts of romanian red onion cultivars. Czech J. Food Sci. 2013, 31, 283–291. [Google Scholar] [CrossRef] [Green Version]
  41. Landi, S. The Textile Conservators Manual, 1st ed.; Butterworth: London, UK, 1985. [Google Scholar]
  42. Kamel, M.M.; Helmy, H.M.; Shakour, A.A.; Rashed, S.S. The Effects of Industrial Environment on Colour Fastness to Light of Mordanted Wool Yarns Dyed with Natural Dyes. Res. J. Text. Appar. 2012, 16, 46–57. [Google Scholar] [CrossRef]
  43. Hamed, I.; Zidan, Y.; Saber, N.; Ahmed, H. Effect of pepsin and trypsin enzymes used in textile conservation on natural dyed textiles samples. J. Home Econ. 2015, 25, 237–247. [Google Scholar]
  44. Helmy, H.M.; Kamel, M.M.; Hagag, K.; El-Hawary, N.; El-shemy, N.S. Antimicrobial activity of dyed wool fabrics with peanut red skin extract using different heating techniques. Egyp. J. Chem. 2017, 60, 103–116. [Google Scholar] [CrossRef] [Green Version]
  45. Kubelka, P. New contributions to the optics of intensely light-scattering materials Part II: Nonhomogeneous layers. J. Opt. Soc. Am. 1954, 44, 330–335. [Google Scholar] [CrossRef]
  46. Salem, M.Z.M.; Mansour, M.M.A.; Elansary, H.O. Evaluation of the effect of inner and outer bark extracts of Sugar Maple (Acer saccharum var. saccharum) in combination with citric acid against the growth of three common molds. J. Wood Chem. Technol. 2019, 39, 136–147. [Google Scholar] [CrossRef]
  47. Al-Huqail, A.A.; Behiry, S.I.; Salem, M.Z.M.; Ali, H.M.; Siddiqui, M.H.; Salem, A.Z.M. Antifungal, antibacterial, and antioxidant activities of Acacia saligna (Labill.) H. L. Wendl. flower extract: HPLC analysis of phenolic and flavonoid compounds. Molecules 2019, 24, 700. [Google Scholar] [CrossRef] [Green Version]
  48. Behiry, S.I.; Okla, M.K.; Alamri, S.A.; EL-Hefny, M.; Salem, M.Z.M.; Alaraidh, I.A.; Ali, H.M.; Al-Ghtani, S.M.; Monroy, J.C.; Salem, A.Z.M. Antifungal and antibacterial activities of Musa paradisiaca L. peel extract: HPLC analysis of phenolic and flavonoid contents. Processes 2019, 7, 215. [Google Scholar] [CrossRef] [Green Version]
  49. SAS. Users Guide: Statistics (Release 8.02); SAS Inst Inc: Cary, NC, USA, 2001. [Google Scholar]
  50. Lloyd, A.G. Extraction and chemistry of cochineal. Food Chem. 1980, 5, 91–107. [Google Scholar] [CrossRef]
  51. Chieli, A.; Sanyova, J.; Doherty, B.; Brunetti, B.G.; Miliani, C. Chromatographic and spectroscopic identification and recognition of ammoniacal cochineal dyes and pigments. Spectrochim. Acta A Mol. Biomol. Spectrosc. 2016, 162, 86–92. [Google Scholar] [CrossRef] [PubMed]
  52. Balazsy, A.T.; Eastop, D. Chemical Principles of Textile Conservation, 2nd ed.; Routledge Series in Conservation and Museology; Butterworth-Heinemann: Oxford, UK, 2004. [Google Scholar]
  53. Shams-Nateri, A. Reusing wastewater of madder natural dye for wool dyeing. J. Clean. Prod. 2011, 19, 775–781. [Google Scholar] [CrossRef]
  54. Samanta, A.K.; Agarwal, P. Application of natural dyes on textiles. Indian J. Fibre Text. Res. 2009, 34, 384–399. [Google Scholar]
  55. Shahid, M.; Islam, S.; Mohammad, F. Recent advancements in natural dye applications: A review. J. Clean. Prod. 2013, 53, 310–331. [Google Scholar] [CrossRef]
  56. Yusuf, M.; Ahmad, A.; Shahid, M.; Khan, M.I.; Khan, S.A.; Manzoor, N.; Mohammad, F. Assessment of colorimetric, antibacterial and antifungal properties of woolen yarn dyed with the extract of the leaves of henna (Lawsonia inermis). J. Clean. Prod. 2012, 27, 42–50. [Google Scholar] [CrossRef]
  57. Romeo, F.V.; Ballistreri, G.; Fabroni, S.; Pangallo, S.; Nicosia, M.G.; Schena, L.; Rapisarda, P. Chemical Characterization of Different Sumac and Pomegranate Extracts Effective against Botrytis cinerea Rots. Molecules 2015, 20, 11941–11958. [Google Scholar] [CrossRef] [Green Version]
  58. Kosar, M.; Bozan, B.; Temelli, F.; Baser, K.H.C. Antioxidant activity and phenolic composition of sumac (Rhus coriaria L.) extracts. Food Chem. 2007, 103, 952–959. [Google Scholar] [CrossRef]
  59. Peng, Y.; Zhang, H.; Liu, R.; Mine, Y.; McCallum, J.; Kirby, C.; Tsao, R. Antioxidant and anti-inflammatory activities of pyranoanthocyanins and other polyphenols from staghorn sumac (Rhus hirta L.) in Caco-2 cell models. J. Funct. Foods 2016, 20, 139–147. [Google Scholar] [CrossRef] [Green Version]
  60. Kossah, R.; Nsabimana, C.; Zhao, J.; Chen, H.; Tian, F.; Zhang, H.; Chen, W. Comparative study on the chemical composition of Syrian Sumac (Rhus coriaria L.) and Chinese Sumac (Rhus typhina L.) Fruits. Pak. J. Nut. 2009, 8, 1570–1574. [Google Scholar]
  61. Pourahmad, J.; Eskandari, M.R.; Shakibaei, R.; Kamalinejad, M. A search for hepatoprotective activity of aqueous extract of Rhus coriaria L. against oxidative stress cytotoxicity. Food Chem. Toxicol. 2010, 8, 854–858. [Google Scholar] [CrossRef] [PubMed]
  62. Shabana, M.M.; El Sayed, A.M.; Yousif, M.F.; El Sayed, A.M.; Sleem, A.A. Bioactive constituents from Harpephyllum caffrum Bernh and Rhus coriaria L. Pharmacogn. Mag. 2011, 7, 298–306. [Google Scholar] [PubMed] [Green Version]
  63. Satyanarayana, D.N.; Chandra, K.R. Dyeing of Cotton Cloth with Natural Dye Extracted From Pomegranate Peel and its Fastness. IJESRT 2013, 2, 2664–2669. [Google Scholar]
  64. Lee, Y.H.; Hwang, E.K.; Kim, H.D. Colorimetric Assay and Antibacterial Activity of Cotton, Silk, and Wool Fabrics Dyed with Peony, Pomegranate, Clove, Coptis chinenis and Gallnut Extracts. Materials 2009, 2, 10. [Google Scholar] [CrossRef]
  65. Hamad, Y.K.; Abobakr, Y.; Salem, M.Z.M.; Ali, H.M.; Al-Sarar, A.S.; Al-Zabib, A.A. Activity of plant extracts/essential oils against some plant pathogenic fungi and mosquitoes: GC/MS analysis of bioactive compounds. BioResources 2019, 14, 4489–4511. [Google Scholar]
  66. Gawish, S.M.; Mashaly, H.M.; Helmy, H.M.; Ramadan, A.M.; Farouk, R. Effect of Mordant on UV Protection and Antimicrobial Activity of Cotton, Wool, Silk and Nylon Fabrics Dyed with Some Natural Dyes. J. Nanomed. Nanotechnol. 2017, 8, 1. [Google Scholar] [CrossRef] [Green Version]
  67. Dumitrescu, I.; Visileanu, E.; Niculescu, M. Natural dyes obtained from plants and vegetable wastes. Colourage 2004, 51, 121–129. [Google Scholar]
  68. Bhattacharya, S.D.; Shah, A.K. Metal ion effect on dyeing of wool fabric with catechu. Color Technol. 2000, 116, 10–12. [Google Scholar] [CrossRef]
  69. Slimestad, R.; Fossen, T.; Vågen, I. Onions: A Source of Unique Dietary Flavonoids. J. Agric. Food Chem. 2007, 55, 10067–10080. [Google Scholar] [CrossRef]
  70. Arshad, M.S.; Sohaib, M.; Nadeem, M.; Saeed, F.; Imran, A.; Javed, A.; Zaid Amjad, Z.; Batool, S.M. Status and trends of nutraceuticals from onion and onion by-products: A critical review. Cogent Food Agric. 2017, 3, 1280254. [Google Scholar] [CrossRef]
  71. Vankar, P.S.; Shanker, R. Ecofriendly ultrasonic natural dyeing of cotton fabric with enzyme pretreatments. Desalination 2008, 230, 62–69. [Google Scholar] [CrossRef]
  72. Vankar, P.S.; Shanker, R.; Verma, A. Enzymatic natural dyeing of cotton and silk fabrics without metal mordants. J. Clean. Prod. 2007, 15, 1441–1450. [Google Scholar] [CrossRef]
  73. Goodarzian, H.; Ekrami, E. Wool dyeing with extracted dye from pomegranate (Punica granatum L.) peel. World App. Sci. 2010, 8, 1387–1389. [Google Scholar]
  74. Mahmud-Ali, A.; Fitz-Binder, C.; Bechtold, T. Aluminium based dye lakes from plant extracts for textile coloration. Dyes Pigments 2012, 94, 533–540. [Google Scholar] [CrossRef]
  75. Ghaheh, F.S.; Mortazavi, S.M.; Alihosseini, F.; Fassihi, A.; Nateri, A.S.; Abedi, D. Assessment of antibacterial activity of wool fabrics dyed with natural dyes. J. Clean. Prod. 2014, 72, 139–145. [Google Scholar] [CrossRef]
  76. Bechtold, T.; Mahmud-Ali, A.; Mussak, R. Natural dyes for textile dyeing e Comparison of methods to assess quality of Canadian Golden Rod plant material. Dyes Pigments 2007, 75, 287–293. [Google Scholar] [CrossRef]
  77. Leitner, P.; Fitz-Binder, C.; Mahmud-Ali, A.; Bechtold, T. Production of a concentrated natural dye from Canadian Goldenrod (Solidago Canadiensis) extracts. Dyes Pigments 2012, 93, 1416–1421. [Google Scholar] [CrossRef]
  78. Önal, A. Extraction of dyestuff from onion (Allium cepa L.) and its application in the dyeing of wool, feathered-leather and cotton. Turk. J. Chem. 1996, 20, 194–203. [Google Scholar]
  79. Tera, F.M.; Elnagar, K.E.; Mohamed, S.M. Dyeing and light fastness properties of onion scale dye on different fabric types for conservative applications. J. Tex. Appar. Technol. Manag. 2012, 7, 1–6. [Google Scholar]
  80. Chandravanshi, S.; Upadhyay, S.K. Interaction of natural dye (Allium cepa) with ionic surfactants. J. Chem. 2012, 2013, 685679. [Google Scholar] [CrossRef]
  81. Ferreira, E.S.B.; Hulme, A.N.; McNab, H.; Quye, A. The natural constituents of historical textile dyes. Chem. Soc. Rev. 2004, 33, 329–336. [Google Scholar] [CrossRef] [PubMed]
  82. Vankar, P.S.; Shanker, R. Dyeing of cotton, wool and silk with extract of Allium cepa. Pigm. Resin Technol. 2009, 38, 242–247. [Google Scholar] [CrossRef]
  83. Das, D.; Maulik, S.R. Dyeing of wool and silk with Punica granatum. Indian J. Fibre Text. 2006, 31, 559–564. [Google Scholar]
Figure 1. Experimental dyeing of textiles with different natural dyes: (A) madder, (B) common hops, (C) bloodroot, (D) onion skin, (E) pomegranate skin, (F) catechu tree, (G) common juniper tree, (H) sumac, (I) Egyptian acacia, (J) goldenrod, (K) annatto, (L) common sage, (M) dog’s fennel, (N) cochineal.
Processes 08 00059 g001aProcesses 08 00059 g001b
Figure 2. Bleeding of applied natural dyes by: (a) pancreatin enzyme concentration A, (b) concentration B, and (c) buffer solution with pH 7.8. Dyes derived from: (1) Dactylopius coccus, (2) Rubia tinctoriun, (3) Acacia catechu, (4) Bixa orellana, (5) Allium cepa, (6) Anthemis cotula, (7) Rhus coriaria, (8) Potentilla erecta, (9) Salvia officinalis, (10) Acacia arabica, (11) Punica granatum, (12) Bongardia chrysogonum, (13) Humulus lupulus, (14) Juniperus communis.
Processes 08 00059 g002
Figure 3. Effects of interactions between enzyme concentration and dye type on: (a) relative color strength (RCS), and (b) total color difference (TCD). A: enzyme concentration; B, dye type.
Processes 08 00059 g003
Figure 4. Effects of interactions between enzyme concentration and fiber type on: (a) RCS, and (b) TCD. A: enzyme concentration; C, fiber type.
Processes 08 00059 g004
Figure 5. Effects of interactions between dye type and fiber type on: (a) RCS, and (b) TCD.
Processes 08 00059 g005
Figure 6. HPLC chromatogram for Madder (Rubia cordifolia).
Processes 08 00059 g006
Figure 7. HPLC chromatogram for cochineal.
Processes 08 00059 g007
Table 1. Characteristics of the four different dyed fabrics.
Fiber Weave StructureBasic Weight (g/m2)WeftsWarpsTensile Strength (kg/Strength)Elongation (%)
LinenPlain weave113131756.56.9
CottonPlain weave179252566.919.9
WoolPlain weave148232313.912.6
SilkPlain weave143242533.714.9
Table 2. Significant effects of pancreatin enzyme concentration, dye type, and fiber type on relative color strength (%) and total color difference of naturally dyed fabrics.
Source of VarianceDFSums of SquaresMean SquareF ValuePr > F
A282.1141941.057103.280.0390
B1390,562.1696966.32555.94<0.0001
C324,577.0078192.335653.78<0.0001
A × B261387.20553.3544.26<0.0001
A × C690.78515.1311.210.3018
B × C3934,035.76872.71169.65<0.0001
A × B × C782308.2329.5922.36<0.0001
Error3364210.2912.531
Corrected Total503157,253.569
A: Enzyme concentration; B: dye type; C: fiber type; DF: degrees of freedom; Pr: probability.
Table 3. Interaction effects of enzyme and dyes with fibers on relative color strength (%) and total color difference.
Enzyme SolutionDyeRelative Color Strength (%)Total Color Difference (ΔE)
LinenCottonSilkWoolLinenCottonSilkWool
Buffer solutionAnnatto118.56 ± 4.31117.20 ± 4.41110.60 ± 2.26103.33 ± 2.513.03 ± 0.052.76 ± 0.321.16 ± 0.311.13 ± 0.15
Bloodroot103.36 ± 6.29110.60 ± 1.73125.56 ± 6.83118.76 ± 5.412.96 ± 0.413.36 ± 0.662.83 ± 0.212.3 ± 0.20
Catechu tree91.80 ± 5.54109.03 ± 4.75103.56 ± 2.43128.73 ± 4.976.83 ± 0.735.33 ± 0.252.36 ± 0.405.40 ± 0.36
Cochineal74.13 ± 4.3983.16 ± 0.8593.90 ± 1.81100.06 ± 0.954.00 ± 0.104.83 ± 0.153.73 ± 0.152.86 ± 0.15
Common juniper85.53 ± 4.8089.90 ± 0.0071.60 ± 0.00109.90 ± 2.762.16 ± 0.372.16 ± 0.353.06 ± 0.210.96 ± 0.15
Common sage68.86 ± 0.2184.43 ± 1.1383.06 ± 2.90120.63 ± 2.043.30 ± 0.22.46 ± 0.151.66 ± 0.151.20 ±0.1
Common hops92.46 ± 4.9889.70 ± 4.6174.3 ± 1.65101.16 ± 3.003.60 ±0.452.86 ±0.054.86 ±0.561.26 ± 0.15
Dog’s fennel79.50 ± 2.6168.63 ± 4.5370.53 ± 1.4089.16 ± 3.013.00 ± 0.102.90 ± 0.102.60 ± 0.200.67 ± 0.04
Egyptian acacia120.46 ± 1.51117.23 ± 3.42122.66 ± 6.95119.53 ± 2.111.76 ± 0.152.16 ± 0.251.53 ± 0.152.36 ± 0.56
Goldenrod77.83 ± 3.6180.26 ± 1.9084.86 ± 1.26110.86 ± 2.072.46 ± 0.312.33 ± 0.252.03 ± 0.151.00 ± 0.10
Madder86.16 ± 5.5798.53 ± 1.3383.70 ± 3.0499.20 ± 1.051.70 ± 0.261.23 ± 0.052.23 ± 0.112.96 ± 0.81
Onion skin68.40 ± 1.7674.80 ± 4.5196.46 ± 3.2889.76 ± 1.884.76 ± 0.654.33 ± 0.555.93 ± 0.812.36 ± 0.15
Pomegranate skin111.03 ± 2.43107.66 ± 2.87110.26 ± 3.05129.13 ± 3.331.73 ± 0.251.05 ± 0.171.06 ± 0.152.50 ± 0.10
Sumac109.86 ± 1.55115.03 ± 1.65109.26 ± 2.65126.53 ± 1.982.26 ± 0.411.36 ± 0.312.70 ± 0.103.00 ± 0.20
Enzyme concentration AAnnatto109.16 ± 8.06112.66 ± 1.98112.66 ± 7.0396.83 ± 6.033.30 ± 0.552.90 ± 0.361.36 ± 0.211.06 ± 0.15
Bloodroot99.20 ± 4.64111.83 ± 4.14129.73 ± 9.37119.60 ± 2.042.83 ± 0.152.90 ± 0.403.20 ± 0.102.170 ± 0.24
Catechu tree86.93 ± 2.28111.53 ± 2.47107.16 ± 2.44117.30 ± 3.575.70 ± 0.264.53 ± 0.371.90 ± 0.204.63 ± 0.37
Cochineal81.66 ± 5.1586.13 ± 2.6293.83 ± 4.14102.16 ± 3.353.23 ± 0.733.93 ± 0.153.40 ± 0.431.94 ± 0.05
Common juniper93.60 ± 3.6790.96 ± 1.5166.56 ± 4.16112.86 ± 1.811.93 ± 0.351.70 ± 0.203.46 ± 0.411.15 ± 0.18
Common sage70.40 ± 0.6577.40 ± 4.0180.30 ± 0.81118.76 ± 1.812.80 ± 0.262.63 ± 0.212.23 ± 0.151.20 ± 0.20
Common hops89.00 ± 2.9185.73 ± 1.1972.90 ± 2.70101.63 ± 4.233.93 ± 0.562.80 ± 0.304.20 ± 0.791.73 ± 0.35
Dog’s fennel84.43 ± 5.3573.56 ± 1.5575.60 ± 3.9991.50 ± 2.162.56 ± 0.152.73 ± 0.152.39 ± 0.100.61 ± 0.10
Egyptian acacia123.33 ± 2.00107.63 ± 1.96116.33 ± 1.75114.03 ± 2.211.90 ± 0.201.93 ± 0.151.33 ± 0.151.53 ± 0.31
Goldenrod80.16 ± 1.0579.16 ± 1.8586.83 ± 2.57117.93 ± 2.431.83 ± 0.212.36 ± 0.151.63 ± 0.211.03 ± 0.15
Madder98.43 ± 3.68101.03 ± 2.2182.30 ± 5.0896.20 ± 5.121.33 ± 0.051.26 ± 0.052.25 ± 0.133.13 ± 0.60
Onion skin72.20 ± 2.1280.20 ± 5.75104.60 ± 6.1394.73 ± 1.764.06 ± 0.154.10 ± 0.105.66 ± 0.322.20 ± 0.36
Pomegranate skin117.76 ± 1.89117.23 ± 3.67110.36 ± 5.71137.23 ± 3.741.93 ± 0.151.08 ± 0.121.66 ± 0.663.00 ± 0.10
Sumac110.4 ± 3.70119.26 ± 3.05107.53 ± 3.05128.00 ± 2.161.83 ± 0.251.03 ± 0.152.56 ± 0.053.40 ± 0.26
Enzyme concentration BAnnatto114.86 ± 4.41109.60 ± 5.40107.23 ± 4.17109.86 ± 4.22.86 ± 0.251.96 ± 0.811.30 ± 0.401.43 ± 0.32
Bloodroot99.80 ± 1.37106.73 ± 3.45132.20 ± 3.65115.53 ± 2.203.33 ± 0.212.90 ± 0.402.90 ± 0.202.00 ± 0.36
Catechu tree88.5 ± 4.20107.03 ± 2.71104.16 ± 2.95126.5 ± 4.306.30 ± 0.264.53 ± 0.551.90 ± 0.454.93 ± 0.25
Cochineal76.00 ± 1.3780.73 ± 0.4587.03 ± 5.5694.20 ± 4.843.56 ± 0.154.46 ± 0.254.23 ± 0.512.30 ± 0.26
Common juniper88.33 ± 2.4589.70 ± 0.9568.73 ± 3.76111.96 ± 4.212.10 ± 0.301.66 ± 0.313.23 ± 0.250.90 ± 0.10
Common sage69.16 ± 1.0087.33 ± 4.2177.00 ± 3.08114.43 ± 2.323.43 ± 0.252.26 ± 0.211.36 ± 0.150.95 ± 0.13
Common hops90.93 ± 1.6180.96 ± 3.0270.03 ± 3.86106.30 ± 3.803.46 ± 0.503.13 ± 0.154.56 ± 0.451.33 ± 0.15
Dog’s fennel78.430 ± 2.9275.20 ± 3.4872.16 ± 1.7692.56 ± 2.892.73 ± 0.212.53 ± 0.252.50 ± 0.100.68 ± 0.02
Egyptian acacia116.63 ± 2.46114.16 ± 2.43121.06 ± 4.80120.20 ± 0.551.76 ± 0.251.63 ± 0.211.36 ± 0.211.80 ± 0.26
Goldenrod79.50 ± 0.8780.46 ± 1.2286.90 ± 1.24108.3 ± 4.712.76 ± 0.252.26 ± 0.311.93 ± 0.210.96 ± 0.21
Madder94.33 ± 4.11107.13 ± 3.0187.53 ± 2.37100.40 ± 2.911.30 ± 0.101.10 ± 0.101.82 ± 0.912.26 ± 0.15
Onion skin69.70 ± 2.2673.03 ± 3.05106.50 ± 3.3694.50 ± 4.234.03 ± 0.214.23 ± 0.315.96 ± 0.812.03 ± 0.25
Pomegranate skin112.56 ± 1.41110.30 ± 5.52109.90 ± 5.18129.30 ± 5.511.43 ± 0.211.05 ± 0.210.95 ± 0.352.50 ± 0.36
Sumac106.20 ± 4.37114.83 ± 3.90110.43 ± 1.79129.16 ± 1.051.99 ± 0.170.96 ± 0.162.50 ± 0.263.50 ± 0.45
Table 4. Analysis of chemical composition of phenolic and flavonoid compounds of extracts from madder and cochineal by HPLC.
Compoundmg/kg Extract
MadderCochineal
Pyrogallol--
Quinol--
Gallic acid35.12-
Catechol35.96-
p-Hydroxy benzoic acid30.14110.94
Caffeine41.17-
Chlorgenic acid45.725.56
Vanillic acid187.119.71
Caffeic acid3.199.79
Syringic acid5.65-
Vanillin31.4640.42
p-Coumaric acid2.53-
Ferulic acid-19.04
Benzoic acid582.6849.92
Rutin88.7837,732
Ellagic acid784.86-
o-Coumaric acid8.87-
Salicylic acid1758.91193.87
Cinnamic acid9.39-
Myricetin41.51809.97
Quercetin844.23496.76
rosemarinic143.57-
Naringenin122.09-
Kampherol232.91915.98

