1. Introduction
Deposition is a vital part of thin-film manufacturing and vacuum deposition methods, and especially chemical vapor deposition (CVD) methods are crucial to the semiconductor manufacturing industry due to their superior capabilities depositing high quality and high-performance oxide and solid materials. The growing complexities and demands of electronic devices have been continuously urging the refinement of deposition techniques to develop better precision and controllability including the application of run-to-run control methods (e.g., [
1]). For example, the transistors in recent memory devices like 3D not-and (NAND) memory and dynamic random-access memory (DRAM) are based on non-planar 3D design and require ultra-thin gate structures (<10 nm) with minimal defect formation [
2,
3]. In order to meet these design challenges, atomic layer deposition (ALD), which can be viewed as a variation of CVD, has been developed for nanoscale thin-film manufacturing [
4]. A general ALD process includes sequential injections of precursor gases and purge gas into the reactor chamber, where each injection phase is called a half-cycle. Under the ideal operating conditions and the optimal precursor selection, the wafer substrate undergoes self-limiting reaction with each precursor, which leads to a defect-free and conformal thin-film even for high aspect-ratio feature surfaces [
5].
It has been demonstrated that ALD is capable of providing nano-scale control for various materials including metals, organic polymers, and metal oxides [
5]. Thus, in industrial production, ALD has been adopted for a variety of thin-film materials manufacturing. Nevertheless, on the mass-production scale, ALD has encountered difficulties including throughput and operating costs. A traditional single-wafer ALD reactor can only process one wafer at a time, which leads to a high precursor and energy cost, as well as low productivity. To overcome the above hindrances, different types of batch ALD systems have been researched and utilized in industry. For instance, spatial ALD systems separate the precursor gases and half-cycles using multiple reactor chambers, where each reactor chamber is specifically responsible for a specific half-cycle. The wafer is switched between the chambers in a streamlined manner, thereby allowing multiple wafers to be processed concurrently [
6]. On the other hand, the furnace ALD system utilizes a big hot-wall reactor chamber to process up to 125 parallel placed wafers together. The two most predominant furnace ALD system designs are vertical and horizontal furnace ALD chambers, which differ mostly by the position of the precursor inlet. Leading manufacturers in the semiconductor industry have developed a variety of reactor furnaces, including TFS 500 from Beneq, A412 PLUS from ASM, P-1000 from Picosun, etc., all providing high throughput and cost-efficient solutions to ALD wafer mass-production [
7].
Despite the advantages of the furnace ALD system, there are still various challenges associated with the realistic industrial manufacturing environment, because of its large wafer quantity and complex reactor geometry. The lack of understanding of the influence of the gas-phase profile on the wafer surface deposition is one of the most important problems [
8]. In an experimental work and industrial pilot plant, the operating cost associated with the detailed tests in exploring the optimal operating conditions for the batch ALD systems, especially furnaces, is also very high due to the large physical scale and the long processing time [
9]. Thus, experimental works have only been able to investigate a limited range of precursor selections and operating conditions. As a result, many attempts to simulate and characterize the ALD have been made. Specifically, Ref. [
10] developed an overview of the application of kinetic Monte-Carlo (kMC) modeling to thin-film growth. Refs. [
11,
12] explored the surface reaction kinetics and structural details with kMC for HfO
2 and SiO
2 thin-film ALD, respectively. Ref. [
13] formulated a computational fluid dynamics (CFD) simulation of the ALD cross-flow reactor gas-phase transport phenomena. Recently, Ref. [
14] have constructed a multiscale CFD simulation that integrates surface deposition modeling and gas-phase CFD modeling for the simulation of a single-wafer showerhead ALD system. Based on the CFD simulation, Ref. [
15] proposed a machine learning based data-driven model that largely cut down the computation time and preserved model fidelity. However, furnace ALD simulations were mainly still based on semi-empirical Langmuir isotherm, empirical relationships, and simplified CFD gas-phase simulation [
8,
9].
Furthermore, because of the large physical dimension of the batch ALD systems, they are much more susceptible to batch-to-batch variation and process disturbances compared to single wafer systems [
16,
17]. Therefore, it is beneficial if on-line controllers, integrated with run-to-run control schemes, can be formulated and implemented for the batch ALD processes [
18]. Several works have investigated control schemes for single-wafer and small-scale CVD and ALD systems [
19,
20,
21,
22,
23]. For example, Ref. [
24] utilized an ion beam sculpting feedback control to fabricate non-porous thin silicon nitride membranes using ALD coated pores. Ref. [
25] looked into a predictive control scheme to regulate the heating in a house-made ALD reactor. These proposed control schemes demonstrated the challenges and opportunities of integrating control designs in complicated modern applications [
26,
27]. Nevertheless, it has been demonstrated that there is a limited amount of on-line control schemes as well as run-to-run control schemes proposed for furnace ALD systems [
28].
In this work, a multiscale CFD model and an integrated on-line control run-to-run scheme are constructed for a furnace ALD process of SiO
2 thin-film production with BTBAS and ozone as precursors, as shown in
Figure 1. A 2D axisymmetric multiscale CFD model is first formulated, combining the surface deposition domain and the gas-phase transport domain, and is validated with respect to industrial and experimental results. Next, a proportional-integral (PI) controller is developed, which regulates the precursor partial pressure set-point, which allows full-coverage on the wafer surface, by manipulating the inlet precursor concentration. Then, a database for multiple operating conditions and a regression method are developed to characterize the input-output relationship between half-cycle time and the inlet feed flow rate. This relationship can be used in an exponentially weighted moving average (EWMA) algorithm of a run-to-run (R2R) control scheme to adjust the operating conditions for half-cycle time tracking. Finally, the R2R and PI controllers are integrated with the multiscale CFD model via a message-passing interface (MPI), and the closed-loop performance under a vacuum pump disturbance is evaluated.
2. Multiscale CFD Modeling for Furnace ALD Process
In this section, the construction of a 2D axisymmetry multiscale CFD model for the furnace thermal ALD reactor is discussed. First, the cylindrical ALD furnace geometry, the 2D axisymmetric approximation, and the meshing process are discussed. Then, the CFD model settings and the solution of the gas-phase momentum, energy, and species transport equations are presented and investigated. Next, the surface deposition calculation adopting the previously developed kMC database is introduced. In addition, the automatic workflow under the message passing interface (MPI) and the computation parallelization is discussed. Specifically, the ALD process of SiO2 involves two half-cycles, O-cycle and Si-cycle, for precursor depositions, and also a purge step in between half-cycles for purging. In the Si-cycle, the BTBAS precursor is introduced into the batch ALD reactor, which reacts with the substrate surface to form a Si layer, whereas in the O-cycle, the O layer is produced by ozone. Due to the intriguing complexity and the substantial operating cost associated, this study focuses on the discussion of Si-cycle.
2.1. Gas-Phase CFD Model
The gas-phase transport phenomena greatly affect the overall gas-phase profile, the surface deposition profile and the resulting half-cycle time. Due to the large and complicated geometry of the multi-wafer furnace reactor, it is hard to develop a simple analytical solution without sacrificing the important details in the simulation. Nevertheless, CFD provides a comprehensive but computationally feasible solution. By discretizing the domain spatially and temporally, a highly accurate gas-phase profile can be computed from the governing equations of momentum, species and energy transfer. In addition, for the ALD surface deposition, CFD provides insights to the gas-phase environment that the wafer surfaces are exposed to. In this work, we utilize the ANSYS Fluent 2019R2 software package to construct the reactor geometry, mesh the domain, and set up the CFD solution [
29].
2.1.1. Furnace ALD Reactor Design and Meshing
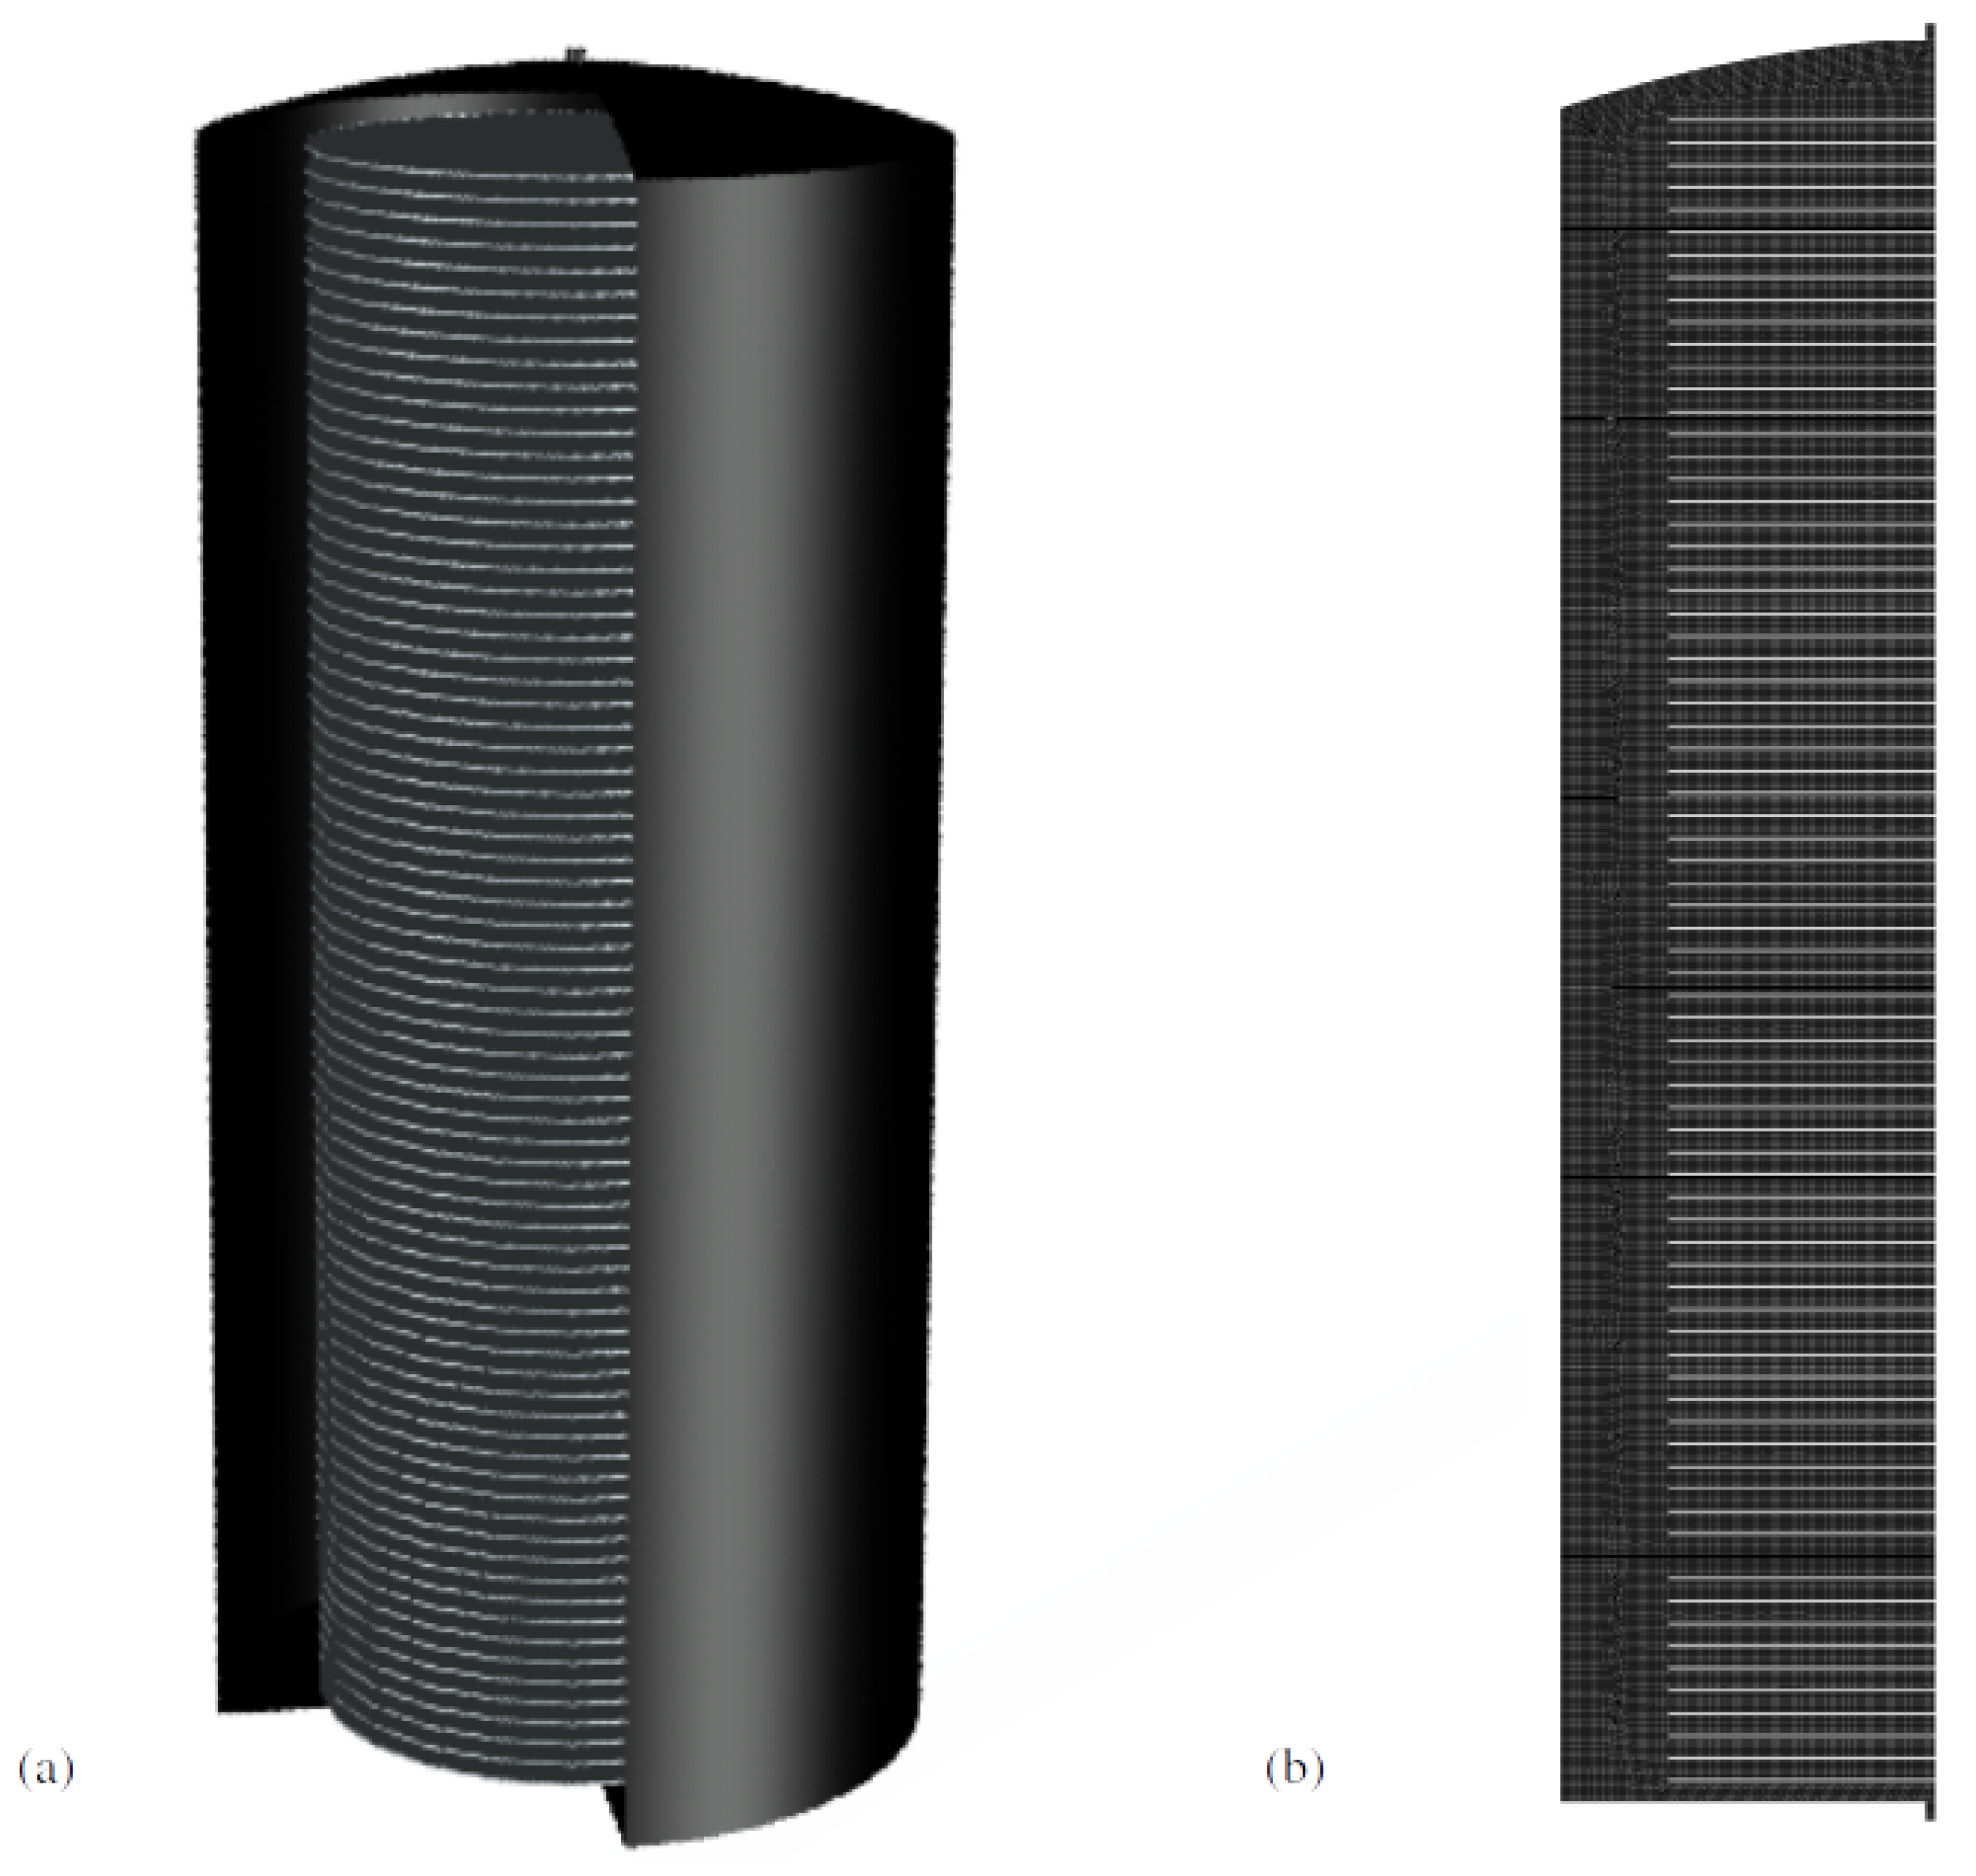
The first aspect of the CFD model is to choose a precise and accurate furnace model geometry, which provides the basis for a meaningful simulation of the actual industrial manufacturing process. Many companies have developed their batch ALD systems for thin-film mass production. In our model, we adopted a general industrial vertical furnace system, shown in
Figure 2a, which is demonstrated to have better performance than a parallel furnace platform or a spatial platform [
18]. In this reactor design, the precursor is introduced into the reactor through the top inlet and exits through the bottom outlet. A total of 75 plates are placed in parallel across the reactor chamber, of which 60 are 300 mm substrate wafers and 15 are heating susceptors, with four wafers wrapped between two heating susceptors. Specifically, the inter-wafer distance is 10 mm, the height of the wafer holders and susceptors is 2 mm, the height of the inlet region is 50 mm, resulting in a total reactor height of 950 mm, and the side vertical tunnel has a width of 60 mm. A 2D axisymmetric model could be built because of the azimuthal symmetry, which saves a significant amount of computational power while maintaining geometric detail and model validity. This dimensional reduction, shown in
Figure 2b, can be achieved using AUTOCAD, a computer-aided design software.
In advance of the CFD simulation, the reactor geometry needs to be dissected into geometric primitives. The meshing quality is crucial to the computation accuracy and efficiency [
30]. For this model, a software-aided structured mesh is generated to precisely control the mesh size and the connection to enhance the mesh quality. With a mesh independence test, a resulting mesh with 50388 cells is proven to achieve a good cell quality and a size-independent solution. The acceptable range and the desired value of skewness, overall quality, and aspect-ratio, which characterize the mesh quality, are shown in
Table 1. For each mesh property, the max/min qualities lie within the acceptable range, and the average quality lies towards the optimal side, which is labeled with the asterisk symbol [
29,
31].
2.1.2. Gas-Phase CFD Transport Model
After the furnace ALD reactor geometry has been meshed, it is used by ANSYS Fluent for CFD calculation. The boundary and operating conditions, material properties, and solution methods are defined by the user-defined function (UDF) functionality in Fluent. The right side of the
Figure 2b is formulated as the rotating axis for a 2D axis-symmetric model. In addition, a coupled pressure-based solver is utilized, which is appropriate for a low-speed ideal gas flowing through the furnace ALD reactor [
32].
In order to solve the dynamic reactor profile and estimate the half-cycle time, a transient simulation is performed in Fluent. The time step of the transient model is critical to the efficiency and accuracy of the CFD model and it is governed by the Courant–Friedrichs–Lewy (CFL) condition, which is a popular criterion for PDE finite-difference approximation [
33]:
where
C is the Courant number, a quantitative description of the number of computational cells that fluid moves through in one time step,
u is the average flow velocity, and
is the minimum cell length. It is demonstrated that a commercial CFD software allows convergence with high Courant number around 50 [
34]. The transport of species, energy, and momentum predicts the wafer surface profile to calculate for the ALD deposition. ANSYS Fluent obtains an accurate reactor dynamic profile by solving the coupled transient Navier–Stoke equations, shown in their tensor forms [
29,
35]:
where
is the diffusive flux of species
i,
is the density of the gas-phase species mixture,
T is the fluid temperature,
and
are the mass and heat diffusivities of species
i,
is the mass fraction of species
i,
is the velocity of gas-phase species mixture,
and
are the reaction and mass transfer source terms of species
i, respectively,
E is the total energy,
is the stress tensor,
is the energy flux at the boundary,
P is the static pressure,
is the component of gravity on the direction of the fluid flow,
F is the mass flux at the boundary,
is the fluid viscosity and
I is the unit tensor.
Despite the capability of CFD to solve an all-inclusive solution, it is still helpful to make reasonable physical assumptions to cut down the computation requirements. Due to the typical environment (high temperature, low pressure) in the ALD reactor, we assume the gas species to be ideal gas. Five gas species are incorporated in the Fluent simulation: BTBAS and ozone are the Si-cycle and O-cycle precursors, respectively; tert-Butylamine and oxygen are the Si-cycle and O-cycle by-products, respectively; argon is the purging gas between the two half-cycles. The thermodynamic and kinetics properties of ozone, oxygen, and argon are provided by the Fluent database, while the properties of BTBAS and tert-Butylamine (e.g., viscosity, specific heat (
), standard enthalpy, and entropy) are defined by values computed from density functional theory (DFT) calculation and literature [
14]. The mixture follows the ideal gas mixing law.
Moreover, it is important to examine the different forms of the species transport in the furnace ALD reactor as the wafer–wafer inter-distance is relatively small compared to the length scales of the rest of the reactor. From a preliminary velocity profile test, it is demonstrated that the velocity between wafers is nearly zero, and thus the species transport is limited by diffusion. Since there are more than two gas species with significant quantity co-existing and diffusing in the region, a full-component diffusion model needs to be utilized to account for the multi-component diffusion. To determine the effective diffusivity between species, the Chapman–Enskog formula, derived from the fundamental kinetic theory of gases, can be utilized to calculate the diffusion coefficient of each pair of species [
36]:
where
is the local absolute pressure,
is the arithmetic average of the individual rigid elastic sphere diameter,
is the diffusion collision integral, which is a function of the Lennard–Jones parameter
that represents the intermolecular interaction.
2.2. Surface Deposition Rate Calculation
In addition to the macroscopic model which determines the gas-phase transport phenomena, it is important to simulate the substrate surface dynamics including the details on film surface coverage and the transient surface deposition rate. Simple Langmuir adsorption models, often utilized to characterize surface deposition processes, do not provide a comprehensive deposition profile because of the competing reaction pathways, the complex reaction mechanisms, and the influences of the absorbed species and structural details. In our previous works, we constructed an on-lattice kinetic Monte-Carlo (kMC) model, which described the lattice structures and surface reactions in detail [
12]. Based on the kMC simulation results, a deposition rate database and a Bayesian regularized artificial neural network (BRANN) model were developed to characterize the transient deposition under various precursor partial pressures, surface temperatures, and surface coverages [
15]. Thus, in this work, we adopt the developed deposition rate database to simulate the ALD surface reaction, instead of running the computationally demanding kMC models.
2.3. Automated Workflow and Parallel Computation
The resulting multiscale CFD model involves more than 5000 cells and a long computational processing time. Therefore it would be extremely challenging to perform the computation task serially on a single core and would be impossible to perform any data mining. To improve the computational efficiency and allow the possibility for a comprehensive database generation, parallel computation needs to be employed for the multiscale CFD model. On the UCLA Hoffman2 Cluster, the parallel computation of the multiscale CFD model is implemented with the Message Passing Interface (MPI) [
29]. Eight computation cores with 8G of RAM are chosen according to the batch array process availability, computational duration and the parallel communication overhead between host and nodes.
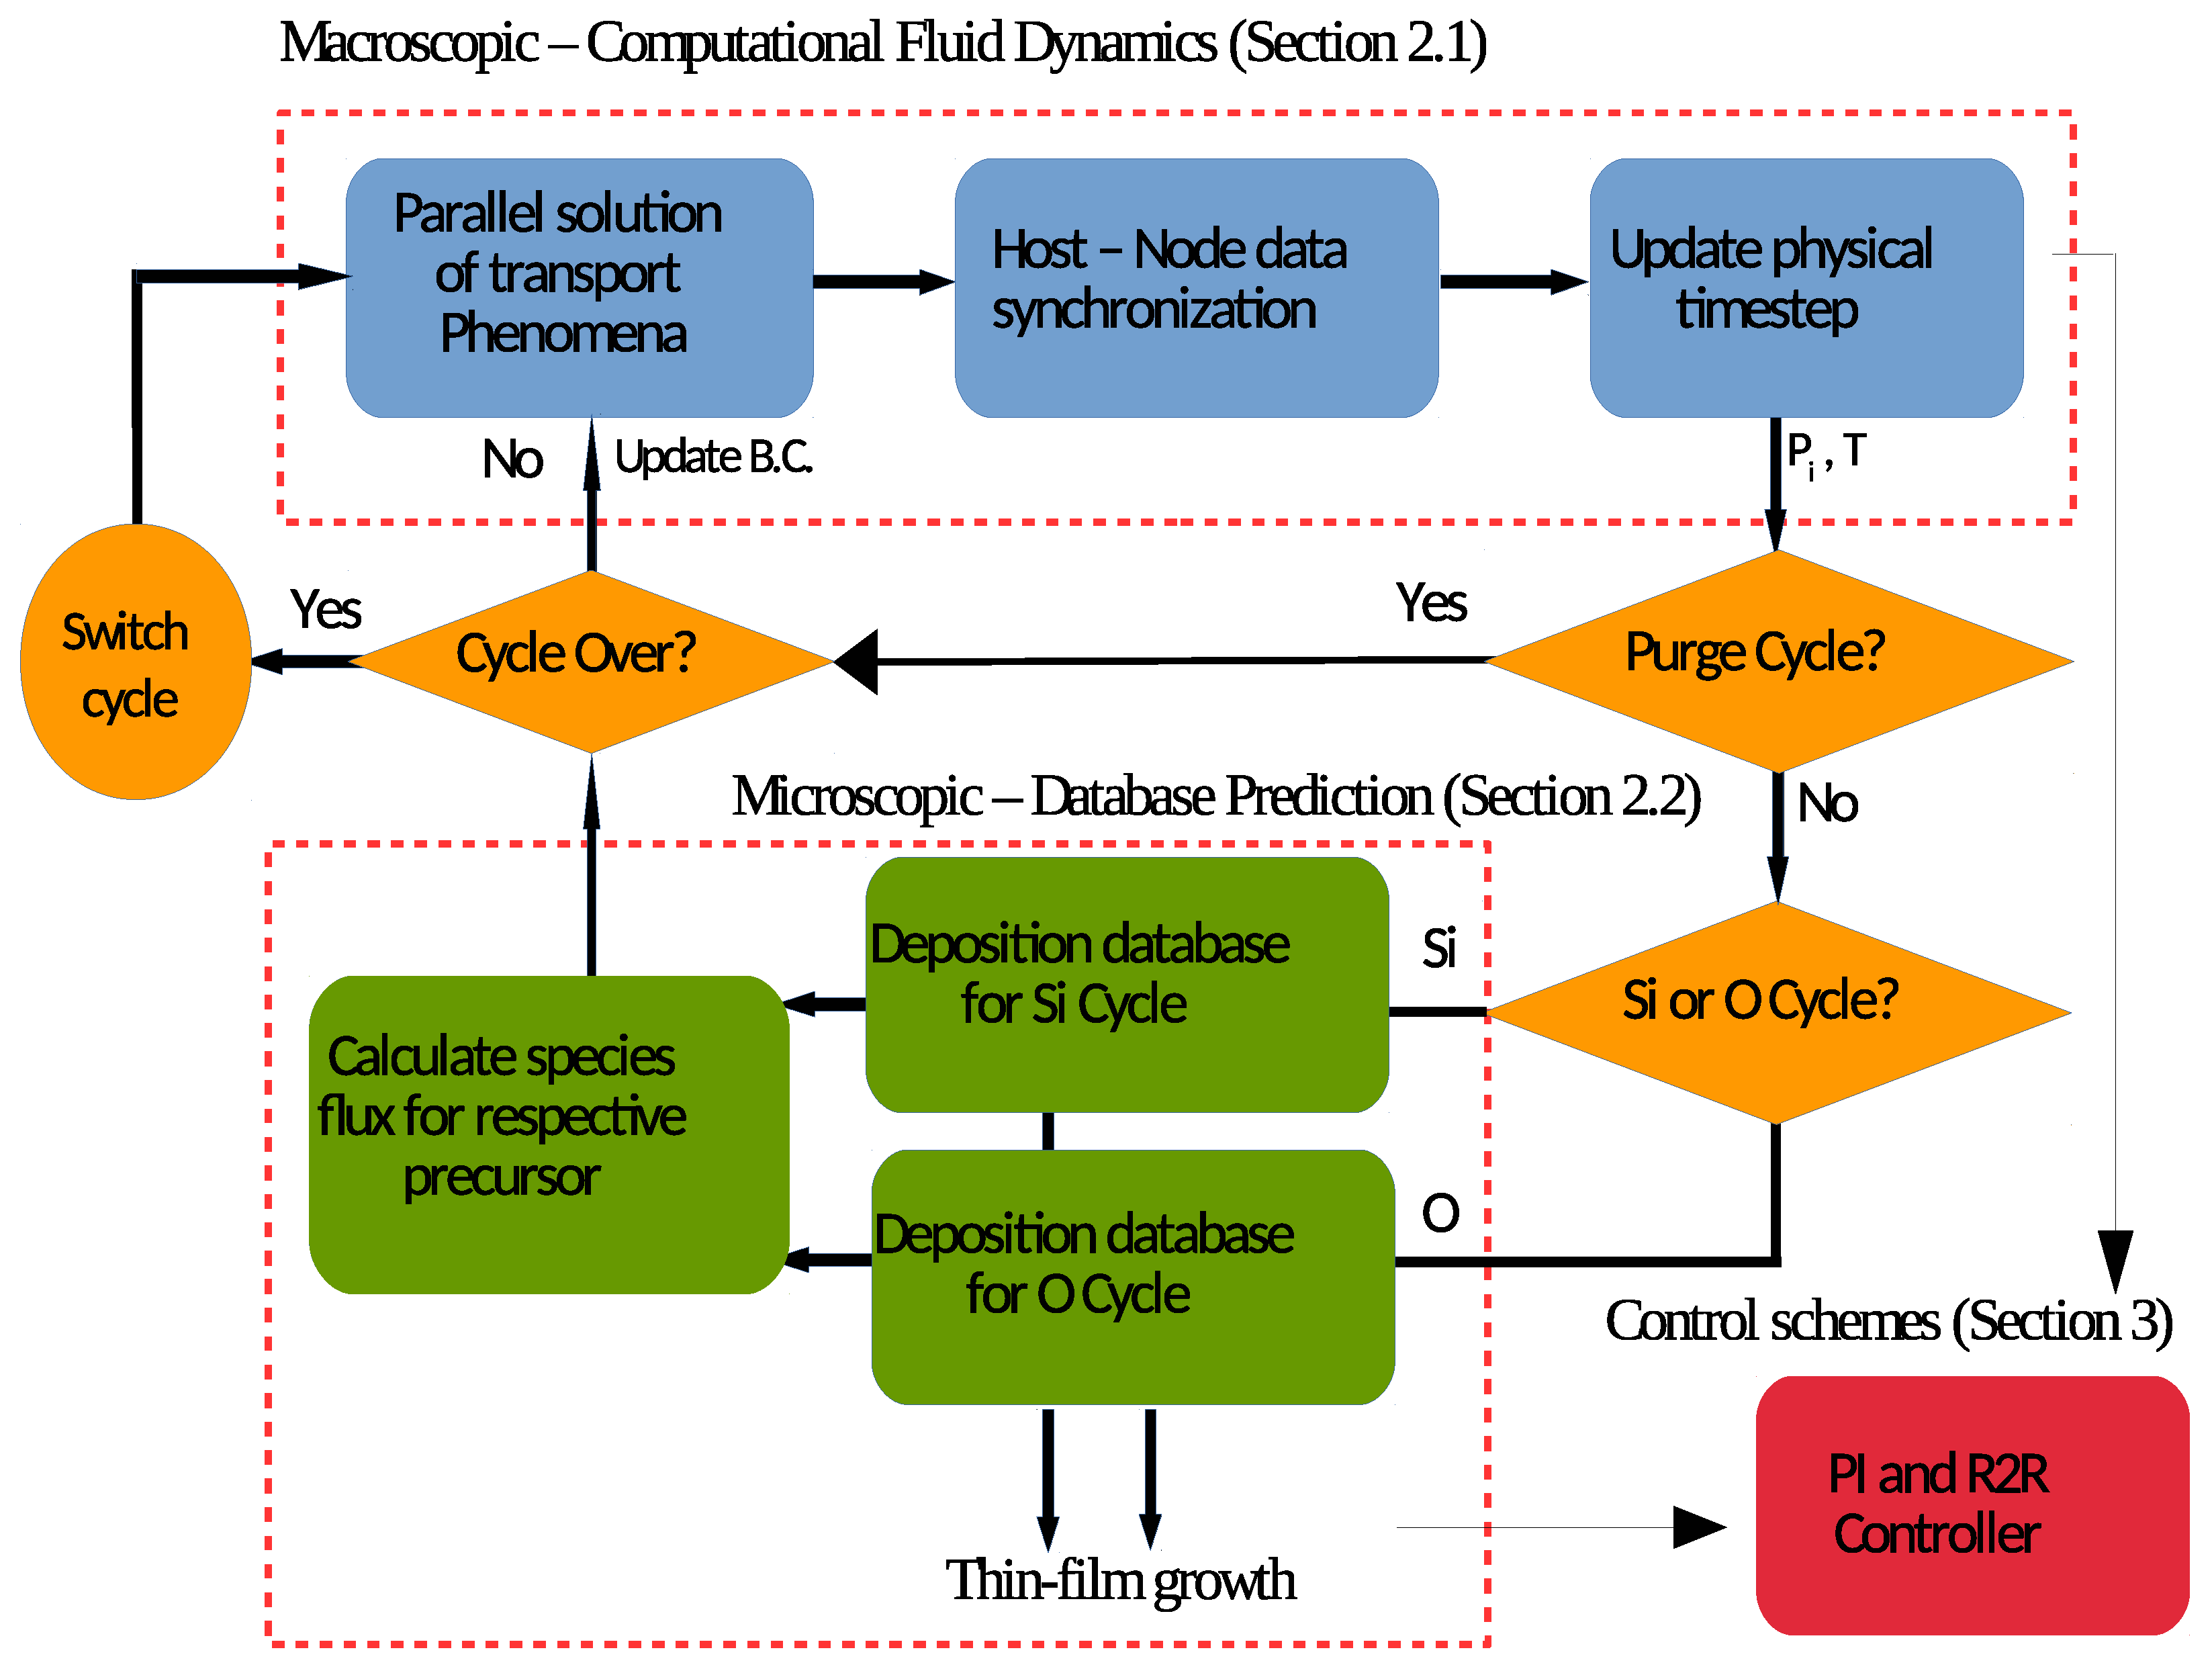
In addition, an automated workflow is integrated with the MPI and guides the connection and interaction between the microscopic and macroscopic domains. As shown in
Figure 1, the blue region describes the parallel computation of the macroscopic gas-phase CFD model, the green region describes the surface deposition model, and the yellow components and arrows describe the logical connection and the direction of workflow. At the beginning of every time step,
, the CFD model solves for the transient mass and energy governing equation at that moment. After the convergence of the solution, the model provides surface boundary temperature, partial pressure and time step at five sub-regions on each wafer. This information is transferred to the surface deposition database, which returns the corresponding transient deposition rate to the CFD model. Using the transient deposition rate, the species fluxes are calculated for each sub-region on the wafer and are reported back as updated CFD boundary conditions for the next time step. Using the implicit Euler scheme, the system physical time is updated to
[
29].
2.4. Multiscale Furnace CFD Model Validation
In this subsection, the CFD model result for the furnace ALD system is validated with experimental results and existing simulation models. The current models reported in [
8] and in [
9] utilized empirical knowledge and a rudimentary gas-phase CFD computation to analyze the transport time scale. Specifically, the time scale results were compared to the 2D asymmetric multiscale CFD model in this paper under similar operating conditions: a precursor inlet flow rate of 1.3 slm, a precursor mole fraction of 0.3, and a vacuum pump setting of 100 Pa and 266 Pa. In addition, for the substrate surface heating from top to bottom, a temperature gradient from 475 K to 615 K with an interval of 10 K for each susceptor was implemented to enhance the surface deposition reaction for the bottom wafers.
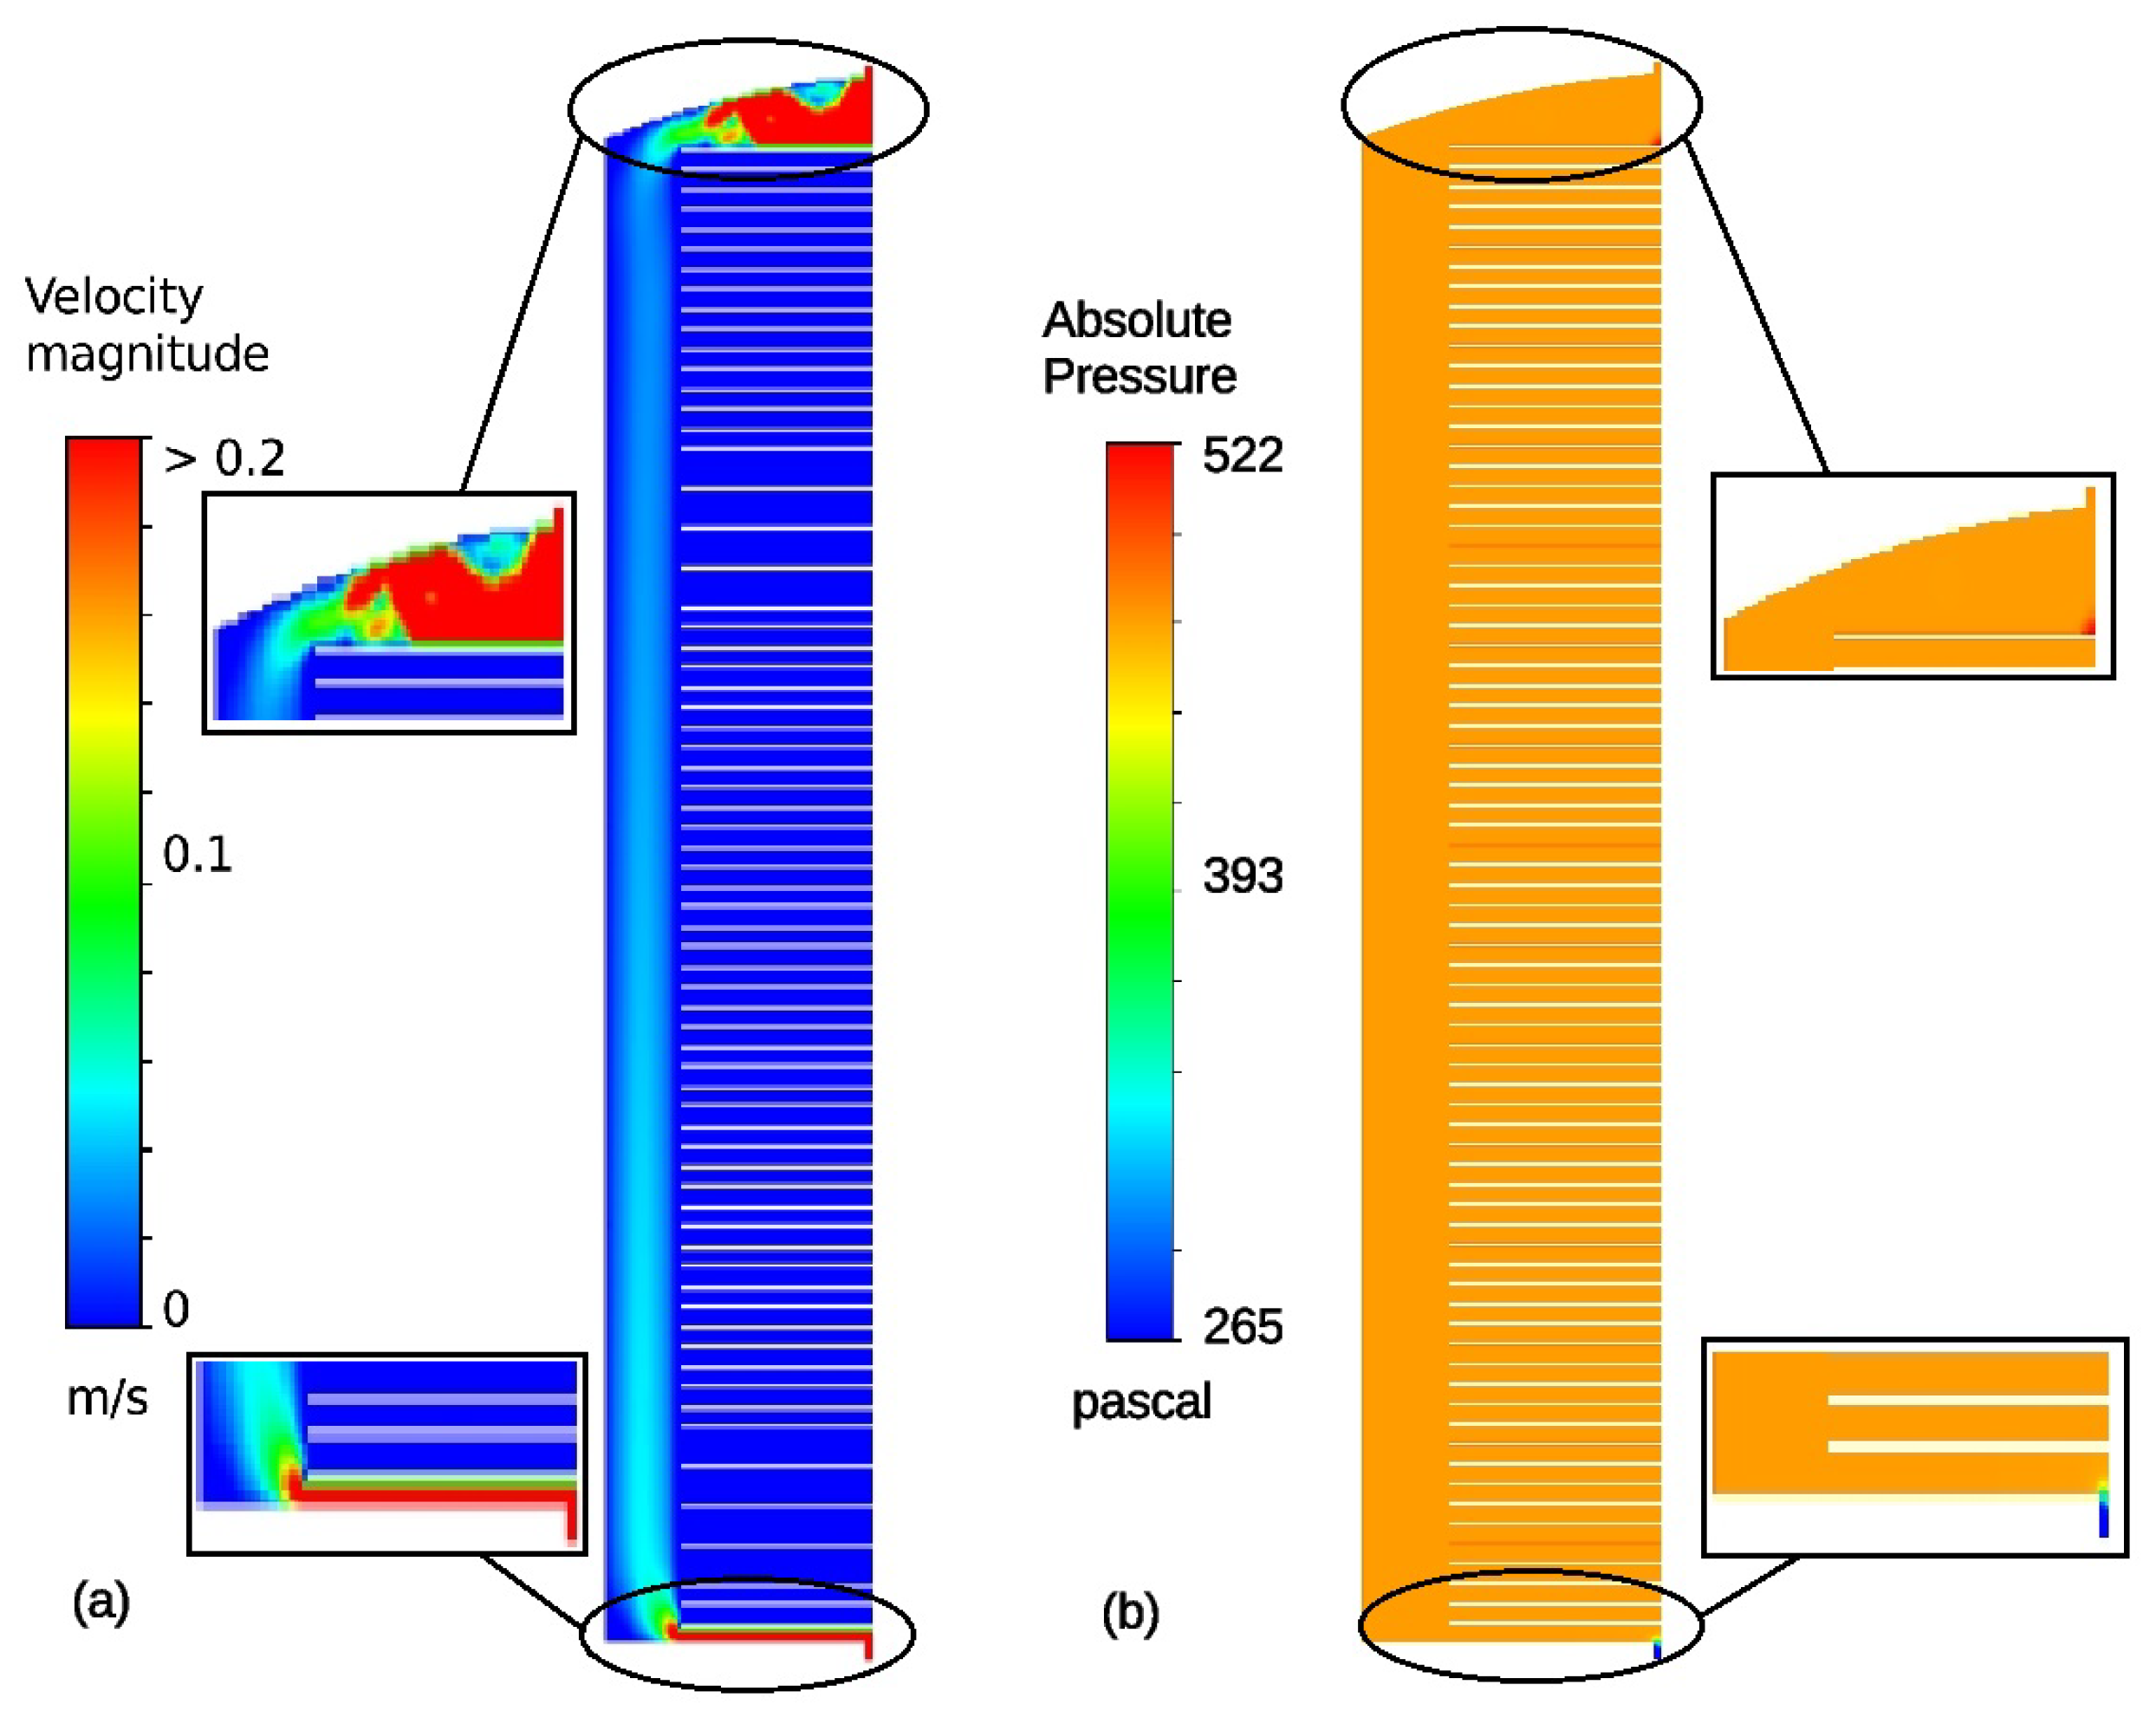
Two types of species transport exist in the furnace ALD reactor as demonstrated by the velocity profile in
Figure 3a, which was chosen at a random process time for illustration purposes. The downward transport in the vertical region besides the wafers was a combination of diffusion and convection, as indicated by an asymmetric velocity magnitude of 0.05 m/s, which is equivalent to a vertical velocity magnitude of 0.008 m/s. In the inter-wafer region, the species transport was diffusion-only in the radial direction because the velocity was approaching zero. In addition, under a rotary vacuum pump setting of 12 M
3/h, the corresponding operating pressure, which is conventionally defined as the pressure towards the reactor outlet should be 266 Pa. Nevertheless, because of the complex parallel wafer geometry and the diffusion stagnation in between the wafers, the absolute pressure was higher in the reactor because of the static pressure, reaching around 500 Pa, as shown in
Figure 3b. The entirely orange region is a result of the diffusion dominant mass transfer. In the majority part of the reactor, the velocity magnitude was less than 0.1 m/s, which is a nominal value for gas-phase transport. This small magnitude validates the lack of apparent pressure gradient in the reactor main body. Meanwhile, there were sharp pressure gradients at the inlet and outlet, as a result of the converged gas streams.
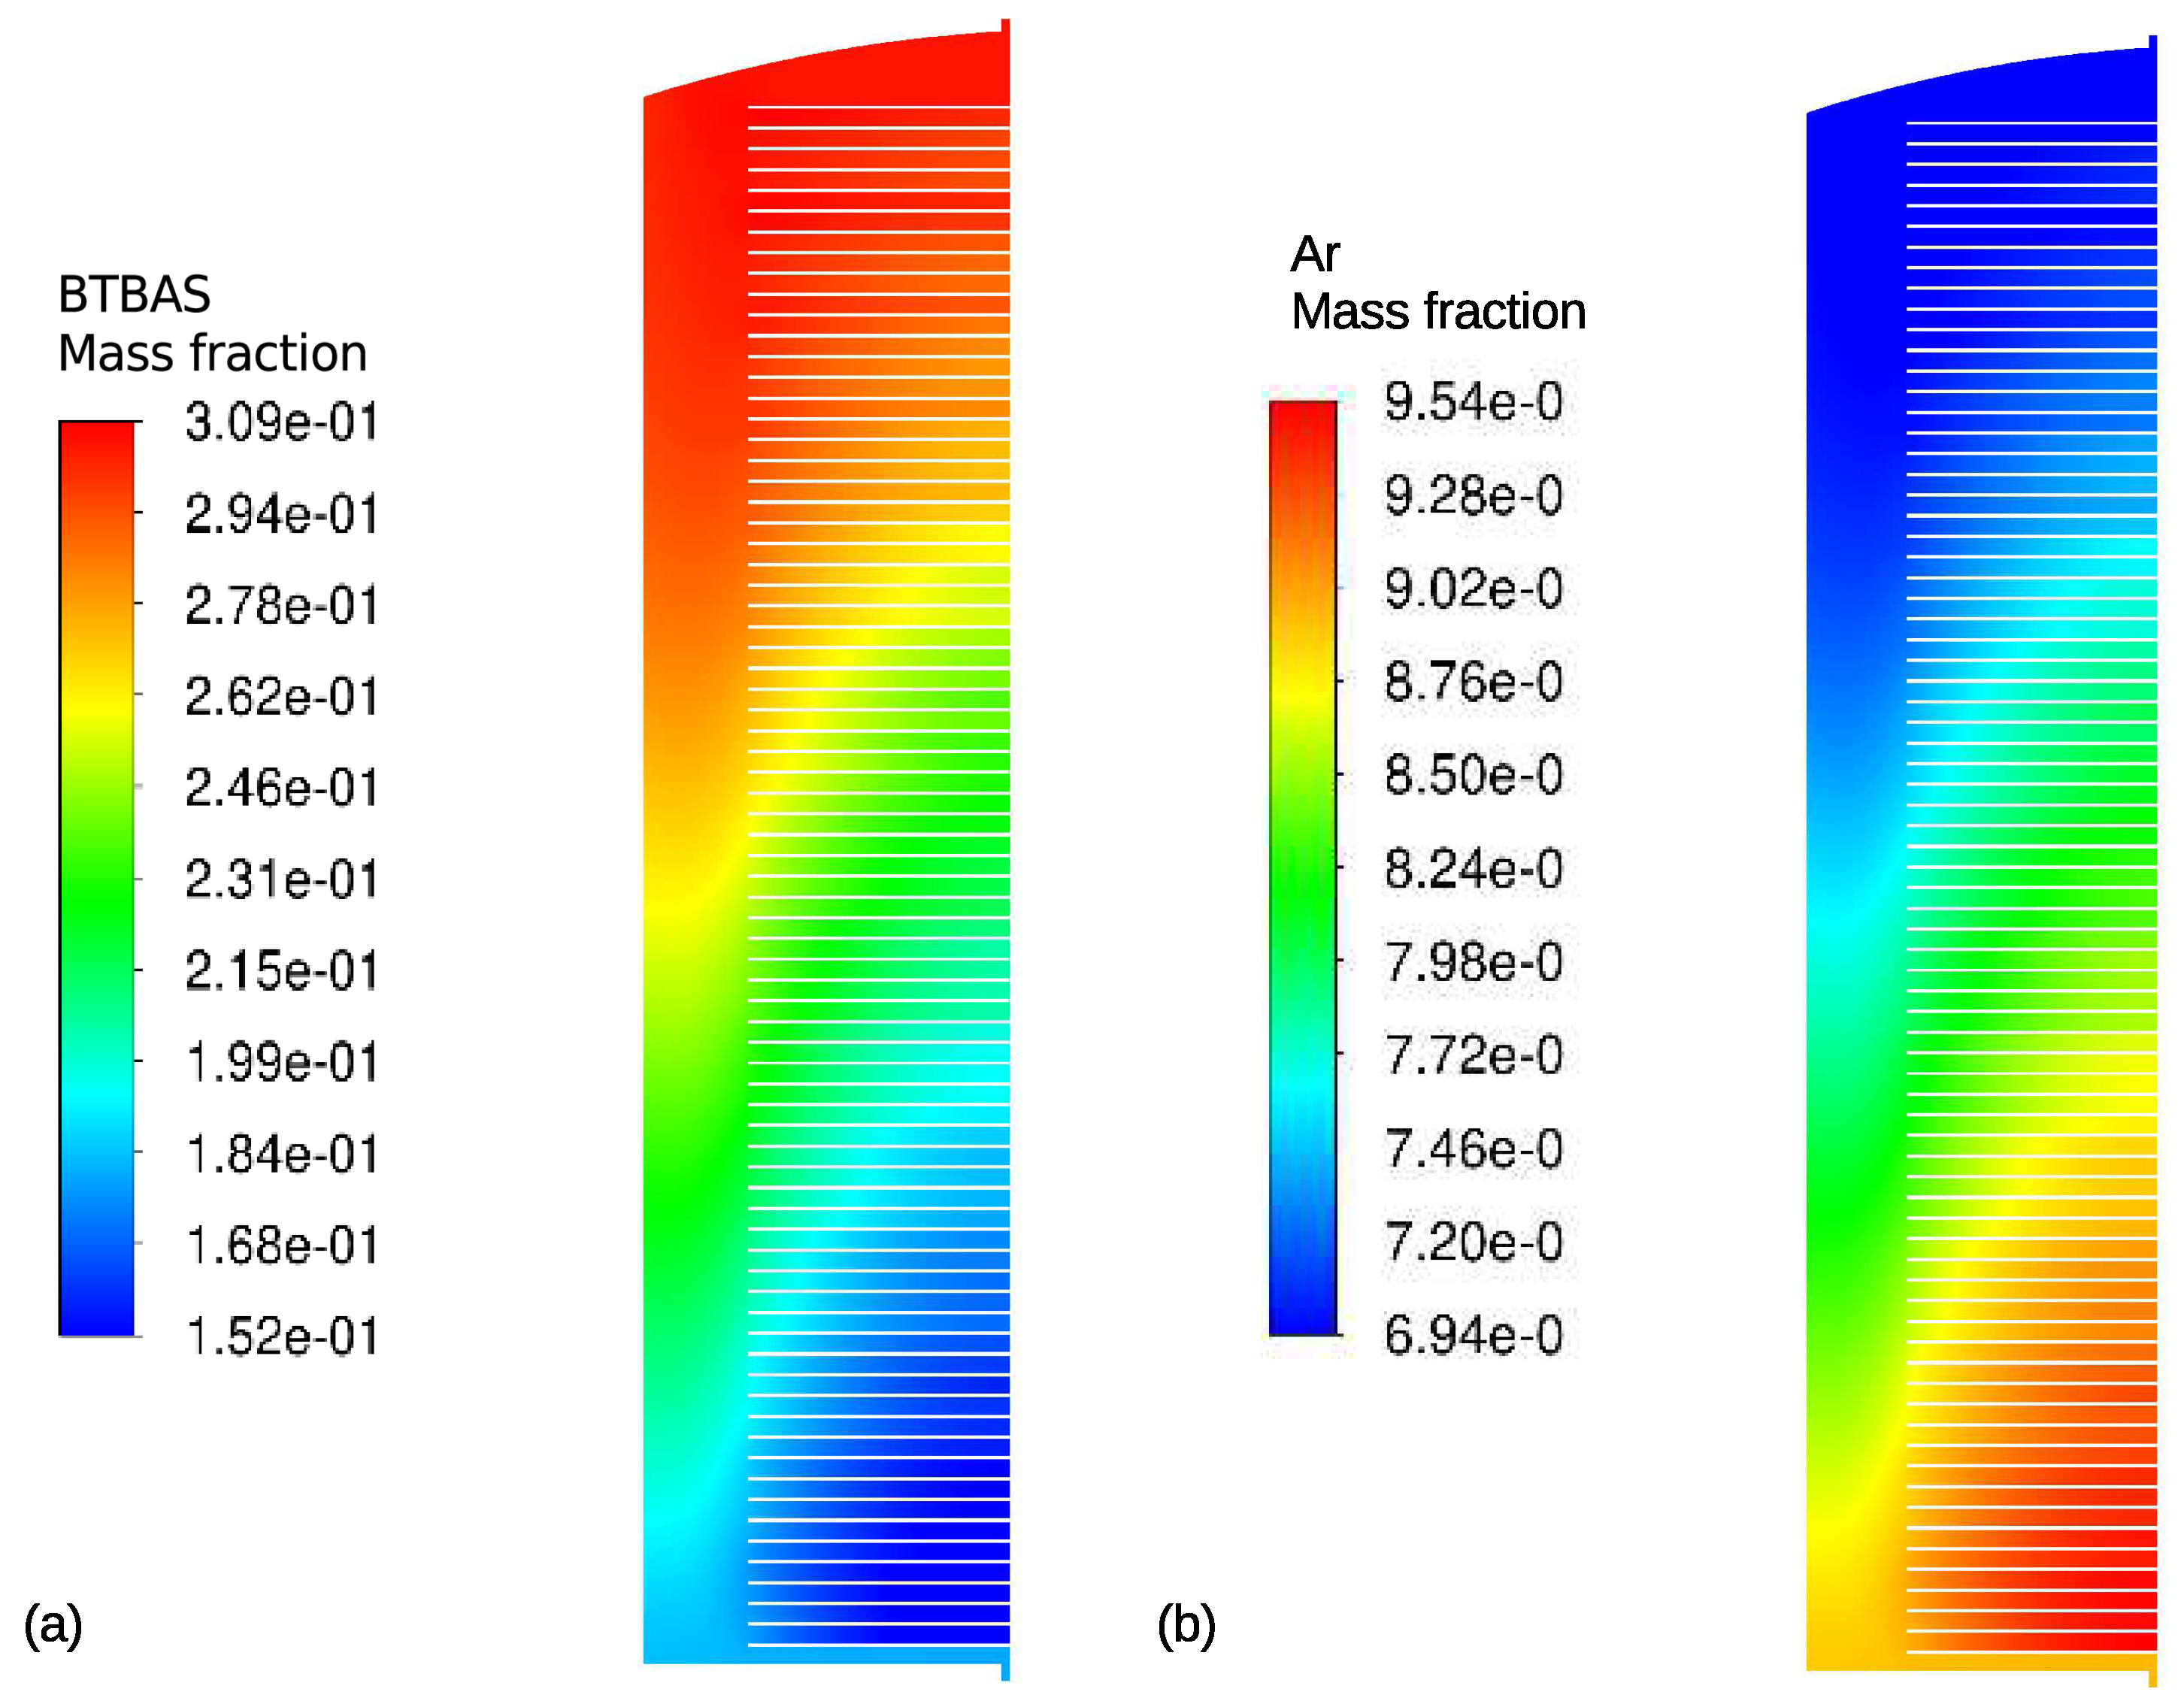
Because of the combined convection and diffusion flow regime and the reactor layout, the precursor gas first reached the edges of upper wafers under the diffusion across the side of the furnace, and finally reached the center of the bottom wafers under diffusion into the wafer, as shown in
Figure 4a. In the meantime, as the precursor came into the reactor and in between the wafers, Ar was purged out concurrently, as shown in
Figure 4b. The corresponding dynamic gas-phase BTBAS partial pressure development profiles at the top, middle, and bottom wafer surfaces are shown in
Figure 5a. Additionally, the transient film coverage developments at the middle and the peripheral wafer regions are shown in
Figure 5b. The gas-phase dynamics and the surface deposition at different reactor locations were demonstrated to be similar to the reported profiles in [
8]. In addition, the half-cycle time, at which all the wafers reach full coverage, ranged from 41 to 100 s at a vacuum level of 100 to 266 Pa, respectively, which are comparable to the experimental results in a furnace ALD reactor [
18]. The discrepancies between the multiscale CFD model results and the reported values are due to the differences in precursor reaction mechanism, the number of loaded wafers, and the need for a more comprehensive modeling of the interaction between diffusion and surface deposition. Moreover, with the validated model, the half-cycle time, the precursor partial pressure at the gas sensor position, and the wafer coverage of the bottom substrate were taken as measured observables as discussed in the next section for the formulated control schemes.
3. Control Schemes
As introduced in
Section 1, many types of disturbances are prevalent during the operation of the bulky furnace ALD reactor, both between batches and in real-time. For example, reactor variations might happen between consecutive batches because of human manipulation or due to undesired deposition onto the reactor wall. In addition, disturbances (e.g., on vacuum pump) may occur in each batch half-cycle, which influences the gas-phase development and the resulting surface deposition. Thus, although a prior knowledge of an optimal operating condition can be postulated by the multiscale CFD model, this knowledge does not guarantee the optimal reactor operation under disturbances. Since these disturbances will lead to a substantial variation from full coverage at the target half-cycle time, on-line control strategies can significantly aid the performance of batch ALD processes. Thus, in this section, we formulate two control schemes that are integrated together to minimize reactor disturbances. First, an R2R controller is constructed, which adjusts the inlet feed flow rate according to the altered half-cycle time under reactor variation between batches. Next, a real-time PI control scheme is adopted, which varies the inlet feed composition to track the partial pressure set-point, thus balancing the vacuum pump disturbances. After each controller is tuned, they are integrated and their combined closed-loop performance is evaluated.
3.1. R2R Control of Half-Cycle Time
To gradually handle the operational variations between batches, an R2R control scheme is proposed. For a plasma-enhanced CVD system, which has a comparable operating environment and length scale to ALD systems, Ref. [
1] recently proposed an R2R control scheme and demonstrated its ability to enhance the deposited film uniformity. As a result, a similar control scheme is used in the furnace ALD process. Triggered by the measured reactor variation, the operating conditions are fine-tuned based on an exponentially weighted moving average (EWMA) algorithm to minimize the effect of disturbances in the gas-phase transport, and thus, maintaining full film coverage.
3.1.1. Input–Output Relationship
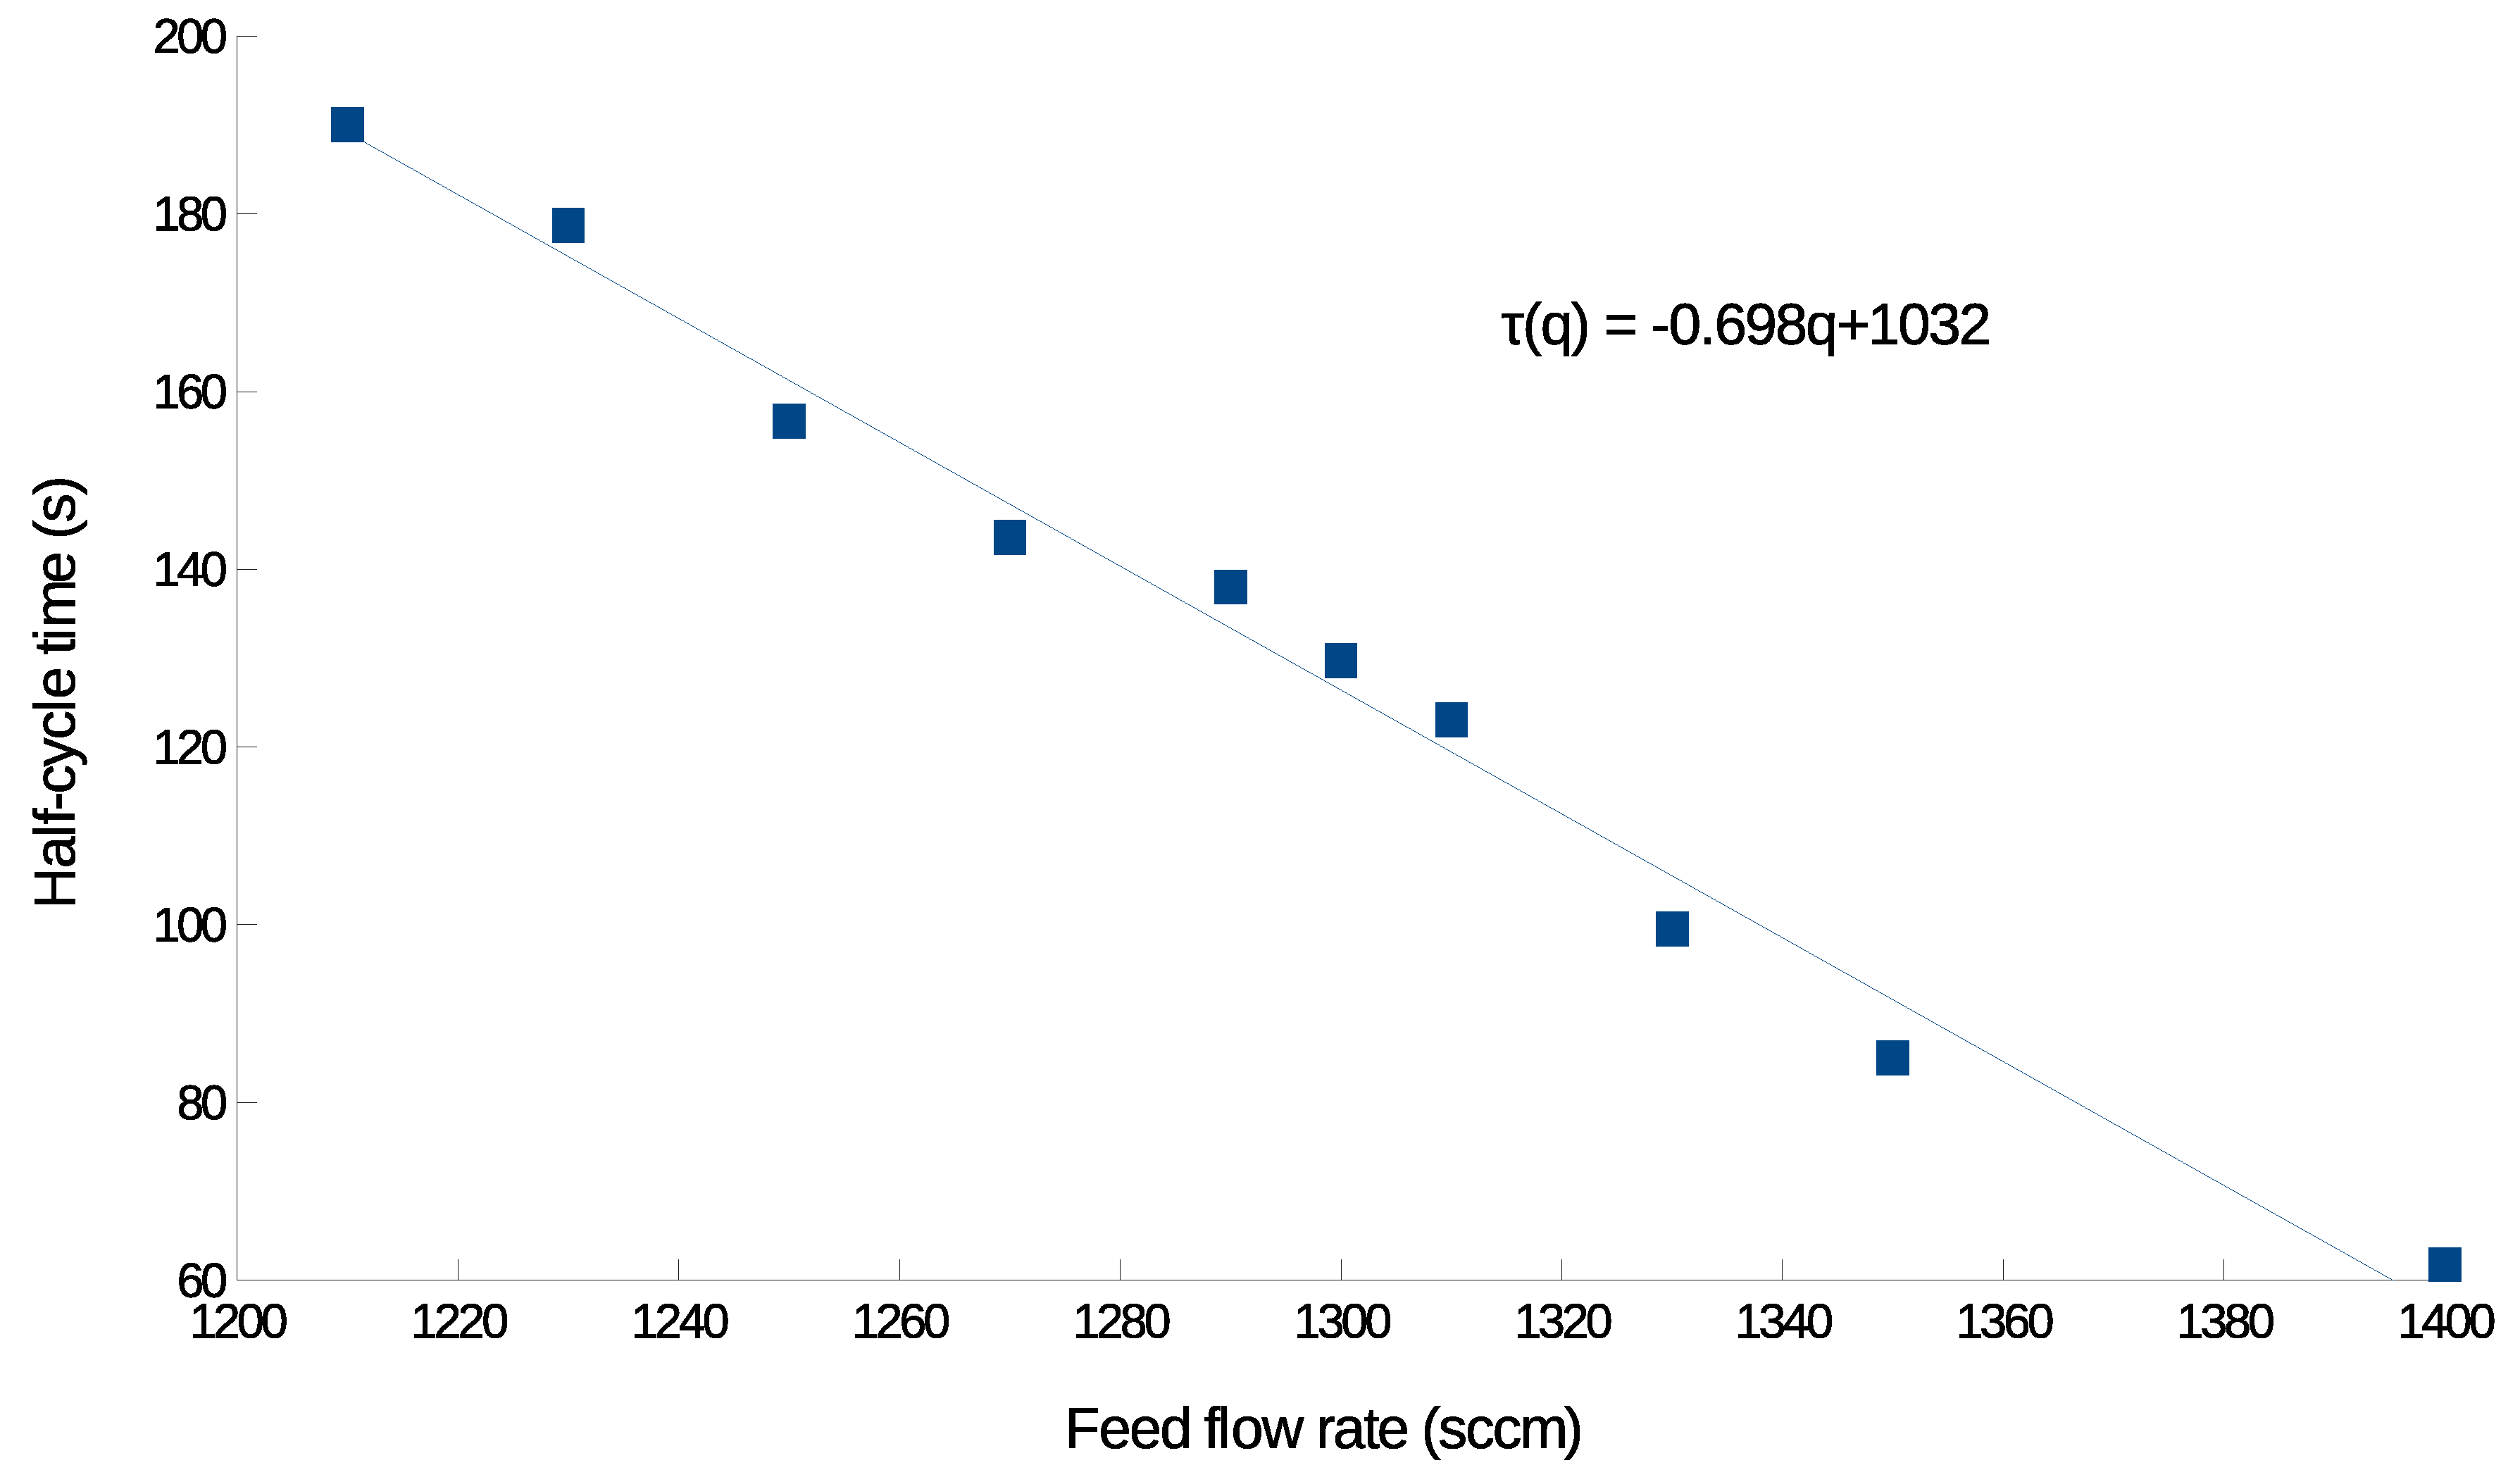
To implement the R2R control, the key input–output relationship between the inlet feed flow rate and the resulting half-cycle time needs to be determined from the multiscale CFD model. Due to the large physical scale and the complex geometry in the furnace ALD system, this input-output relationship is non-linear and not monotonic in the complete operating region. However, in this scenario, we only investigate a focused operating domain that is around the industry standard operating condition. The industry standard half-cycle time, 100 s, is chosen as the set-point,
, and the corresponding set-point feed flow rate,
, is equal to 1330 sccm. Under the ideal operating pressure of 266 Pa, it is ensured that full coverage can be achieved in all deposited thin-films. In this operating region, the mapping between parameters is linear with an R-squared value of 0.98, as shown in
Figure 6.
3.1.2. EWMA Formulation
Using the post-batch measurement as the feedback to the R2R control scheme, the operating condition update can be calculated with the exponentially weighted moving average (EWMA) algorithm. EWMA statistically monitors the process measurement and updates the decision in a way that historical information is considered but weighted less with respect to later times. Specifically, in this paper, the algorithm adds a chosen learning factor to exponentially decrease the weight of the previous process output, which is the half-cycle time from the previous batch and corrects the model input, which is the inlet feed flow rate. The EWMA algorithm is formulated as follows:
where
and
are the correction factors for the operating condition for the
k batch and
batch, respectively,
is the learning factor,
is the equivalent feed flow rate under the ideal operating condition, calculated with the post-batch half-cycle measurement from the CFD simulation, and
and
are the manipulated feed flow rates of the
k batch and
batch, respectively.
3.1.3. Closed-Loop Operation Results under R2R Control
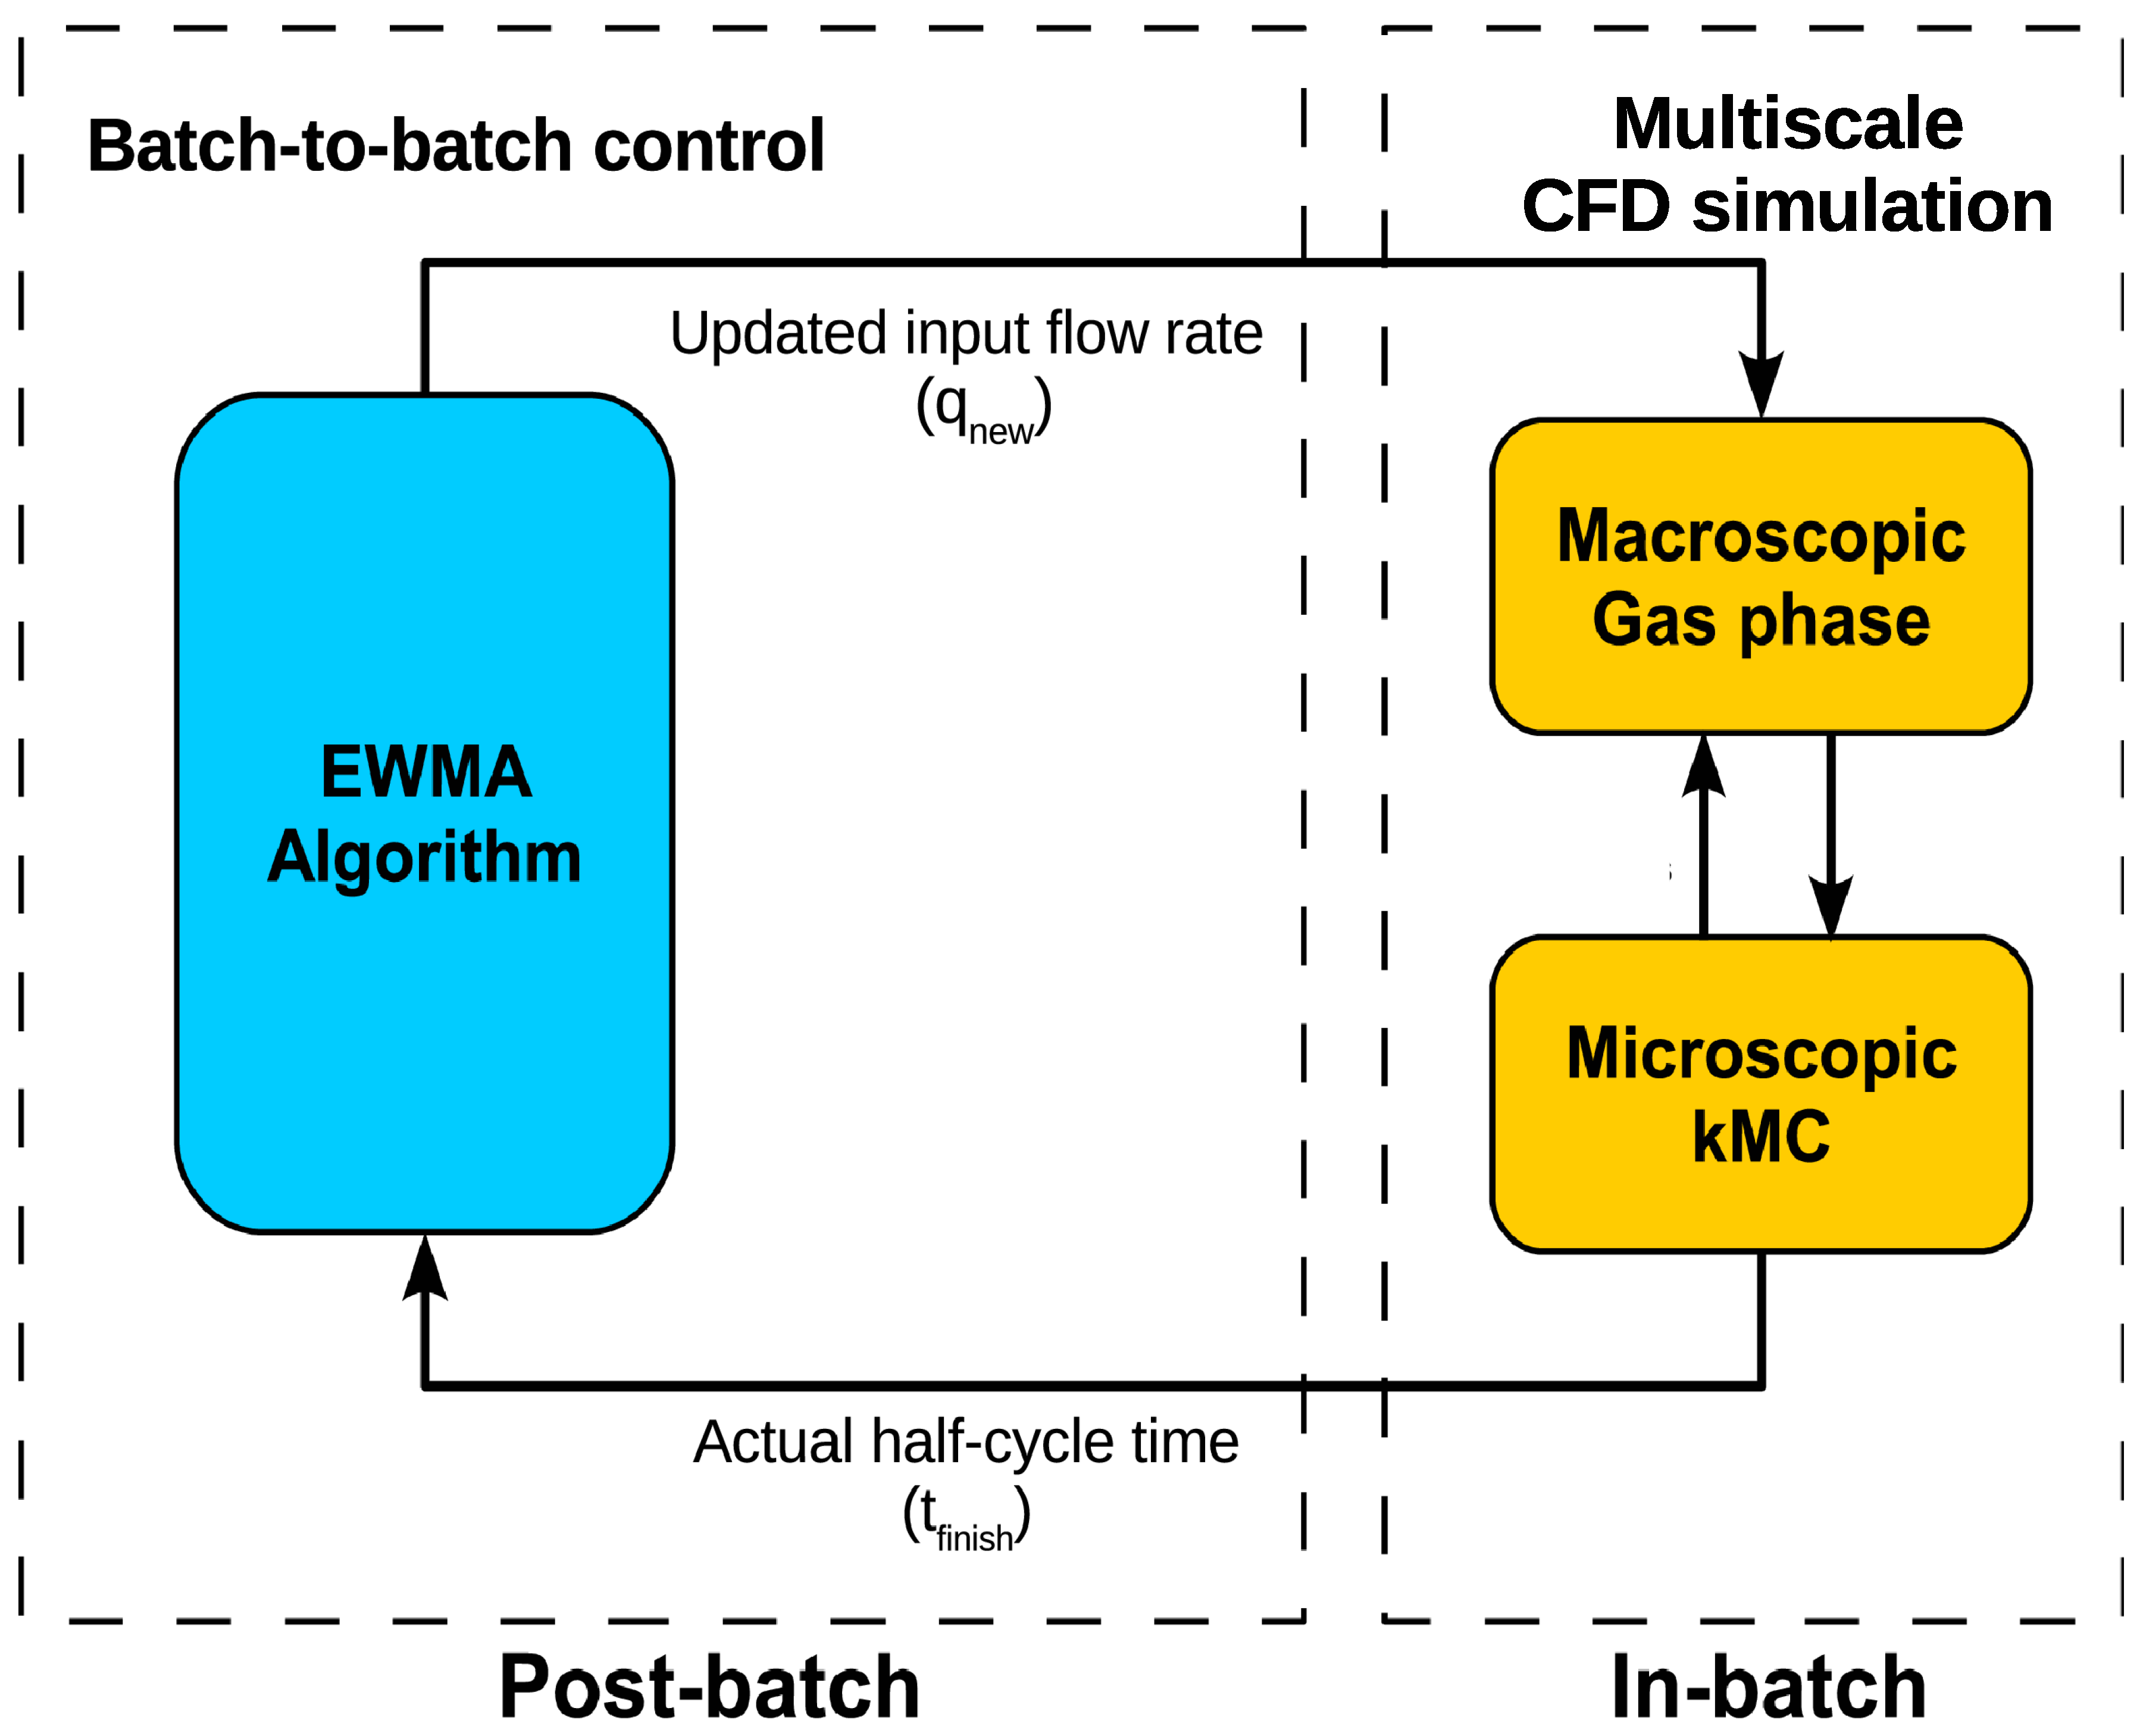
Based on the EWMA algorithm, the R2R controller is integrated with the multiscale CFD model for a closed-loop simulation. As shown in
Figure 7, first the multiscale CFD model simulates the half-cycle time needed with an inlet flow rate of
under a typical disturbance, which is an outlet vacuum pump malfunction that drives the equivalent operating pressure to 500 Pa. In the actual industrial manufacturing, a quartz crystal microbalance (QCM) device placed on the bottom wafers can be used to acquire the full coverage time. The simulated half-cycle time from the CFD model is used to calculate the effective inlet flow rate
with the input-output relationship, and with the EWMA algorithm, the inlet flow rate is updated to
for the next deposition (next CFD simulation). This process is reiterated until the simulated half-cycle time reaches the 100 s set-point. Two learning factors are tested for fast and slow learning rates, respectively, with
and
.
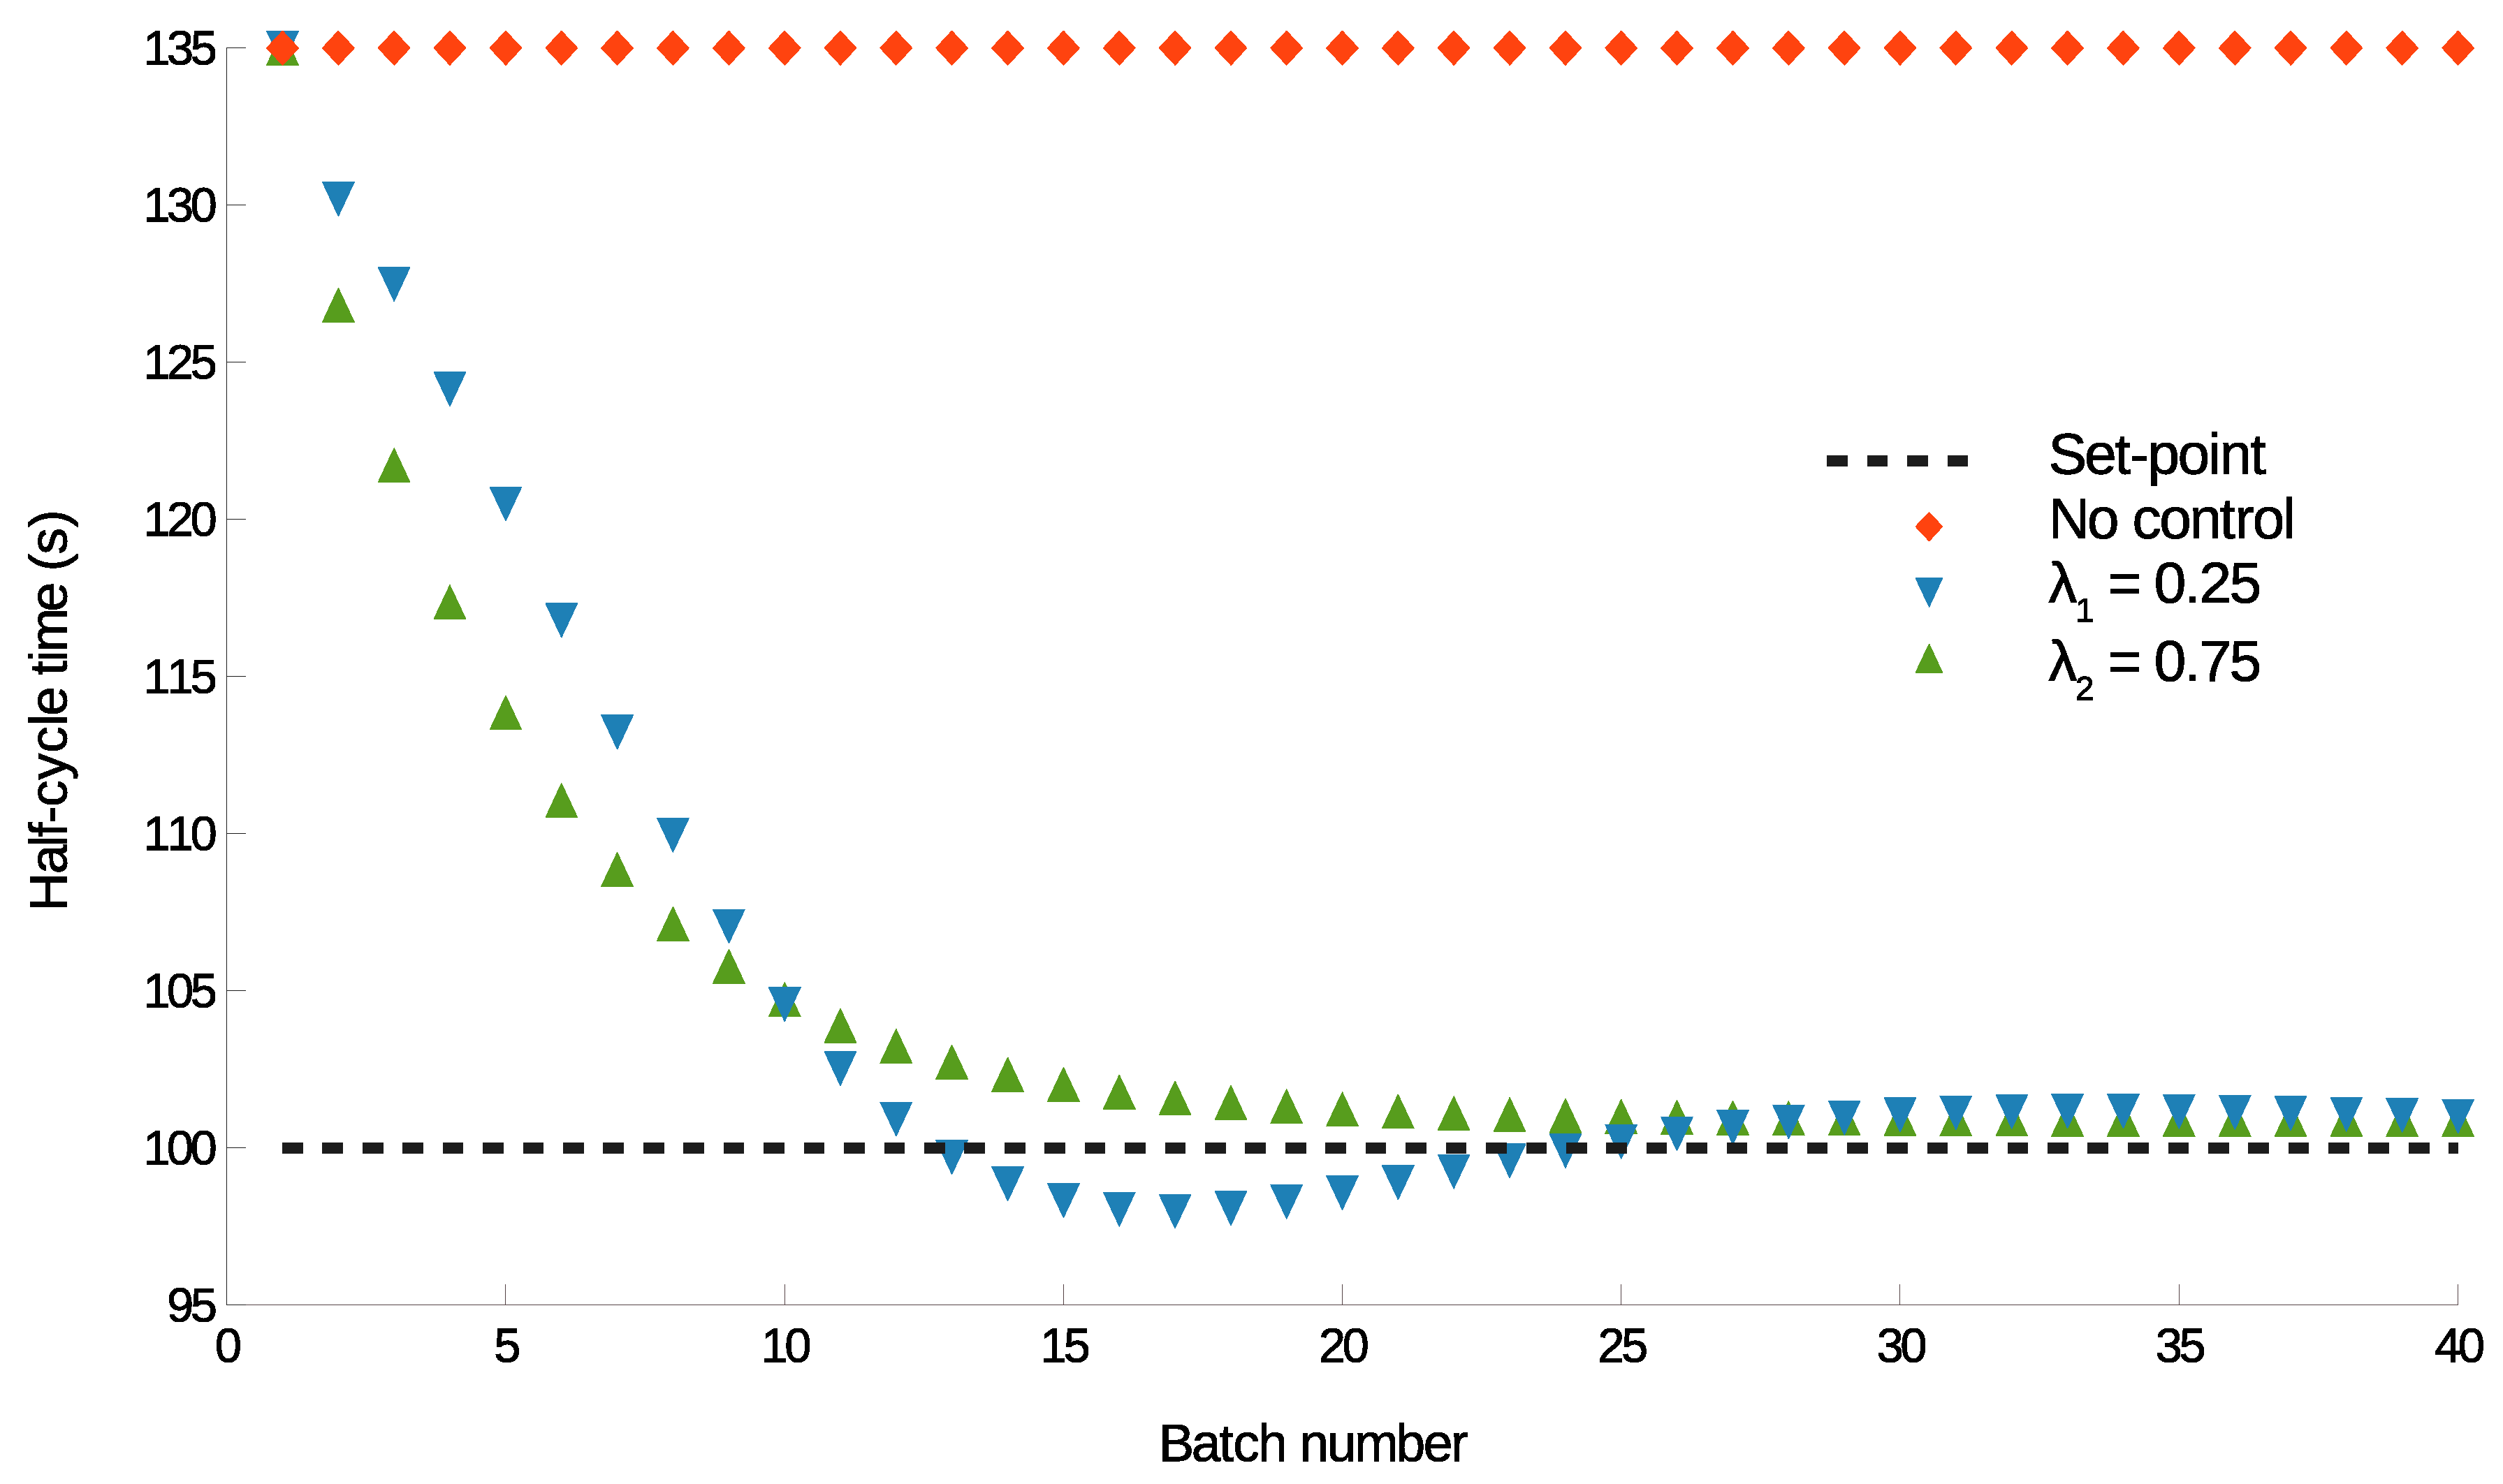
As shown in
Figure 8, upward (green) and downward (blue) triangular data points represent the R2R closed-loop system with learning factors
of 0.75 and 0.25, respectively, and the diamond (red) data points represent the reactor response under the existing pressure disturbance. It is demonstrated that, under the disturbances with no control scheme, the batch ALD reactor is negatively affected. At 100 s, 40% of the wafers cannot reach full coverage, and an alternative half-cycle time of 135 s is required instead for all wafers to reach full coverage. With the R2R control scheme, the input feed flow rate increases gradually, leading to a reduced half-cycle time that eventually achieve the set-point. Also, it is demonstrated that the number of batches required to reach set-point is affected by the learning factor magnitude. For
and
, the half-cycle time first reaches the set-point at about 25 and 12 batches, respectively.
3.2. PI Control of Precursor Partial Pressure
In addition to the R2R control scheme, it is crucial to reduce the effect of disturbances in real-time. As introduced in
Section 1, feedback control schemes, for instance proportional-integral (PI) control and model predictive control (MPC), have been applied to single wafer ALD systems in previous works. It is also important to implement real-time control schemes in multi-wafer ALD reactors, which will lead to a quite substantial economic benefit. Thus, in this work, a PI control scheme is formulated for the furnace ALD system to counteract process disturbances.
3.2.1. PI Controller Design
Similar to the R2R controller, the PI controller is investigated for the standard operating condition. Although the thin-film growth is a batch process, the flow field development in the reactor resembles that of a plug flow reactor at its start-up phase. A gas sensor positioned at the top of the reactor besides the top wafer is chosen for BTBAS partial pressure measurement. Using direct analysis in real time (DART) or a quadruple mass spectrometer (QMS), where an ion source can be used to produce electronically or vibronically excited-state inert species for dopant or ionization, the BTBAS partial pressure can be measured in real-time [
37,
38]. This gas sensing technique has been proven to be compatible for the ALD process [
39]. Also, the chosen precursor BTBAS is a perfectly flammable precursor, suitable for the aforementioned measurement devices [
40].
After around 15 s in each batch, the BTBAS partial pressure at the measurement position reaches the steady-state value of 134.82 Pa, which is the desired partial pressure set-point for the PI controller. Since the rest of the reactor will eventually reach the required partial pressure as long as the sensor position reaches the partial pressure threshold, only the pressure at the sensor position is controlled. Moreover, this threshold partial pressure allows full-coverage for all wafers, despite the vacuum pump variation, which mainly influences the gas-phase transport. To maintain the normal reactor operation and the desired deposition rate, a PI control scheme is used to manipulate the inlet BTBAS mole fraction to drive the partial pressure to the set-point value as shown below:
where
t is the process time, and
and
are both non-negative controller tuning parameters, denoting the magnitude for the proportional (P) and integral (I) terms, respectively.
3.2.2. PI Controller Tuning
In order to determine the appropriate PI controller parameters and , Cohen–Coon tuning rules, the standard PI tuning rule appropriate for non-interactive controller, is utilized to provide an initial estimate for the tuning parameters. First, a step response test is implemented to analyze three important response characteristics: time constant, process gain and dead time, to provide the initial estimate of PI parameters. After the partial pressure at the gas sensor position has reached steady-state, a series of step changes from 13% to 100% of the original inlet precursor mole fraction are tested, while preserving the same inlet feed flow rate. Under associate step responses, the precursor partial pressure at the gas sensor position increases correspondingly, providing the process response characteristics. Then, combining the results from multiple tests and tunings with the CFD simulation, we arrive at an optimal set of tuning parameters: and .
3.2.3. Closed-Loop Operation Results under PI Control
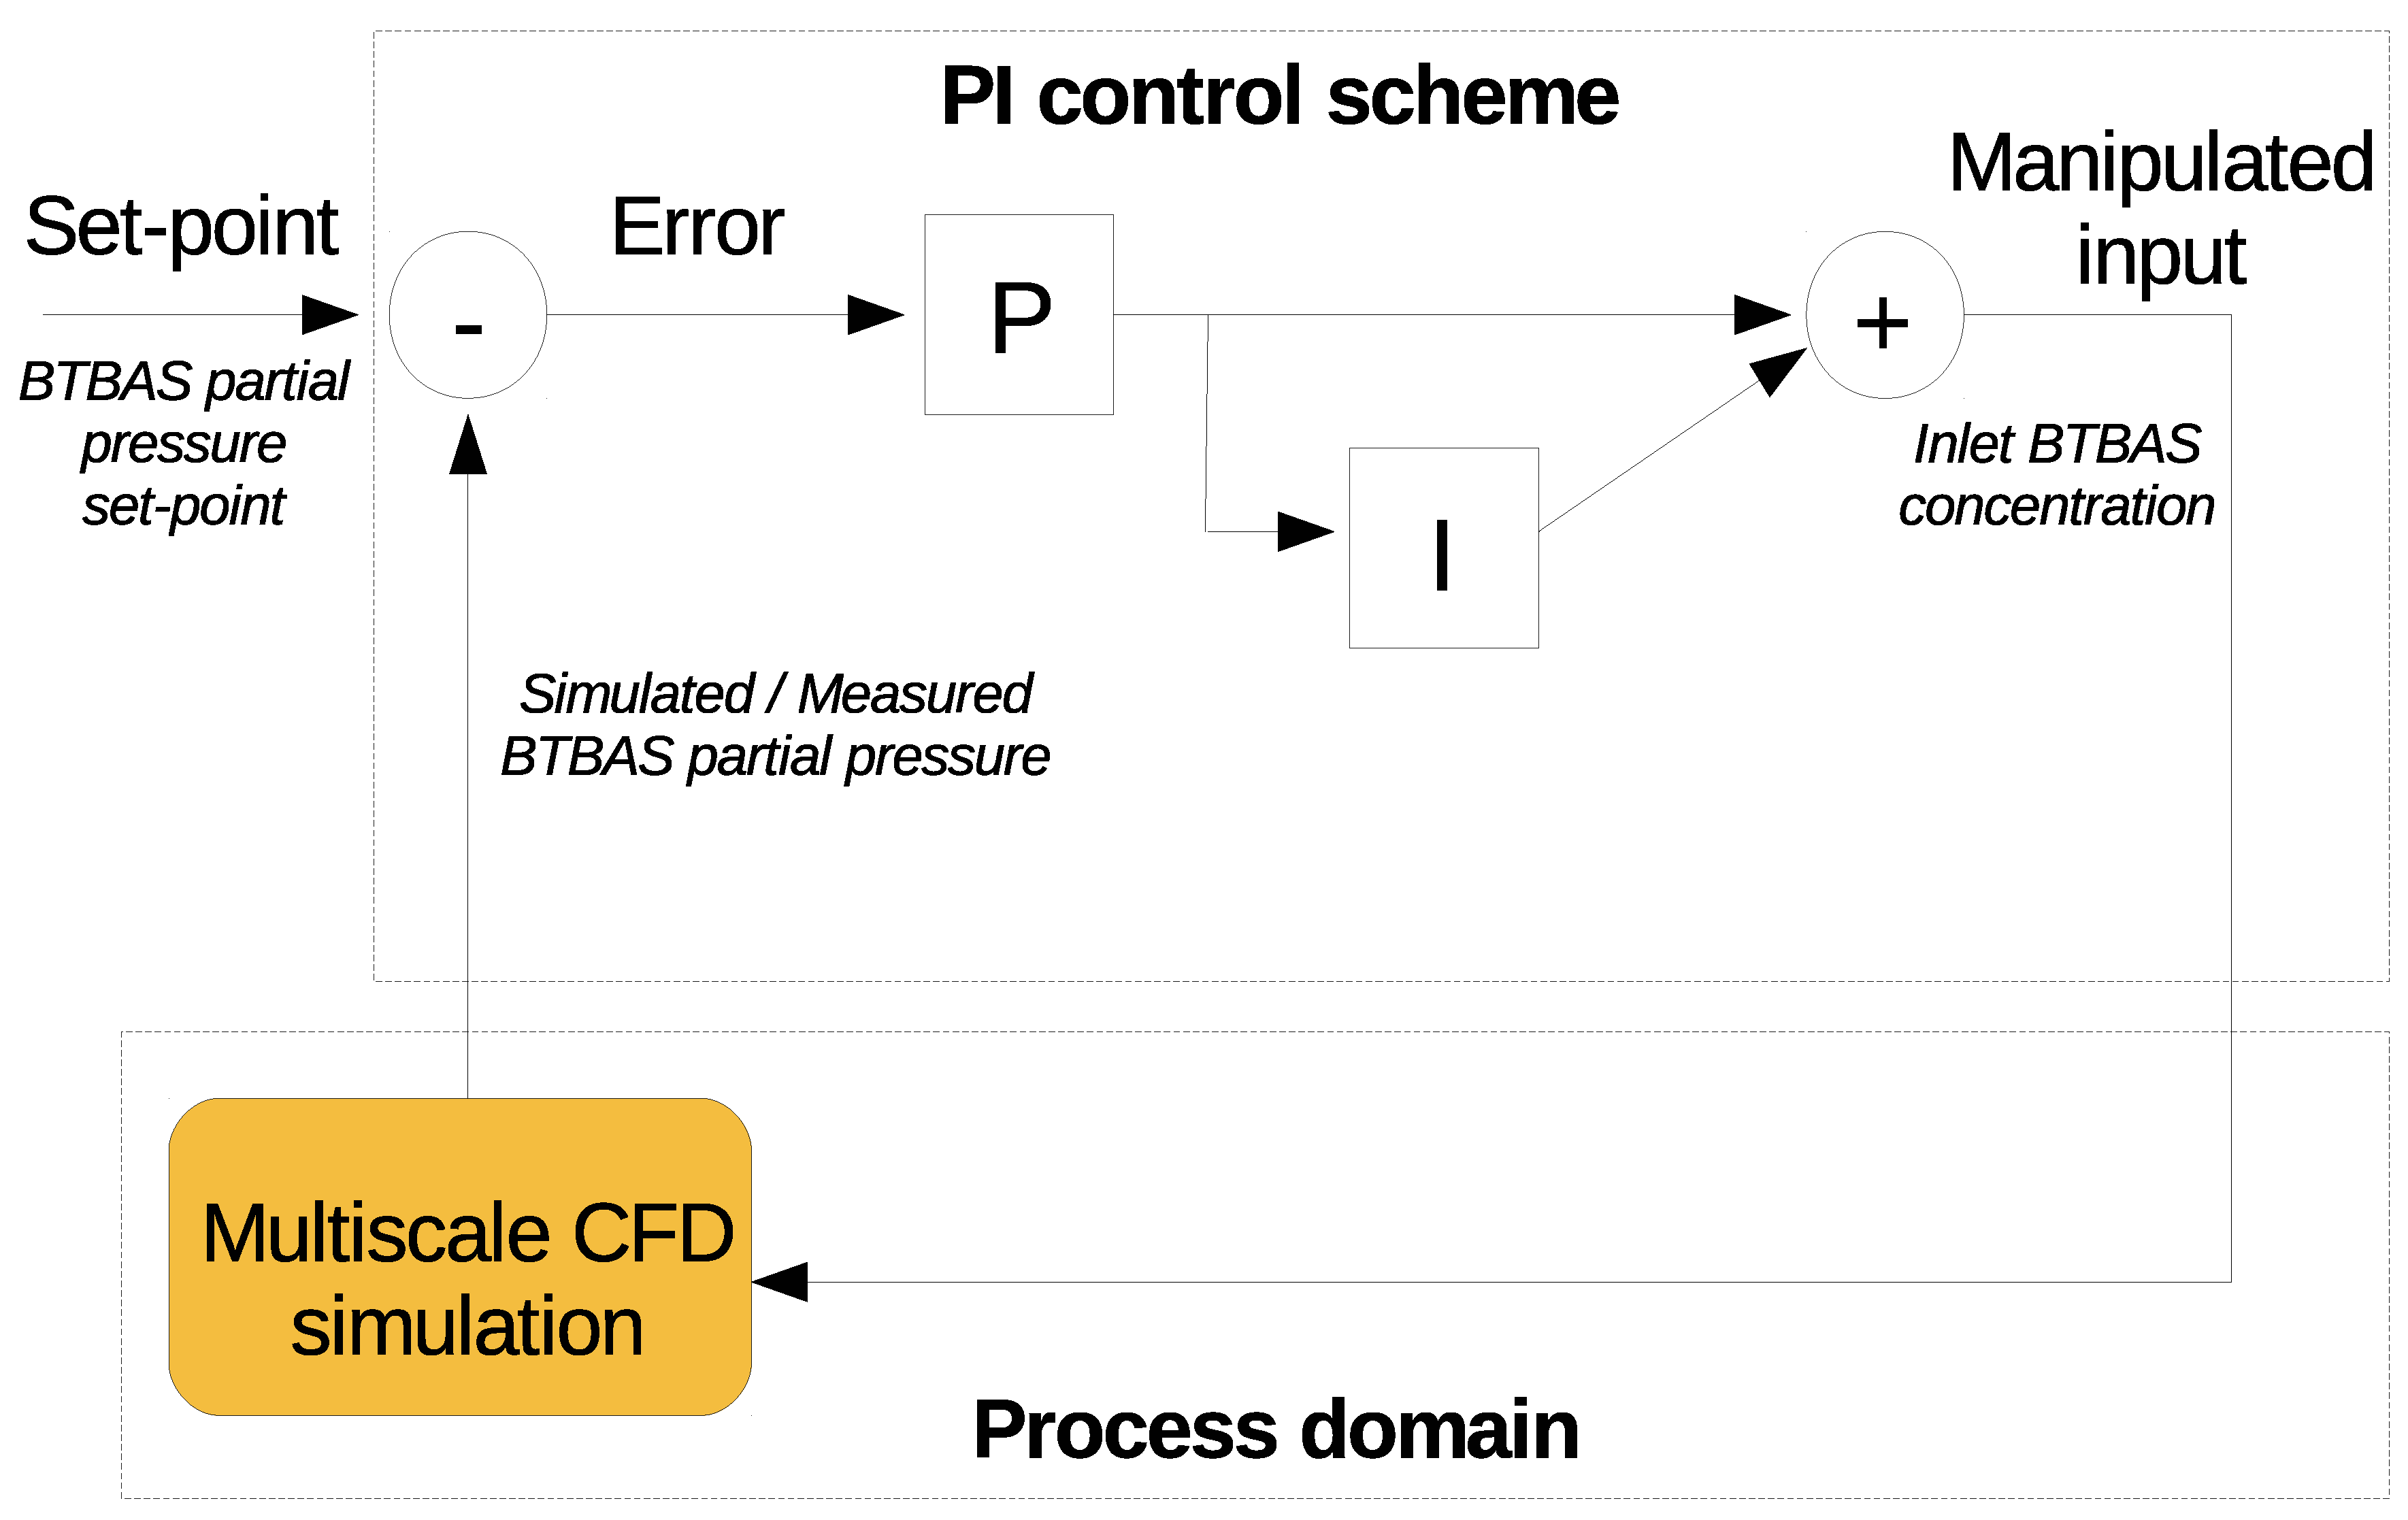
With the calculated set of PI controller parameters, the closed-loop control system is constructed as shown in
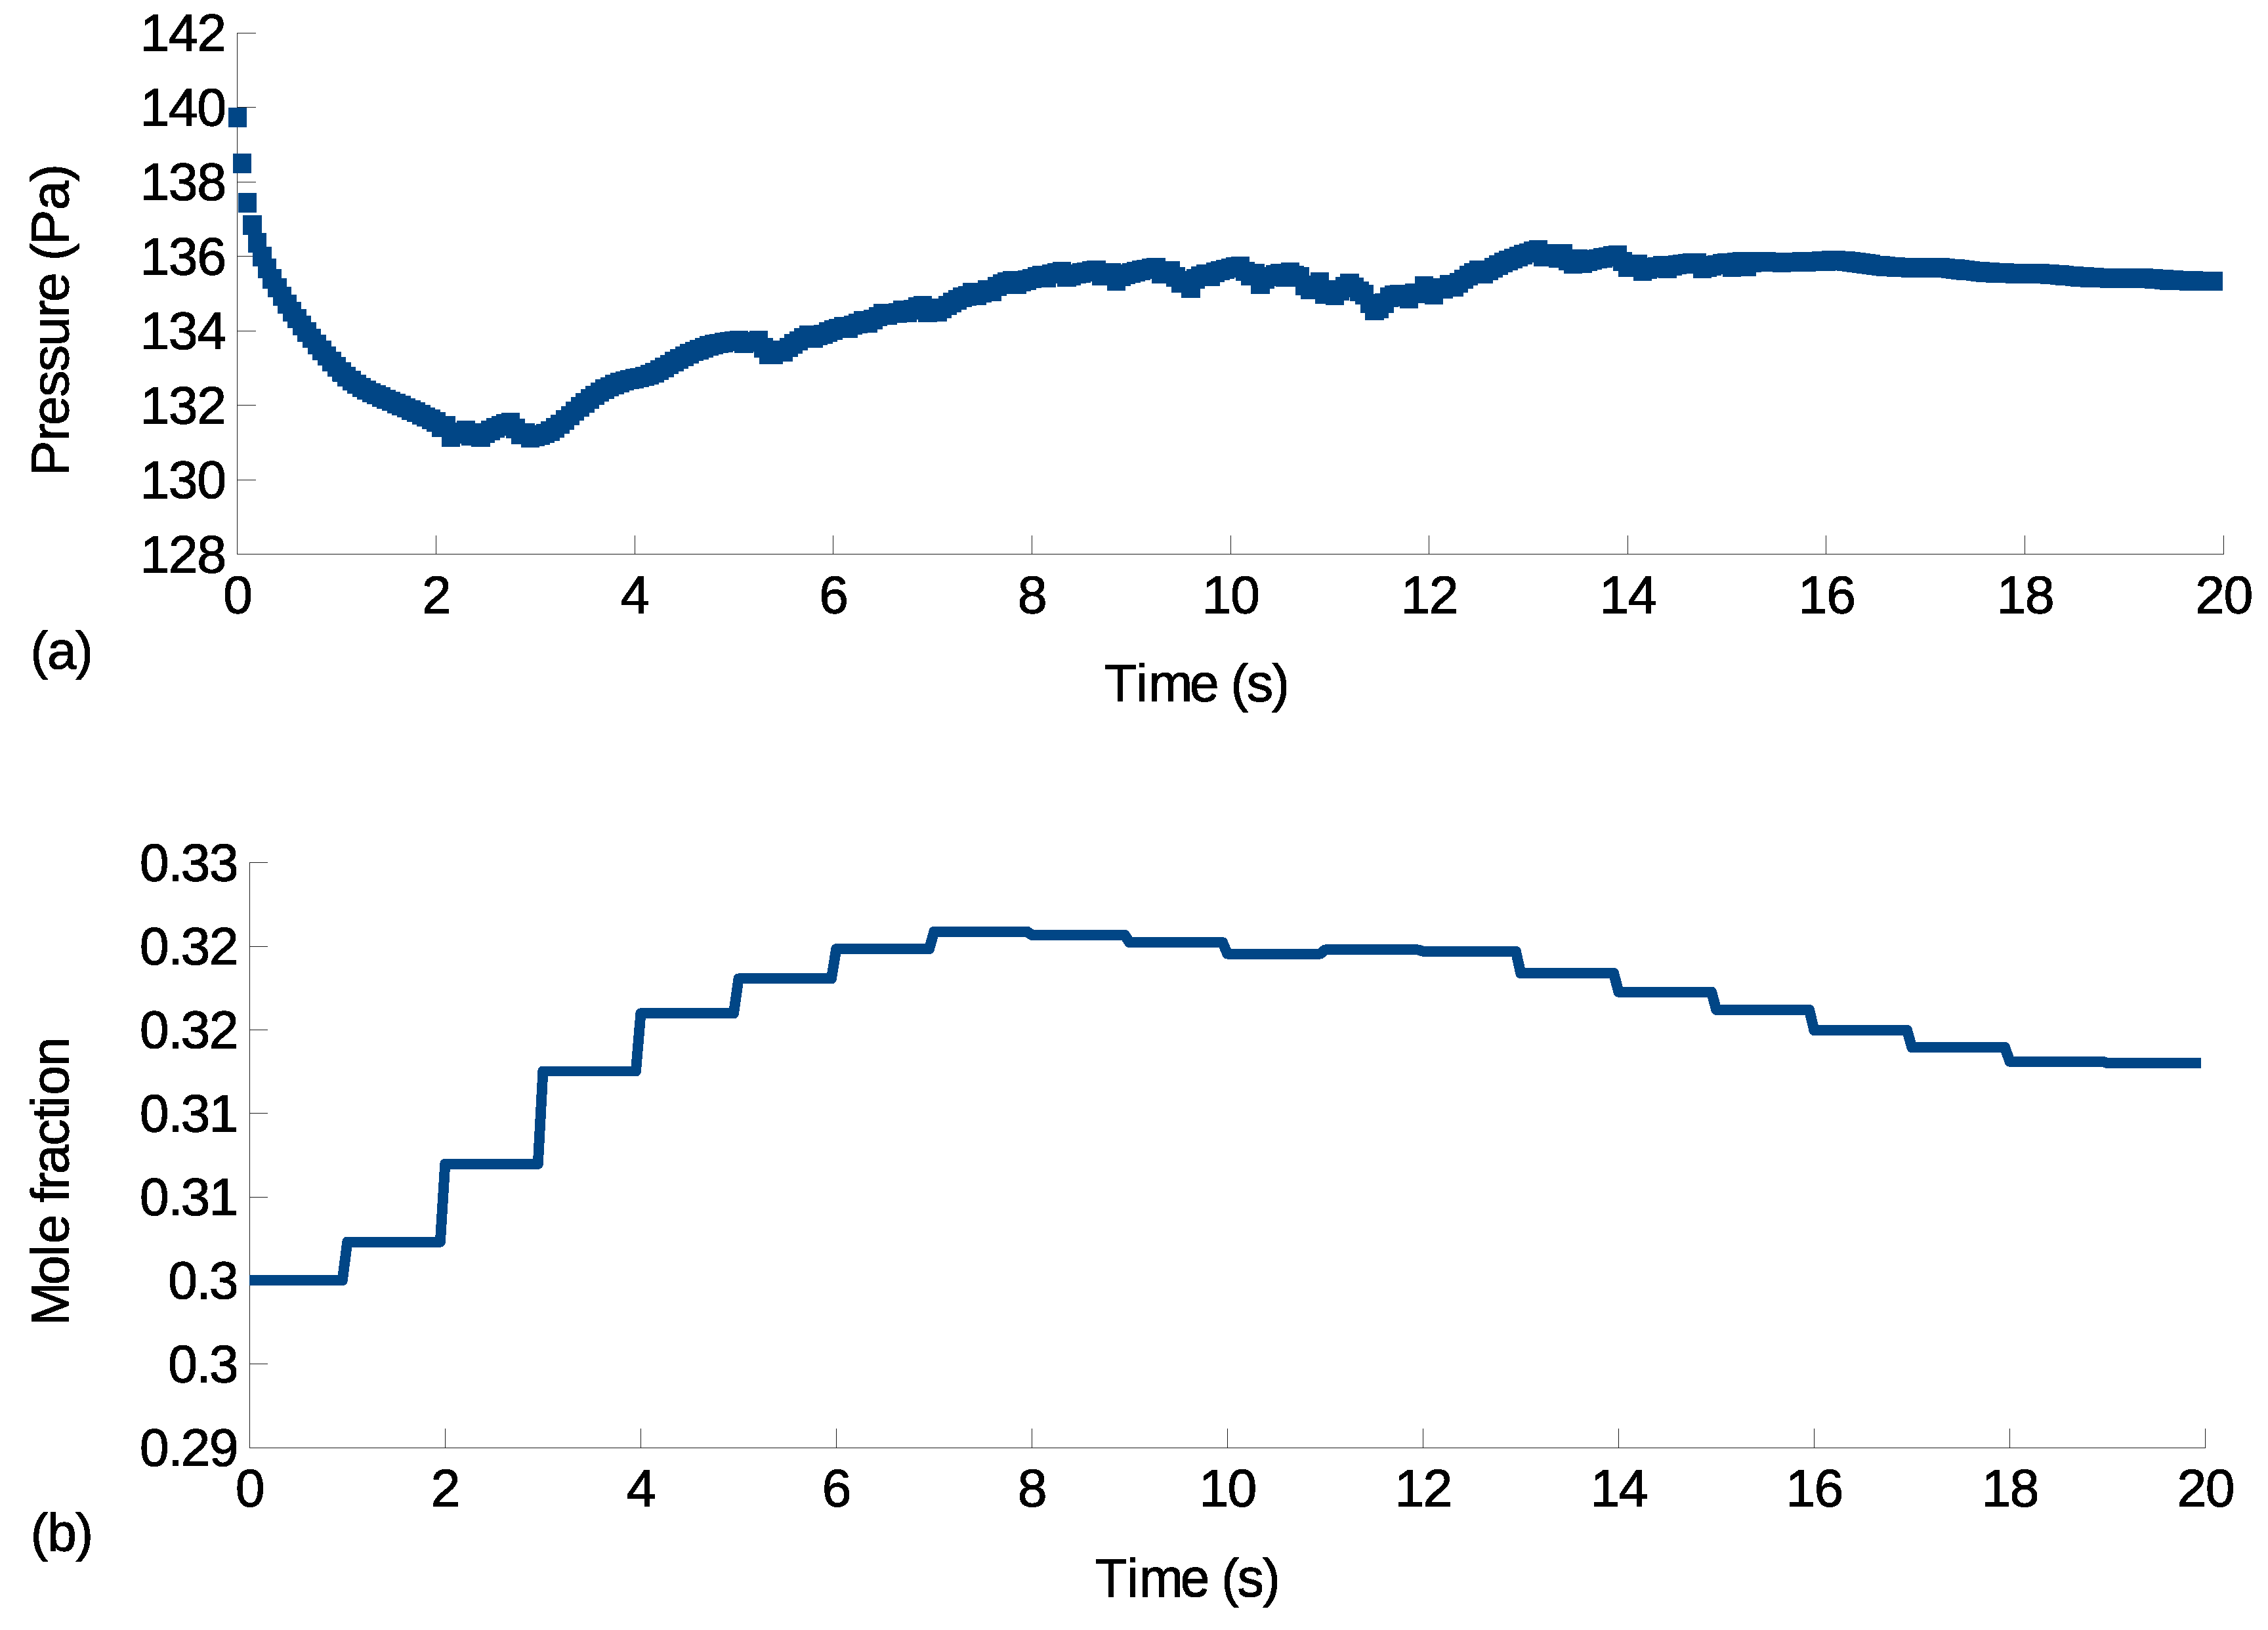
Figure 9. The operating pressure considered here is again a vacuum pump disturbance, which drives the equivalent operating pressure to be 100 Pa. Triggered by the gas sensor measurable variation, which is selected to be a difference of 2% in partial pressure per time step from the steady-state value, the PI controller applies real-time feedback control. As shown in
Figure 10a, it allows the BTBAS partial pressure to reach the set-point value in around 18 s with the increased feed BTBAS mole fraction shown in
Figure 10b. This BTBAS partial pressure valve allows full coverage to be achieved for all wafers but leads to a variation of the half-cycle time.
3.3. Integrated R2R/PI Control Implementation
After the PI and R2R control schemes were separately tuned and validated, the two controllers were integrated to ensure full coverage on all wafers under the assigned half-cycle time. During the first batch of ALD, after the vacuum pump disturbance occurs, the PI controller was implemented with the same activation criterion. At the end of the first batch, the R2R controller was triggered, utilizing the EWMA algorithm with input–output fitting under the updated inlet precursor mole fraction.
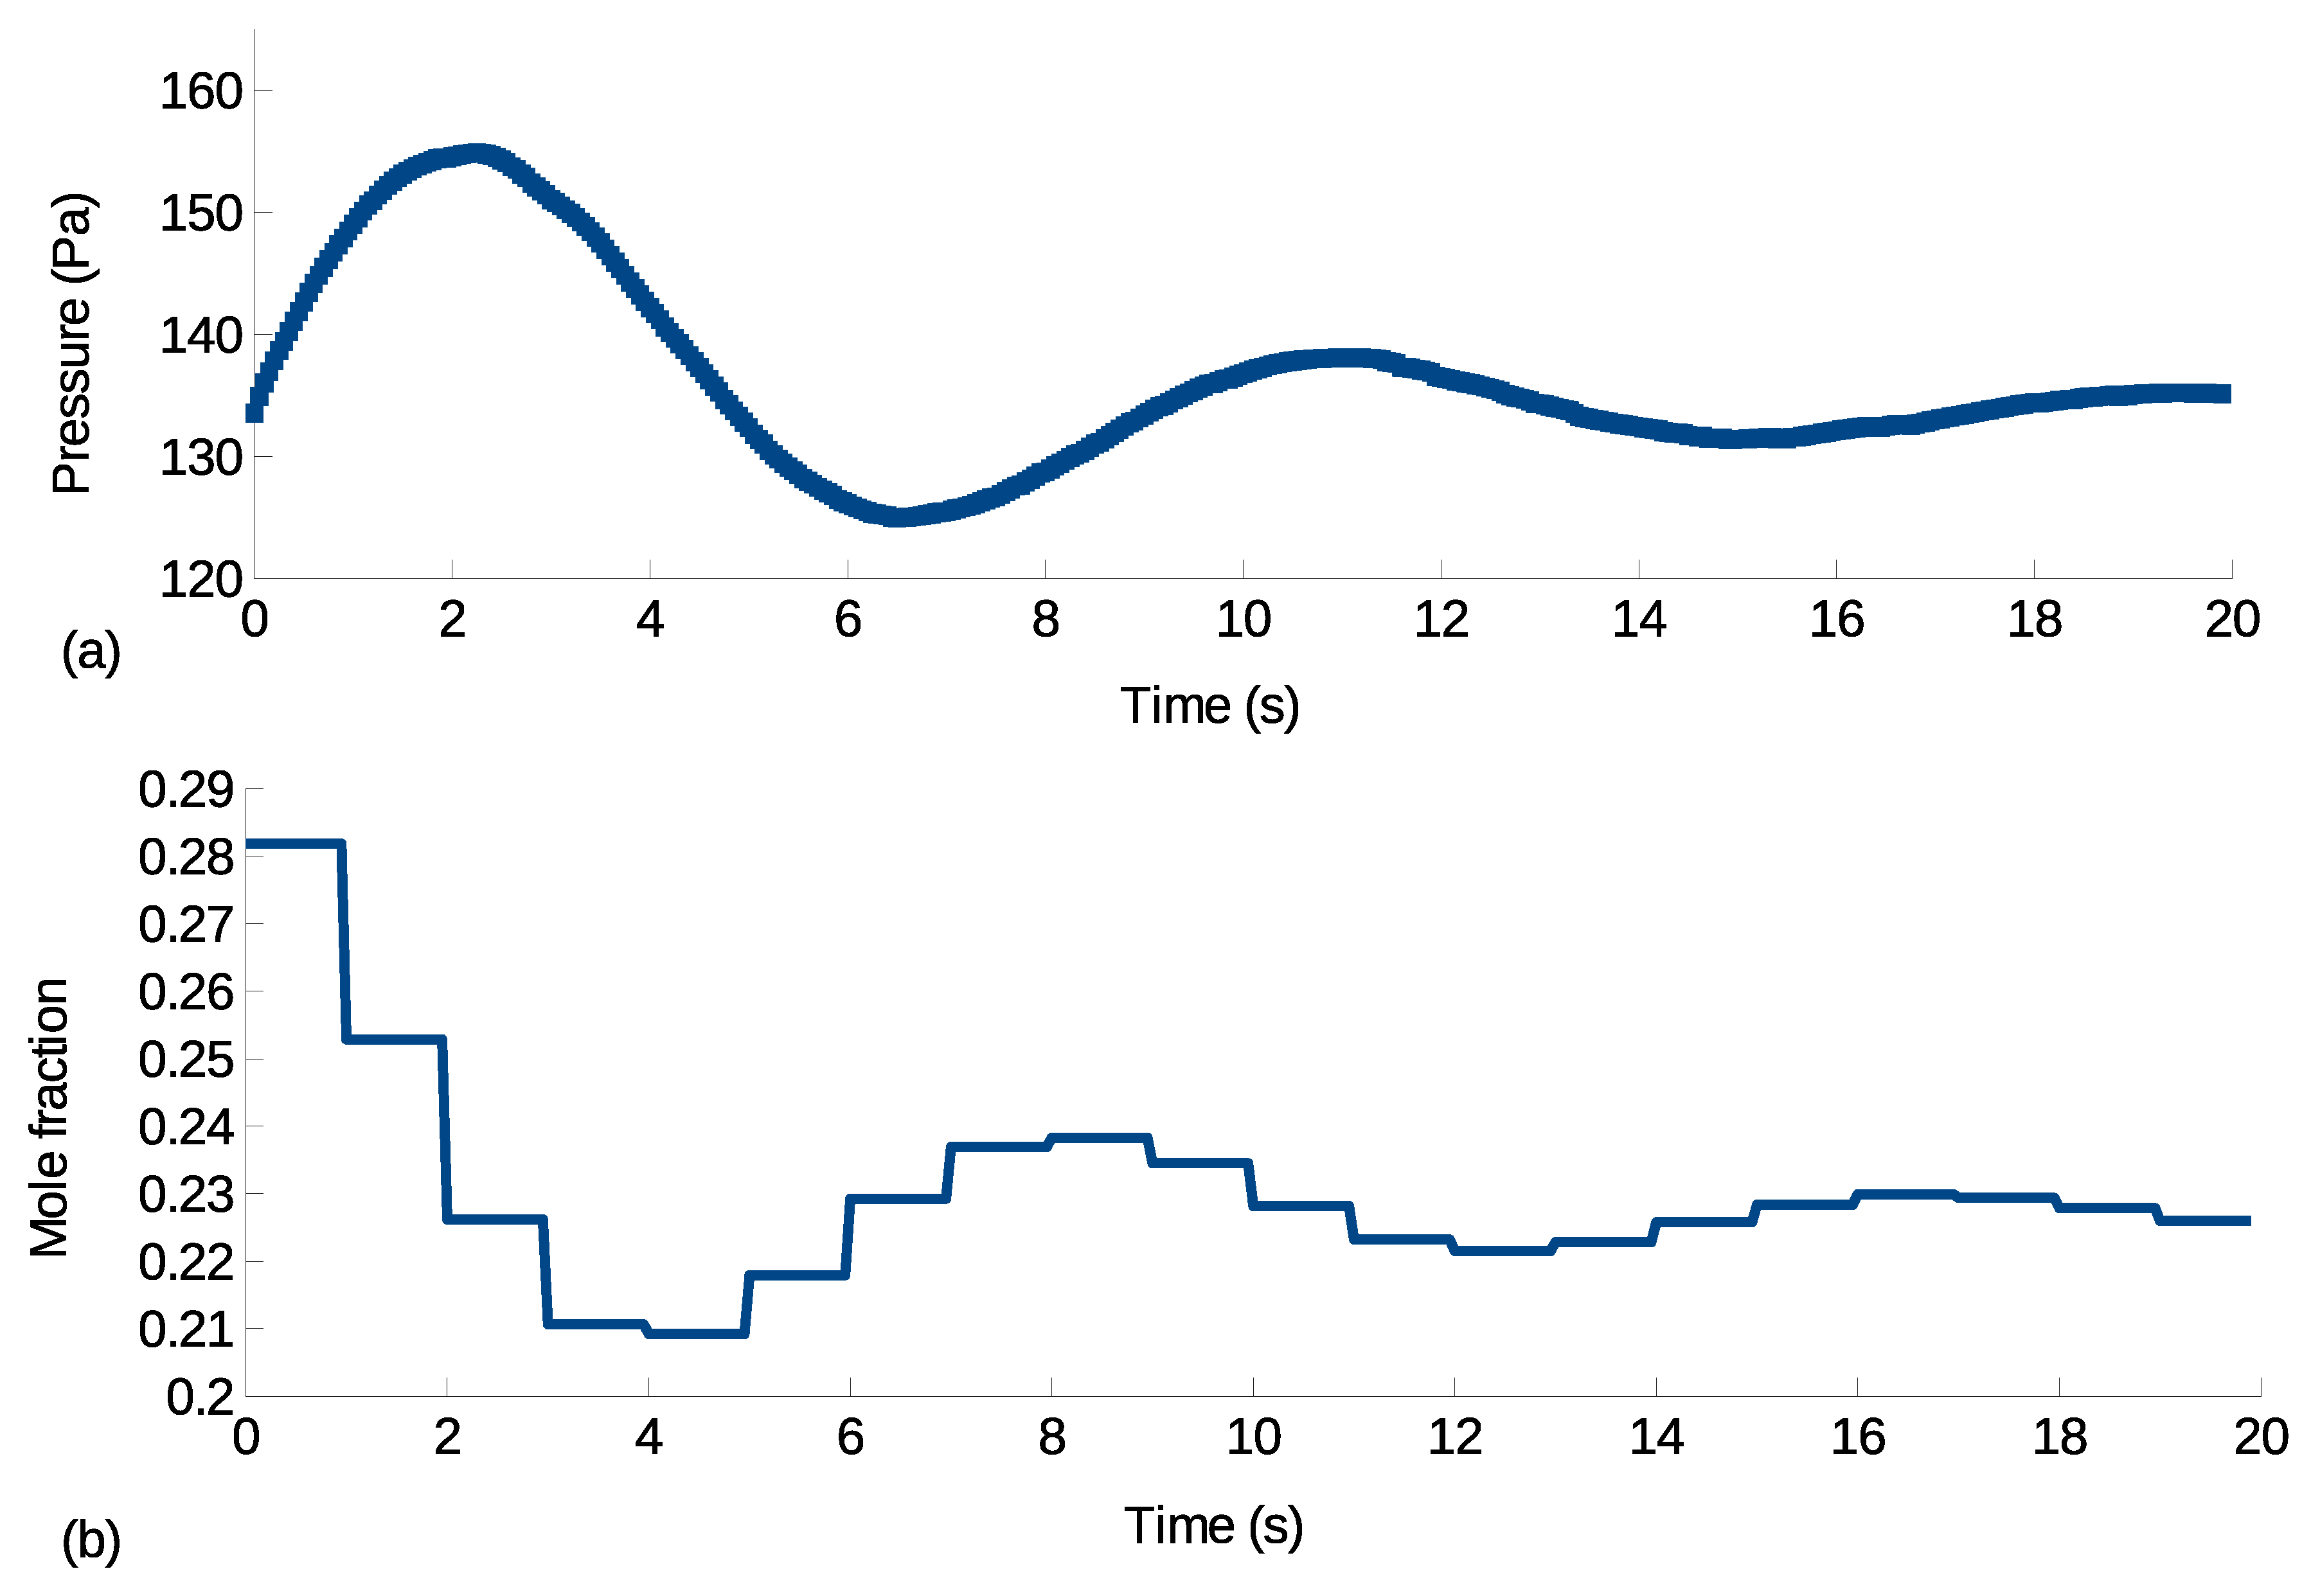
To validate the performance of the integrated R2R/PI control scheme, the vacuum pump disturbance was again introduced in the CFD simulation, which drove the equivalent operating pressure of the reactor to be at 500 Pa. For the real-time feedback control, it was demonstrated that a reduction of inlet BTBAS mole fraction was required to reduce the amount of precursor needed at this pressure. As shown in
Figure 11, a series of control actions with a sampling time of 1 s were carried out according to the PI control scheme, which reduced the inlet feed mole fraction to 0.226 and drove the precursor partial pressure to the set-point and stabilized the process output after 18 s. Also, the controller successfully reduced 23% of the precursor usage in the first batch.
With the updated feed mole fraction determined from the PI controller, the relationship between the inlet flow rate and the half-cycle time,
, under the standard inlet flow rate,
q, range was again determined to be:
According to the reactor response under the updated feed mole fraction, a half-cycle time of 130 s was chosen to be the set-point for the R2R control, and a corresponding
is 1700 sccm. As shown in
Figure 12, the diamond (red) data points represent the simulated half-cycle time under the existing pressure disturbance, and the downward (blue) and upward (green) triangular data points represent those under the R2R control schemes with a learning factor
of 0.25 and 0.75, respectively. It was demonstrated that under the proposed R2R control scheme, the input feed flow rate gradually decreased, leading to an increased half-cycle time, which eventually reached the set-point. Also, as shown in
Figure 12, both learning rates allowed convergence towards the half-cycle set-point, but a learning factor
allowed faster convergences and less overshoot. In addition, without the R2R control scheme, the performance of the batch ALD reactor was negatively affected by the disturbance, resulting in a 5.7% waste of precursors.
4. Conclusions
In this paper, a 2D-axisymmetric multiscale CFD simulation model of a multi-wafer furnace ALD system and the related feedback and run-to-run control schemes were constructed. Specifically, a vertical industrial-scale furnace ALD reactor was investigated for a SiO2 thin-film ALD using BTBAS and ozone as precursors. Firstly, the multiscale CFD model was built and validated, which characterized the dynamic gas-phase transport and the substrate deposition profiles at various wafer locations and generated a valid estimation of the half-cycle time. Next, an R2R controller was built, which successfully updated the inlet flow rate according to the half-cycle time feedback information based on the EWMA algorithm. In addition, a PI controller was formulated, which successfully adjusted the feed precursor mole fraction to maintain the precursor partial pressure at its set-point. The two controllers were combined and validated with a vacuum pump disturbance, which raised the operating pressure to 500 Pa. The resulting integrated control system regulated the precursor partial pressure and the half-cycle time to their respective set-points. Furthermore, full film coverage was demonstrated to be achieved for all substrates, while the total precursor cost was reduced by 31.1%.


