Article

Analysis of Air–Oil Flow and Heat Transfer inside a Grooved Rotating-Disk System

1
China North Vehicle Research Institute, Beijing 100072, China
2
National Key Laboratory of Vehicular Transmission, Beijing Institute of Technology, Beijing 100081, China
*
Author to whom correspondence should be addressed.
Processes 2019, 7(9), 632; https://doi.org/10.3390/pr7090632
Submission received: 18 August 2019 / Revised: 6 September 2019 / Accepted: 11 September 2019 / Published: 18 September 2019
(This article belongs to the Special Issue Smart Flow Control Processes in Micro Scale)

Abstract

:
An investigation on the two-phase flow field inside a grooved rotating-disk system is presented by experiment and computational fluid dynamics numerical simulation. The grooved rotating-disk system consists of one stationary flat disk and one rotating grooved disk. A three-dimensional computational fluid dynamics model considering two-phase flow and heat transfer was utilized to simulate phase distributions and heat dissipation capability. Visualization tests were conducted to validate the flow patterns and the parametric effects on the flow field. The results indicate that the flow field of the grooved rotating-disk system was identified to be an air–oil flow. A stable interface between the continuous oil phase and the two-phase area could be formed and observed. The parametric analysis demonstrated that the inter moved outwards in the radial direction, and the average oil volume fraction over the whole flow field increased with smaller angular speed, more inlet mass flow of oil, or decreasing disk spacing. The local Nusselt number was remarkably affected by the oil volume fraction and the fluid flow speed distributions in this two-phase flow at different radial positions. Lastly, due to the change of phase volume fraction and fluid flow speed, the variation of the average Nusselt number over the whole flow field could be divided into three stages.

1. Introduction

The viscous flow between rotating disks has received special attention for its wide applications, including wet clutches in automatic transmission [1], in hydro-viscous drive [2], and in turbomachinery [3]. The theoretical research of the two-disk flow was first proposed by Von Karman in 1921 [4]. Later, the fundamental flow behaviors of the counter-rotating and the rotor-stator disks were investigated theoretically by Batchelor [5] and Stewartson [6]. Most of the literature on the two-disk flow dealt with the shrouded disk systems, forming the theoretical foundation of the turbomachinery [7]. However, studies on an open disk system are also important, since the theory is the foundation of many applications, such as wet clutches. In the open disk configuration, the flow field becomes a Stewartson-type flow [8]. It has been found that annular or spiral rolls and an Ekman layer exist on a rotor disk [9]. Moreover, traditional research of a flat disk flow field is also focused on the laminar–turbulent transition [10].
In applications of the open disk system, such as mechanical seals and thrust bearings, the disks are featured with complicated surface texture. The load-carrying capacity and the cooling effect are improved by various groove structures on the surface [11,12,13,14,15]. The radial single-phase flow between a grooved rotating disk and a flat stationary disk was investigated analytically and experimentally [16]. Additionally, the effect of grooves on lubricant flow and thermal characteristics was examined for engagement of wet clutches [17,18]. The cooling capacity was notably affected by the single or the two phase flow patterns of the flow field with grooved plates [19,20]. The influence of flow dynamic behavior inside the grooved rotating-disk system on the disk temperature distribution was also demonstrated [21]. A rotating disk model, which is the topological geometry of bearing rotating parts, was established, and the volume of fluid (VOF) method was used to instantaneously track the interface between the oil film and the air on the disk surface [22]. For open wet clutches, the flow changed from single-phase to multi-phase flow in the gap at high speed. The commonly used simplified analytical model was constituted by the multi-phase flow theory of open grooved two-disk systems [23,24]. The flow field of the oil film based on the VOF model was simulated numerically by fluid dynamics simulation software to study the two-phase flow of a hydro-viscous drive [25]. The flow behavior was found to have an enormous effect on mass and heat transfer in the multiphase flows [26,27]. The effects of radial grooves and waffle-shape grooves on disk thermal and torque responses were studied [28]. Several other models were formulated to determine the flow impact on the heat exchange and the temperature distribution in the grooved two-disk system [29,30], including a computational fluid dynamics (CFD) model [31]. The drag torque and the flow pattern in the grooved rotating-disk system also received special focus [1,32,33,34]. It was found that the efficiency of the grooved rotating-disk system varied with flow field parameters [35,36,37]. From the above review, it could be concluded that the flow field would be dramatically affected by the disk configuration and the operation status in the grooved rotating-disk system. The variation of the flow field has a tremendous effect on the operation performance of the grooved rotating-disk system. However, the details of the flow pattern variation under different parametric conditions are still not clear. The heat dissipation characteristics of the flow field in a two-disk system remains to be further studied. Thus, a deeper insight into the interaction between the flow field characteristics and the grooved two-disk system enables potential improvements in practical applications, such as wet clutches.
In this paper, the flow pattern and the heat dissipation of the flow field inside the grooved rotating-disk system is studied. Different from the single phase studies before, the air–oil two-phase flow is investigated. The air–oil phase distribution in the flow field is presented in detail and compared with visualization experimental results. The effects of angular speed of grooved disk, oil flow rate at inlet, and disk spacing on the flow pattern and the oil phase distribution are analyzed. The local and the average Nusselt number was utilized to investigate the heat dissipation capacity of the two-disk system. This research aims to propose a quantitative method for the advanced precision cooling mechanism design of the clutch disk.

2. Grooved Rotating-Disk System Configuration

The schematic of a simplified open grooved two-disk system model is presented in Figure 1. The flow field in the gap is described by a cylindrical coordinate system (r, θ and z), indicating the radial, the azimuthal, and the axial coordinates, respectively. The disk with the radial grooves rotates axially with an angular velocity ω, and the stationary disk is ungrooved. There is a gap H between two disks. The groove area is defined by the groove number Ng and the circumferential angle of each single groove. The groove depth of the textured disk is h, and r1 and r2 represent the inner and the outer radii of the disks, respectively. A dimensionless radial location r/r2 is defined to analyze the parameter effects.
An oil volumetric flow rate Q, which is assumed to be a constant temperature (320 K), is prescribed at the inner radius surface as the inlet boundary condition, while an ambient pressure is prescribed at the outer radius surface as the outlet boundary condition. For the heat transfer process, the thermal effect of the system is coupled in the model by considering the heat conduction of disks and the heat convection between fluid and disks. In spite of a rather small gap and the viscous shear of the fluid, the viscous heating effect of oil is omitted, since the oil is supplied continuously at the inner radius, and the heat of viscous friction is taken away. The stationary ungrooved disk is assumed to be a heat source with a constant heat flux uniformly distributed on the surface. A stationary wall boundary condition is specified on the surface of the stationary disk. The surface of the rotating grooved disk is specified as an adiabatic wall boundary condition with a constant angular speed.

3. Grooved Rotating-Disk System Modeling

3.1. Governing Equations

In the present study, the flow field transits from single-phase flow to air–oil two-phase flow with the increasing speed of the grooved disk. Thus, a three-dimensional CFD approach dealing with a multiphase flow problem presented for the open grooved two-disk system [31] was utilized in this flow field simulation. In the visualization experiment, it was found that the air–oil interface between the inner and the outer radii of the grooved disk was rather stable after the rotating speed of the grooved disk was reached and kept constant. Thus, a steady-state model was established. The model was developed using the commercial software ANSYS FLUENT 15.0. In this model, the VOF approach developed by Hirt and Nichols [38] was adopted to track the two-phase interface of the air and the oil. A volume fraction φoil was used to mark the volume fraction of the oil phase. In the model, φoil = 1 represents the pure oil phase in a cell, while φoil = 0 represents the cell full of air phase. If 0 < φoil < 1, it describes the air–oil two-phase interface. The volume fractions of two phases satisfy the following constraint:
φ a i r + φ o i l = 1
In the VOF method, the flow properties are averaged by phase volume fraction [39]. The density, the dynamic viscosity, and the effective thermal conductivity coefficients of the air–oil two-phase flow are given by:
ρ = φ o i l ρ o i l + ( 1 φ o i l ) ρ a i r
μ = φ o i l μ o i l + ( 1 φ o i l ) μ a i r
k e f f = φ o i l k o i l + ( 1 φ o i l ) k a i r
The governing equations of the CFD method are the momentum equation, the continuity equation, and the energy equation. These equations are solved in the VOF multiphase model. The VOF model solves one single momentum equation, and the velocity field results are shared among both phases and result in a direct velocity coupling of the phases at the interface [34]. This computational model selects steady reference frame. The simulation is steady-state, and the transient terms in the governing equations are omitted.
The continuity equation is:
( ρ υ ) = 0
The momentum equation is:
( ρ υ υ ) = ( μ ( υ + ( υ ) T ) ) p + ρ g + F
Equations (2) and (3) were implemented as the averaged dynamic viscosity and the density of the fluid in the above equations. υ denotes the velocity vector of fluid, p is the pressure of fluid, g is the gravity acceleration vector, and F denotes the surface tension source term. The surface tension force is given as:
F i = σ ρ κ i φ i ( ρ i + ρ j ) / 2
where i and j denote the air and the oil phase, respectively. σ is the surface tension coefficient assumed to be constant 0.03 N/m in this simulation. κi is the surface curvature at the interface defined as the divergence of the unit normal. For two phases presented in a cell, κi = −κj.
κ i = n ^ i
where:
n ^ i = n ^ w cos θ w + t ^ w sin θ w
θw is contact angle at the wall. θw = 9.3° and 10.1° on the surfaces of the stationary disk made of quartz glass and the rotating aluminum disk, respectively. The data were obtained from the contact angle test results described in reference [40]. n ^ w and t ^ w are the unit vectors normal and tangential to the interface, respectively. Since the surface tension coefficient was assumed to be constant, the Marangoni effect was neglected due to zero surface tension gradient.
In the simulation, the air phase was set as the primary phase. The continuity equation of the air phase was solved first, given as:
( α a i r ρ a i r υ a i r ) = 0
After obtaining the volume fraction of the air phase in a cell, the volume fraction of the oil was determined from the constraint (1) as:
φ o i l = 1 φ a i r
The energy equation omitting radiation as a source term for the fluid domain was deduced as [41]:
( υ ρ E ) = ( k e f f T )
where:
E = φ o i l ρ o i l E o i l + ( 1 φ o i l ) ρ a i r E a i r φ o i l ρ o i l + ( 1 φ o i l ) ρ a i r
The energy equation for the solid domain is:
( k s T ) = 0
where T denotes the temperature shared between the air and the oil phases, keff represents the effective thermal conductivity of the two-phase flow given by Equation (4), φ is the fluid volume fraction, E is the specific sensible enthalpy, and ks denotes the thermal conductivity of the solid structure. The oil and air subscripts identify the oil and the air parameters, respectively.

3.2. Computational Model

Since the flow was assumed to be axisymmetric, one single-groove section (a 36° section) of disk was selected, and a periodic boundary condition was adopted in the simulation. In terms of boundary conditions, the moving disk was the rotating wall surface, and the static disk was the stationary wall surface. The standard wall function method was adopted to deal with the flow near the wall surface. The model inner diameter was the inlet of the flow field and was set as the mass-flow-inlet condition. The outer diameter was the outlet of the flow field. Since the outlet of the flow field was connected with the atmosphere, it was set as the pressure-outlet, and the pressure was the standard atmospheric pressure. In order to better simulate the flow details of the disk clearance flow field, the mesh needed to be encrypted near the disk wall and the radial slot wall. The flow field was discretized by a structured mesh scheme. The Green Gauss node-based method was used for the evaluation of gradients. The momentum and the energy equations were solved by the QUICK scheme [42]. The PRESTO! (Pressure staggering option) scheme was employed for the discretization of the pressure. A continuum surface force model proposed by Brackbill et al. [43] was applied in this calculation. Interface reconstruction was performed using the explicit piecewise linear interface construction (PLIC) scheme [44]. To handle the two-phase flow condition, it was assumed that the inlet was filled with oil, thus the oil volume fraction was one at the inlet. In this paper, the convergence of the calculation was determined by monitoring the residual error and the flow parameters. The numerical results were obtained when the drag torque, the volume average oil phase, and the area average wall surface heat transfer coefficient were stable. To ensure the accuracy and the validity of numerical results, a careful check for the grid independence of the numerical solutions was conducted. Three sets of mesh resolutions were adopted for the flow field with 307,644 (Mesh 1), 365,796 (Mesh 2), and 439,432 (Mesh 3). In Table 1, the calculated results of the average oil volume fraction with different angular velocities are given. The differences between the mesh density of 307,644 elements and the other two were smaller than 5%, indicating that a higher resolution of mesh than Mesh 1 limited improvement on the calculation result. Mesh 1 basically satisfied the requirement of accuracy. Considering the reduction of computational time consumption, Mesh 1 was selected in the simulation model.

4. Experimental Apparatus

A flow field test platform for the grooved rotating-disk system was built based on the Bruker’s Universal Mechanical Tester, as shown in Figure 2. The platform consisted of a rotating grooved disk, a stationary ungrooved disk, a peristaltic oil pump, a data acquisition system, and a control system. The rotating disk was driven by an electric motor, and the precision of the controlled disk speed was 1.0 r/min. The gap between the stationary disk and the rotating disk could be adjusted continuously with the precision of 10 μm. In the test, the gap was set to be zero at first. The measured force in the axial direction was used to detect the zero-gap position. Then, the gap was increased gradually from zero position to a prescribed position. The pump could supply a maximum volumetric flow rate of 1000 mL/min with the accuracy of 1.0 mL/min. When the flow field became uniform and stable, the visualized image of the flow field was captured. The specifications of the grooved rotating-disk system in the test are shown in Table 2.

5. Results and Discussion

5.1. Flow Field Visualization

The flow field simulation and the visualization test were conducted under the condition of the rotating speed of the grooved disk ω = 18.8 rad/s, the disk spacing H = 1.8 mm, and the inlet volumetric flow rate of oil Q = 40 mL/min. The comparison of oil volume fraction distribution between the simulation result and the visualization test of the flow field is shown in Figure 3. The 3D contour of the oil phase distribution is presented in Figure 4. In general, a two phase flow was exhibited in the flow field in the simulation. The simulation demonstrated that the oil film was continuous and complete near the inlet of the flow field. The air entrainment and the decrease of oil volume fraction took place radially between the inlet and the outlet, presenting an air–oil two-phase flow. There was a clear interface formed between the continuous oil phase and the two-phase area. Near the outlet surface, the oil volume fraction became close to zero, indicating an air phase flow. Previous studies also showed that a sufficient flow rate could ensure that the oil phase filled the entire flow field at a given disk speed and gap [24]. However, in practice, the flow rate was not enough when the rotating speed increased continuously. Then, the air entered the gap from the periphery of the disk gap to ensure the continuity of the flow, which could be observed from the streamline simulation of air phase in Figure 5. In the visualization test result, the inner and the outer radii of the grooved disk were specified as the inlet and the outlet, as marked in Figure 3. A relatively stable boundary between the continuous oil phase and the aerated part could also be clearly observed. The boundary was considered to be the air–oil interface, as shown in Figure 3. Obviously, the visualization test also showed the same flow. In conclusion, the simulated oil volume fraction distribution correlated well with the visualization test result. The CFD model was therefore validated through this comparison.
Figure 5 illustrates the contour surface of φoil = 0.75 and the streamline of fluid flow. From the contour surface of φoil = 0.75 and the 3D contour of oil phase distribution in Figure 4, the oil phase occupied more area on the stationary disk surface than the rotating disk surface. The flow of oil gathered around the grooved zone. From the flow streamline in Figure 5, it can be noted that the oil flowed circumferentially along the ungrooved surface within the continuous film. The oil phase flowed into the radial groove and then came out, retaining circumferential flow status. Outside the interface of the continuous oil film, the oil phase was aerated and became a two-phase flow. The two-phase flow mainly discharged through the radial groove. Near the outer edge of disks, the air phase entered through the radial groove and flowed circumferentially in the ungrooved area. From the above observations, it can be deduced that a better cooling effect around the groove could be achieved due to a stronger mixing and heat exchange of oil and air around the grooved area. In practice, the oil flow was mainly used to provide sufficient cooling capability, especially in the high-speed operation. Thus, a sufficient assessment of the flow inside the groove was helpful for the heat dissipation.

5.2. Parametric Analysis

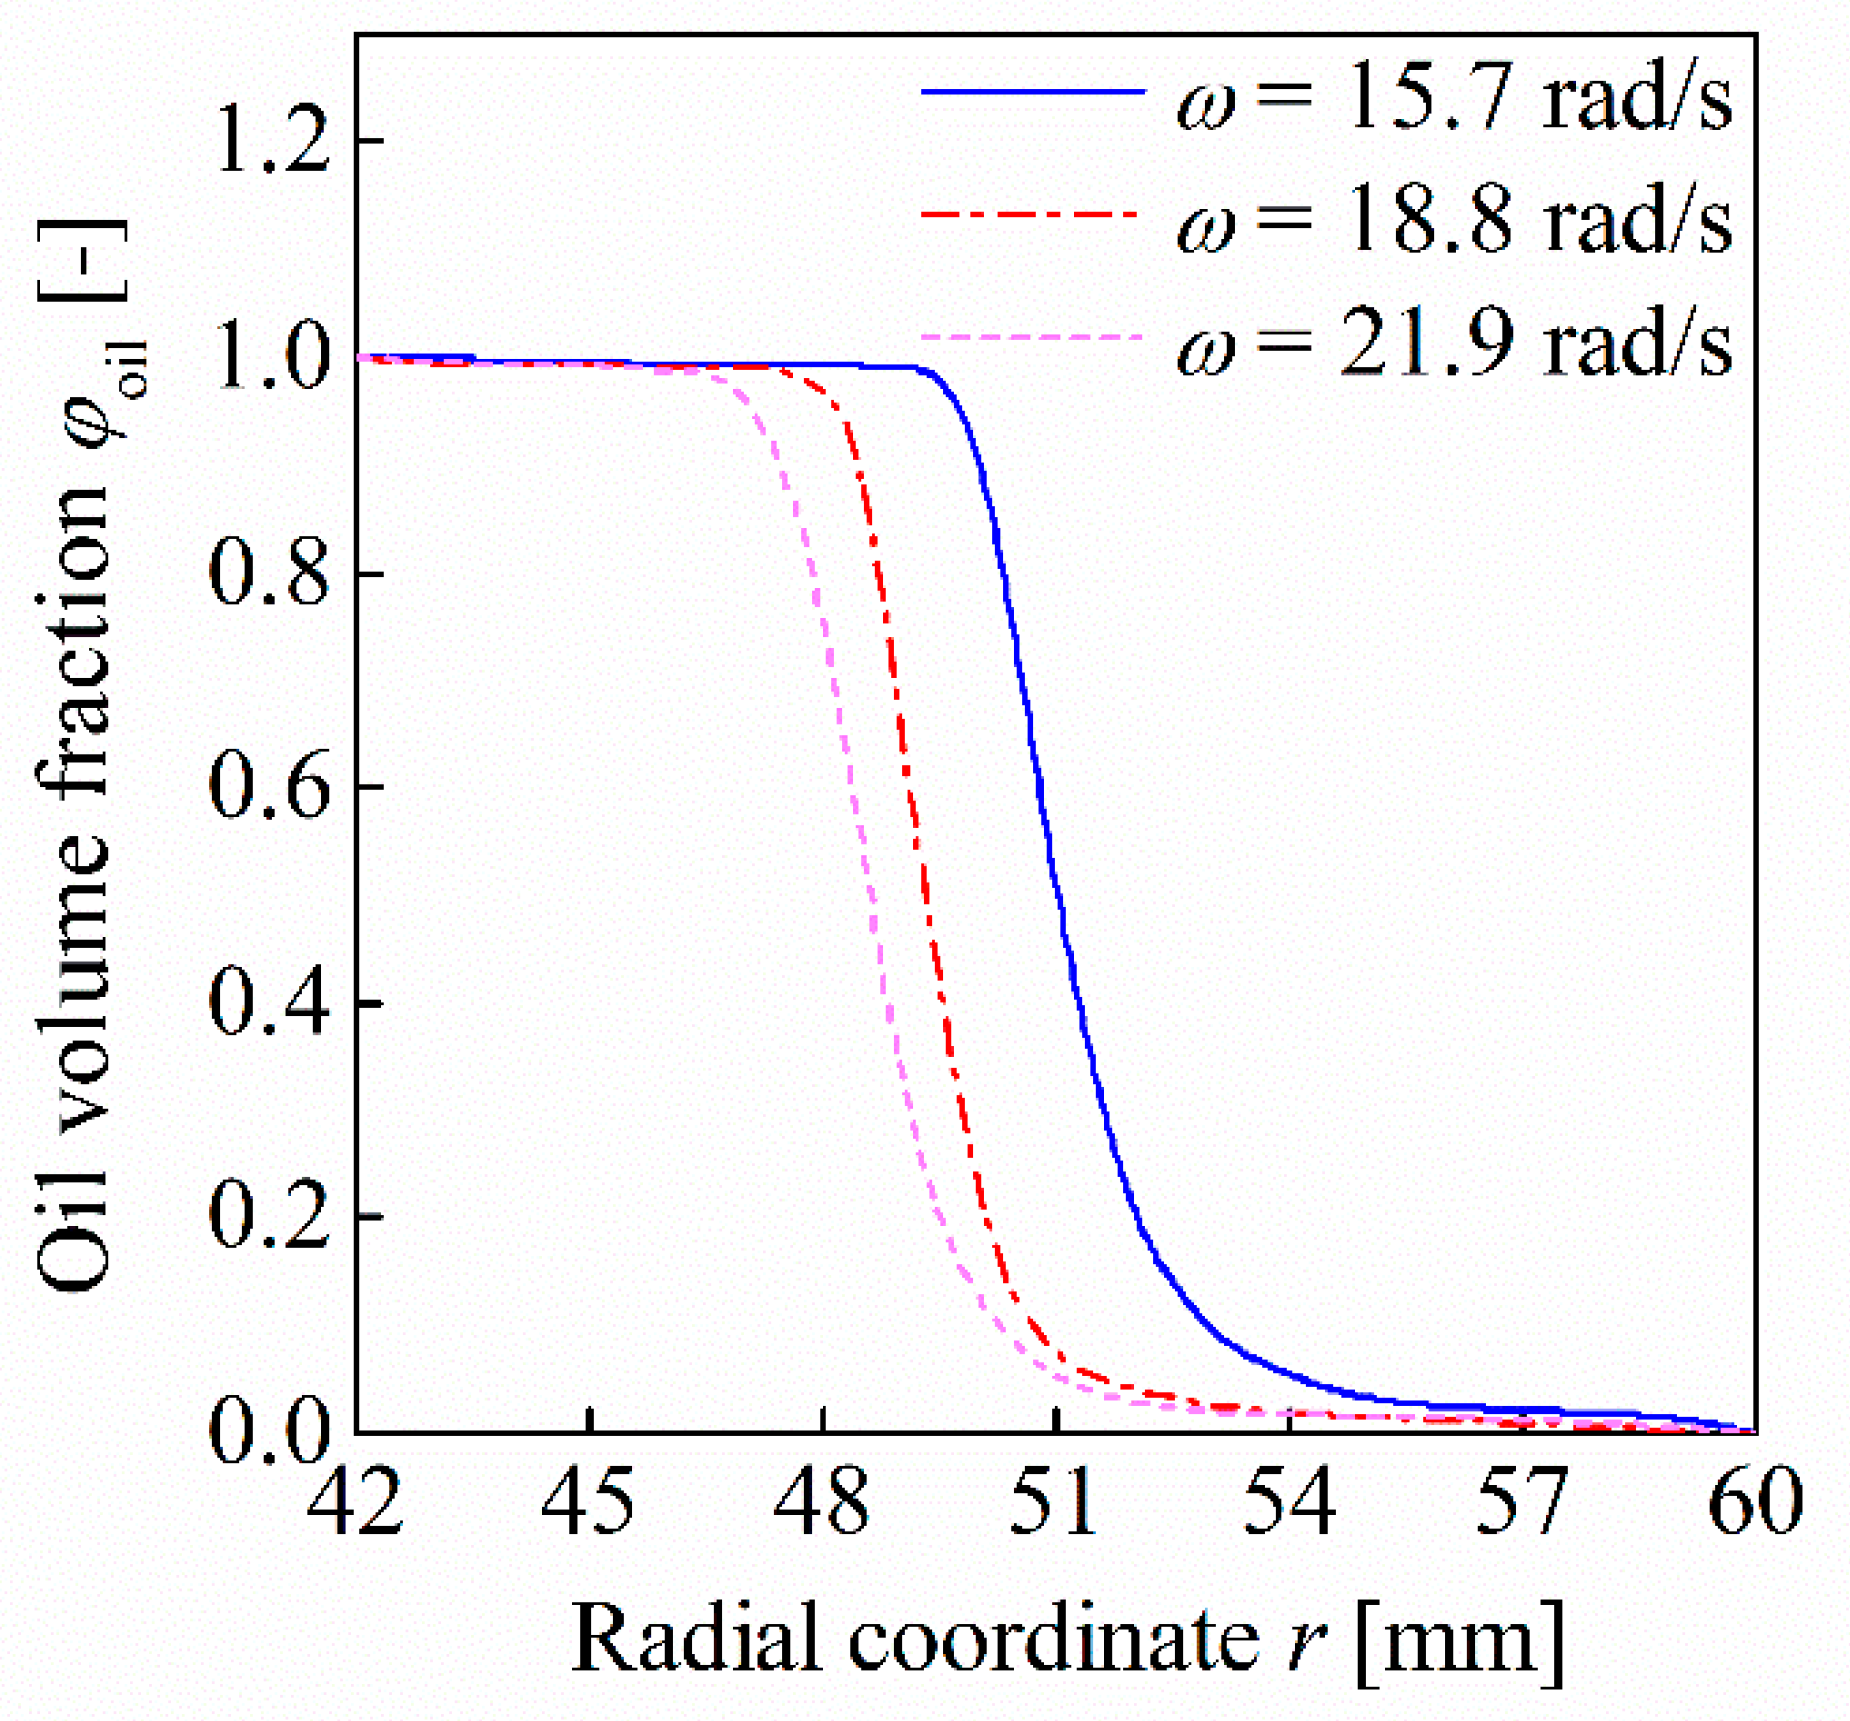
The angular speed, the flow rate, and the disk spacing are sensitive system parameters. In the visualization test results, the radial position of the continuous oil film boundary (which indicates the air–oil interface) could be utilized to demonstrate the effect of each parameter on the phase distribution in the flow field. Figure 6 presents the effects of different angular velocities on the oil volume fraction along the radial direction. The horizontal value of the coordinate was a dimensionless radial location r/r2. It is noteworthy that the oil volume fraction at one radial position was the averaged value of all the cells at this same radius. The following figures with different parameters were obtained in the same approach. For a certain angular velocity, the oil volume fraction tended to be 1.0 near the inlet area, indicating a pure oil flow. Around the middle radius region, the oil volume fraction decreased rapidly, indicating that the oil phase was aerated and a two-phase flow existed. As the radial position approached the outlet, the decline slope of the oil volume fraction reduced, and an air phase flow played a dominate role near the outer edge.
For different angular velocities, it could be seen that the transition location of the full oil phase to two-phase flow in the radial coordinate became closer to the inner radius with the angular speed increasing. In the two-phase flow zone, the oil volume fraction of the flow field became lower with the increasing angular speed at the same radial position. Figure 7 shows the effect of angular velocity on the flow field in the visualization test. It was observed that the interface between the continuous oil phase and the aerated part moved radially inwards with the increasing angular velocity. The continuous oil film shrunk at higher angular speeds. Thus, the simulation results agreed well with those of the visualization test.
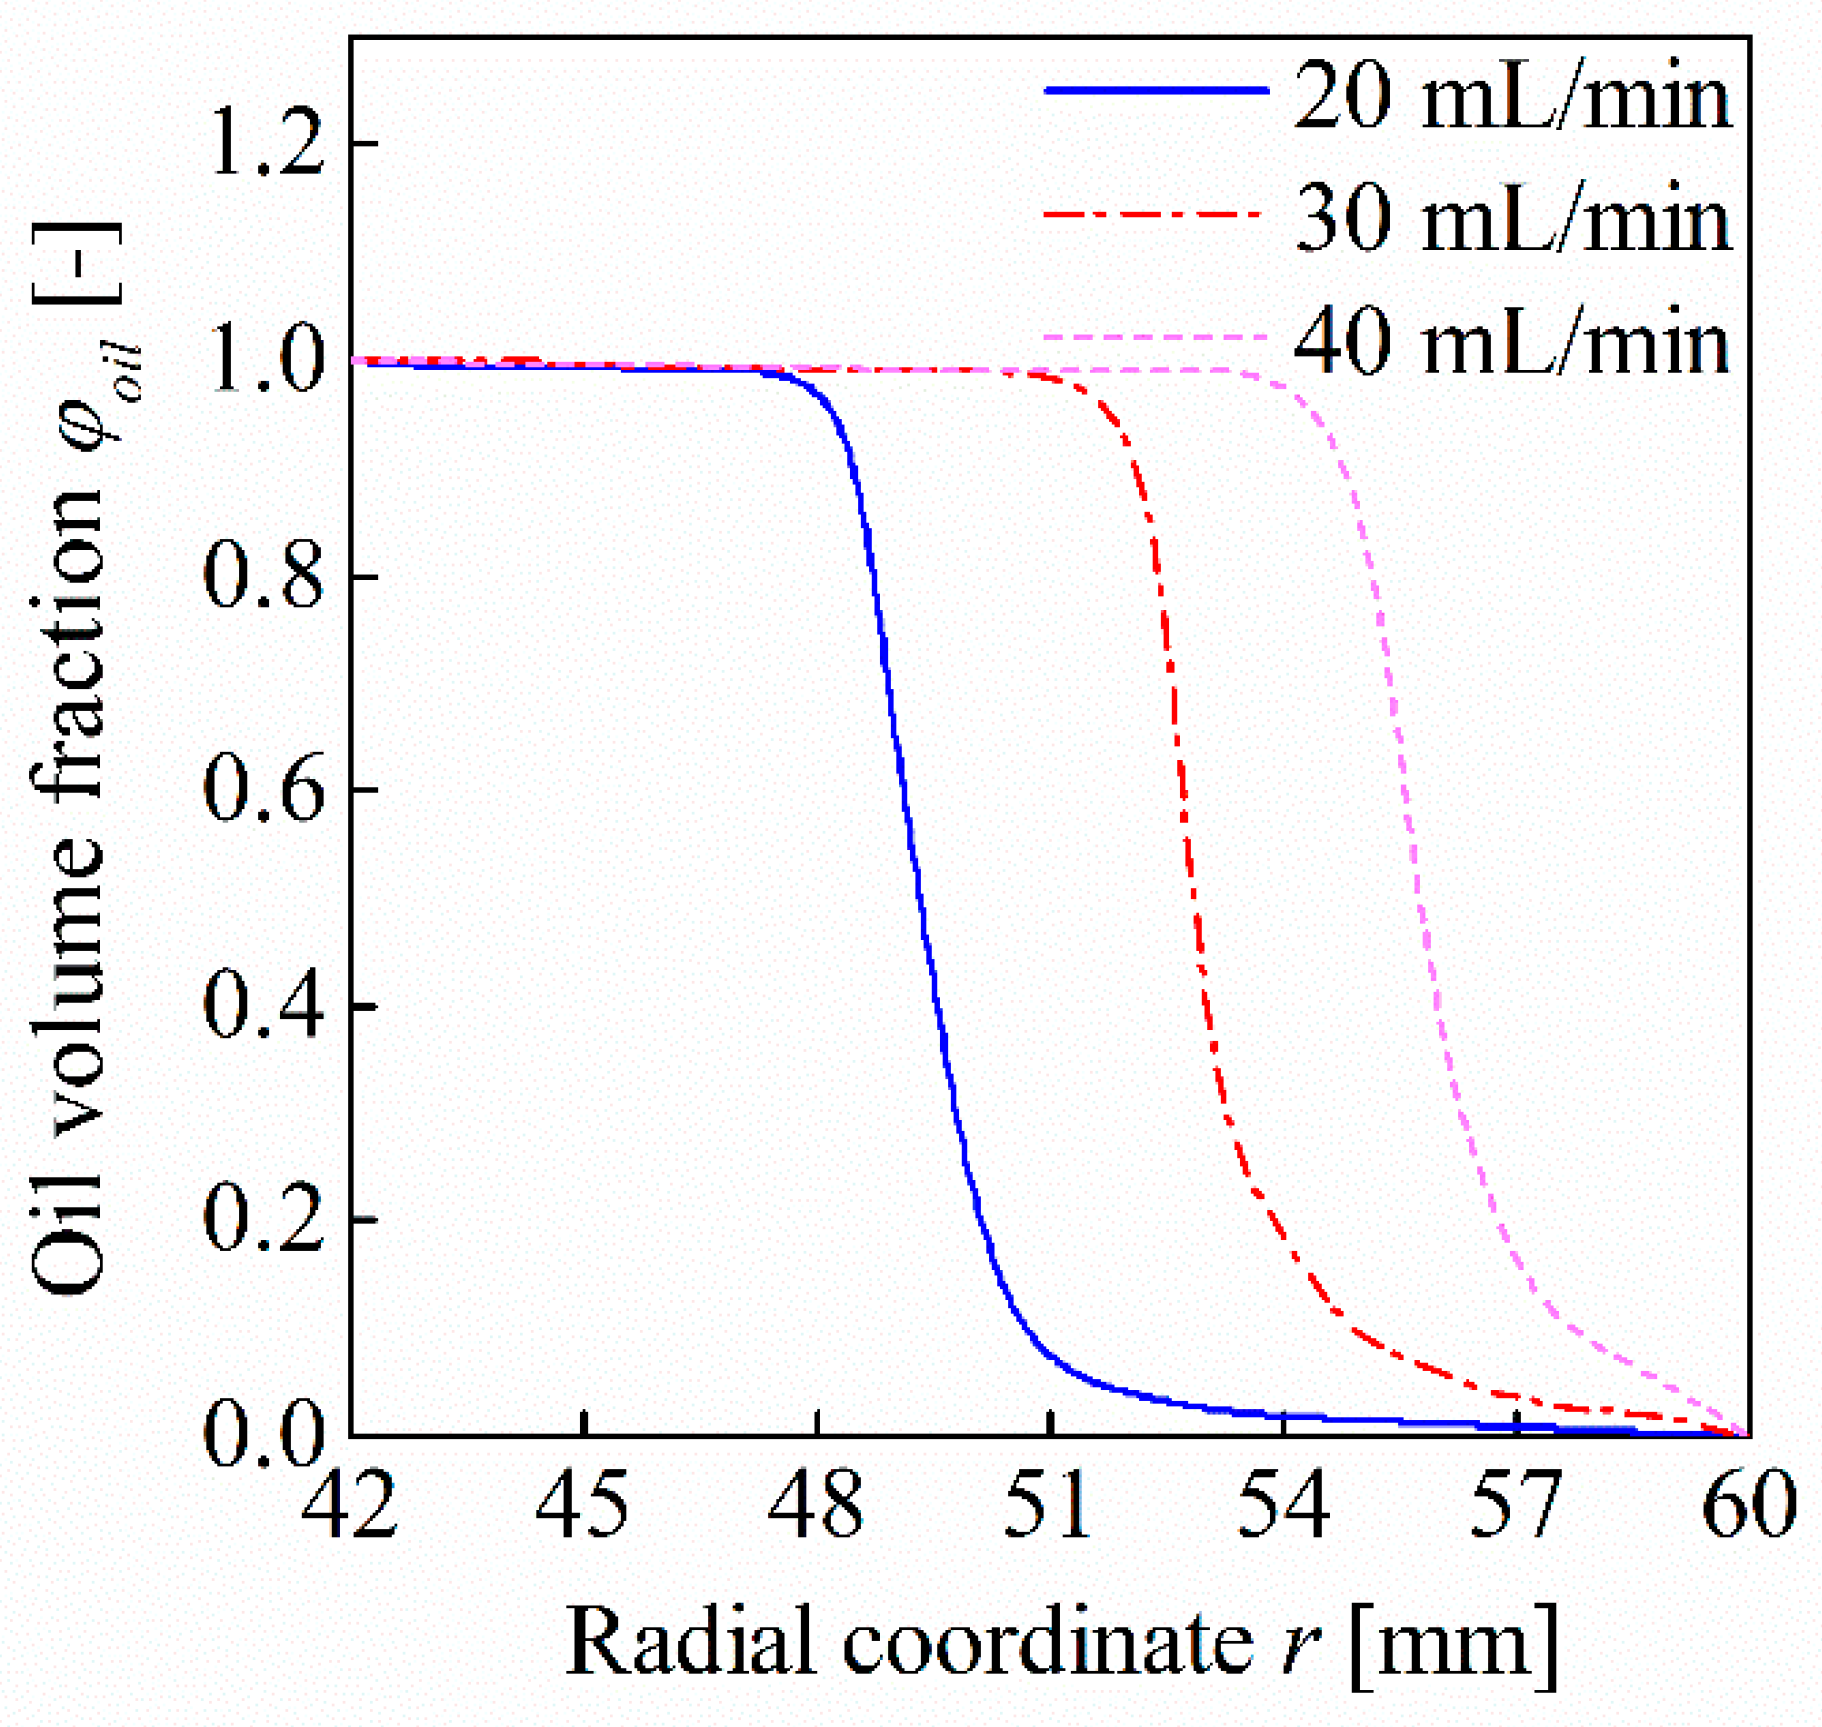
Figure 8 presents the variations of the oil volume fraction along the radial direction at different inlet volumetric flow rates. With the increase of the flow rate, the transition location of the full oil phase to two-phase flow in the radial coordinate moved gradually outwards to the outer radius. At the same radial location in the two-phase flow zone, the oil volume fraction became larger with higher flow rate. Furthermore, the decline slope of the average oil volume fraction was reduced with larger flow rate. As a validation, the visualization test results of various flow rates are shown in Figure 9. The boundary of the continuous oil phase area expanded with the increasing flow rate at the same speed. Since a larger flow rate is beneficial for heat dissipation in practical application, the flow rate is an important operating parameter. However, a larger flow rate requires a greater oil pump, leading to greater power consumption. Besides, it also results in higher drag torque at the same speed. Thus, a suitable flow rate needs to be confirmed according to the variation of the flow pattern.
The effects of the disk spacing on the flow field are shown in Figure 10. The boundary of the continuous oil phase remarkably moved inwards with higher disk spacing. At the same radial position in the two-phase zone, the oil volume fraction became much smaller with a higher disk spacing. The visualization test results of different disk spacing are shown in Figure 11. The continuous oil phase area shrunk with larger disk spacing. The numerical simulation results agreed well with the experimental results. The disk spacing is also an important system geometric parameter, since it significantly influences the viscous drag. Thus, the disk spacing needs to be optimized according to the practical restriction.
For the flow field inside the grooved two-disk system, both the flow rate and the disk spacing had direct effects on the radial flow velocity. The variation of the flow rate or the disk spacing changed the radial flow velocity. A more detailed investigation on the radial flow velocity is necessary. Furthermore, the flow rate and the disk spacing mentioned above are usually applied as the control parameters in engineering.
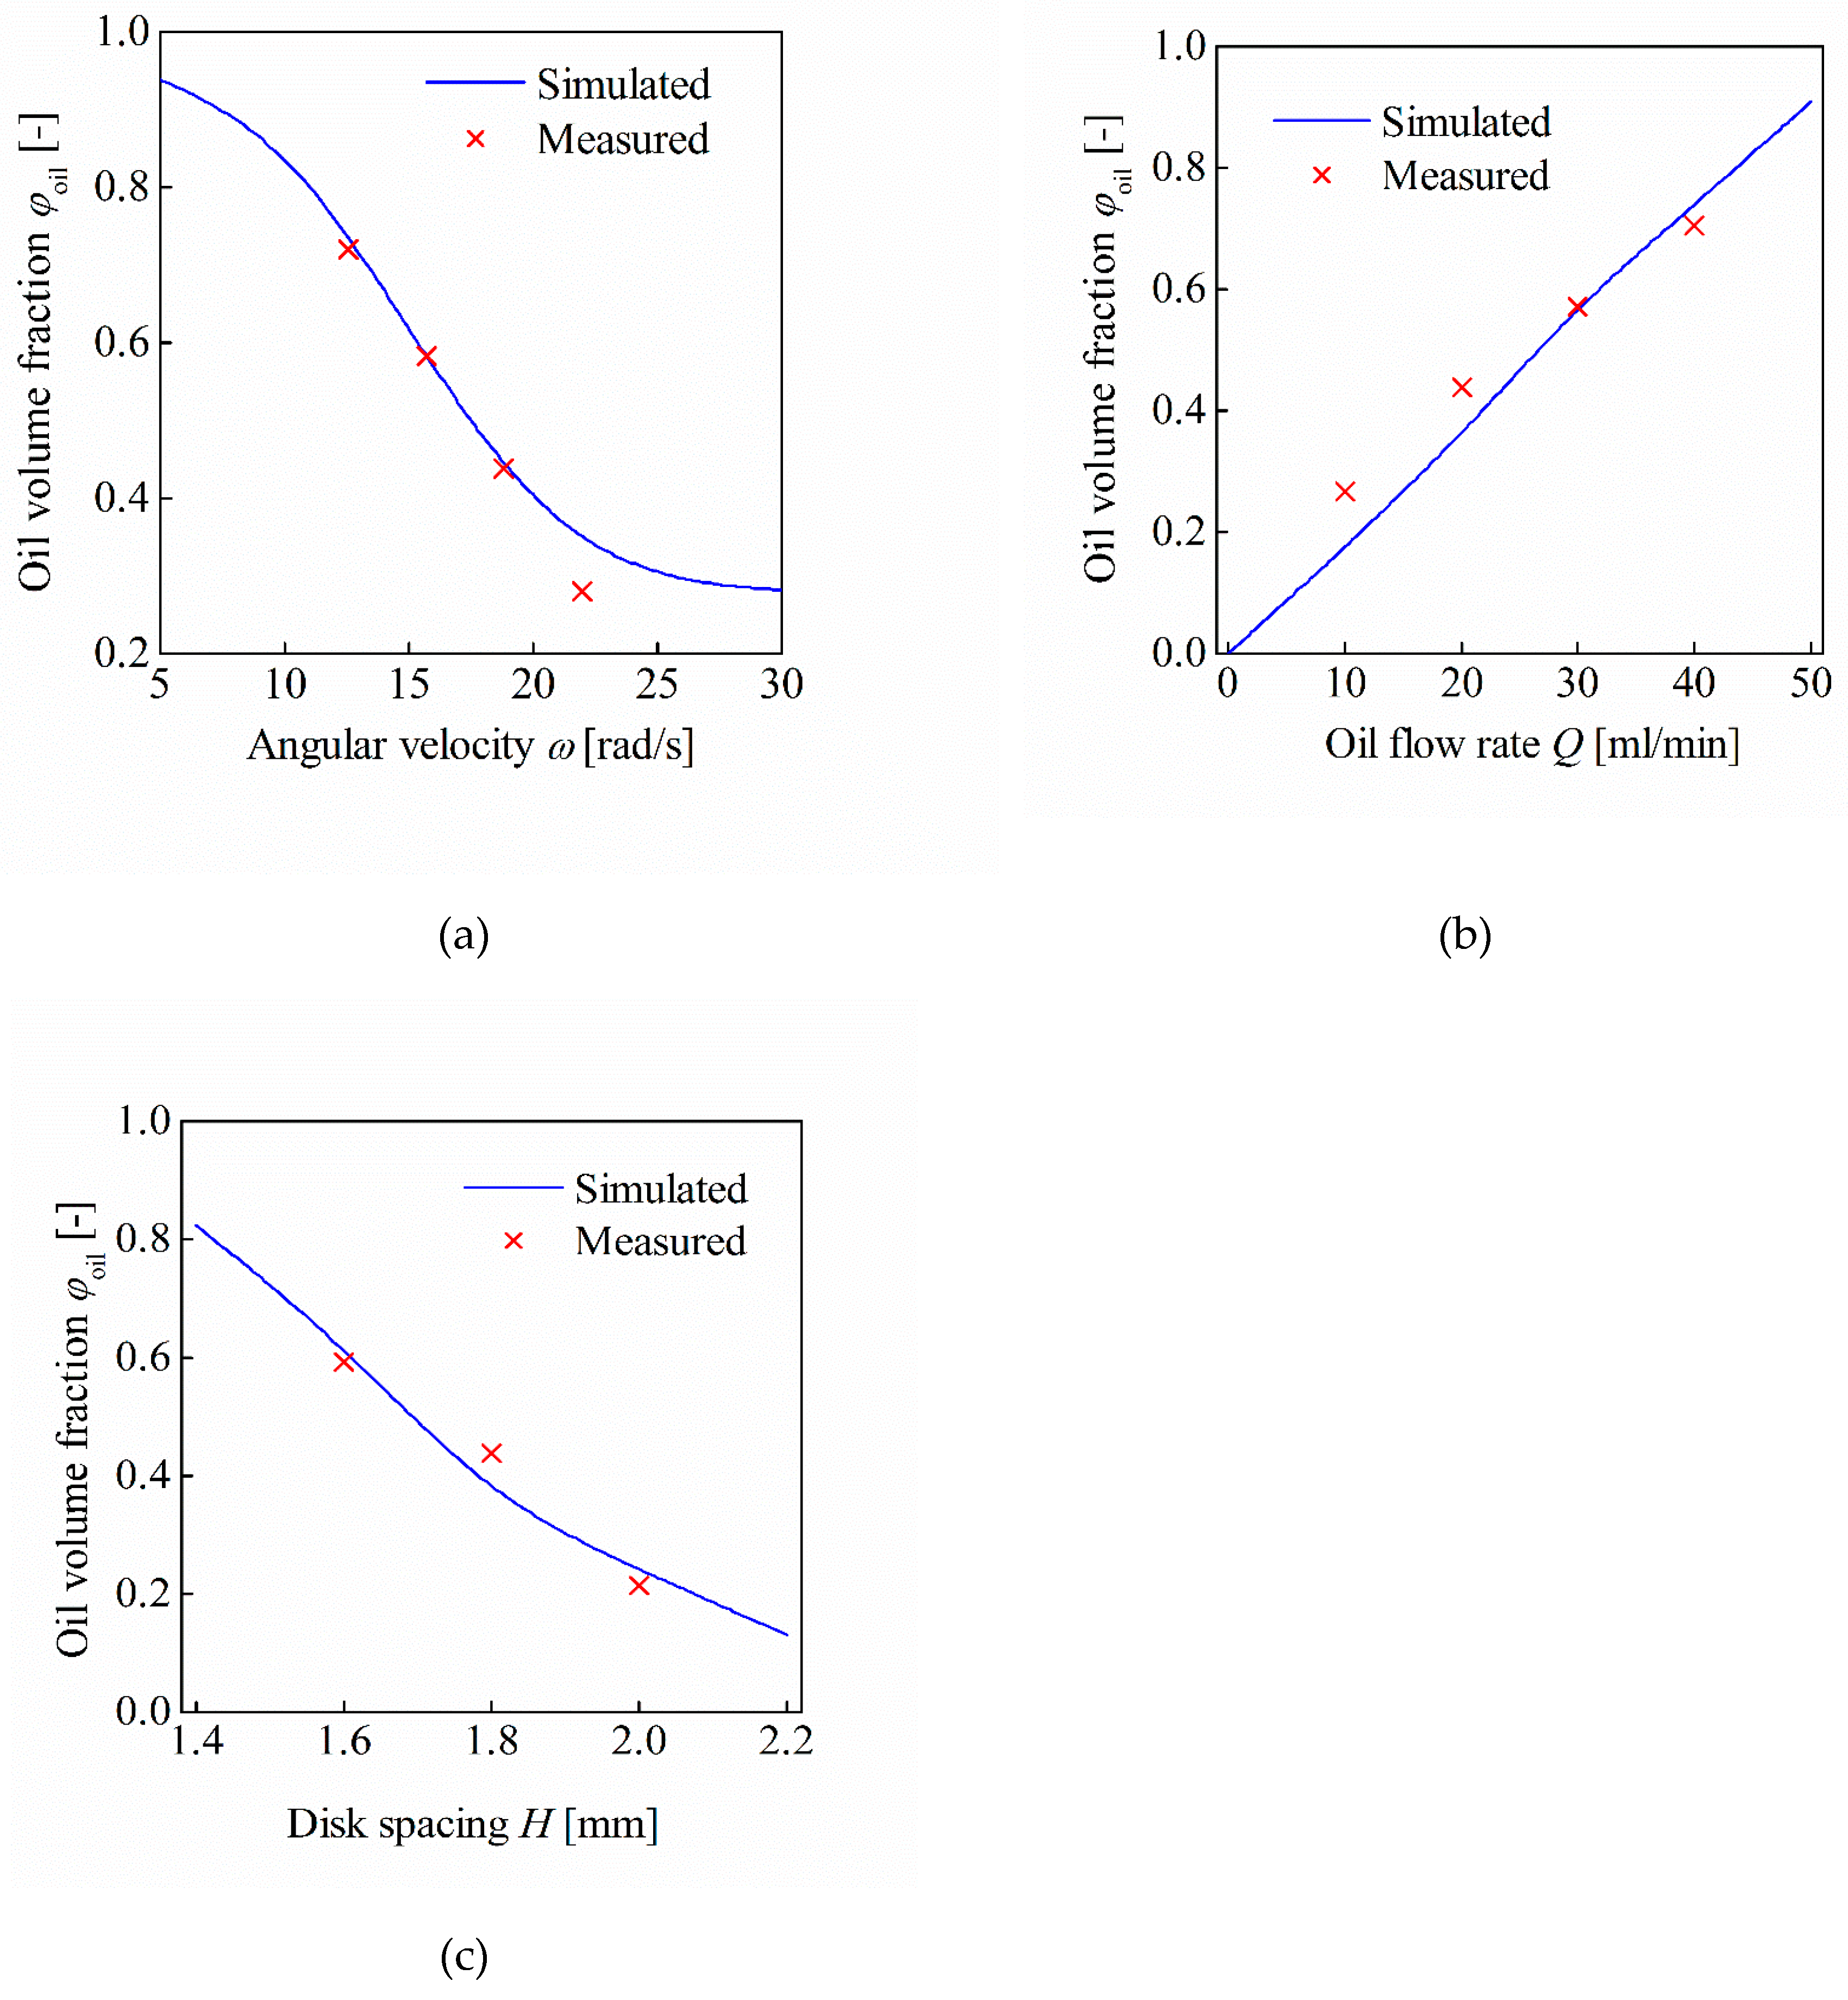
The average oil volume fractions of the flow field within the whole calculation domain under different angular velocities, oil flow rates, and disk spacing are shown in Figure 12. The simulated and the measured values of the average oil volume fraction were compared. It seems that the average oil volume fraction became lower with the increase of the angular speed, as shown in Figure 12a. When the angular speed was relatively low, the average oil volume fraction decreased nearly linearly. At relatively high speed, the slope of the average oil volume fraction curve got smaller and tended to be a constant value. In Figure 12b, both the simulated and the measured average oil volume fractions increased linearly with the flow rate before the flow rate reached 50 mL/min, which filled the flow field between the two disks. Lastly, in Figure 12c, the average oil volume fraction decreased with the increase of the disk spacing in a linear way. In the application of the disengaged wet clutch, the oil phase distribution is of crucial importance, since it affects the heat dissipation and the drag loss significantly. Thus, the two-phase flow behavior should be considered carefully in the clutch disk design.

5.3. Heat Dissipation Capability

The heat dissipation capability was investigated using the method presented in reference [45]. The Nusselt number is an important non-dimensional quantity used in heat transfer, which relates the convective heat transfer to the conductive heat transfer by a fluid across a surface. In this study, local and average Nusselt numbers were utilized to describe the heat dissipation capability under different conditions. The local and the average Nusselt numbers on the surface of the stationary flat disk are respectively defined as:
N u l = q r ( T W T ) k
N u a v = q r 2 ( T W a v T ) k
where q denotes the heat flux, TW denotes the local temperature of the stationary disk surface, T is the temperature of the two-phase flow, k is the effective thermal conductivity of the fluid, and TWav indicates the average temperature of the stationary disk surface.
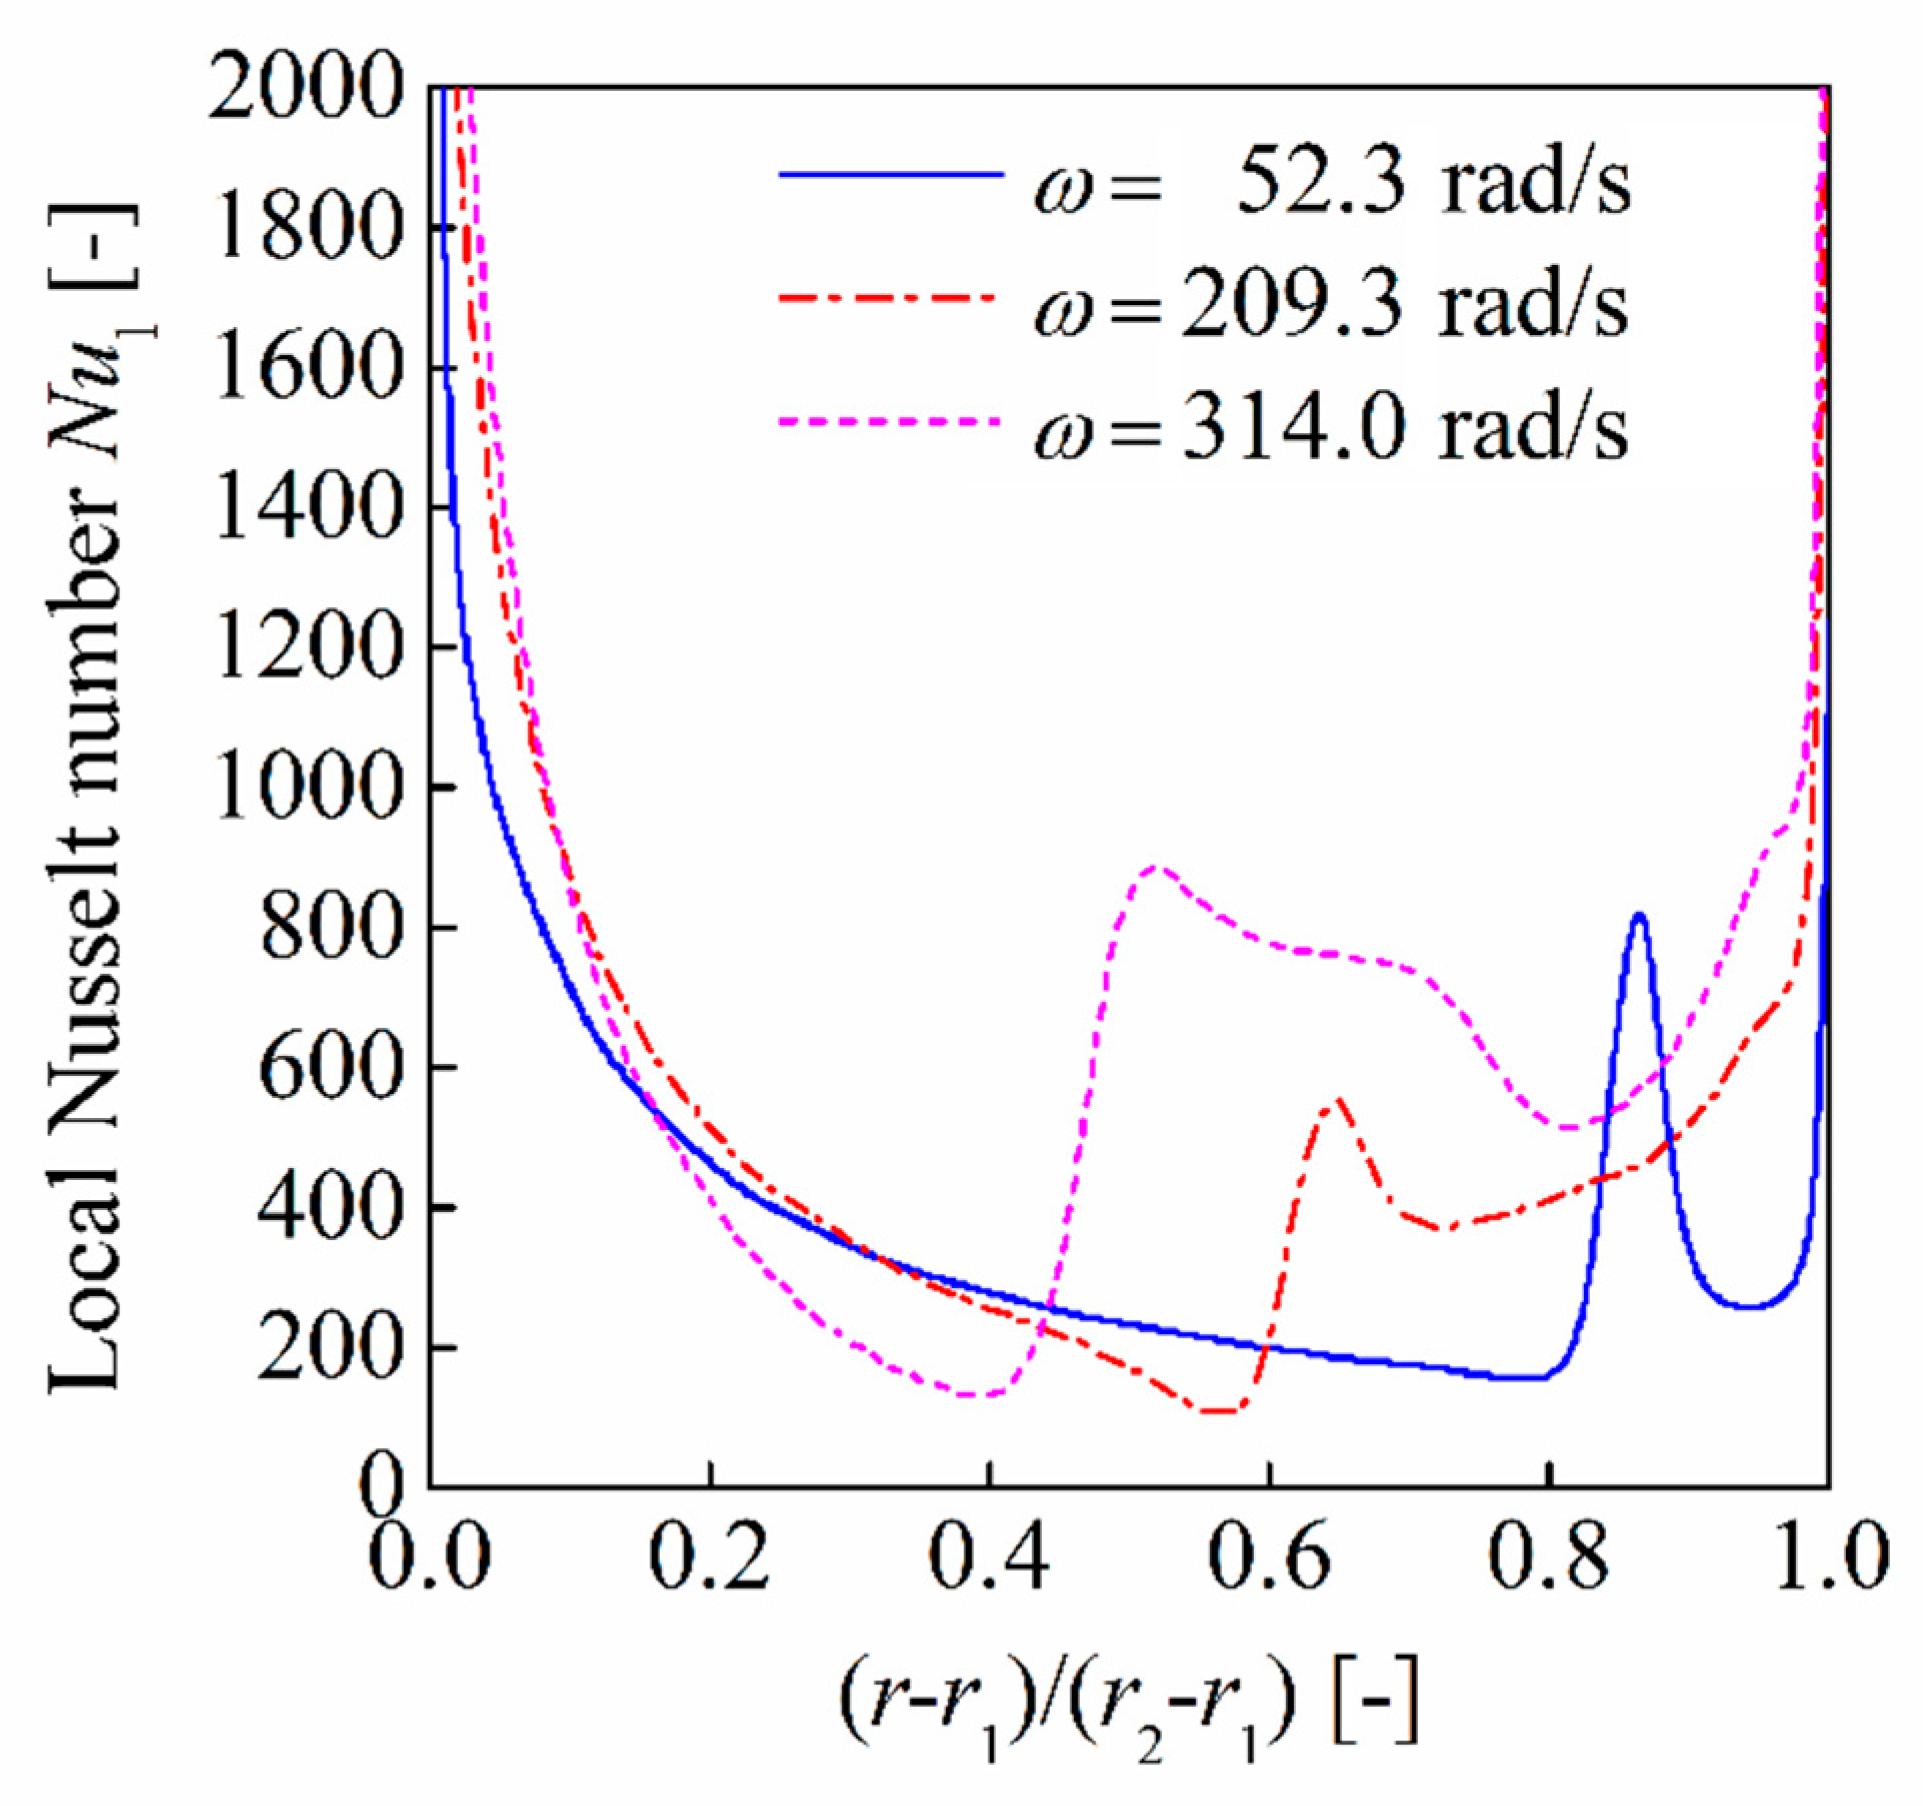
Figure 13 shows the radial distribution of the local Nusselt number along the center line of the stationary disk. At a certain angular velocity, it is noted from the figure that the local Nusselt number was high close to the inner radius position of the disk. It dropped rapidly and fluctuated remarkably outward along the radial direction. Near the outer diameter position of the disk, the Nusselt number increased rapidly to a great value. The reasons for the variation of the Nusselt number along the radial direction were as follows. The inner radius region was filled with the continuous oil phase. The oil temperature was low, and the heat convection of the oil was much stronger than the air, leading to a high local Nusselt number near the inlet. In the middle radius region, the oil volume fraction decreased quickly around the interface of oil film and two-phase flow. The heat convection of the two-phase flow was much weaker than the pure oil phase. The heat dissipation was weakened, and the fluid temperature rose. Furthermore, compared with the flow within the full oil phase zone, the flow of the air–oil two-phase flow was much more unstable around the interface of the oil film and the two-phase flow, which led to drastic fluctuations of the Nusselt number. Near the outer diameter position of the disk, though the oil volume fraction was very small, the velocity of the air flow was relatively much higher than the air–oil flow. Besides, the temperature of the air phase was lower, thus the cooling intensity of the disk surface was higher. This made the local Nusselt number increase near the outlet boundary.
With the angular speed of the disk increasing, it was concluded from Figure 13 that the fluctuation of the local Nusselt number moved towards the inner diameter, and its range notably increased. This was because the oil volume fraction decreased at higher speeds, and the area of the air phase expanded towards the inner diameter, which resulted in an increase in the mixing area of the two-phase flow. The higher the speed of the disk was, the more unstable the two-phase flow became, and the higher the flow velocity was. Thus, the fluctuation was aggravated. In the regions near the inner and the outer diameter, a higher local Nusselt number was attributable to a greater shear rate of the oil phase and the air phase, respectively, which led to stronger heat dissipation.
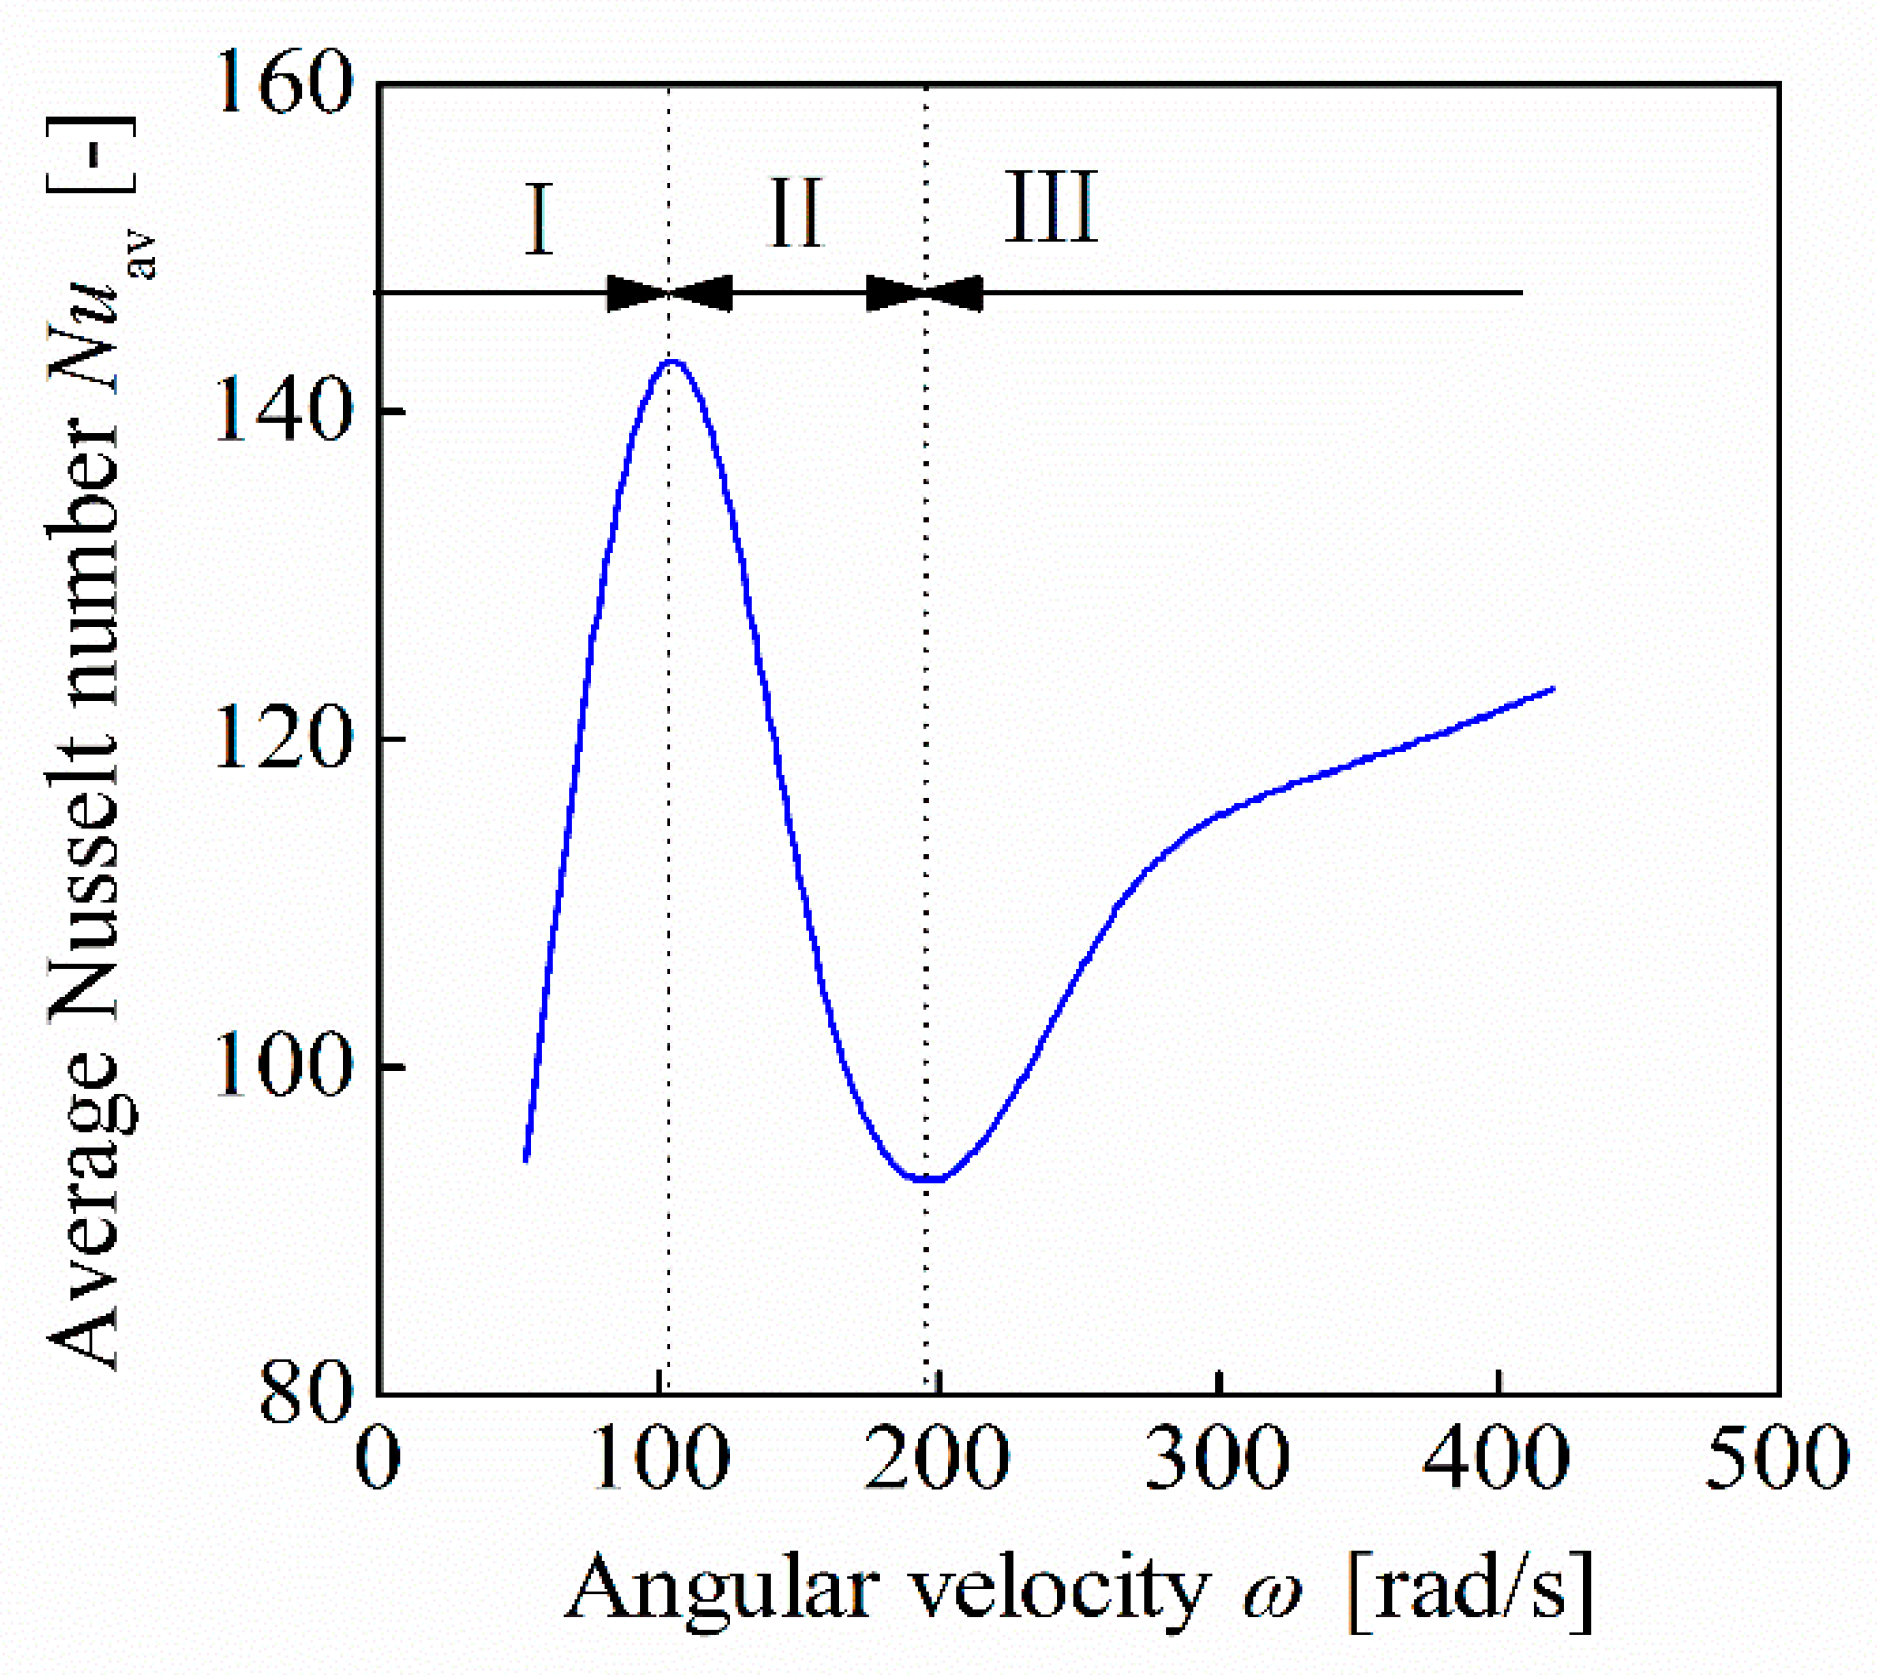
Lastly, the variation of the average Nusselt number on the stationary disk surface with increasing angular velocity is shown in Figure 14. The change of the average Nusselt number with angular velocity could be divided into three stages. For stage I, the angular velocity of the rotating disk was small, and the gap was filled with the oil phase. As the disk speed increased, the shear rate of the oil phase in the gap increased, resulting in stronger heat dissipation. Therefore, the average Nusselt number rose remarkably in stage II. In stage II, the oil volume fraction decreased rapidly due to the aeration effect. The heat dissipation capability of the mixture was weaker than that of the full oil phase, which led to a rapid decrease of the average Nusselt number. In stage III, the oil volume fraction in the flow field decreased much more slowly. However, the speed of the air–oil two-phase flow and the pure air phase inside the flow field increased with a higher disk speed. The mixture flow around the inner diameter region and the pure air phase flow around the outer diameter region played major roles in the heat convection. Thus, the average Nusselt number increased gradually with the angular velocity of the disk.

6. Conclusions and Future Work

In this paper, the viscous flow field inside a grooved rotating-disk system was studied quantitatively. A 3D CFD model considering two-phase flow and heat transfer was utilized to simulate phase distributions and heat dissipation. Visualization tests were conducted to validate the flow pattern and the parametric effect on the flow field. Several conclusions were drawn as follows.
(1) The viscous flow field of the grooved rotating-disk system was identified to be an air–oil two-phase flow. A stable interface between the continuous oil phase and the two-phase area could be formed and observed in the flow field. The proposed 3D CFD model with VOF model and heat transfer consideration was validated by the comparison of simulation with the visualization test result of the flow field.
(2) The effects of angular velocity, inlet volumetric flow rate of oil, and disk spacing on the oil volume fraction along the radial direction were analyzed and compared with the visualization test results. In general, the interface between the continuous oil phase and the two-phase flow moved outwards with smaller angular speed, more inlet flow of oil, or decreasing disk spacing. Besides, for the whole flow field, the average oil volume fraction decreased with increasing angular speed, less inlet flow rate of oil, or increasing disk spacing.
(3) The local Nusselt number was remarkably affected by the air–oil volume fraction and the flow velocity distributions in this two-phase flow. The local Nusselt number was much higher near the disk edge—both the inner and the outer ones. Fluctuations of the local Nusselt number appeared near the two-phase interface due to the flow speed changes. At higher angular velocity, the area of fluctuation expanded. The variation of average Nusselt number over the whole flow field could be divided into three stages resulting from the variation of fluid volume fraction and fluid speed.
The results can be used to optimize the design of the grooved rotating-disk system disk fluid machine. The energy transfer characteristics of the air–oil two-phase flow need more study. Work on these topics is currently underway in the National Key Laboratory of Vehicular Transmission at the Beijing Institute of Technology.

Author Contributions

Conceptualization, C.L. and W.W.; Methodology, W.W.; Validation, C.L., W.W. and Y.L.; Formal Analysis, J.Z.; Investigation, C.H.; Writing—Original Draft Preparation, W.W. and Y.L.; Writing—Review & Editing, C.L.; Project Administration, C.L.; Funding Acquisition, C.L. and W.W.

Funding

This work is supported by the National Natural Science Foundation of China (Grant No. U1864210 and 51975045) and National Key R&D Program of China (Grant No. 2018YFB2001300).

Acknowledgments

The authors thank referees for improving the quality of the paper. If readers are interested in this paper, please contact the authors. It’s our pleasure to provide readers with relevant model, grid and setup files.

Conflicts of Interest

The authors declare no conflict of interest.

Nomenclature

E
Specific sensible enthalpy, J/kg
F
External force, N
g
Gravity acceleration, m/s2
h
Depth of radial grooves, m
H
Disk spacing, m
k
Effective thermal conductivity coefficient of fluid, W/(m·K)
ks
Thermal conductivity coefficient of solid structure, W/(m·K)
Ng
Groove number
Nuav
Average Nusselt number
Nul
Local Nusselt number
p
Pressure, Pa
Q
Oil flow rate, L/min
q
Heat flux, W/m2
r
Radial coordinate
r1
Inner radius, m
r2
Outer radius, m
T
Temperature of two-phase flow, K
TW
Local temperature of stationary disk surface, K
TWav
Average temperature of stationary disk surface, K
t
Time, s
z
Axial coordinate
Greek symbols
θ
Azimuthal coordinate
μ
Dynamic viscosity, Pa·s
ρ
Density, kg/m3
υ
Velocity, m/s
φ
Volume fraction
ω
Angular velocity, rad/s

Subscripts

air
Subscript for the air phase parameterparameter
oil
Subscript for the oil phase parameter

References

  1. Liu, F.; Wu, W.; Hu, J.; Yuan, S. Design of multi-range hydro-mechanical transmission using modular method. Mech. Syst. Signal Process. 2019, 126, 1–20. [Google Scholar] [CrossRef]
  2. Cui, J.; Wang, C.; Xie, F.; Xuan, R.; Shen, G. Numerical investigation on transient thermal behavior of multidisk friction pairs in hydro-viscous drive. Appl. Therm. Eng. 2014, 67, 409–422. [Google Scholar] [CrossRef]
  3. Guha, A.; Sengupta, S. The fluid dynamics of the rotating flow in a Tesla disc turbine. Eur. J. Mech. B/Fluids 2013, 37, 112–123. [Google Scholar] [CrossRef]
  4. Von Kármán, T. Über laminare und turbulente reibung. J. Appl. Math. Mech./Z. Für Angew. Math. Und Mech. 1921, 1, 233–252. [Google Scholar]
  5. Batchelor, G.K. Note on a class of solutions of the Navier-Stokes equations representing steady rotationally-symmetric flow. Q. J. Mech. Appl. Math. 1951, 4, 29–41. [Google Scholar] [CrossRef]
  6. Stewartson, K. On the flow between two rotating coaxial disks. Math. Proc. Camb. Philos. Soc. 1953, 49, 333–341. [Google Scholar] [CrossRef]
  7. Srinivasacharya, D.; Kaladhar, K. Analytical solution for Hall and Ion-slip effects on mixed convection flow of couple stress fluid between parallel disks. Math. Comput. Model. 2013, 57, 2494–2509. [Google Scholar]
  8. Brady, J.F.; Durlofsky, L. On rotating disk flow. J. Fluid Mech. 1987, 175, 363–394. [Google Scholar] [CrossRef]
  9. Soong, C.Y.; Wu, C.C.; Liu, T.P.; Liu, T.P. Flow structure between two co-axial disks rotating independently. Exp. Therm. Fluid Sci. 2003, 27, 295–311. [Google Scholar] [CrossRef]
  10. Schouveiler, L.; Le Gal, P.; Chauve, M.P. Instabilities of the flow between a rotating and a stationary disk. J. Fluid Mech. 2001, 443, 329–350. [Google Scholar] [CrossRef]
  11. Bai, S.; Peng, X.; Li, Y.; Sheng, S. A hydrodynamic laser surface-textured gas mechanical face seal. Tribol. Lett. 2010, 38, 187–194. [Google Scholar] [CrossRef]
  12. Liu, J.; Shao, Y. An improved analytical model for a lubricated roller bearing including a localized defect with different edge shapes. J. Vib. Control 2018, 24, 3894–3907. [Google Scholar] [CrossRef]
  13. Fesanghary, M.; Khonsari, M.M. On the modeling and shape optimization of hydrodynamic flexible-pad thrust bearings. Proc. Inst. Mech. Eng. Part J J. Eng. Tribol. 2013, 227, 548–558. [Google Scholar] [CrossRef]
  14. Chao, Q.; Zhang, J.; Xu, B.; Wang, Q. Discussion on the Reynolds equation for the slipper bearing modeling in axial piston pumps. Tribol. Int. 2018, 118, 140–147. [Google Scholar] [CrossRef]
  15. Huang, J.H.; Fan, Y.R.; Qiu, M.X.; Fang, W.M. Effects of groove on behavior of flow between hydro-viscous drive plates. J. Cent. South Univ. 2012, 19, 347–356. [Google Scholar] [CrossRef]
  16. Missimer, J.R.; Johnson, W.S. Flow between a smooth stationary disk and grooved rotating disk. J. Tribol. 1982, 104, 248–254. [Google Scholar] [CrossRef]
  17. Li, M.; Khonsari, M.M.; McCarthy, D.M.C.; Lundin, J. Parametric analysis for a paper-based wet clutch with groove consideration. Tribol. Int. 2014, 80, 222–233. [Google Scholar] [CrossRef]
  18. Razzzaque, M.M.; Kato, T. Effects of a groove on the behavior of a squeeze film between a grooved and a plain rotating annular disk. J. Tribol. 1999, 121, 808–815. [Google Scholar] [CrossRef]
  19. Xie, F.; Wu, D.; Tong, Y.; Zhang, B.; Zhu, J. Effects of structural parameters of oil groove on transmission characteristics of hydro-viscous clutch based on viscosity-temperature property of oil film. Ind. Lubr. Tribol. 2017, 69, 690–700. [Google Scholar] [CrossRef]
  20. Said, I.A.; Abdel-Aziz, M.H.; El-Taweel, Y.A.; Sedahmed, G.H. Mass and heat transfer behavior of a rotating disc with parallel rectangular grooves. Chem. Eng. Process. Process Intensif. 2016, 105, 110–116. [Google Scholar] [CrossRef]
  21. Beretta, G.P.; Malfa, E. Flow and heat transfer in cavities between rotor and stator disks. Int. J. Heat Mass Transf. 2003, 46, 2715–2726. [Google Scholar] [CrossRef] [Green Version]
  22. Wang, D.M.; Chen, B.; Gu, Z.T.; Zhou, C. Flow characteristics of oil film on surface of a rotating disk. J. Propuls. Technol. 2019, 40, 53–60. [Google Scholar]
  23. Aphale, C.R.; Schultz, W.W.; Ceccio, S.L. The influence of grooves on the fully wetted and aerated flow between open clutch plates. J. Tribol. 2010, 132, 011104. [Google Scholar] [CrossRef]
  24. Iqbal, S.; Al-Bender, F.; Pluymers, B.; Desmet, W. Model for predicting drag torque in open multi-disks wet clutches. J. Fluids Eng. 2014, 136, 021103. [Google Scholar] [CrossRef]
  25. Xie, F.; Zheng, X.; Sheng, G.; Sun, Q.; Agarwal, R.K. Numerical investigation of cavitation effect on two-phase oil film flow between a friction pair in hydro-viscous drive. P. I. Mech. Eng. C.-J. Mec. 2018, 232, 4626–4636. [Google Scholar] [CrossRef]
  26. Hu, J.; Wu, W.; Wu, M.; Yuan, S. Numerical investigation of the air–oil two-phase flow inside an oil-jet lubricated ball bearing. Int. J. Heat Mass Transf. 2014, 68, 85–93. [Google Scholar] [CrossRef]
  27. Payvar, P. Laminar heat transfer in the oil groove of a wet clutch. Int. J. Heat Mass Transf. 1991, 34, 1791–1798. [Google Scholar] [CrossRef]
  28. Jang, J.Y.; Khonsari, M.M.; Maki, R. Three-dimensional thermohydrodynamic analysis of a wet clutch with consideration of grooved friction surfaces. J. Tribol. 2011, 133, 011703. [Google Scholar] [CrossRef]
  29. Jen, T.C.; Nemecek, D.J. Thermal analysis of a wet-disk clutch subjected to a constant energy engagement. Int. J. Heat Mass Transf. 2008, 51, 1757–1769. [Google Scholar] [CrossRef]
  30. Marklund, P.; Mäki, R.; Larsson, R.; Höglund, E.; Khonsari, M.M.; Jang, J. Thermal influence on torque transfer of wet clutches in limited slip differential applications. Tribol. Int. 2007, 40, 876–884. [Google Scholar] [CrossRef]
  31. Wu, W.; Xiong, Z.; Hu, J.B.; Yuan, S.H. Application of CFD to model oil–air flow in a grooved two-disc system. Int. J. Heat Mass Transf. 2015, 91, 293–301. [Google Scholar] [CrossRef]
  32. Zhang, B.; Wang, Z.; Wang, T. Drag Torque Model with Decoupling of Temperature and Radius. J. Comput. Theor. Nanosci. 2016, 13, 1337–1342. [Google Scholar] [CrossRef]
  33. Wu, W.; Xiao, B.; Hu, J.; Yuan, S.; Hu, C. Experimental investigation on the air-liquid two-phase flow inside a grooved rotating-disk system: Flow pattern maps. Appl. Therm. Eng. 2018, 133, 33–38. [Google Scholar] [CrossRef]
  34. Neupert, T.; Bartel, D. High-resolution 3D CFD multiphase simulation of the flow and the drag torque of wet clutch discs considering free surfaces. Tribol. Int. 2019, 129, 283–296. [Google Scholar] [CrossRef]
  35. Pahlovy, S.A.; Mahmud, S.F.; Kubota, M.; Ogawa, M.; Takakura, N. Prediction of Drag Torque in a Disengaged Wet Clutch of Automatic Transmission by Analytical Modeling. Tribol. Online 2016, 11, 121–129. [Google Scholar] [CrossRef] [Green Version]
  36. Xie, H.; Gong, H.; Hu, L.; Yang, H. Coriolis effects on torque transmission of hydro-viscous film in parallel disks with imposed throughflow. Tribol. Int. 2017, 115, 100–107. [Google Scholar] [CrossRef]
  37. Gong, H.; Xie, H.; Hu, L.; Yang, H. Combined effects of Coriolis force and temperature-viscosity dependency on hydro-viscous transmission of rotating parallel disks. Tribol. Int. 2018, 117, 168–173. [Google Scholar] [CrossRef]
  38. Hirt, C.W.; Nichols, B.D. Volume of fluid (VOF) method for the dynamics of free boundaries. J. Comput. Phys. 1981, 39, 201–225. [Google Scholar] [CrossRef]
  39. Ganapathy, H.; Shooshtari, A.; Choo, K.; Dessiatoun, S.; Alshehhi, M.; Ohadi, M. Volume of fluid-based numerical modeling of condensation heat transfer and fluid flow characteristics in microchannels. Int. J. Heat Mass Transf. 2013, 65, 62–72. [Google Scholar] [CrossRef]
  40. Hu, J.; Peng, Z.; Wei, C. Experimental Research on Drag Torque for Single-Plate Wet Clutch. J. Tribol. Trans. ASME 2012, 134, 014502. [Google Scholar]
  41. Da Riva, E.; Del Col, D. Numerical simulation of laminar liquid film condensation in a horizontal circular minichannel. J. Heat Transf. 2012, 134, 051019. [Google Scholar] [CrossRef]
  42. Wang, F.J. Principle and Application of CFD Software; Tsinghua University Press: Beijing, China, 2015; pp. 40–44. [Google Scholar]
  43. Brackbill, J.U.; Kothe, D.B.; Zemach, C. A continuum method for modeling surface tension. J. Comput. Phys. 1992, 100, 335–354. [Google Scholar] [CrossRef]
  44. Benson, D.J. Volume of fluid interface reconstruction methods for multi-material problems. Appl. Mech. Rev. 2002, 55, 151–165. [Google Scholar] [CrossRef]
  45. Yuan, Z.X.; Saniei, N.; Yan, X.T. Turbulent heat transfer on the stationary disk in a rotor–stator system. Int. J. Heat Mass Transf. 2003, 46, 2207–2218. [Google Scholar] [CrossRef]
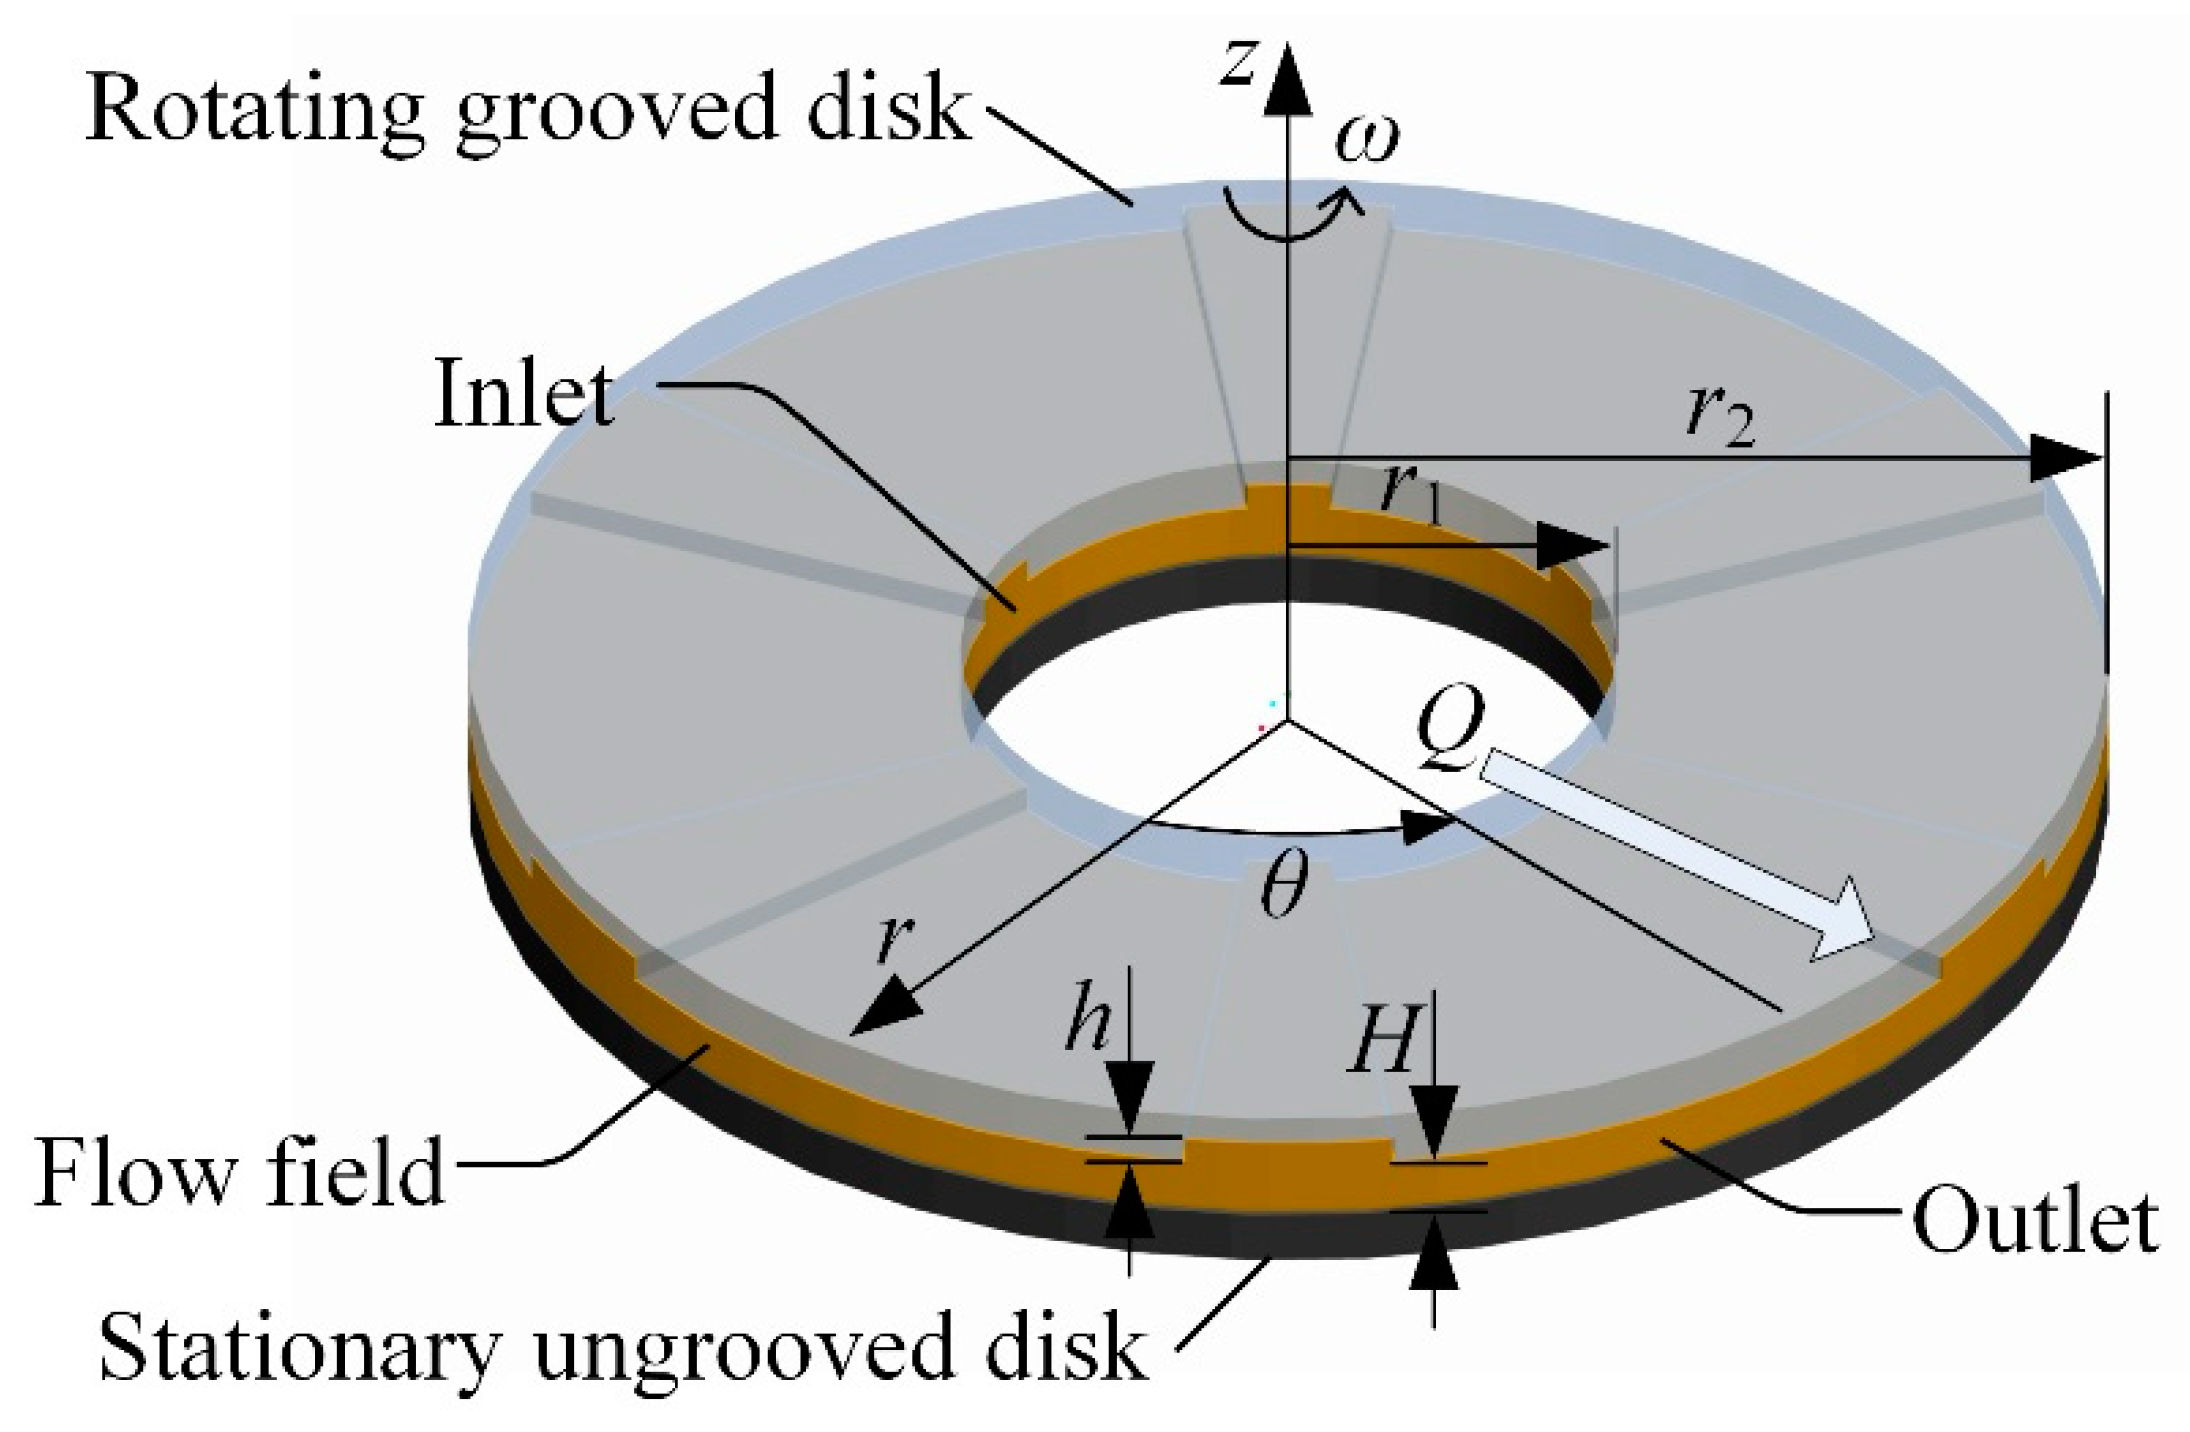
Figure 1. Schematic of the grooved rotating-disk system.
Processes 07 00632 g001
Figure 2. Test apparatus of the grooved rotating-disk system.
Processes 07 00632 g002
Figure 3. Comparison of the oil volume distribution between simulation and visualization test.
Processes 07 00632 g003
Figure 4. 3D contour of oil phase distribution for a 36° section of flow field.
Processes 07 00632 g004
Figure 5. Streamline figure of fluid flow with the φoil = 0.75 contour surface shown.
Processes 07 00632 g005
Figure 6. Average oil volume fraction curves at different radial positions with different angular velocities.
Processes 07 00632 g006
Figure 7. Comparison of the air–oil interface radial position at different angular velocities.
Processes 07 00632 g007
Figure 8. Average oil volume fraction curves at different radial positions with different oil flow rates.
Processes 07 00632 g008
Figure 9. Comparison of the air–oil interface radial position with different inlet oil flow rates.
Processes 07 00632 g009
Figure 10. Average oil volume fraction curves at different radial positions with different disk spacing.
Processes 07 00632 g010
Figure 11. Comparison of the air–oil interface radial position with different disk spacing.
Processes 07 00632 g011
Figure 12. Parametric effects on the average oil volume fraction. (a) effect of the angular velocity; (b) effect of the inlet oil flow rate; (c) effect of the disk spacing.
Processes 07 00632 g012
Figure 13. Results of the local Nusselt number on the stationary disk surface along the radial direction.
Processes 07 00632 g013
Figure 14. Curve of the average Nusselt number on the stationary disk surface at different angular velocities.
Processes 07 00632 g014
Table 1. Oil volume fraction results under different mesh resolutions and speeds.
Speed15.7 rad/s18.8 rad/s21.9 rad/s
Mesh 10.48410.36080.3020
Mesh 20.49140.36630.3062
Mesh 30.49350.37210.3091
Table 2. Specifications of the grooved rotating-disk system model.
ParameterValue
r142 mm
r260 mm
h0.4 mm
H1.6–2.0 mm
Ng10