Article

Discrete Element Method (DEM) and Experimental Studies of the Angle of Repose and Porosity Distribution of Pellet Pile

1
State Key Laboratory of Advanced Special Steel, Shanghai Key Laboratory of Advanced Ferrometallurgy, School of Materials Science and Engineering, Shanghai University, Shanghai 200444, China
2
Thermal and Flow Engineering Laboratory, Faculty of Science and Engineering, Åbo Akademi University, Biskopsgatan 8, FI-20500 Åbo, Finland
*
Author to whom correspondence should be addressed.
Processes 2019, 7(9), 561; https://doi.org/10.3390/pr7090561
Submission received: 12 July 2019 / Revised: 12 August 2019 / Accepted: 20 August 2019 / Published: 23 August 2019
(This article belongs to the Special Issue Process Modeling in Pyrometallurgical Engineering)

Abstract

:
The lumpy zone in a blast furnace is composed of piles formed naturally during burden charging. The properties of this zone have significant effects on the blast furnace operation, including heat and mass transfer, chemical reactions and gas flow. The properties of the layers mainly include the angle of repose and porosity distribution. This paper introduces two methods, the Discharging Method and the Lifting Method, to study the influence of the packing method on the angle of repose of the pile. The relationships of the angle of repose and porosity with physical parameters are also investigated. The porosity distribution in the bottom of a pile shows a decreasing trend from the region below the apex to the center. The coordination number of the particles is employed to explain this change. The maximum of the frequency distribution of it was found to show a negative correlation to the static friction coefficient, but becomes insensitive to the parameter as the static friction coefficient increases above 0.6.

1. Introduction

The lumpy zone of the blast furnace (BF) is composed of layers of piled burden formed naturally during charging. Two significant variables characterize the properties of the layers: The angle of repose and porosity distribution, which reflect the external shape and internal structure, respectively. The former reflects the stability and surface profile of the piles. The latter is a direct reflection of the permeability of the burden, which is closely connected to the gas flow resistance and heat exchange efficiency between the burden and gas in the blast furnace. Therefore, an improved understanding of the formation mechanism and internal state of a pile is important when measures are to be taken to improve the efficiency of the conditions in the upper part of the blast furnace. The coordination number (CN) is an important parameter reflecting the internal structure of the granular pile, which is closely related to porosity. However, it is difficult to gain a deep understanding of the flow and packing of granular materials by experimental methods, due to the complex behavior of granular materials in bulk systems [1,2]. Therefore, numerical simulation has become an interesting and viable option, and, in particular, the discrete element method (DEM). This method can provide estimates of the position, velocity and stress information of each particle in a granular system.
The angle of repose is a fundamental property of a pile, which usually reflects the liquidity potential of it. By simulation, it has been found that the angle of repose is related to DEM parameters, such as the rolling and static friction coefficient [3]. Elperin et al. [4] and Coetzee et al. [5] revealed that the angle of repose is positively correlated with the friction coefficient, but when the friction coefficient increases to a certain value, the angle of repose does not any longer increase or instead even decreases, due to the collapse of the pile. Alizadeh et al. [6] also found that the angle of repose is strongly affected by the particle shape. Furthermore, the particle size [7,8] and packing method [9] also influence the angle of repose.
Porosity is closely related to the permeability of the packed bed. Thus, by adjusting the porosity in the BF can help control the gas distribution, and thus, the heat transfer and reactions in the lumpy zone. It has been observed that the gas permeability of the stock column will deteriorate rapidly when the porosity is reduced to or below 0.3. It is easier to measure the porosity of particles in a container either in an experiment or in simulation than in the real process. Zou and Yu [10] presented experimental research on porosity by using a cylindrical container and found that the initial porosity of a pile is strongly dependent on both particle shape and packing method. Another simulation work by the same authors [11] concluded that particle size also influenced the porosity. However, there are only a few publications on the porosity distribution in a three-dimensional particle pile, which is of interest for the distribution of gas flow in industrial applications, such as in reactors, moving and fluidized beds.
Iron oxide particles are used as the main raw material in the blast furnace. Still, many papers on the simulation of gas-solid two-phase flow in the blast furnace have not considered the radial distribution of porosity, even though the porosity distribution is known to be non-uniform. Therefore, it is an important aspect to consider. The present work studied the effects of DEM parameters and packing method on the properties of pellet piles, with the aim to provide insights that can be used in modeling and further research on the porosity distribution of burden in the blast furnace.
Packing density, as the opposite of porosity, has also been studied by many investigators. Most studies focus on packing density of spherical [12,13,14] and non-spherical particles [15,16,17,18,19,20] in a container by dense or loose packing [15]. However, as it is hard to measure the porosity distribution of a conical pellet heap, there are still few publications in this field, due to the anisotropic properties of granular materials, the complexity of pile structure and the opaque mechanism by which the packing evolves in three dimensions [1]. DEM has become a viable choice for studies on the properties of granular piles, and therefore this modeling method has become popular in blast furnace investigations [21,22,23,24].
The present work introduces several novel aspects, including the treatment of the porosity distribution in the pile and the fact that industrial-scale pellets are studied, as well as the 1:10 scale-charging system used. The paper studies the angle of repose and porosity distribution of a pile of iron oxide pellet by experimental and numerical methods. Section 2 introduces the experimental work, including the methods and apparatus. The simulation theories and conditions are presented in Section 3. In Section 4, the angle of repose and porosity distribution of a pellet pile are studied to validate the DEM physical parameters determined by the discharging method. The effects of packing method on the angle of repose are also discussed. Finally, the conclusions of the work are proposed.

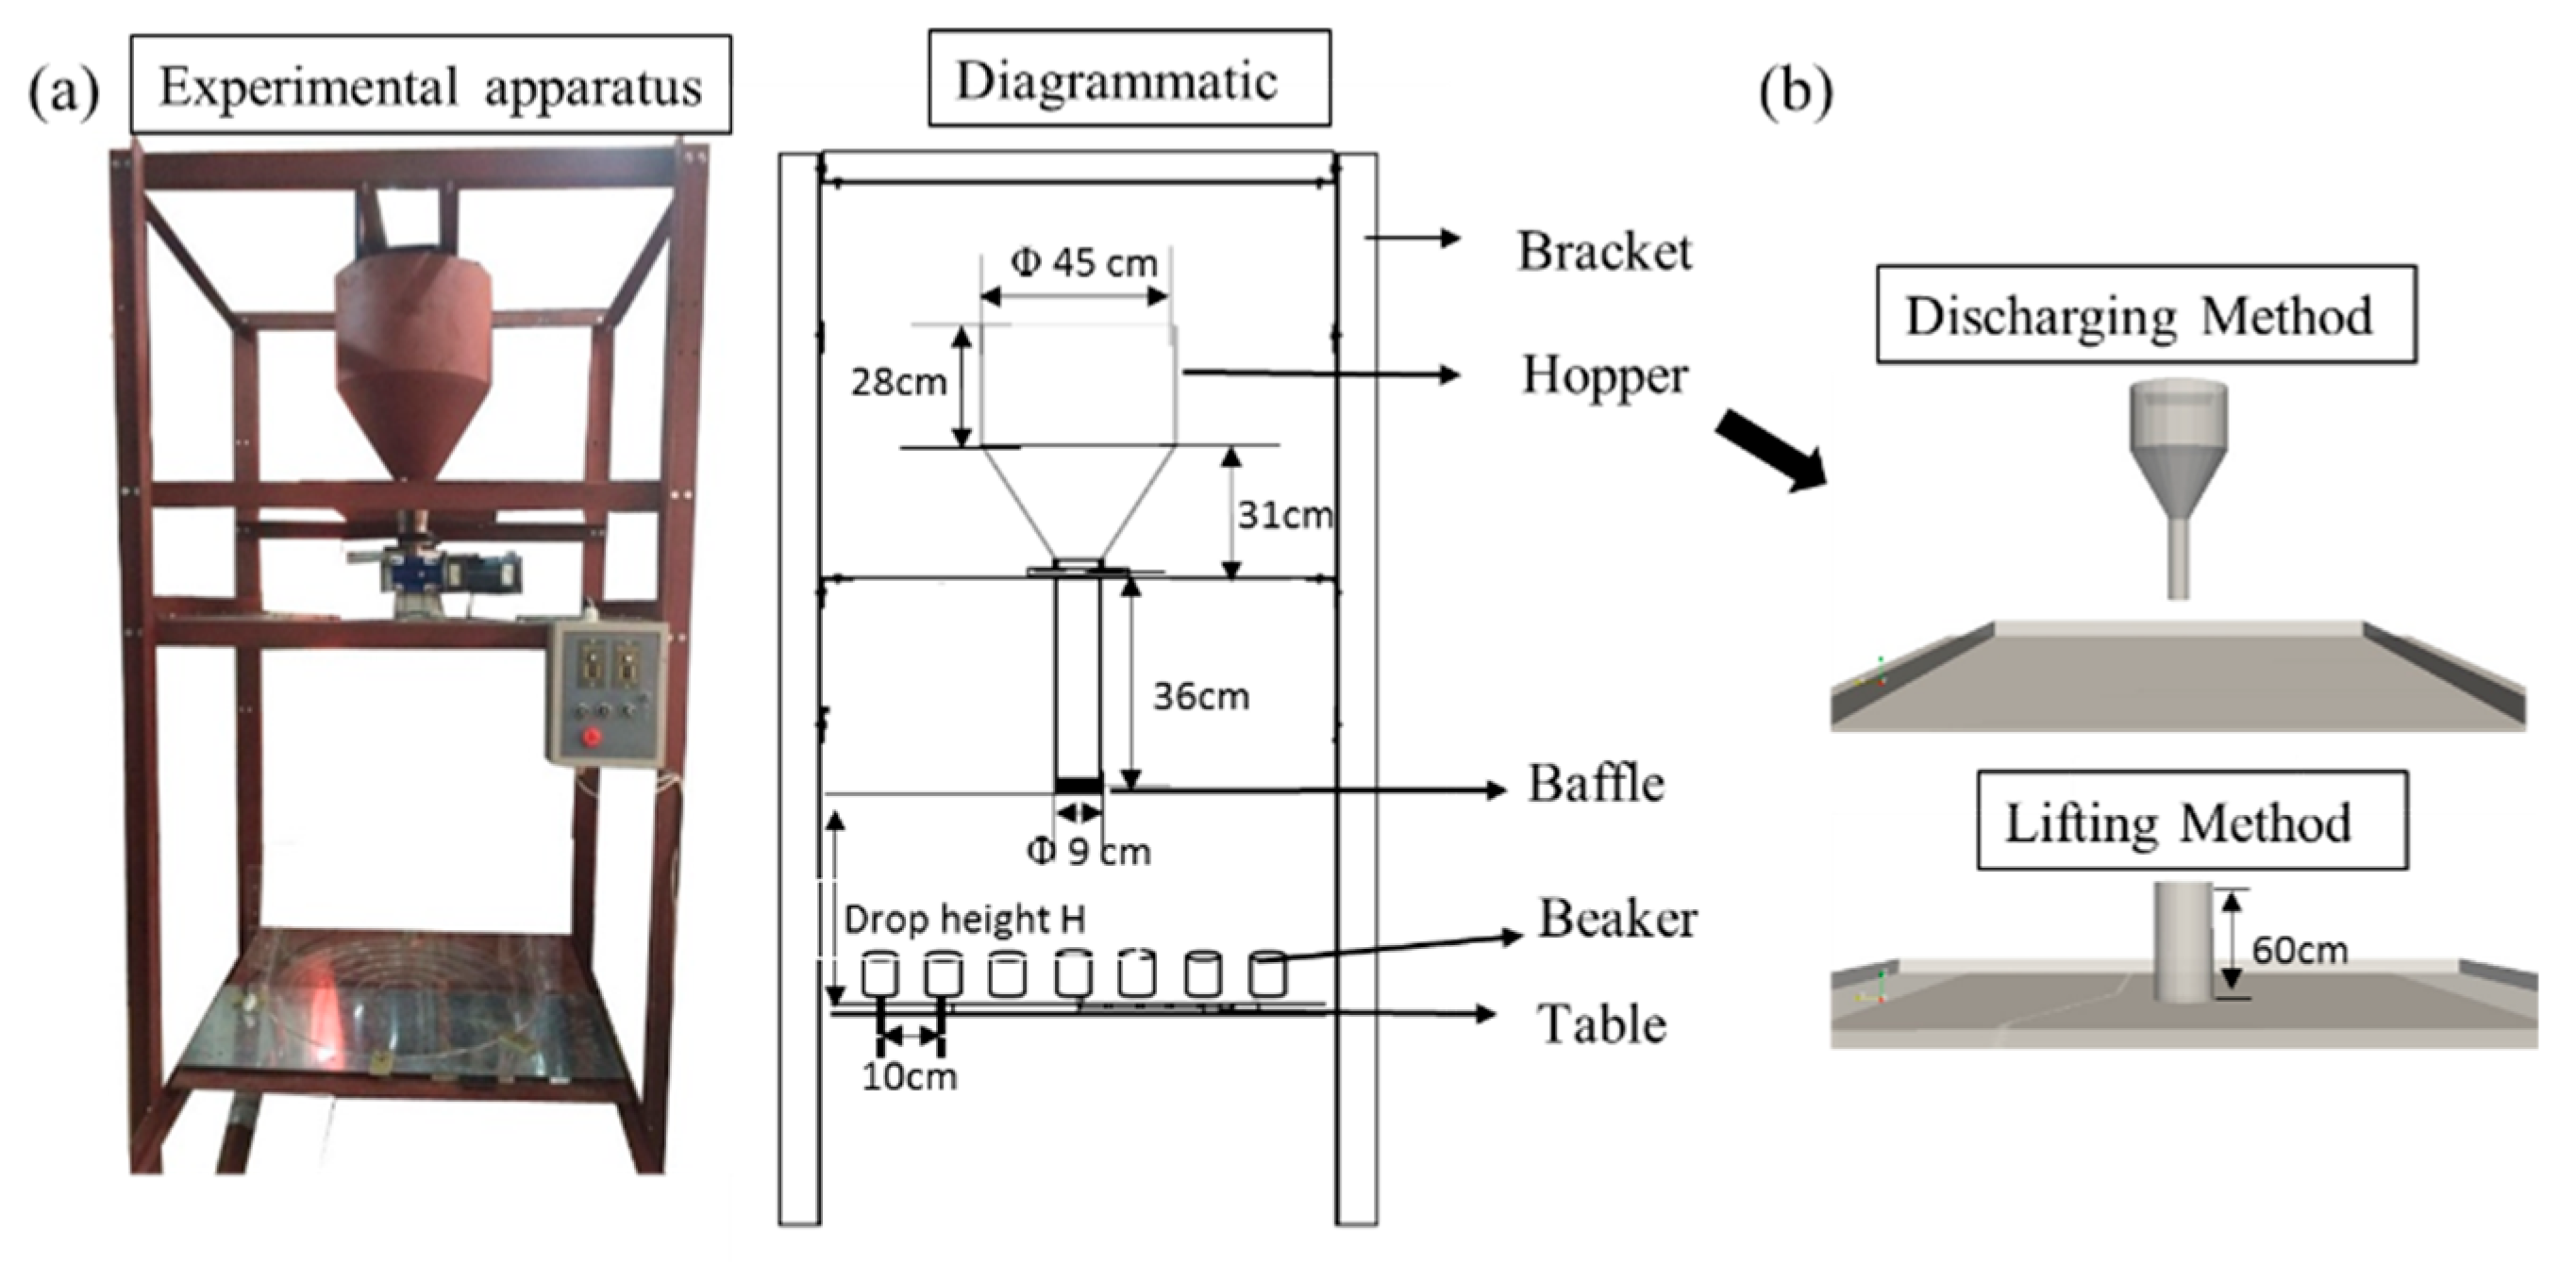
2. Experimental Work

The experimental study is based on iron oxide pellets. As the shape of the pellet is close to that of a sphere, spherical particles were used in the simulations to be presented. In fact, particle shape affects the porosity of the pile, but since we focus of pellets, particle shape was not considered. The reader is referred to Reference [25] for more information about this matter.
Pellets used in the experiments come from a steel plant in China. About 10,000 pellets were selected after applying sieves with aperture size in the range 13–15 mm. The experimental apparatus is illustrated in Figure 1a, which is a 1:10 scale charging system of a BF. A stable pellet pile was formed on a table by the discharging method. In order to study the profiles of the arising pile, a camera with the lens level along with the desktop was used to take photographs from four different directions of the pile. The angle of repose was obtained by analyzing the profile of the heap using photograph-processing technology.
The same method was used to form a pile for measuring the porosity distribution. Seven 25 mL (plexiglass) breakers placed beforehand to be buried in the pellet pile were slowly removed afterwards to be able to measure the porosity (P), expressed b y
P = V 1 V × 100 % ,
where V1 and V denote the void volume (mL) of beakers full of particles and the volume of the empty beaker, respectively. In order to reduce the errors, the experiment was repeated nine times, and the average result was reported.

3. Simulation Method and Conditions

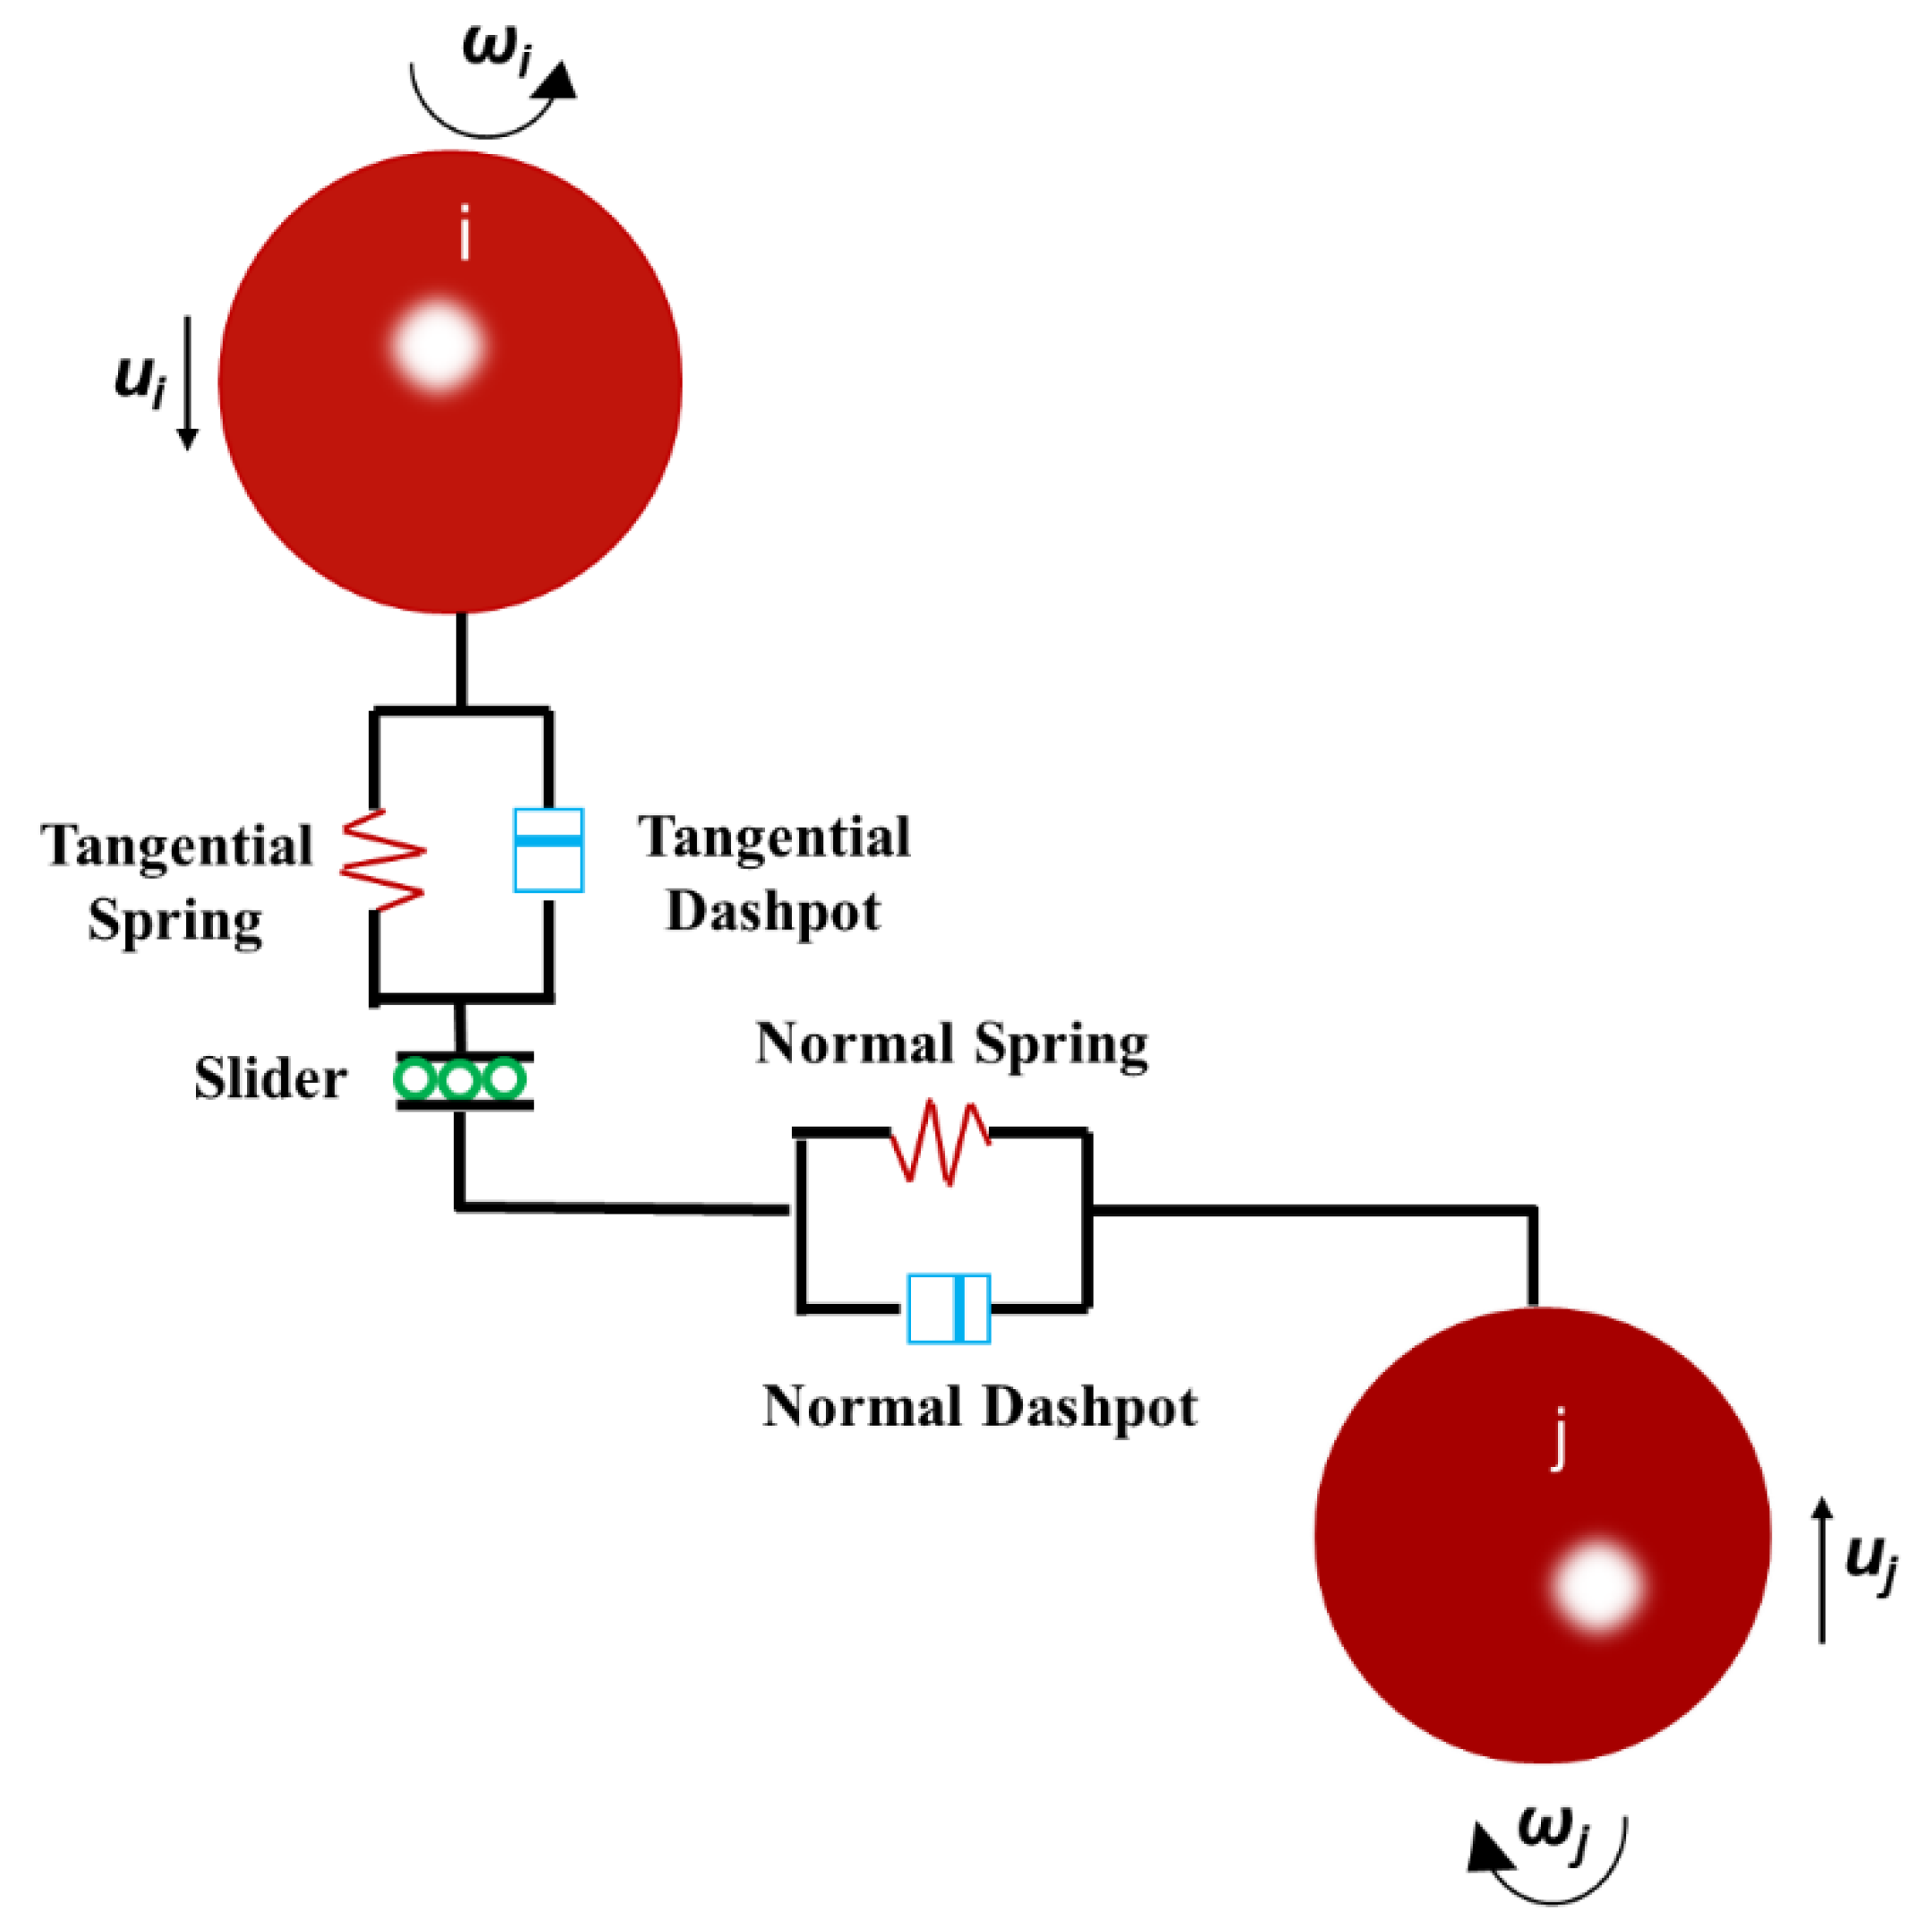
3.1. Discrete Element Method (DEM)

The simulation part of this research is based on DEM, which was firstly proposed by Cundall and Strack [26]. This method considers two types of motion of a particle, translation and rotation, which are governed by Newton’s second law of motion. The elastic contact force expression used in this work is the non-linear Hertz-Mindlin no-slip model [27], which is illustrated in Figure 2. The basic expressions are given in Equations (2) and (3). The former is the translational equation, which is composed of gravitational force, mig, contact force and viscous contact damping force, where Kn, Kt, γn and γt express the normal elastic constant, tangential elastic constant, normal damping constant and tangential damping constant, respectively. A particle with the mass of mi contacts with K particles, and the contact force between them depends on the deformation between particles, δn. In the equation, ui, vn and vt represent the translational velocity, and the component of relatively velocity for the normal and tangential directions.
m i d u i d t = j = 1 K ( K n δ n i j γ n v n i j ) + ( K t δ n i j γ t v t i j ) + m i g
Equation (3) represents the rotational movement of particles, where M r k and M r d are two torques, which are caused by a tangential force and rolling friction. A Coulomb-type friction law is used to express the friction between the two particles. Ii and ωi denote the moment of inertia and rotational velocity, respectively.
I i d ω i d t = j = 1 K ( M r k + M r d )
Table 1 presents the formulas used to calculate the forces and torques between the particles. In this work, we use the open-source software LIGGGHTS 3.5.0 [28] implementation of DEM.

3.2. Simulation Conditions

The apparatus of the Discharging Method in the simulation consists of a hopper, a baffle and a table, just like the components used in the experiments. In the Lifting Method, the apparatus is only a column barrel. The geometric models are both shown in Figure 1b. DEM parameters of pellet were chosen according to the results of previous work by the authors [29] and are presented in Table 2. In the simulations, we studied the effects of the DEM parameters on the angle of repose and porosity distribution. Furthermore, the effects of different drop heights of the Discharging Method, as well as the effects of lift speed and barrel size in the Lifting Method, on the angle of repose of the pile were also investigated.
For the simulation of porosity, we used seven boxes (5 cm × 10 cm × 5 cm) placed along the diameter of the bottom of the pile to measure the bottom porosity distribution (BPD). In determining whether a particle belongs to the box, its central coordinates were used. The porosity of the bed in each box can be calculated by
P = ( 1 n V p V ) × 100 % ,
where V is the volume of the box and Vp is the volume of a single pellet, and n is the number of particles in the box.

4. Results and Discussion

4.1. Simulation and Experimental Study of Angle of Repose

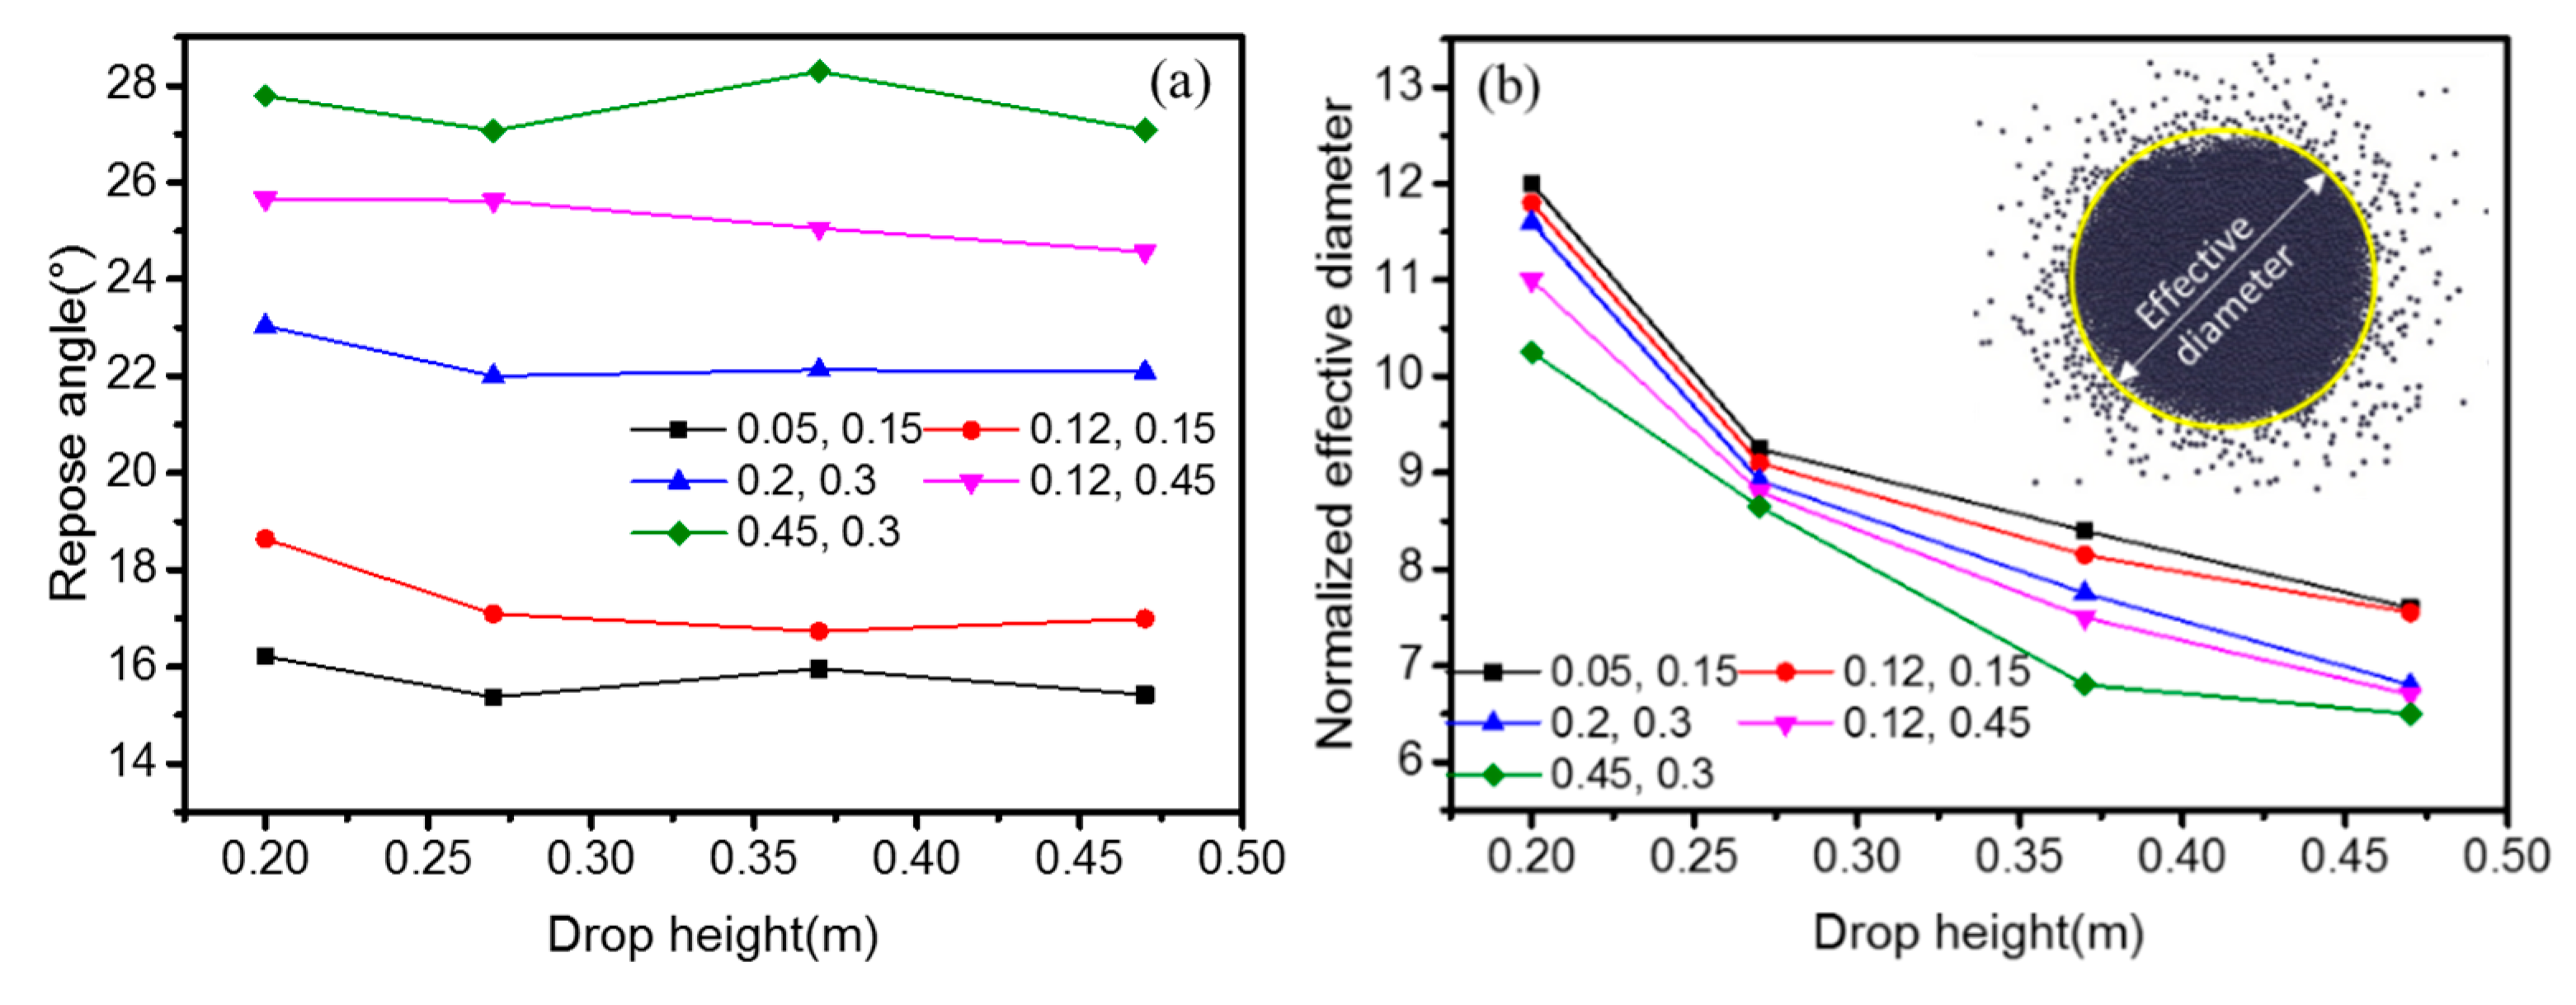
4.1.1. Angle of Repose by the Discharging Method

We first studied the influence of DEM parameters on the angle of repose of the pellet pile. As the effect of a physical parameter is studied, the other parameters were kept unchanged at the values reported in Table 2. From work reported in the literature [2], it is known that the angle of repose is sensitive mainly to the rolling and static friction coefficients between the particles. Vertical cross-sections of the pellet pile with different rolling and static friction coefficients are shown in Figure 3. It was observed that when the rolling and static friction coefficients increase from low (0.01) to high (0.99) values, the shape of the pile changed a lot, especially for the latter parameter. The results of contour extractions of the heap are shown in Figure 4. It is obvious that the height of the pile increases and then tends to be stable.
Figure 5 shows the angle of repose with different rolling and static friction coefficients, with error bars indicating the deviation of the angle of repose in different directions of the pile. The angle of repose shows a positive correlation with the friction coefficients. When the static and rolling friction coefficients change from 0.01 to 0.99, the angle of repose of the pellet pile changes about 8° and 20°, respectively, which indicates that static friction coefficient has a stronger impact on the angle of repose. In general, high static friction is always accompanied by high rolling friction, and the latter depends on the physical properties on the particle surface. However, there is a decreasing trend when μ r > 0.6 or μ s > 0.8 . A reason may be that the heap has reached the maximum stable angle at this point, and a further increase in the friction coefficient will cause the heap to collapse.
In addition to the effects of the DEM parameters on the angle of repose, the external conditions, such as the drop height cannot be ignored. Figure 6a shows the angle of repose for different drop heights for pellets with different static and rolling friction coefficients. It reveals that when the drop height increases, the angle of repose decreases and this trend will weaken when the friction coefficients increase. It was found that with an increase in the drop height, the bottom size of the heap decreased. Therefore, we define the normalized effective diameter (NED) to express the size, which is the diameter of the bottom circle of the heap where most particles gather, neglecting the particles scattered around the heap because there is an obvious boundary of the high-density particle area and the scattered particle area. Figure 6b shows that for particles with a large coefficient of static friction, the NED of the pile is small. In addition, the NED decreases sharply initially and then levels out when the drop height increases. The reason is that particles will have large kinetic energy when dropping from a high location, and when the particles collide with the packed bed, they more easily bounce and scatter around the heap.

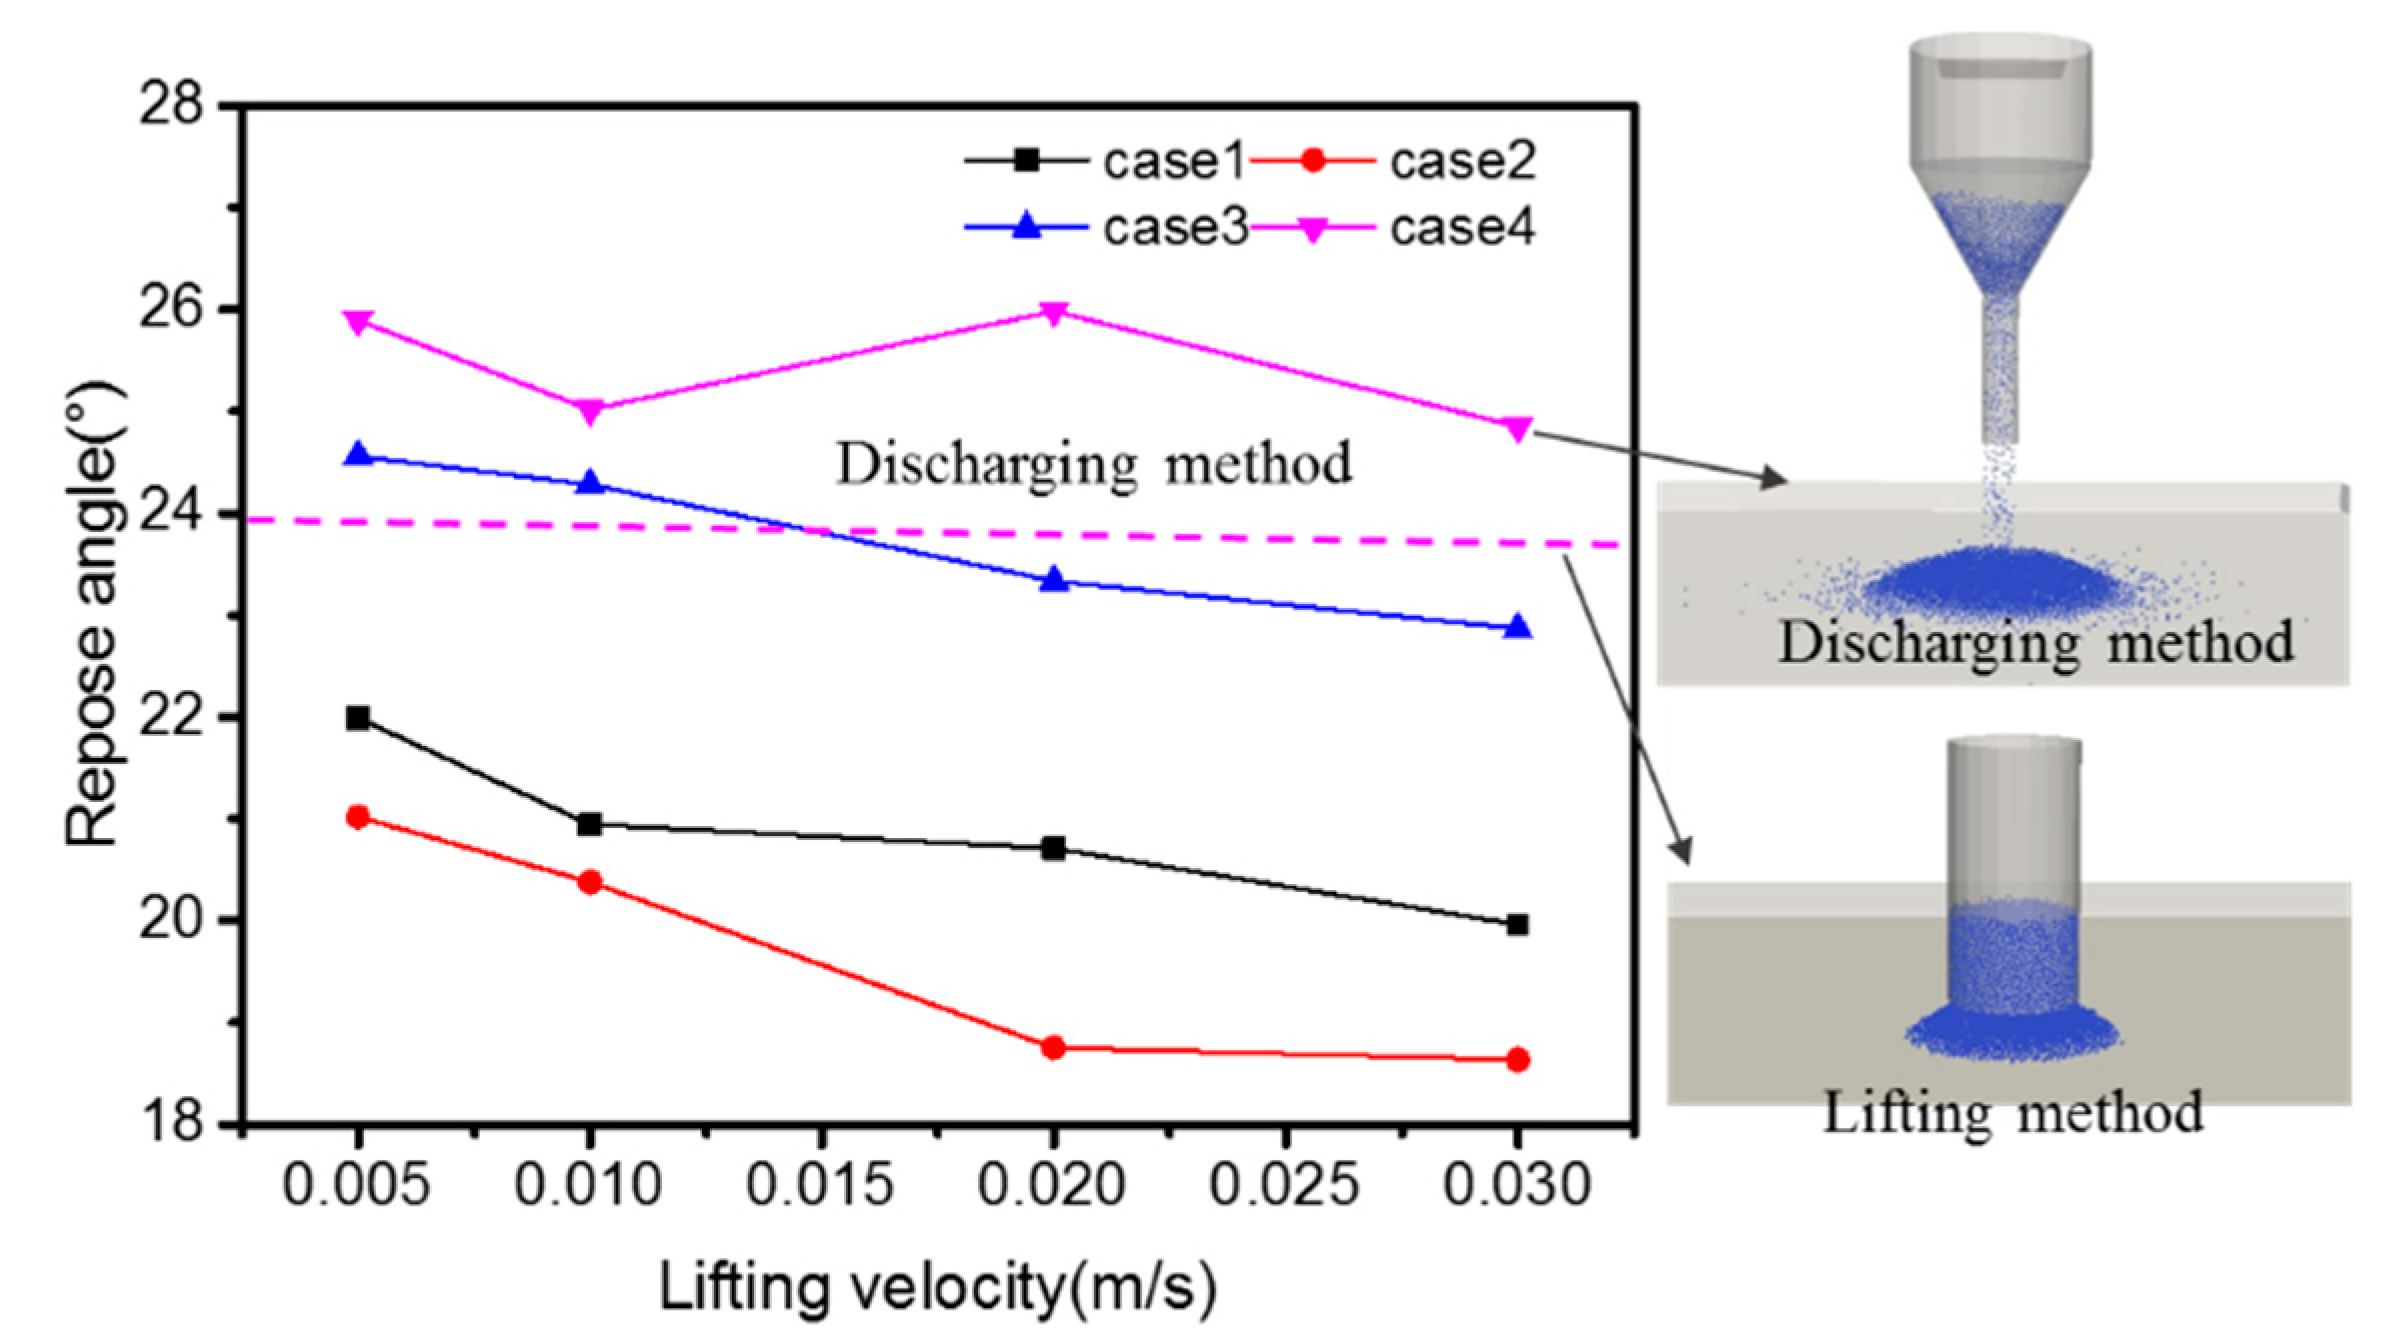
4.1.2. The angle of Repose by the Lifting Method

In the simulation of the Lifting Method, we designed four different cases (Table 3) to study the influence of the barrel size and lift speed on the angle of repose. Case 1 and Case 2 have the same coefficient of friction, but different barrel size. All the cases were considered with four different lifting velocities (0.005 m/s, 0.01 m/s, 0.02 m/s and 0.03 m/s). Figure 7 shows the angle of repose with different lifting velocities. The angle of repose tends to decrease when the lifting velocity increases, and this trend is weakened as the friction coefficient increases because a small lifting velocity makes it easier to keep the particles in their original positions. Through comparing Cases 1 and 2, it can be seen that the angle of repose will increase if the barrel size gets smaller. The dotted pink line and solid pink line in Figure 7 represent the angle of repose with different packing methods, but the same DEM parameters, which reveals that the angle of repose formed by the Lifting Method is larger than that determined by the Discharging Method.

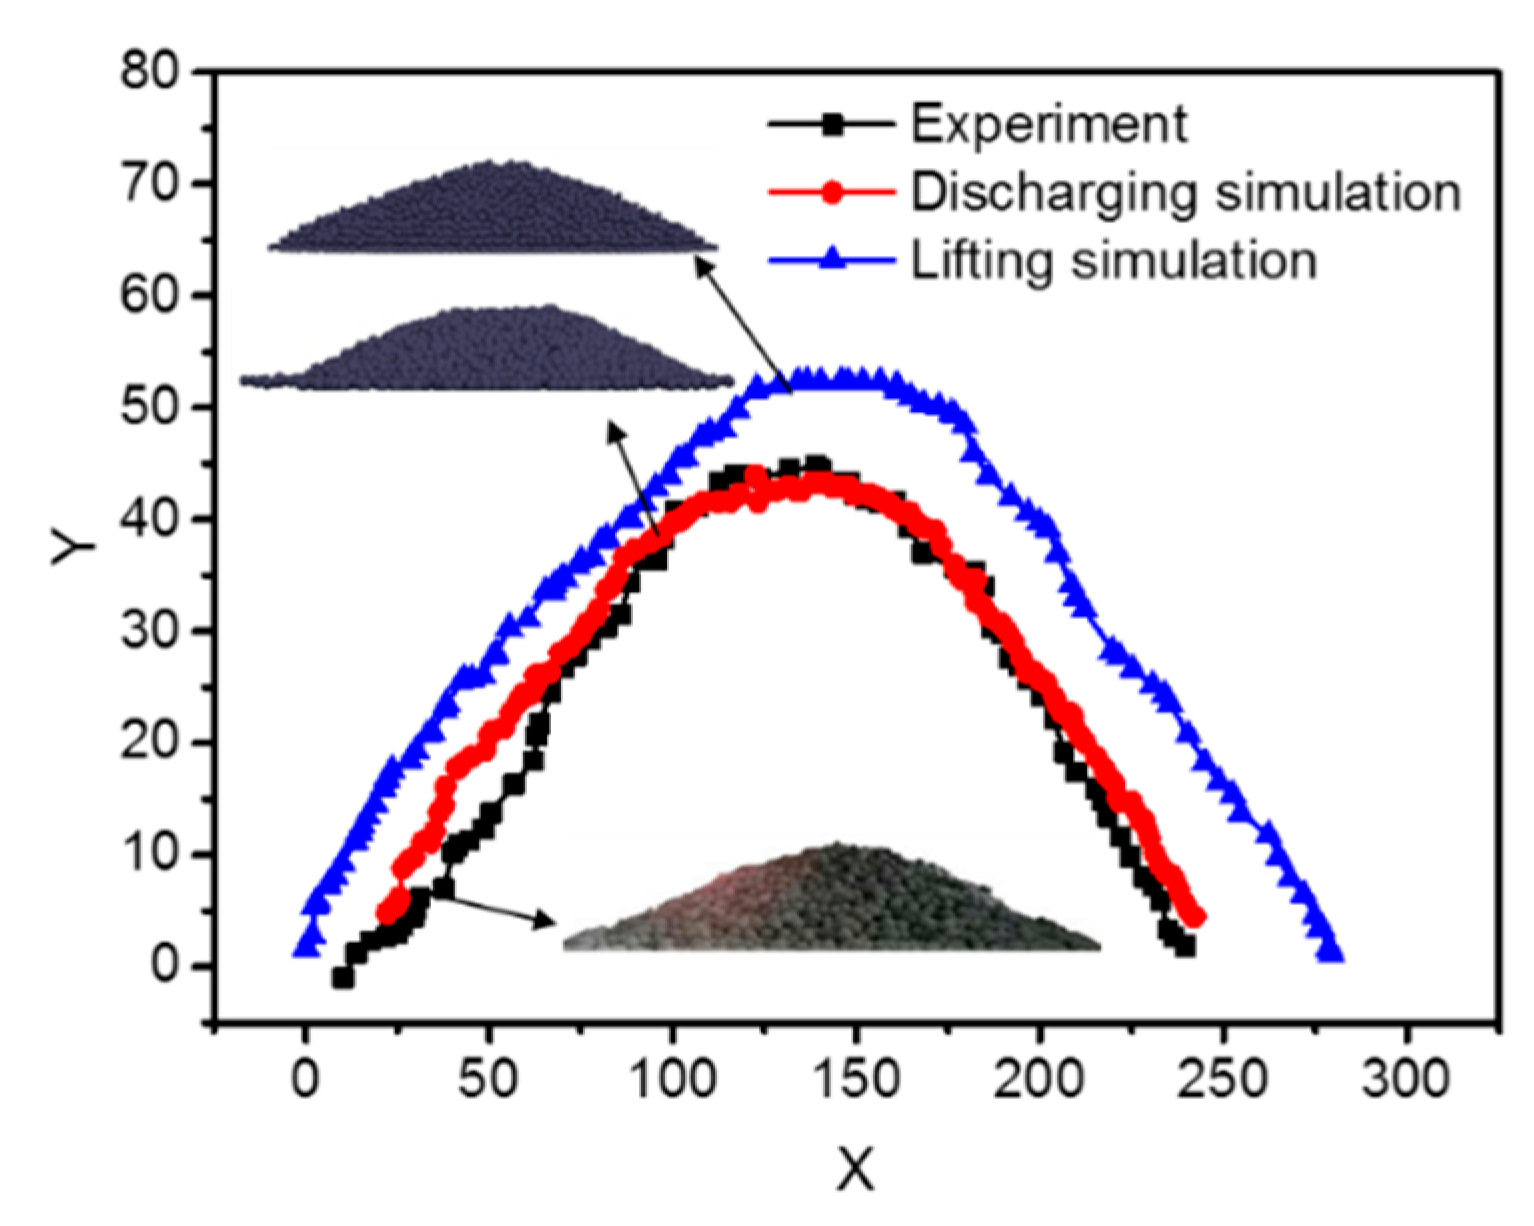
4.1.3. Simulated vs. Experimental Angles of Repose

The average of the experimentally determined angle of repose of the pellet pile is about 25°. Comparing it with the simulated results in Figure 5, we found that when μ r = 0.12 and μ s = 0.15 , the experimental and simulated results agree well. Thus, these two values can be used to study the BPD and average porosity of pellet piles. The profiles of the experimental and simulated heaps seen in Figure 8 as black and red lines illustrate the agreement. The figure also shows that the Lifting Method gives a higher heap and a larger angle of repose than the Discharging Method.

4.2. Porosity Distribution of Pellet Pile

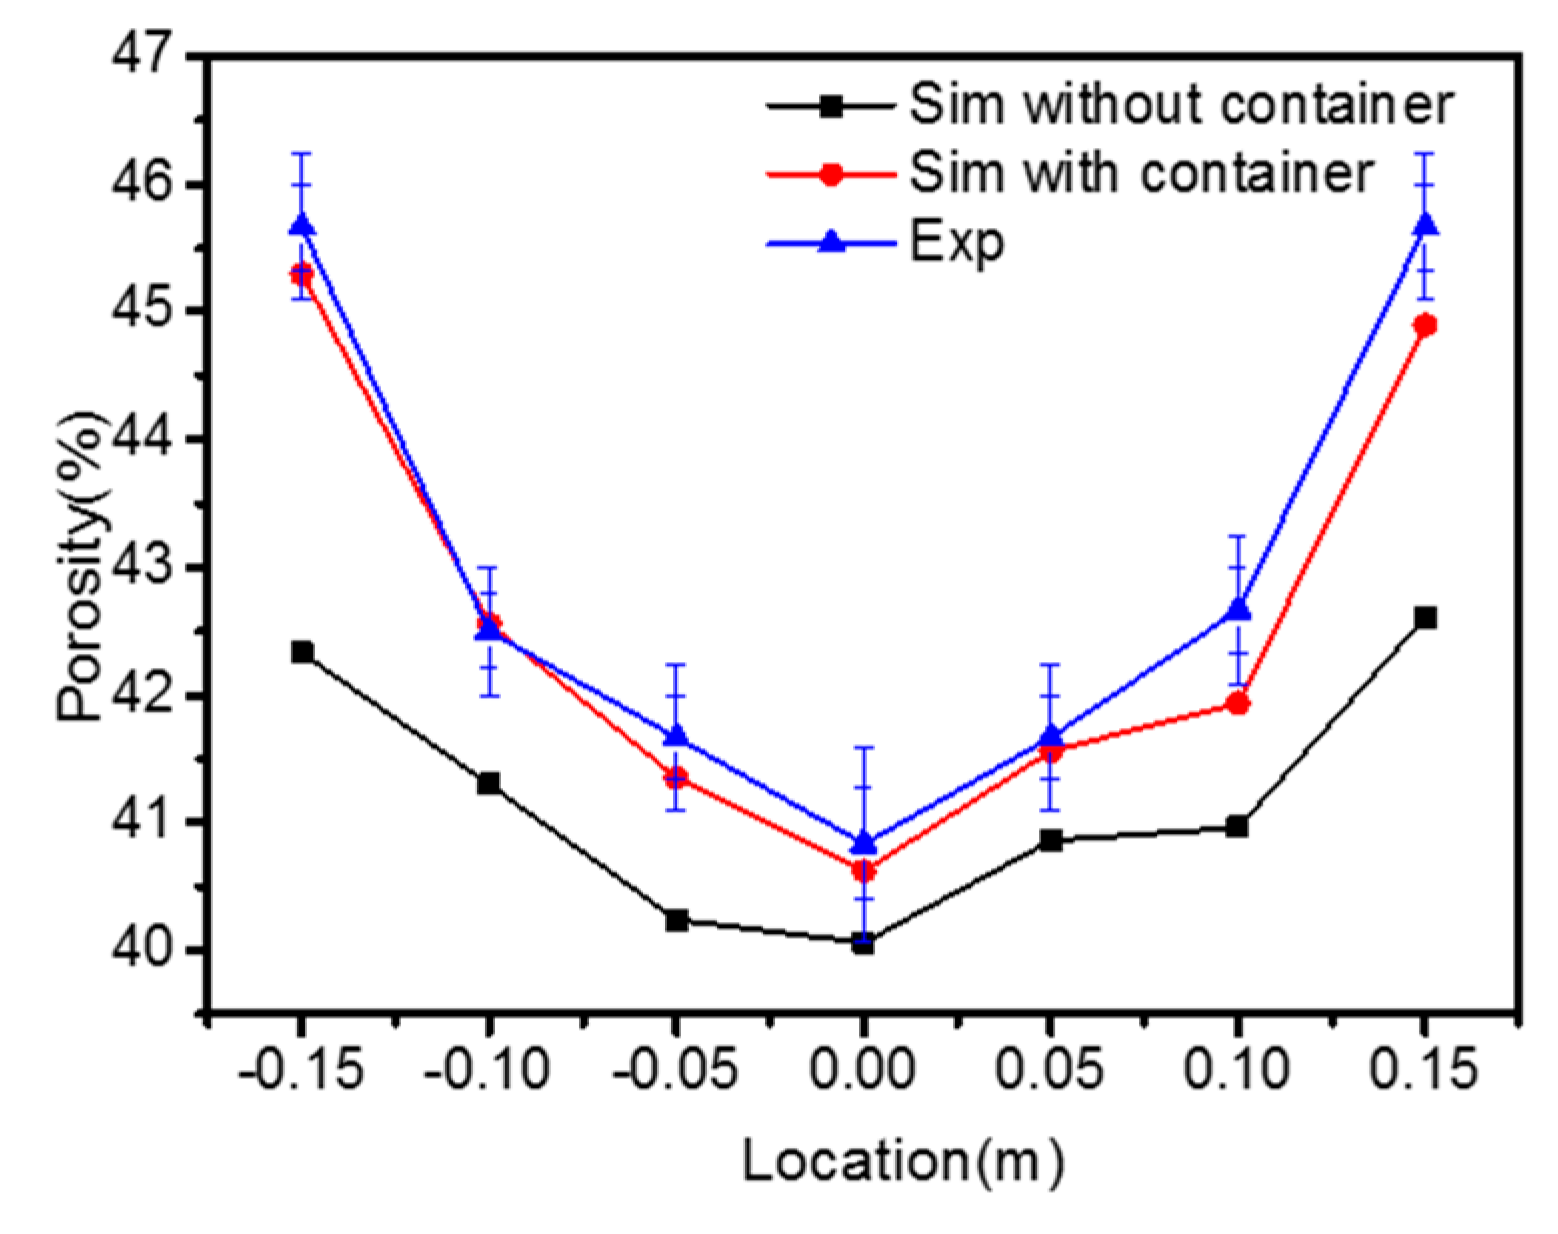
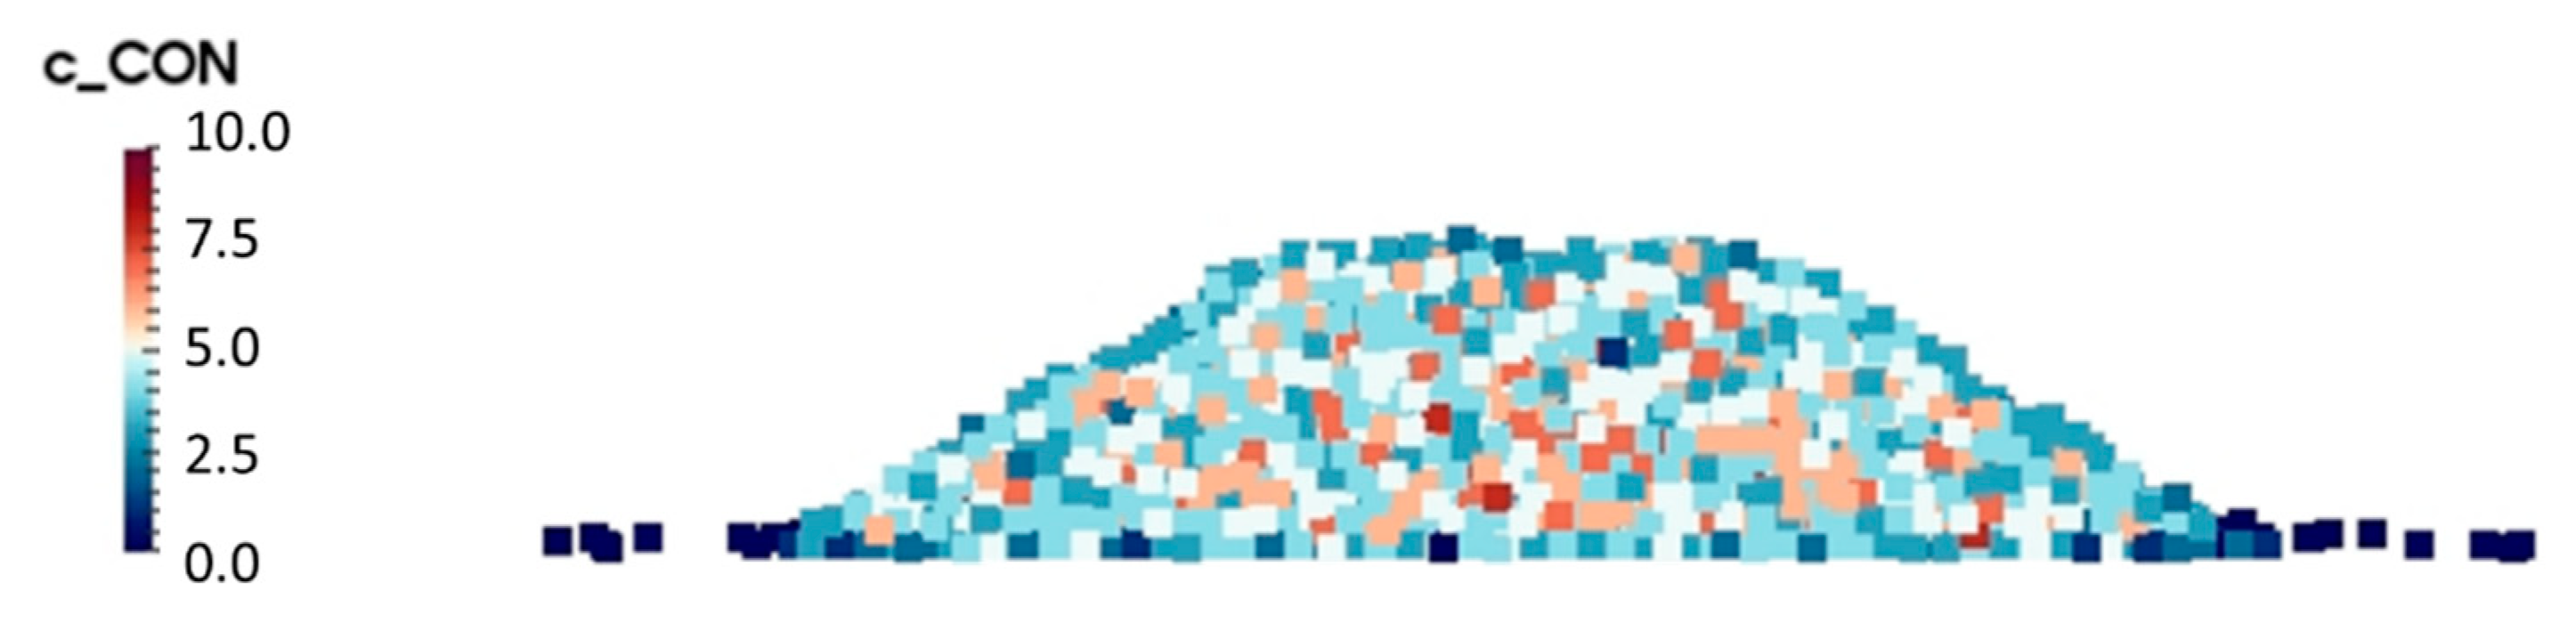
4.2.1. Simulated vs. Experimental BPD

The BPD of the pile is used to specifically and quantitatively describe the pile porosity. Figure 9 shows the simulated and experimental BPD of the pellet pile measured by the containers. The simulated results include porosity distribution in containers and in-unit boxes. The coordinate 0.00 on the abscissa represents the center position of the pile, and ±0.15 represent the edges. The trends of the curves are seen to be the same in the experiments and simulations. The porosity distribution shows a V-shaped appearance, where the central value is lower than that at the edge. In fact, the experimental and simulated values measured by the containers are all larger than the real ones (without containers) because of the so-called wall effect. The difference of the simulated results (equal value of BPD) with containers and without containers can be used to quantify this effect. We found that the wall effect would result in an error of 3.3 percent points compared with direct measurement without a container. In Figure 9, the experimental porosities are a little larger than the simulated ones because a drainage method was used to measure the porosity in the experiments, and the operation loss of water leads to a larger porosity. In order to further study the distribution of the porosity, the coordination number (CN) was employed, where CN expresses the number of particles in contact with one particle. Figure 10, where different colors represent different values, indicates that CN increases from the edge to the center of the pile, because of the compact packing of particles in the center. These results coincide with the findings on the porosity distribution. The central position of the heap is formed by the vertical falling particles, which have greater kinetic energy, causing a more compact structure of the pile. After the formation of the initial heap, the pile with the continuous falling particles will collapse, and the edges form.

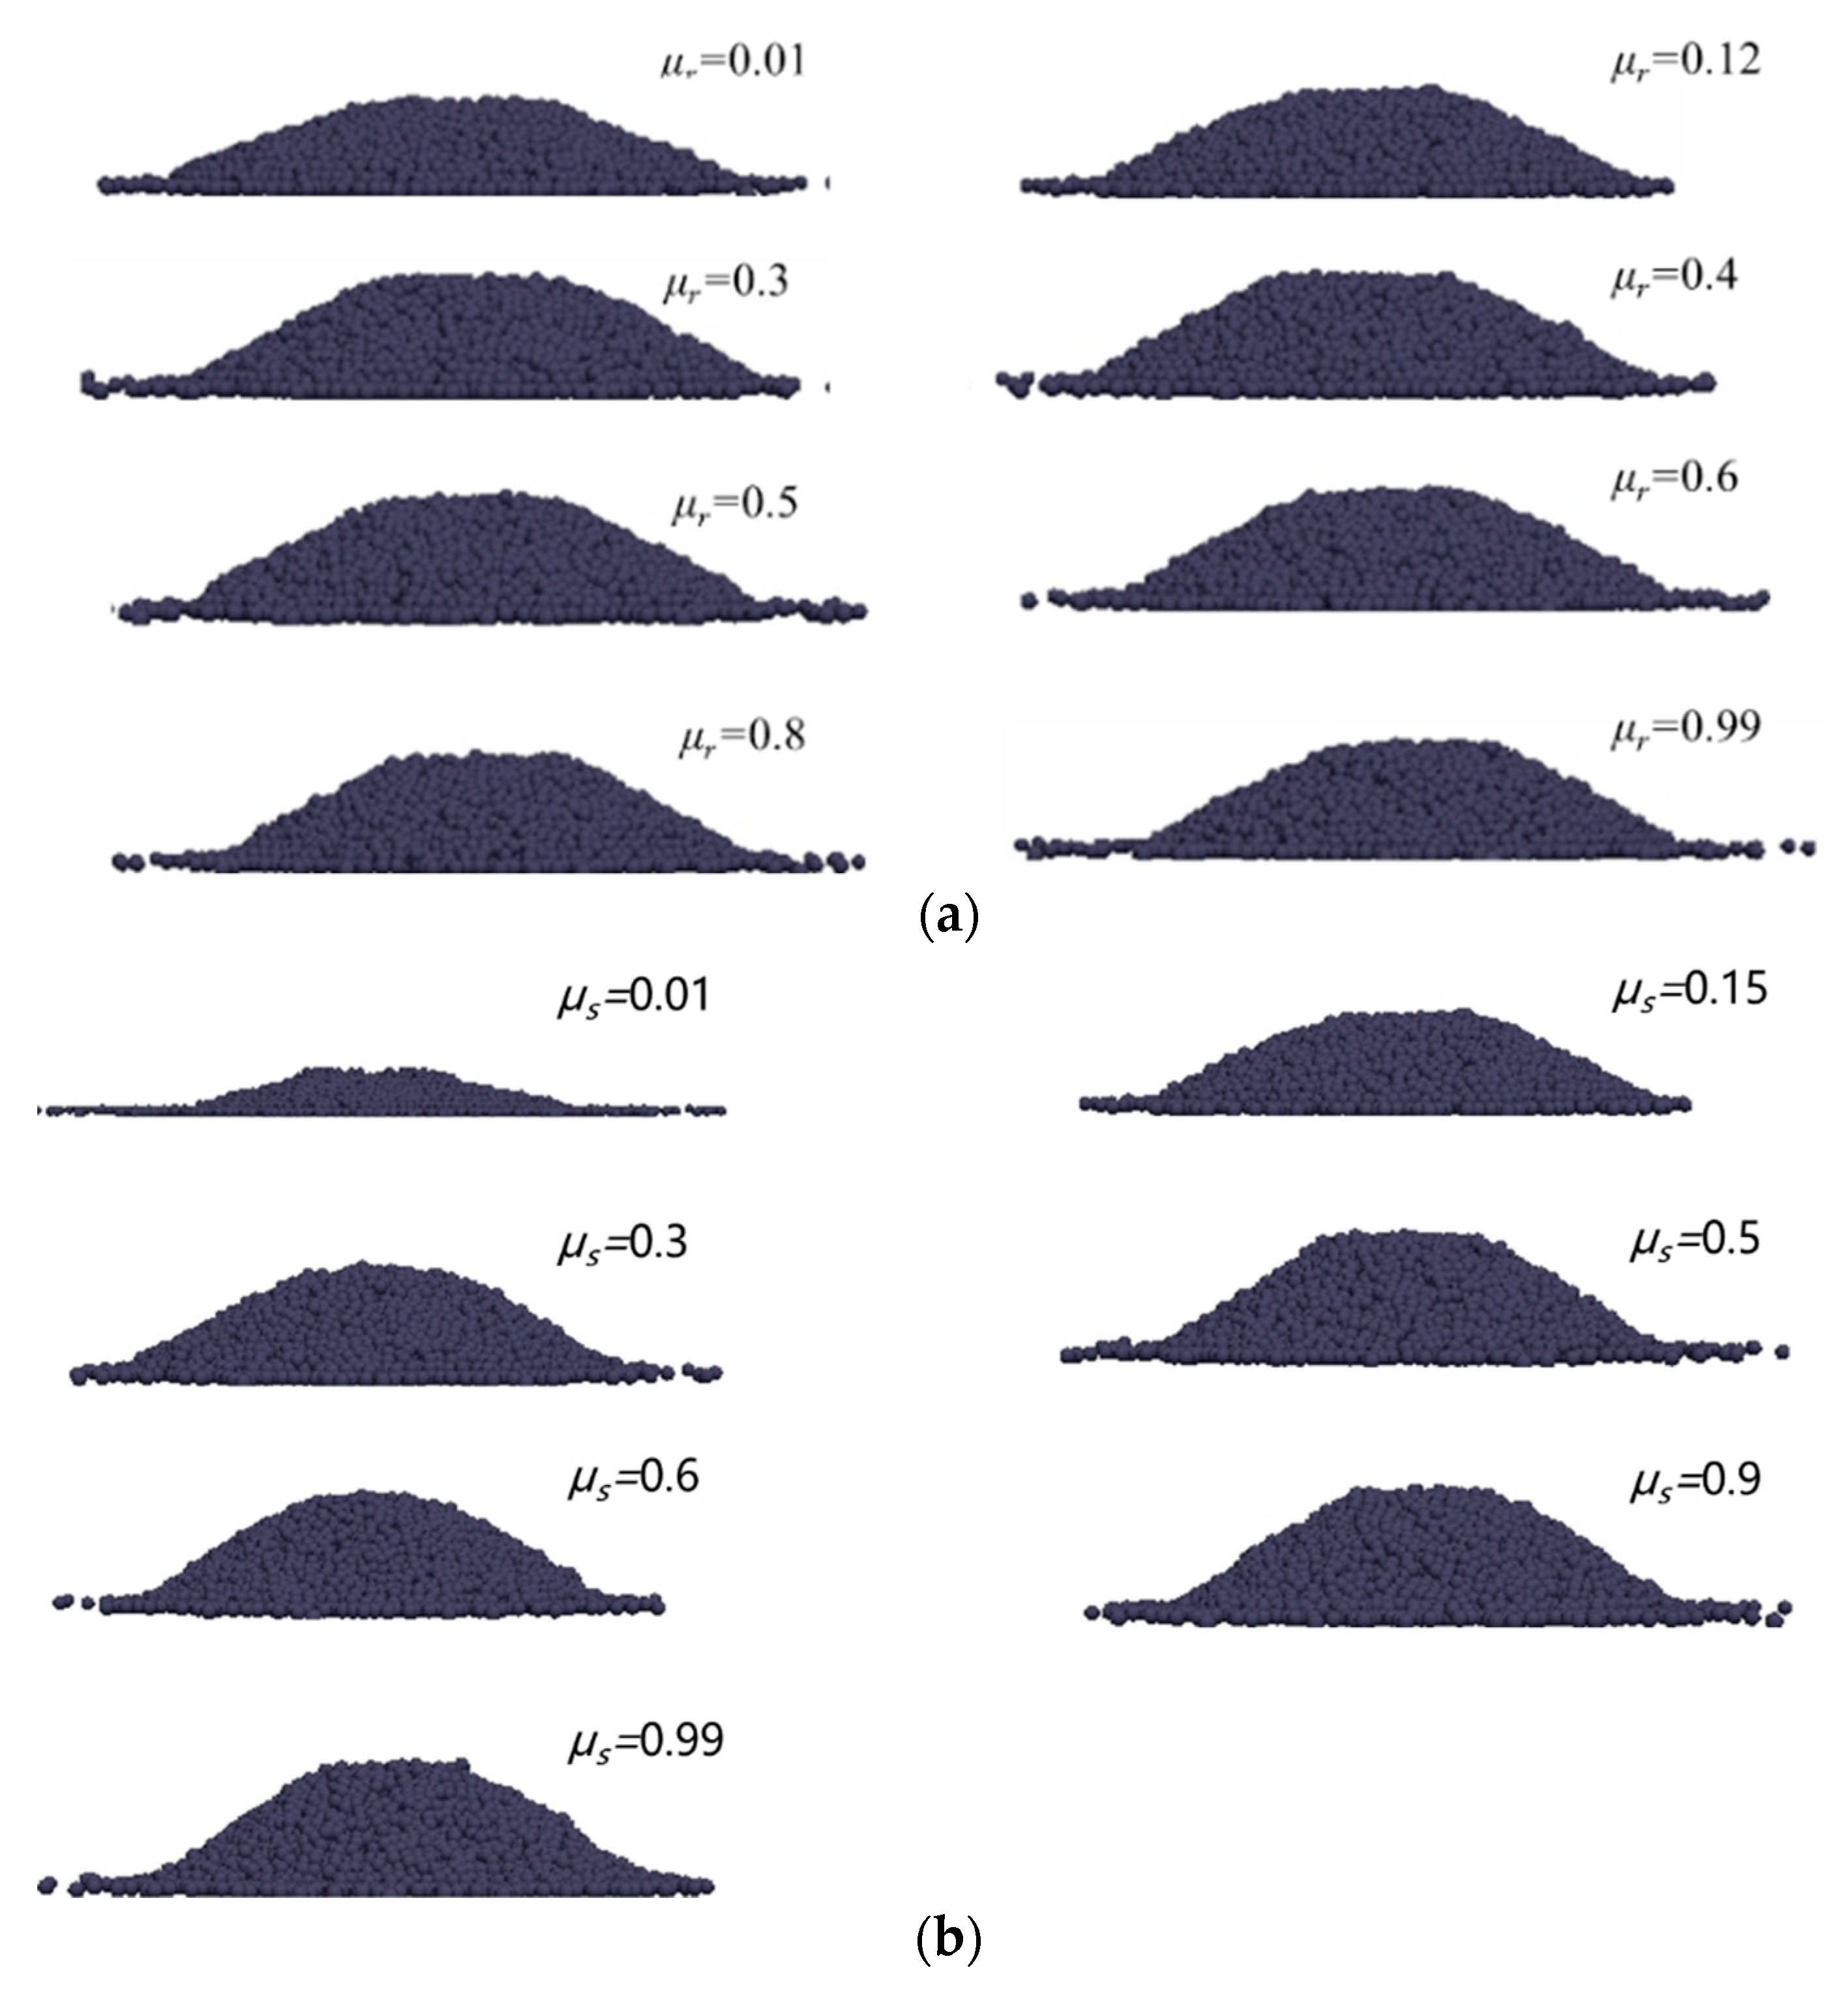
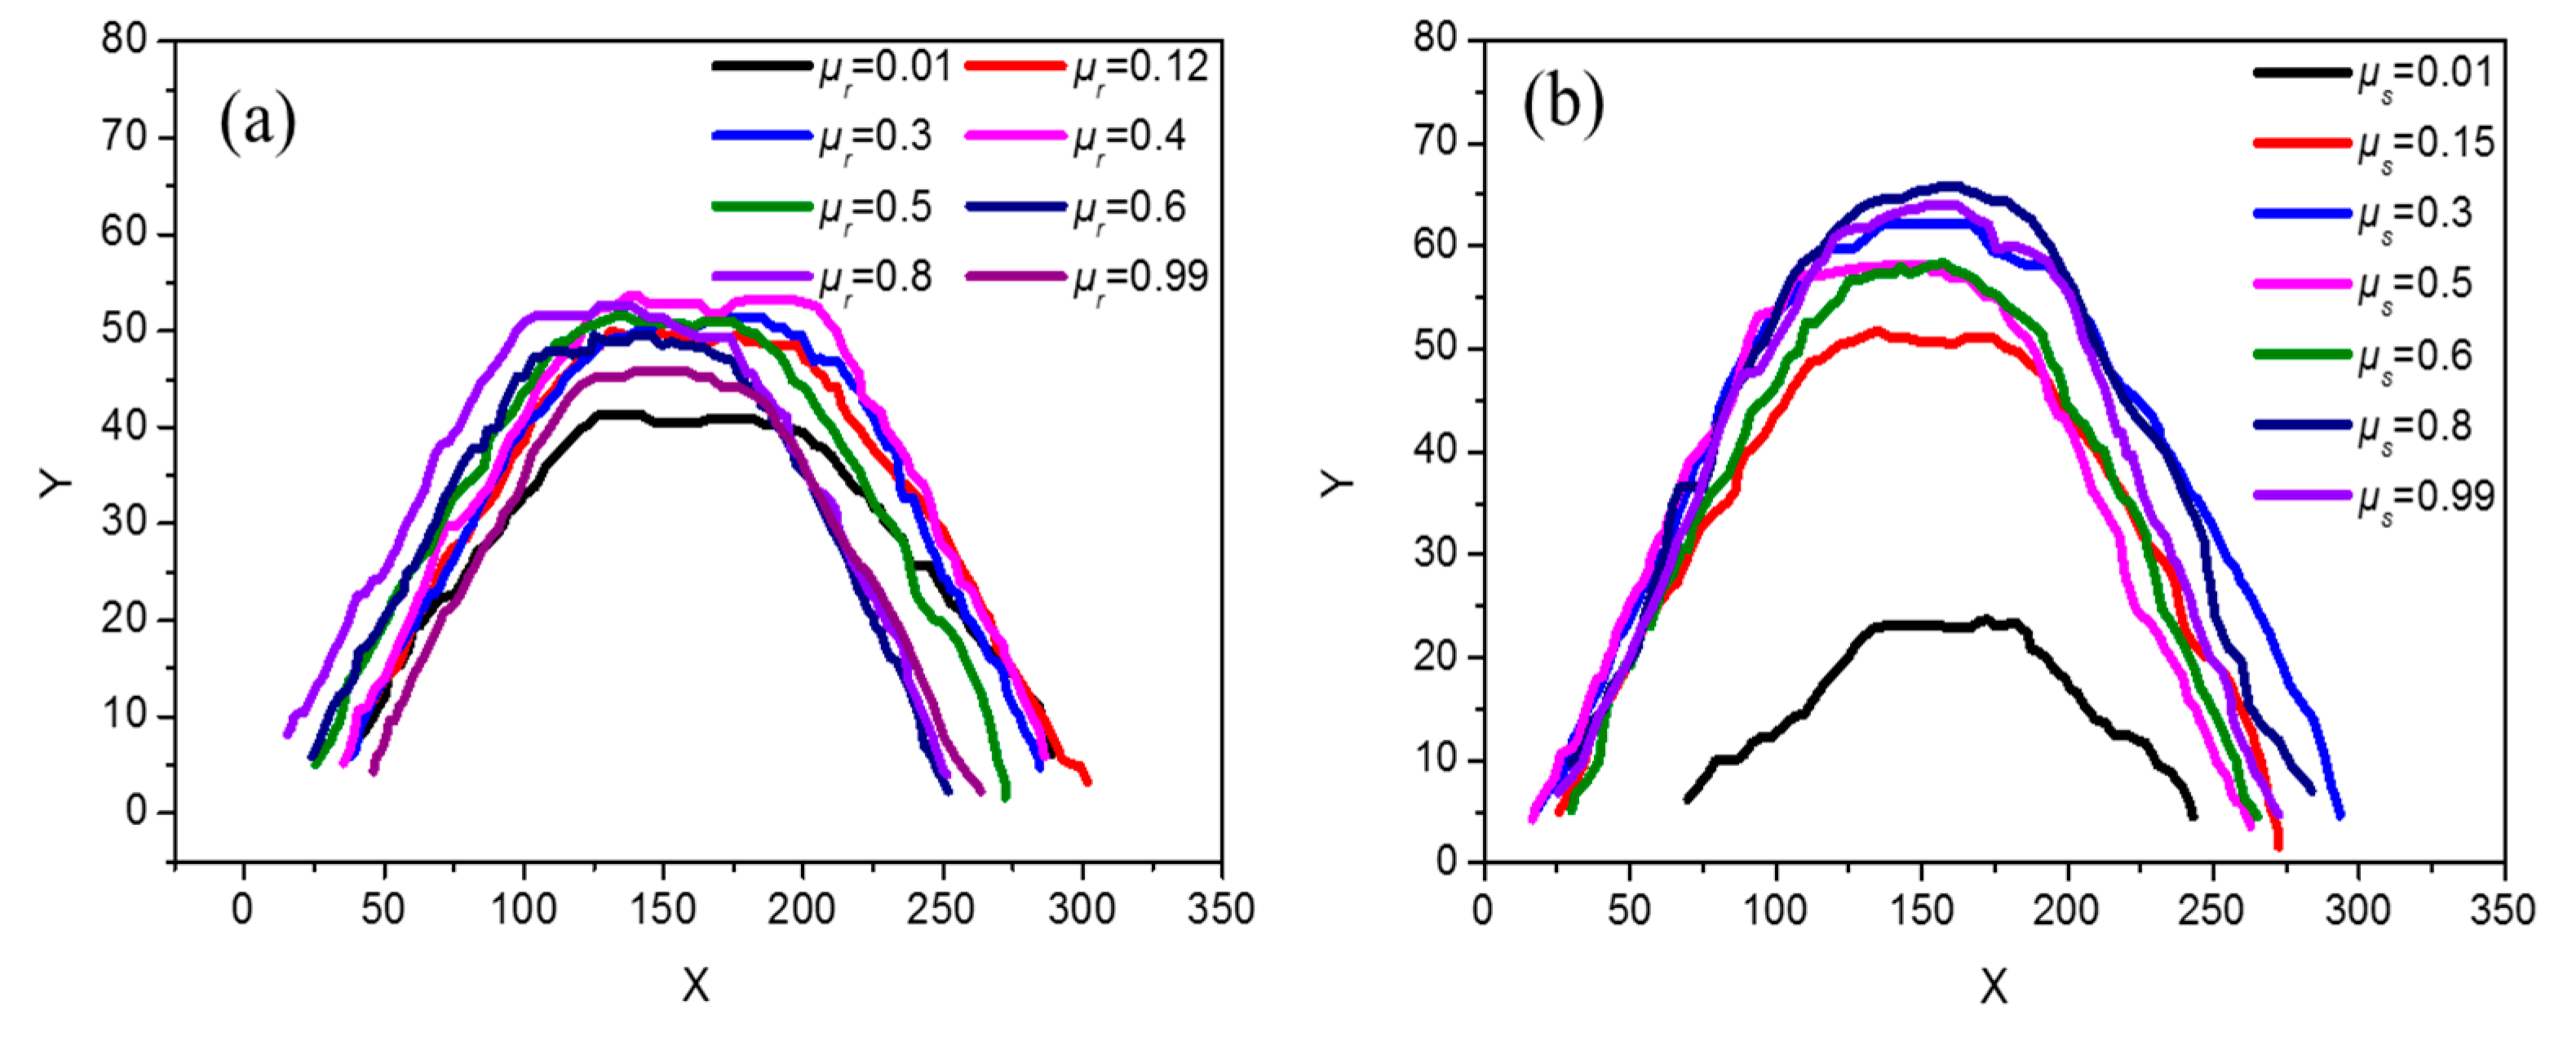
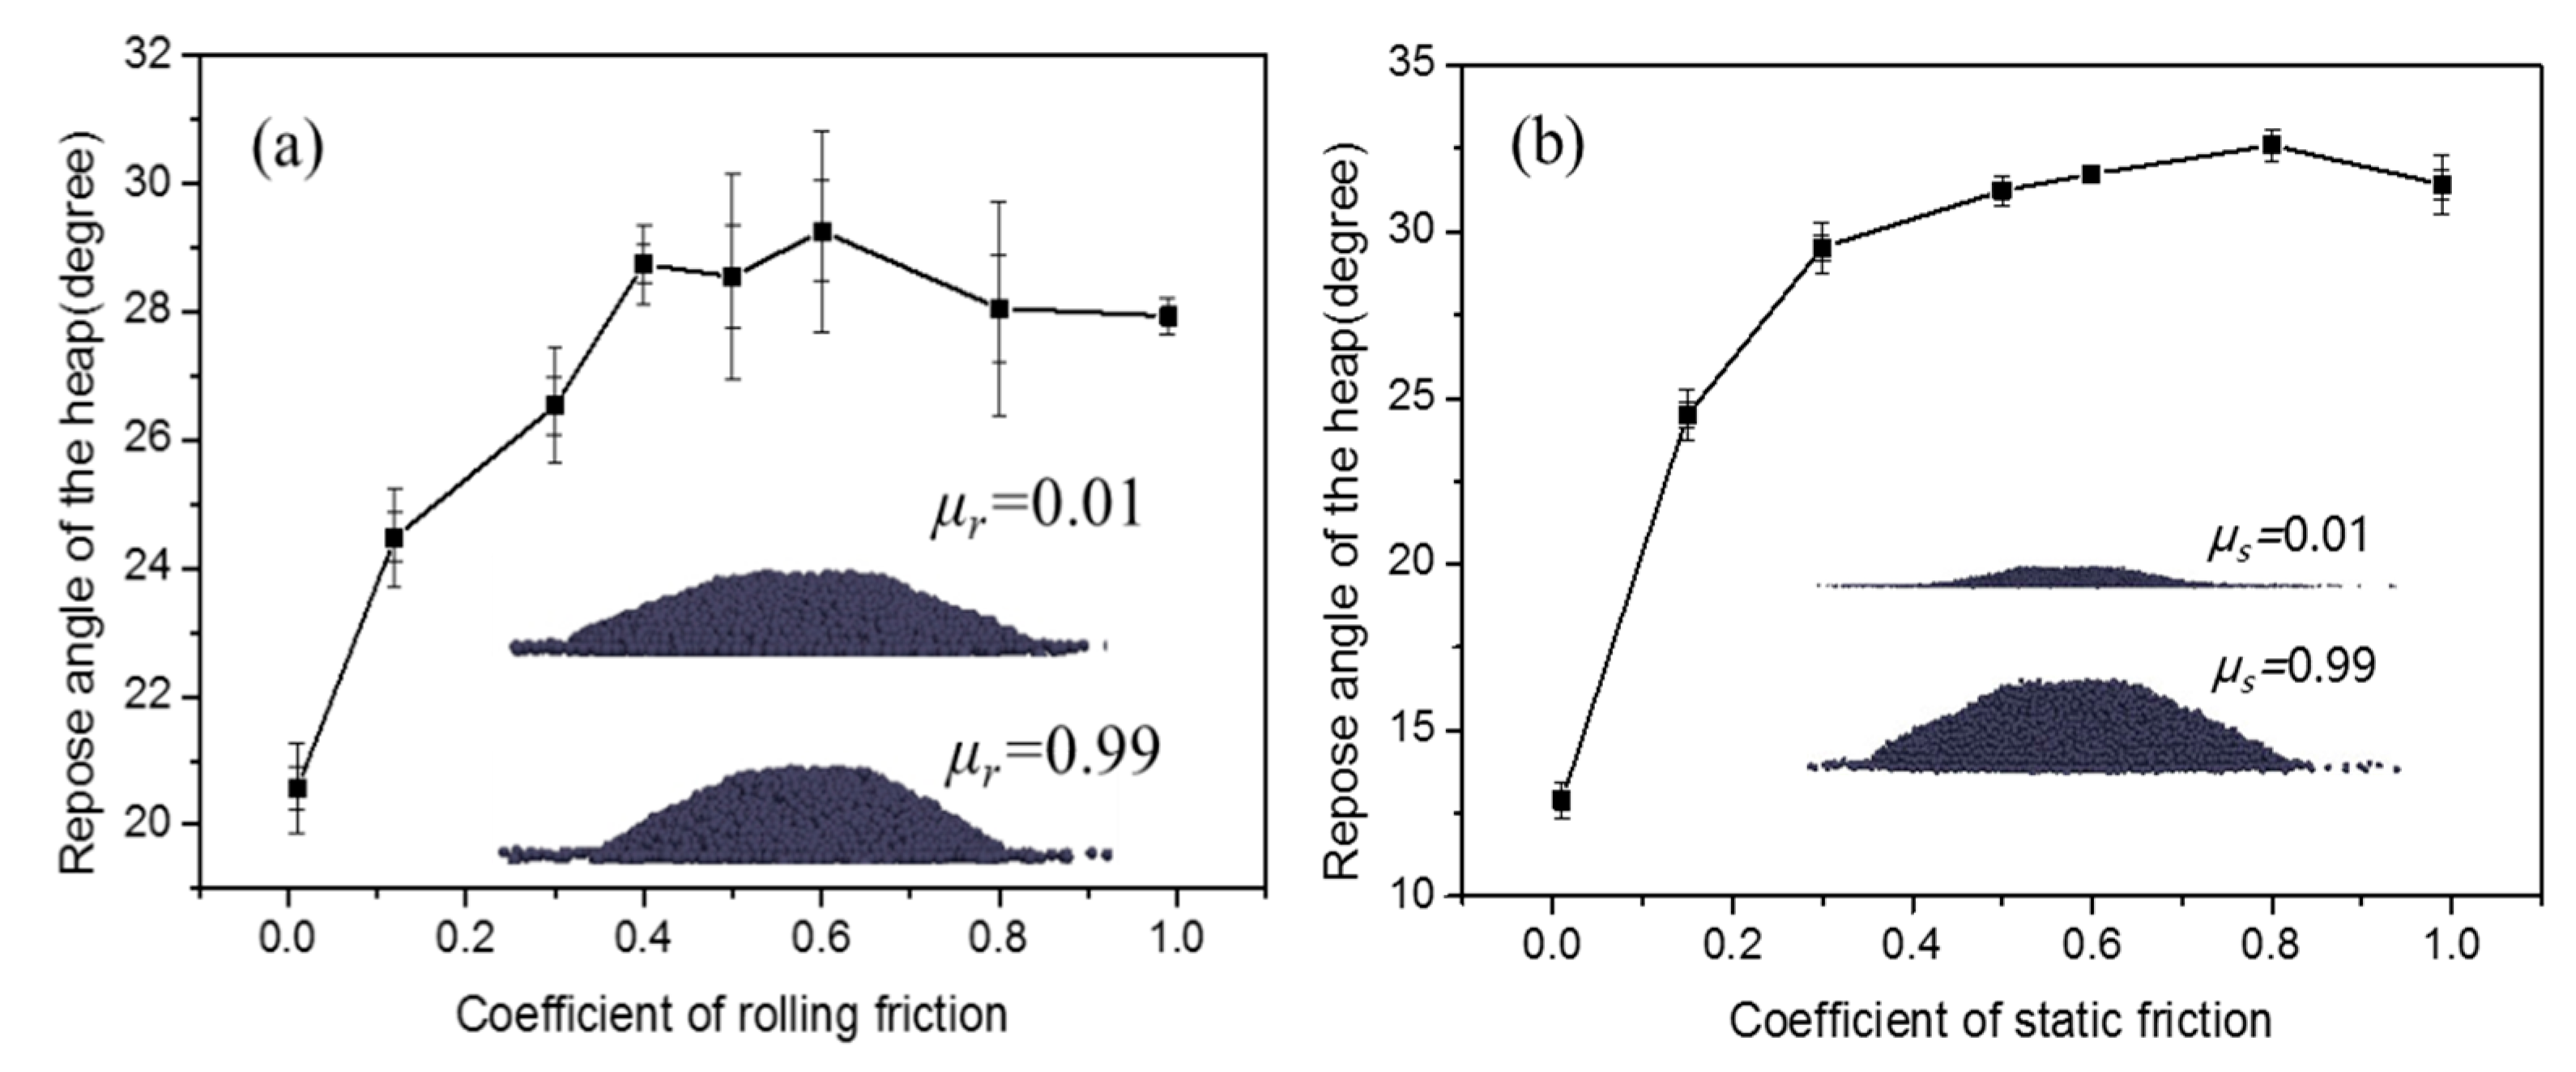
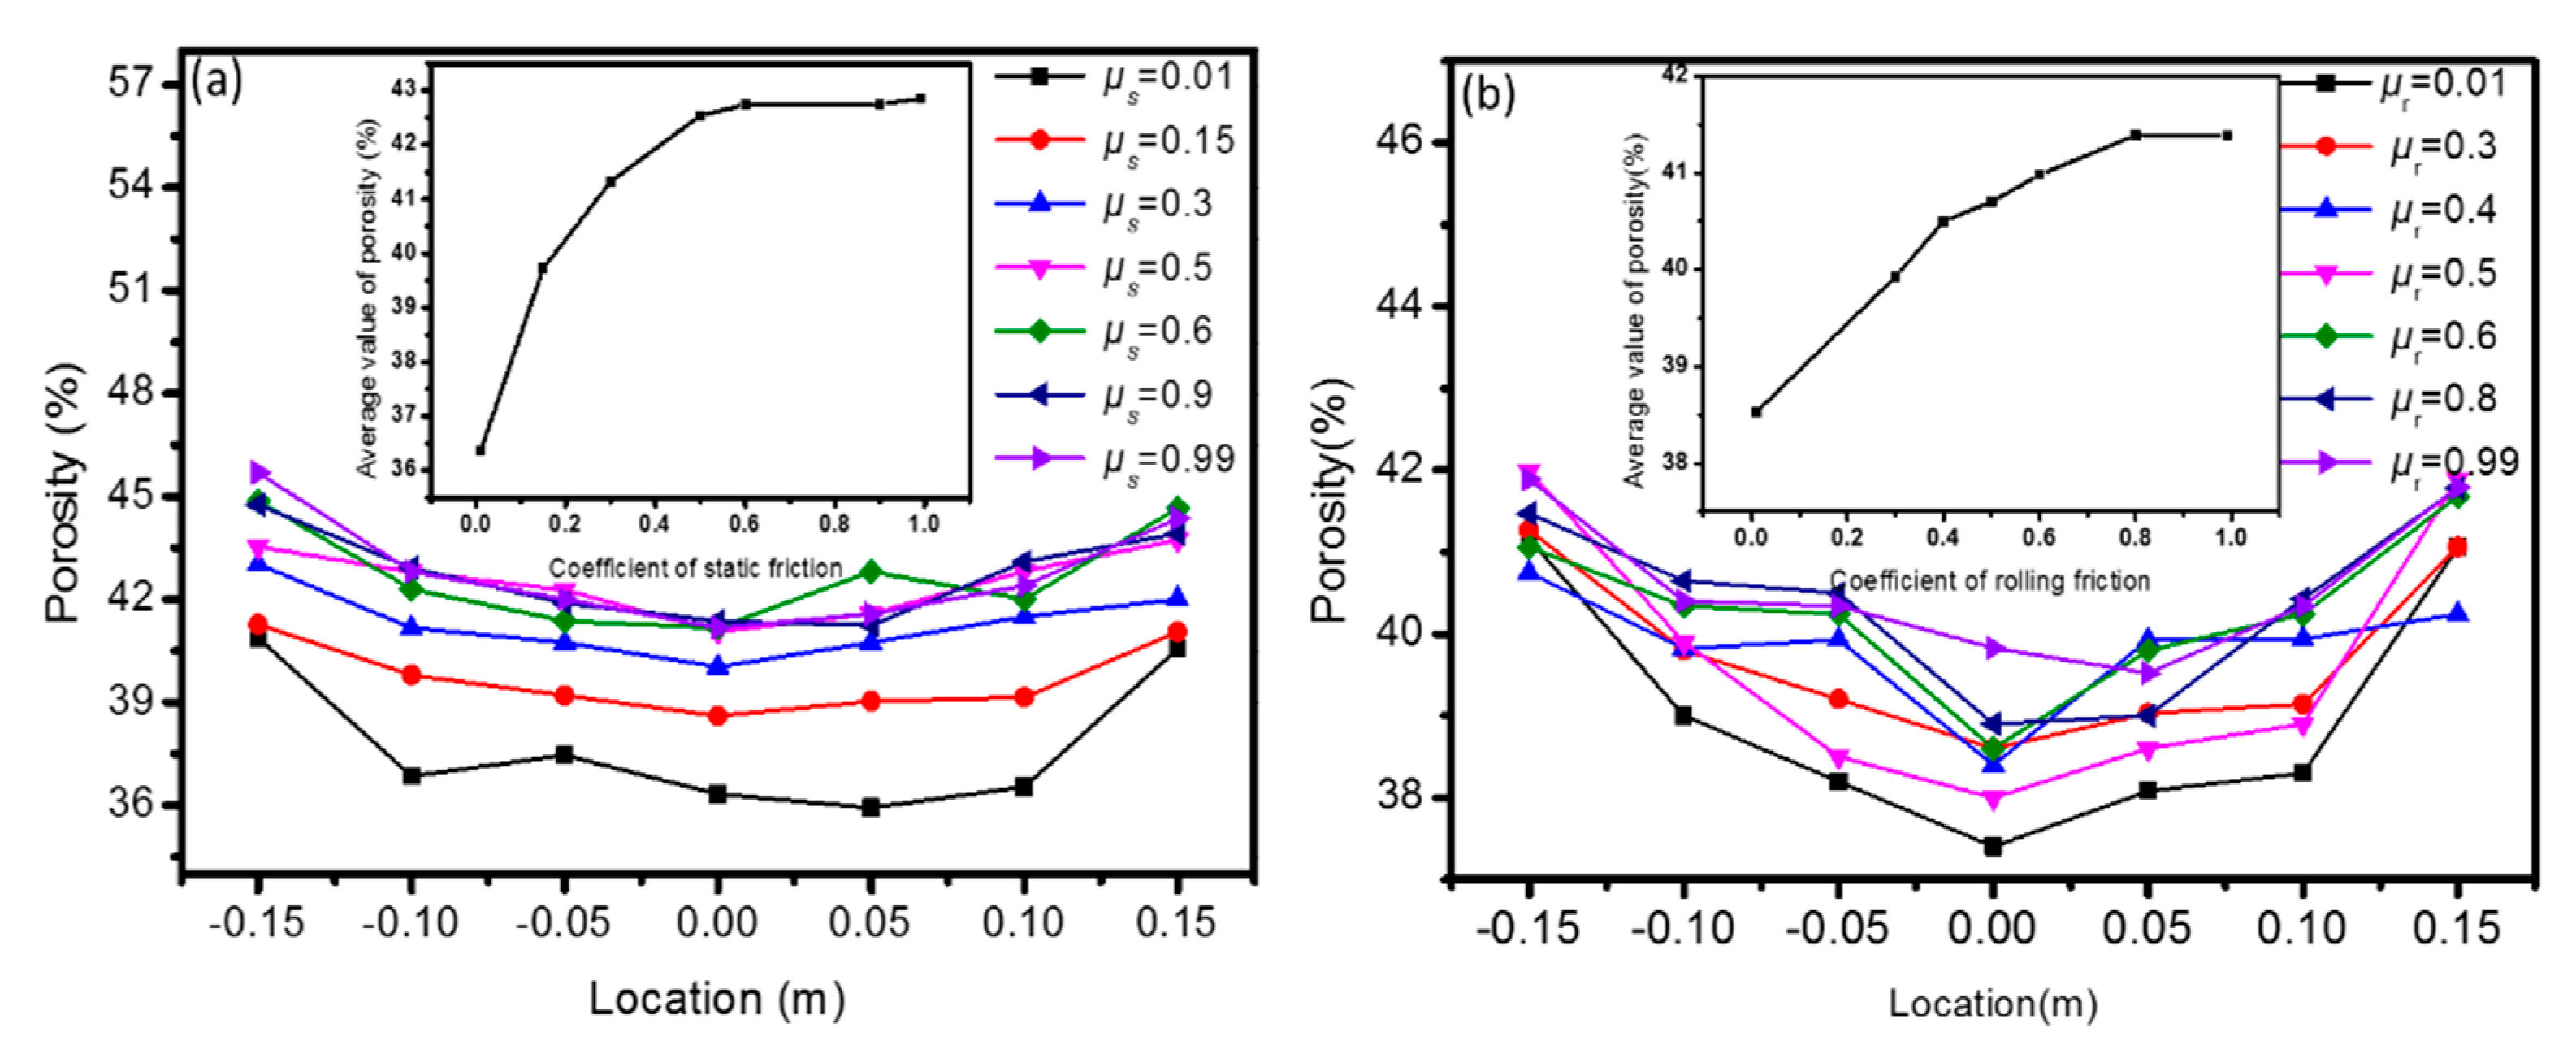
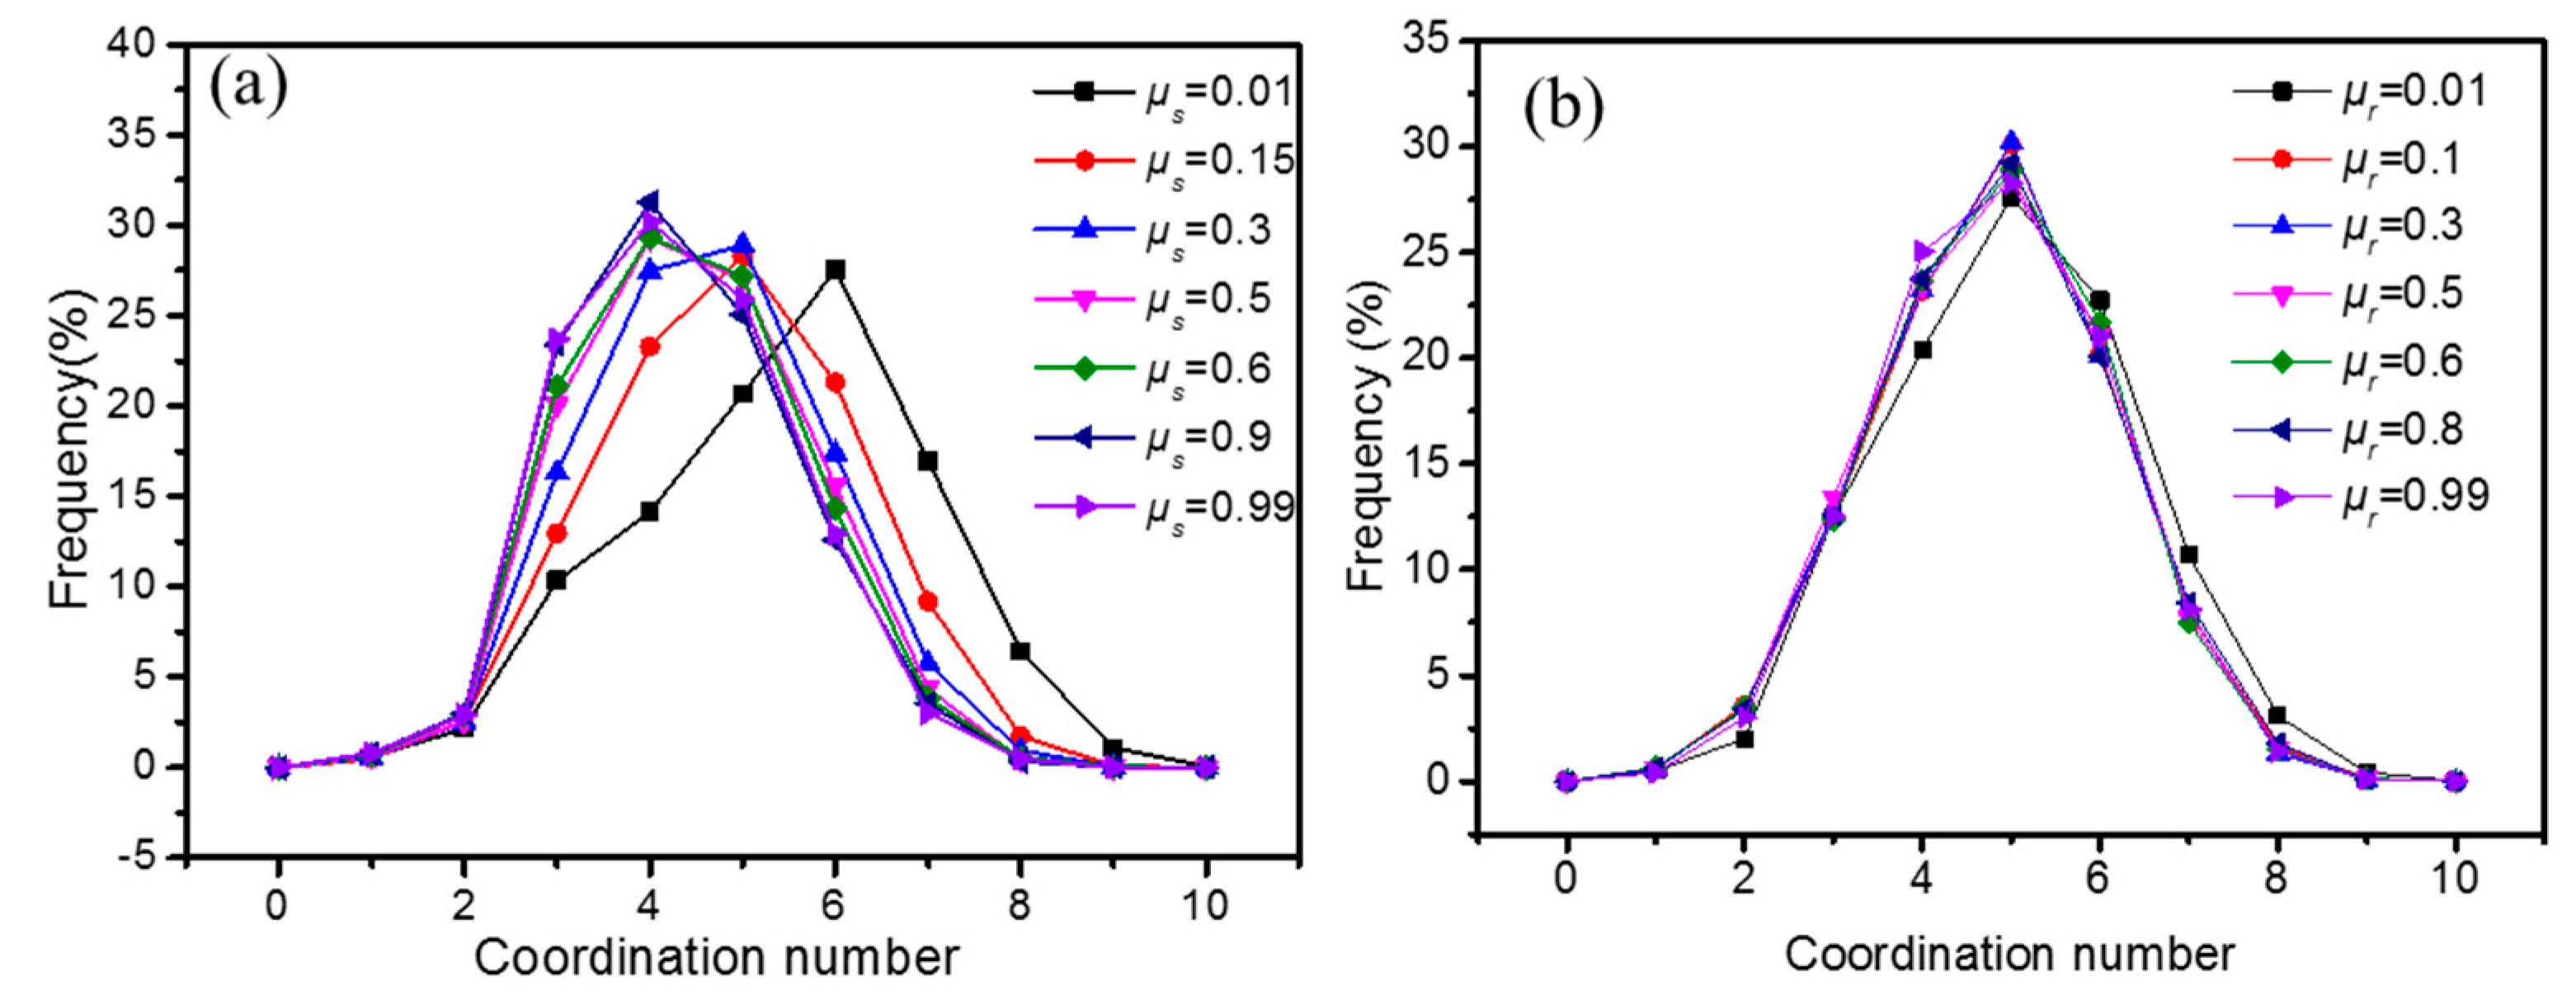
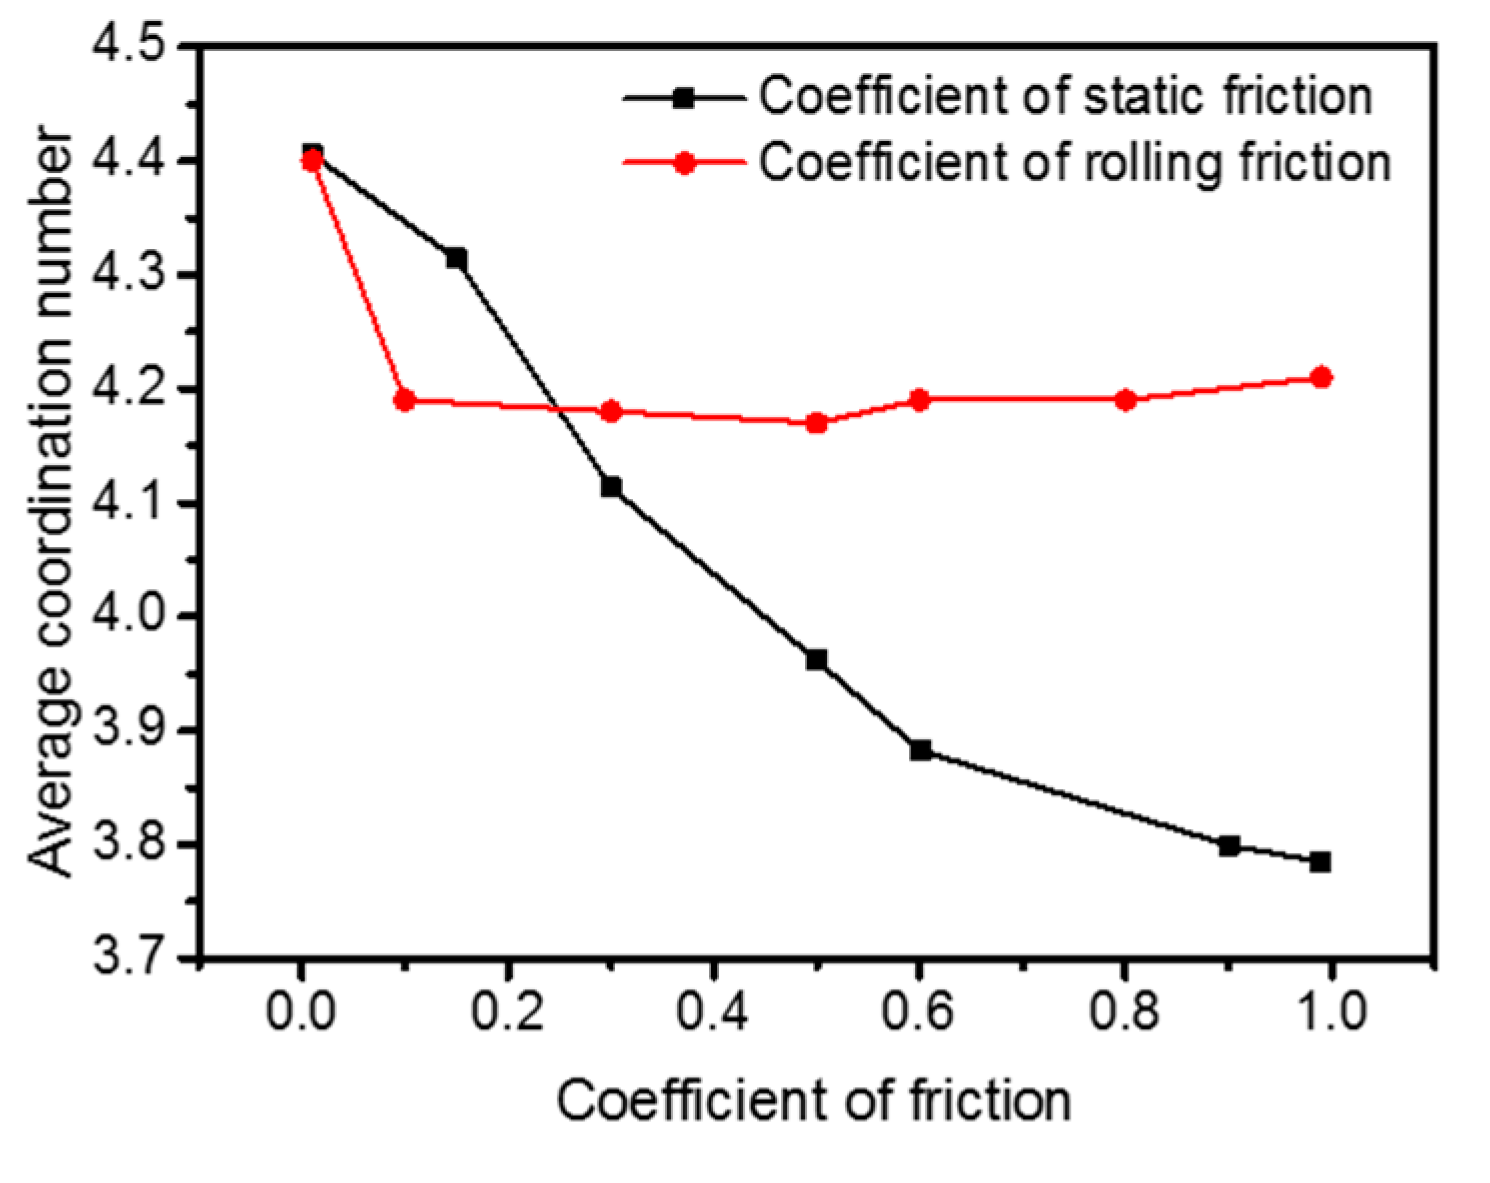
4.2.2. Effects of Rolling and Static Friction on BPD

Figure 11 shows the BPD of the heap when the rolling and static friction coefficients change, where the inserted graphs show the average value of BPD. When the static and rolling friction coefficient change from 0.01 to 0.99, the average porosities change by 7 and 3 percent points, respectively, which means that the static friction coefficient has a greater impact on porosity. This conclusion is also supported by findings reported in the literature [3,6,30,31,32,33].
Figure 12 depicts the frequency distribution of CN for different static and rolling friction coefficients, showing a maximum value of the frequency at CN ≈ 4. Thus, most particles are in contact with four neighboring particles. The static friction coefficient affects the frequency distribution, but mainly for μ s < 0.6 , and the rolling friction seems to have no effect. As seen in Figure 13, when the static friction coefficient increases, the CN of the heap decreases, but the decrease is small for μ s > 0.6 . The reason may be that if the CN is small, the porosity is large. The average CN of the heap is only affected by the rolling friction when the coefficient is very small.

5. Conclusions

The angle of repose, coordination number (CN) and bottom porosity distribution (BPD) of pellet piles were studied by DEM simulation and experimental methods. A charging system mimicking that of a blast furnace, but in 1:10 scale was designed to simulate the pile formation of iron oxide pellets. The effects of DEM parameters and packing method on the angle of repose were also studied, including the drop height in the Discharging Method and properties (lifting velocity, barrel size) of the Lifting Method. Some of the results are highlighted in the following.
The angle of repose shows a positive correlation with static and rolling friction coefficients. The angle of repose formed by the Lifting Method is bigger than that obtained by the Discharging Method. When the drop height increases, the angle of repose decreases, but this trend will weaken when the static friction coefficient becomes large. In the Lifting Method, the angle of repose tends to decrease with an increase in the lifting velocity or in the barrel size, but the trend is less clear for pellets with large friction coefficients. The size of the bottom circle of the heap is significantly reduced with an increase in the friction coefficient. Appropriate values of the rolling and static friction coefficients for the pellets were found to be 0.12 and 0.15, respectively.
The porosity distribution in the bottom of the heap (BDP) along the heap diagonal shows a V-type behavior, where the value in the center is smaller than those at the edges. The BPD shows an increasing trend with the increase of the friction coefficient. CN is an important parameter reflecting the internal structure of the pile, and expectedly, it shows a negative correlation with porosity. The maximum of the frequency distribution of CN, which occurs at CN ≈ 4, exhibits a negative correlation with the static friction coefficient and eventually remains unchanged when the coefficient grows larger than 0.6. CN is not significantly affected by the rolling friction coefficient.

Author Contributions

Conceptualization, H.W. and Y.Y.; methodology, H.W. and M.L.; Software, H.W. and M.L.; validation, H.W. and Y.L.; formal analysis, Y.G.; investigation, H.W. and Y.Y.; resources, H.W. and M.L.; data curation, H.W. and Y.G.; writing, H.W; supervision, Y.Y. and H.S.; funding acquisition, Y.Y.; Writing-Review and Editing, H.S. and H.W.

Funding

This research was funded by The Program for Professor of Special Appointment (Eastern Scholar) at Shanghai Institutions of Higher Learning grant number TP2015039.

Acknowledgments

The authors are grateful for the financial support from The Program for Professor of Special Appointment (Eastern Scholar) at Shanghai Institutions of Higher Learning (No. TP2015039). The Discrete Element Method was conducted using LIGGGHTS 3.5.0 open source.

Conflicts of Interest

The authors declare no conflict of interest.

References

  1. Kou, B.; Cao, Y.; Li, J.; Xia, C.; Li, Z.; Dong, H.; Zhang, A.; Zhang, J.; Kob, W.; Wang, Y. Granular materials flow like complex fluids. Nature 2017, 551, 360–363. [Google Scholar] [CrossRef] [PubMed] [Green Version]
  2. Zhou, Z.Y.; Zou, R.P.; Pinson, D.; Yu, A.B.; Zhou, Z. Angle of repose and stress distribution of sandpiles formed with ellipsoidal particles. Granul. Matter 2014, 16, 695–709. [Google Scholar] [CrossRef]
  3. Van Burkalow, A. Angle of Repose and Angle of Sliding Friction: AN Experimental Study. Geol. Soc. Am. Bull. 1945, 56, 669. [Google Scholar] [CrossRef]
  4. Elperin, T.; Golshtein, E. Comparison of different models for tangential forces using the particle dynamics method. Phys. A Stat. Mech. Appl. 1997, 242, 332–340. [Google Scholar] [CrossRef]
  5. Coetzee, C. Calibration of the discrete element method and the effect of particle shape. Powder Technol. 2016, 297, 50–70. [Google Scholar] [CrossRef]
  6. Alizadeh, M.; Hassanpour, A.; Pasha, M.; Ghadiri, M.; Bayly, A. The effect of particle shape on predicted segregation in binary powder mixtures. Powder Technol. 2017, 319, 313–322. [Google Scholar] [CrossRef]
  7. Dury, A.; Ristow, G.H.; Moss, J.L.; Nakagawa, M. Boundary Effects on the Angle of Repose in Rotating Cylinders. Phys. Rev. E Stat. Phys. Plasmas Fluids Relat. Interdiscip. Top. 1997, 57, 4491–4497. [Google Scholar] [CrossRef]
  8. Carstensen, J.; Chan, P.-C. Relation between particle size and repose angles of powders. Powder Technol. 1976, 15, 129–131. [Google Scholar] [CrossRef]
  9. Nan, W.; Wang, Y.; Ge, Y.; Wang, J. Effect of shape parameters of fiber on the packing structure. Powder Technol. 2014, 261, 210–218. [Google Scholar] [CrossRef]
  10. Zou, R.; Yu, A. Evaluation of the packing characteristics of mono-sized non-spherical particles. Powder Technol. 1996, 88, 71–79. [Google Scholar] [CrossRef]
  11. Gan, J.; Yu, A.; Zhou, Z. DEM simulation on the packing of fine ellipsoids. Chem. Eng. Sci. 2016, 156, 64–76. [Google Scholar] [CrossRef]
  12. Bernal, J.D.; Mason, J. Packing of Spheres: Co-ordination of Randomly Packed Spheres. Nature 1960, 188, 910–911. [Google Scholar] [CrossRef]
  13. Scott, G.D.; Kilgour, D.M. The density of random close packing of spheres. J. Phys. D Appl. Phys. 1969, 2, 863–866. [Google Scholar] [CrossRef]
  14. Mueller, G.E. Numerically packing spheres in cylinders. Powder Technol. 2005, 159, 105–110. [Google Scholar] [CrossRef]
  15. Zhao, J.; Li, S.; Jin, W.; Zhou, X. Shape effects on the random-packing density of tetrahedral particles. Phys. Rev. E 2012, 86, 03131–031306. [Google Scholar] [CrossRef] [PubMed]
  16. Tangri, H.; Guo, Y.; Curtis, J.S. Packing of cylindrical particles: DEM simulations and experimental measurements. Powder Technol. 2017, 317, 72–82. [Google Scholar] [CrossRef]
  17. Lu, P.; Li, S.; Zhao, J.; Meng, L. A computational investigation on random packings of sphere-spherocylinder mixtures. Sci. China Ser. G Phys. Mech. Astron. 2010, 53, 2284–2292. [Google Scholar] [CrossRef]
  18. Wouterse, A.; Williams, S.R.; Philipse, A.P. Effect of particle shape on the density and microstructure of random packings. J. Phys. Condens. Matter 2007, 19, 406215. [Google Scholar] [CrossRef]
  19. Kyrylyuk, A.V.; Philipse, A.P. Effect of particle shape on the random packing density of amorphous solids. Phys. Status Solidi A 2011, 208, 2299–2302. [Google Scholar] [CrossRef]
  20. Abreu, C.R.; Tavares, F.W.; Castier, M. Influence of particle shape on the packing and on the segregation of spherocylinders via Monte Carlo simulations. Powder Technol. 2003, 134, 167–180. [Google Scholar] [CrossRef]
  21. Natsui, S.; Ueda, S.; Nogami, H.; Kano, J.; Inoue, R.; Ariyama, T. Analysis on Non-Uniform Gas Flow in Blast Furnace Based on DEM-CFD Combined Model. Steel Res. Int. 2011, 82, 964–971. [Google Scholar] [CrossRef]
  22. Wei, H.; Zan, L.; Zhang, H.; Saxen, H.; Yu, Y. Two Methods of DEM Application on Charging System of Ironmaking Blast Furnace. In Proceedings of the 2018 37th Chinese Control Conference (CCC), Wuhan, China, 25–27 July 2018; pp. 3412–3415. [Google Scholar]
  23. Yang, W.; Zhou, Z.; Pinson, D.; Yu, A. A New Approach for Studying Softening and Melting Behavior of Particles in a Blast Furnace Cohesive Zone. Metall. Mater. Trans. B 2015, 46, 977–992. [Google Scholar] [CrossRef]
  24. Geleta, D.D.; Lee, J. Effects of Particle Diameter and Coke Layer Thickness on Solid Flow and Stress Distribution in BF by 3D Discrete Element Method. Met. Mater. Trans. A 2018, 49, 3594–3602. [Google Scholar] [CrossRef]
  25. Wei, H.; Tang, X.; Ge, Y.; Li, M.; Saxén, H.; Yu, Y. Numerical and experimental studies of the effect of iron ore particle shape on repose angle and porosity of a heap. Powder Technol. 2019, 353, 526–534. [Google Scholar] [CrossRef]
  26. Cundall, P.A.; Strack, O.D.L. Discussion: A discrete numerical model for granular assemblies. Geotechnique 2008, 29, 331–336. [Google Scholar] [CrossRef]
  27. Tsuji, Y.; Tanaka, T.; Ishida, T. Lagrangian numerical simulation of plug flow of cohesionless particles in a horizontal pipe. Powder Technol. 1992, 71, 239–250. [Google Scholar] [CrossRef]
  28. Goniva, C.; Kloss, C.; Hager, A.; Pirker, S. An Open Source CFD-DEM Perspective; JKU: Linz, Austria, 2010. [Google Scholar]
  29. Yu, Y.; Saxén, H. Experimental and DEM study of segregation of ternary size particles in a blast furnace top bunker model. Chem. Eng. Sci. 2010, 65, 5237–5250. [Google Scholar] [CrossRef]
  30. Li, C.; Honeyands, T.; O’Dea, D.; Moreno-Atanasio, R. The angle of repose and size segregation of iron ore granules: DEM analysis and experimental investigation. Powder Technol. 2017, 320, 257–272. [Google Scholar] [CrossRef]
  31. Zhou, Y.C.; Xu, B.H.; Yu, A.B.; Zulli, P. Numerical investigation of the angle of repose of monosized spheres. Phys. Rev. E 2001, 64, 021301. [Google Scholar] [CrossRef] [PubMed] [Green Version]
  32. Zhou, Y.; Xu, B.; Yu, A.; Zulli, P. An experimental and numerical study of the angle of repose of coarse spheres. Powder Technol. 2002, 125, 45–54. [Google Scholar] [CrossRef]
  33. Zhou, Y.; Wright, B.; Yang, R.; Xu, B.; Yu, A. Rolling friction in the dynamic simulation of sandpile formation. Phys. A Stat. Mech. Appl. 1999, 269, 536–553. [Google Scholar] [CrossRef]
Figure 1. (a) Experimental apparatus and schematic of the measurement of pellet pile and (b) the geometric models of different packing method in simulation.
Processes 07 00561 g001
Figure 2. Depiction of forces acting particle i in contact with particle j.
Processes 07 00561 g002
Figure 3. Vertical cross-sections of the pellet pile simulated under different (a) rolling and (b) static friction (b) coefficients.
Processes 07 00561 g003
Figure 4. Extracted contours of the pellet pile for different (a) rolling and (b) static friction coefficients.
Processes 07 00561 g004
Figure 5. Relationship of the angle of repose of pellet piles and (a) rolling friction coefficient with μ s = 0.15 , and (b) static friction coefficient with μ r = 0.12 . Error bars indicate the deviation of the angle of repose in different directions of the pile.
Processes 07 00561 g005
Figure 6. (a) Angle of repose and (b) and normalized effective diameter of the heap (top view) with different coefficient of static and rolling friction for different drop heights in the Discharging Method. (The numbers in the two figures represent rolling and static friction coefficients, respectively) The inserted subfigure in (b) is a top view of the simulated pile.
Processes 07 00561 g006
Figure 7. The angle of repose for different lifting velocities. Pink dotted and solid lines represent the angle of repose with different packing methods, but the same DEM parameters.
Processes 07 00561 g007
Figure 8. Profile of heap in simulation and experiment.
Processes 07 00561 g008
Figure 9. Comparisons of simulated (with and without containers) and experimental bottom porosity distribution (BPD) of the pellet pile.
Processes 07 00561 g009
Figure 10. Coordination number of a vertical cross-section of the simulated pellet pile.
Processes 07 00561 g010
Figure 11. BPD of the pellet pile and the inserted graph is the average porosity (the average value of seven points on a curve) with different (a) static and (b) rolling friction coefficients.
Processes 07 00561 g011
Figure 12. Frequency distribution of coordination number with different (a) static and (b) rolling friction coefficients.
Processes 07 00561 g012
Figure 13. The average coordination number of the whole heap for different static ( μ r = 0.12 ) and rolling friction ( μ s = 0.15 ) coefficients.
Processes 07 00561 g013
Table 1. Detailed description of the parameter expressions in discrete element method (DEM).
ParametersEquations
Kn, Kt K n = 4 3 γ * R * δ n , K t = 8 G * R * δ n
γn, γt γ n = 2 5 6 β s n m * 0 ,   γ t = 2 5 6 β s t m * 0
Sn, St S n = 2 γ * R * δ n ,   S t = 8 G * R * δ n
β β = ln ( e ) ln 2 ( e ) + π 2
1 γ * 1 γ * = ( 1 v 1 2 ) Y 1 + ( 1 v 2 2 ) Y 2
1 G * 1 G * = 2 ( 2 v 1 ) ( 1 + v 1 ) Y 1 + 2 ( 2 v 2 ) ( 1 + v 2 ) Y 2
1 R * ,   1 m * 1 R * = 1 R 1 + 1 R 2 ,   1 m * = 1 m 1 + 1 m 2
Δ M r k Δ M r k = k r Δ θ r ,   k r = k t · R * 2
| M r , t + Δ t k | M r m
M r , t + Δ t k = M r , t k + Δ M r k ,   M r m = μ r R * F n
M r , t + Δ t d M r , t + Δ t d = C r θ r ˙ ( | M r , t + Δ t k | < M r m )
M r , t + Δ t d = C r θ r ˙ ( | M r , t + Δ t k | = M r m )
C r = η r C r c r i t ,   C r c r i t = 2 I r k r
I r = ( 1 I i + m i r i 2 + 1 I j + m j r j 2 ) 1
In the expressions, G, Y, e and υ represent the Shear modulus, Young’s modulus, coefficient of restitution and Poisson’s ratio, respectively, while μ r and μ s represent the rolling and static friction coefficient, respectively.
Table 2. Physical and contact parameters used in DEM simulation, including pellet particle and walls.
ParametersValues
Particle number100,000
Particle density4837 kg/m3
Time step10−5 s
Young’s modulus2.5 × 1011 Pa (pellet), 2 × 10¹¹ Pa (steel plane), 7.2 × 10¹⁰ (plexiglass)
Poisson ratio (p-p; p-w; p-g)0.25, 0.3, 0.2
Coefficient of restitution (p-p; p-w; p-g)0.4, 0.35, 0.2
Coefficient of friction (p-w; p-g)0.4, 0.25
Rolling friction coefficient (p-w; p-g)0.4, 0.15
Size of pellet8 mm, 14 mm, 20 mm
In the table, p-p, p-w and p-g represent the coefficients for pellet-pellet, pellet-wall and pellet-plexiglass (breaker) interaction. Some parameter values were from the literature [17,18].
Table 3. Different cases studied by the Lifting Method.
CasesRolling Friction CoefficientStatic Friction CoefficientBarrel Size (Diameter: m)
Case10.050.150.1
Case20.15
Case30.120.15
Case40.120.45

