Article

Assessment of the Total Volume Membrane Charge Density through Mathematical Modeling for Separation of Succinic Acid Aqueous Solutions on Ceramic Nanofiltration Membrane

by
Agata Marecka-Migacz
1,
Piotr Tomasz Mitkowski
1,*,
Jerzy Antczak
2,
Jacek Różański
1 and
Krystyna Prochaska
2
1
Division of Chemical Engineering and Equipment, Institute of Chemical Technology and Engineering, Poznan University of Technology, 60-965 Poznań, Poland
2
Division of Chemical Technology, Institute of Chemical Technology and Engineering, Poznan University of Technology, 60-965 Poznań, Poland
*
Author to whom correspondence should be addressed.
Processes 2019, 7(9), 559; https://doi.org/10.3390/pr7090559
Submission received: 8 July 2019 / Revised: 13 August 2019 / Accepted: 17 August 2019 / Published: 23 August 2019
(This article belongs to the Special Issue Chemical Process Design, Simulation and Optimization)

Abstract

:
Nanofiltration of aqueous solutions of succinic acid with the addition of sodium hydroxide or magnesium hydroxycarbonate has been investigated experimentally and modeled with the comprehensively described Donnan–Steric partitioning model. The experimental retentions of acid at the same pH varied between 16% and 78%, while the estimated total volume membrane charge densities were in the range of −35.73 and +875.69 mol/m3. This work presents a novel insight into the modeling of nanofiltration and investigates the relations between the estimated total volume membrane charge densities, ionic strength, and component concentration on the performance of ceramic membrane. In addition, this study takes into consideration other parameters such as pH regulation and viscosities of solutions.

Graphical Abstract

1. Introduction

Diminishing resources of fossil fuels, vulnerability of their prices, global warming, and environmental pollution result in a large interest in renewable and unconventional energy sources. Hence, one of these resources is biodiesel, which is currently under rigorous investigation [1]. Biodiesel is composed from renewable biological sources, such as vegetable oils and animal fats. It is biodegradable and nontoxic, and is characterized by low emission profiles and therefore is environmentally benign [2,3], unfortunately significant amounts of waste are generated during its production, which mainly consists of the glycerol phase. According to data presented by BP [4], the global biofuel production increased on the average by 5.13% (+4.1 Mtoe) in 2017 compared to 2014. In 2017, in the Europe region, biodiesel production reached approximately 14.167 million tons of oil equivalent (toe) whereas in North America nearly 38.190 Mtoe. Additionally, global primary energy consumption was projected to grow by 1.5 % per year between 2012 and 2035, whereas the energy from renewable resources, including biofuels, was expected to grow by 6.4% per year [5]. The biodiesel industry produces approximately 600 million tons of crude glycerol [6]. Therefore, due to the increase of glycerol waste, the technologies which allow for its beneficial reuse are of great interest. Many researchers focused on the biotechnological processing of glycerol by microbial bioconversion, delivering additional benefit to the environment in view of lower pollution. Through appropriate relation of microorganism clones, they postulate that it is possible to obtain low molecular weight organic compounds which are economically desirable, such as succinic acid [6,7,8]. In recent years, the interest in succinic acid production is growing because of the possibility to use it in the production of polymers and biodegradable plastics, surfactants, detergents, electrolytic coatings, and pharmaceutical active agents [9,10]. Generally, the technology of succinic acid biosynthesis ends at the stage of obtaining a post-culture liquid called post-fermentation broth, in which succinic acid produced by bacteria is dissolved [11,12,13,14]. Unfortunately, due to complex fermentation process, the main product is contaminated with various metabolites, especially with organic acids: acetic, formic, and others at low concentrations. The post-fermentation broth also contains wastes from the fermentation medium: residual glycerol, mineral salts, and minor amounts of polyols and proteins. Therefore, the success of bioconversion is determined by the process of purification [15,16,17,18,19]. Different traditional methods are used to separate organic compounds from the post-fermentation broth e.g., precipitation, distillation, liquid–liquid extraction, ion-exchange, adsorption, crystallization or esterification, however there are alternatives to the traditional purification methods, such as the membrane techniques, for example nanofiltration (NF) [15,20,21], which is one of the newer membrane pressure methods for separation of liquid mixtures. The NF membrane can be either organic in nature (i.e., polymeric) or inorganic. Inorganic membranes, especially the ceramic ones, are more suitable for use with organic solvents due to their excellent chemical, mechanical, and thermal stability [22]. It is worth to notice that there is a commercially available ceramic membrane with a hydrophobized surface for organic solvent nanofiltration (OSN). In general, transport characteristics are much less investigated compared to polymeric membranes. Additionally, due to the multifaceted nature of interactions between membrane, solvent, and solute, the prediction of transport mechanism in OSN is much more complicated compared to aqueous applications [23]. Nevertheless, mathematical description of NF separations, whether it is organic or an aqueous solution containing organic compounds, is of great interest for many researchers [24,25,26,27,28,29,30,31,32,33,34] and it is far from truly being predictive.
In general, NF combines the removal of uncharged components at nanoscale with charge effects between the solution and the surface of the membrane [24]. Acids possess very low molecular weight (MW) (e.g., the MW of succinic acid is equal to 118.09 g/mol) in comparison to cut-off of ceramic membranes, therefore the so-called sieving effect cannot play the main role. In such case, the retention of acid is very low and process efficiency is unsatisfactory. In order to enhance the separation of acid, the pH value is adjusted to obtain a dissociated form of acids above the pKa (for succinic acid pKa1 = 4.22 [35]). When the dissociated form of the acid is separated in NF, the main separation mechanism changes to the electrostatic repulsion. Nevertheless, for a charged compound, both steric hindrance and electrostatic interactions are responsible for efficient separation—i.e., retention rate. Another important parameter in the transport and interpretation of retention is the membrane charge present along the surface of a membrane and also through the pores [32]. A strong charge present at the membrane surface has a crucial effect on the ion retention by the membrane [36] and therefore, the knowledge regarding the electrochemical interactions which occur at the membrane surface should offer the possibility to influence and describe the permeate flux, fouling tendency, retention of components, and cleaning conditions of the NF membranes more comprehensively. Understanding the ion-transport mechanism through a ceramic NF membrane is challenging and essential for further optimization of the NF processes.
The only available method adequate for characterizing the inherent membrane charge is the zeta potential of membrane. In the standard streaming potential measurements, the zeta potential is determined in order to link it to the streaming potential by the classical Helmholtz–Smoluchowski equation [37]. Streaming potential measurement gives the opportunity to obtain reliable information regarding the surface properties of ceramic membranes. Unfortunately, such measurement method requires sample in the flat, powder or eventually in fiber forms which requires destruction of a tubular membrane. Therefore, authors of this study postulate using the mathematical model to determine the total volume membrane charge density through parameter estimation based on the retention experiments.
Modeling of a nanofiltration membrane performance comprises two aspects: flux and rejection predictions [27]. Generally, the NF transport description models should consider the interaction between the charged membrane and ionic solutes [38]. Many charged membrane transport theories have been proposed which account for electrostatic effects as well as diffusive and convective flow to describe the solute separation [39], such as the steric-hindrance pore model (SHP), electric-steric-hindrance pore model (ESHP) [40], Teorell–Mayer–Sievers model [41], frictional model or space-charge model [42]. However, the most popular and widely adopted mathematical model for NF process is based on the extended Nernst–Planck (eN-P) equation [39]. Bowen and co-authors [25,43,44,45] proposed the Donnan-steric-partitioning model (DSPM) which arose from the eN-P equation. The DSPM has been also used by many authors [32,46,47,48,49] with fairy good results. However, prediction of separation or membrane charge is very limited, and modeling is used to describe and correlate rejection results.
In order to predict the separation performance, it is important to evaluate the membrane charge density in well-defined solutions. Therefore, the authors aim to consider each ion and water in the modeling, and therefore to obtain values of the total volume membrane charge densities through mathematical modeling. As a case study, the nanofiltration of aqueous solutions of succinate sodium and magnesium salts in pH equal to 9 and in two different concentrations (3.6 and 36.0 g/L) were studied experimentally and modeled with a comprehensively described DSPM model. Aside from sodium hydroxide, magnesium hydroxycarbonate (4MgCO3 × Mg(OH)2 × 5H2O) was also selected for pH adjustment of the feeds. It was because the magnesium hydroxycarbonate was used in the fermentation process reported in [50] to keep pH at approximately 8–9 in the bioreactor and at around 8.5 in the post-fermentation broth.

2. Experimental Methods

2.1. Experimental and Operating Conditions

The pilot plant presented in Figure 1 was used in the study of the separation of succinic acid by the NF technique. The exploited system was equipped with two membrane modules, whereas all research was carried out on the only one of them. The used membrane module was equipped with a tubular ceramic mono-channel membrane (TiO2 active layer, TAMI Industries, Nyons, France) with a cut-off of 450 Da, support mean porosity 38.5 mm2, membrane mean porosity 3 µm, open porosity 30–40%, external diameter 10 mm, channel diameter and filtration area per 0.6 m tube equal to 0.0125 m2 [51]. The transmembrane pressure (TMP) was set to 1.5 MPa. The process temperature for all experiments was fixed to 300 ± 2.0 K. The system was operated in a continuous mode, which means that the permeate and retentate were recirculated to the feeding tank continuously. The total volume of each investigated solution was equal to 12 L.
After each experiment, the ceramic membrane was cleaned to recover its initial permeance according to the procedure described in details elsewhere [51]. All cleaning steps were carried out at a flow system, the deionized water was filtered for 60 min, and the resulting flux was compared to the initial water flux. The decline in water flux after cleaning was not observed.

2.2. Materials

Three one-main-component model solutions were tested in the reported study. All of them were prepared by dissolving succinic acid, either 3.6 or 36.0 g/L, in deionised water with an electrolytic conductivity not exceeding 3 μS/cm. The pH of each of the solutions was adjusted by addition of sodium hydroxide in model solutions 1 (MS1) and 2 (MS2), and addition of magnesium hydroxycarbonate in model solution 3 (MS3), with precise control of added amounts of each substance. The pH of all model solutions was equal to 9 ± 0.7. The compositions and concentrations of all model solutions were presented in Table 1. Analytical grade succinic acid was purchased from Sigma-Aldrich (pure p.a.) while sodium hydroxide and magnesium hydroxycarbonate from Avantor Performance Materials Poland S.A. (pure p.a).

2.3. Analysis

The concentration of sodium ions was measured based on microwave induced plasma with optical emission spectrometry (MIP-OES) using a PLASMAQUANT 100 (Carl Zeiss, Jena, Germany), which included a microwave energy generator and resonator delivered by Plazmatronika, Wroclaw. The resonant cavity was combined with a microwave energy generator operating with frequency equal to 2.45 GHz. The generator has two cooling systems: aqueous (magnetron cooling) and pneumatic (external cavity wall cooling). More details regarding the MIP-OES used in that analysis was published elsewhere [52]. The analysis was performed using solutions with a concentration equal to 0.5000 g/L NaOH (microgranules, analytically pure, POCH, Gliwice, Poland), 0.500 g/L 4MgCO3 × Mg(OH)2 × 5H2O, 3.6, and 36.0 g/L C4H6O4 (purum p.a., >99.0%, Fluka Analytical, Sigma-Aldrich), which were appropriately diluted in order to prepare the analytical curve in the range of 0.5–30.0 mg/L. Standard solutions and samples were introduced to the excitation source (argon-helium plasma) with a rate of 1.5 × 10⁻³ L/min delivered by peristaltic pump (SPETEC, Erding, Germany) and concentric atomizer (Meinhard Glass Products, Golden, CO, USA) equipped with cyclone cloud chamber (EPOND, Vevey, Switzerland).
The contents of succinic acid and succinates in feed solutions, retentate and permeate obtained during the NF processes were determined by high-performance liquid chromatography method using HP Agilent 1100 Series system (Germany). The apparatus was equipped with an autosampler, interface (HP 35900), RI Detector (HP 1047A), pump (HP 1050), and column Rezex ROA-OrganicAcid H+ (8%), Phenomenex®. The carrier phase was a 2.5 mM H2SO4 solution with the flow of 0.5 × 10⁻³ L/min. The column temperature at the input to the detector was equal to 50 °C and pressure of 5.6 MPa. Before measurement, all samples were acidified to pH ≤ 2 by addition of 25% H2SO4 in an amount of 100 × 10−6 L to 1000 × 10−6 L of investigated solution. The pH of solutions was measured by laboratory pH-meter CP-505 (Elmetron, Poland) equipped with EPS-1 electrode.
The obtained concentrations of components were used to calculate retentions (R) according to Equation (1):
R = ( 1 C p , i C f , i ) 100 %
All rheological studies were conducted using a rotational stress rheometer Physica MCR 501 (Anton Paar) with a double gap concentric cylinder measuring geometry (DG26.7, cup diameter 27.59/23.83 mm, bob diameter 26.66/24.66 mm). The experiments were conducted in the scanning shear rate measurements with increasing shear rates in order to obtain flow curves of succinic acid solutions in the range from 10 to 500 s−1.

3. Modeling of Nanofiltration

3.1. Theory of the Utilized Model

In order to describe the ion transport through the NF ceramic membrane, the comprehensively described DSPM (ddDSPM) was proposed. The ddDSPM is based on the eN-P equation, extensively utilized by Bowen and co-authors [25,30,33,44]. Description of solute fluxes in the DSPM considers convection, diffusion, and electromigration mechanism. Convection occurs due to the applied pressure difference over the membrane, diffusion due to the concentration gradient across the membrane and finally charge effects related to electrostatic repulsion between the charged membrane and a charged organic compound [53]. The proposed ddDSPM explicitly takes all ions, solutes, and solvent into account. The whole ddDSPM model used in this work consists of Equations (2)-(19) set. Equation (2) describes the solvent velocity (V), which depends on membrane properties such as pore size (rp), porosity (Ak) and thickness of active layer (Δx), properties of separated solutions—i.e., osmotic pressures (Δπ) and feed viscosity (η)—and process parameter such as transmembrane pressure (ΔP). Difference of osmotic pressures defined by Equation (3) is calculated according to Equations (6) and (7) which are based on feed (xf,i) and permeate (xp,i) molar fractions (Equations (4) and (5)). Equation (8) defines ratio of solute (rs,i) to pore radius, which is used along with Equation (9) to compute diffusive (Kd,i) and convective (Kc,i) hindrance factors for each component i present in the mixture. The main equations of the ddDSPM model describe the gradient of individual ion concentration (cm,i) expressed by Equation (12) and electric potential gradient (ψ) across the membrane active layer thickness presented by Equation (13). The equations described above are solved under the condition that the membrane poses effective membrane charge density Xd, which is present in Equation (14), and that the separated mixture is electroneutral (Equation (15)). The presented model is constructed under the assumption of the Donnan exclusion mechanism on the feed-membrane interface which is expressed in the form of Equation (16). The components retentions are expressed by Equation (17). In order to solve the model equations set discussed above, there is a need to define a set of boundary conditions representing component concentrations at the membrane feed (cm(0+),i) and permeate (cp,i) sides; the boundary conditions are presented by Equations (18) and (19). In summary, the ddDSPM consists of 17 + 14NC variables (listed in Table 2) in 7 + 11NC equations which were provided with appropriate descriptions in Table 3.
V = r p 2 ( Δ P Δ π ) A k 8 η s Δ x
Δ π = π f e e d π p e r m e a t e
x f , i = C f , i i = 1 N o C o m p C f , i + C f , H 2 O
x p , i = C p , i i = 1 N o C o m C p , i + ( V w ~ ) 1
π f e e d = R T V w ~ i = 1 N o C o m p x f , i
π p e r m e a t e = R T V w ~ i = 1 N o C o m p x p , i
λ i = r s , i r p
ϕ i = ( 1 λ i ) 2
K d , i = 1 2.3 λ i + 1.154 λ i 2 + 0.224 λ i 3
K c , i = ( 2 ϕ i ) ( 1 + 0.054 λ i 0.988 λ i 2 + 0.441 λ i 3 )
d c m , i d x = V K d , i D i ( K c , i c m , i C p , i ) F R T z i c m , i d ψ d x
ψ x = 0 ψ x = δ δ = d ψ d x | x = 0 = i = 1 N o C o m p ( z i V D i ( K c , i c m ( 0 + ) , i C p , i ) ) F R T i = 1 N o C o m p ( z i 2 c m , i )
i = 1 N o C o m p c m ( 0 + ) , i z i = X d
i = 1 N o C o m p C p , i z i = 0
c m ( 0 + ) , i = C f , i ϕ i exp ( z i F R T ψ D )
R i = 1 C p , i C f , i
and boundary conditions
x = 0 + c m , i = c m ( 0 + ) , i
x = Δ x c m , i = C p , i
Although, the eN-P equations (Equations (12) and (13)) have been commonly used for the calculation of ion rejection by RO and NF membranes, they have rarely been applied to organic solutes [31]. Moreover, the ddDSPM model presented above in this work was not only used for process simulation but also for the estimation of parameter Xd which is present in Equation (14), i.e., the total volume membrane charge density across the membrane active layer. Thus, the estimated Xd is evaluated under the assumption of the constant surface charge and constant surface potential at the interface of pore entrance. In detail, the constant surface charge means that the pore wall surface charge density is identical to the free surface charge density, e.g., measured on particles. Whereas constant surface potential means that the pore wall surface potential at the pore entrance is identical to the free surface potential, which is related by some researchers [54] to the Donnan potential at the feed–membrane interface and therefore it is equal to the zeta potential ζ. Additionally, since Xd is present in electroneutrality condition (Equation (14)), it actually combines all electrochemical interactions in close membrane neighborhood, i.e., those between solutes, solvents, and membrane material. Therefore, naming Xd as the total volume charge density across the membrane active layer is justified.

3.2. Determination of Total Volume Membrane Charge Density Values in Nanofiltration

The degree of freedom (DOF) of the presented model is equal to 10 + 3NC, where NC stands for number of solutes present in the mixture. In order to solve the derived ddDSPM, the DOF must be equal to zero, therefore values of all parameters and known variables need to be provided. As already mentioned, during the parameter estimation in the ddDSPM, each ion existing in the solution is considered, even those originating from the sodium hydroxide or magnesium hydroxycarbonate, which were used for regulation of the pH of separated solutions. Values of diffusion coefficient Di, ions charge zi and radius of ions ri,s used in all calculations were presented in Table 4. Due to lack of the data, the Stokes–Einstein Equation (20) was used to determine the ionic radius of the succinate anion.
r i , s = k B T D i 6 π η
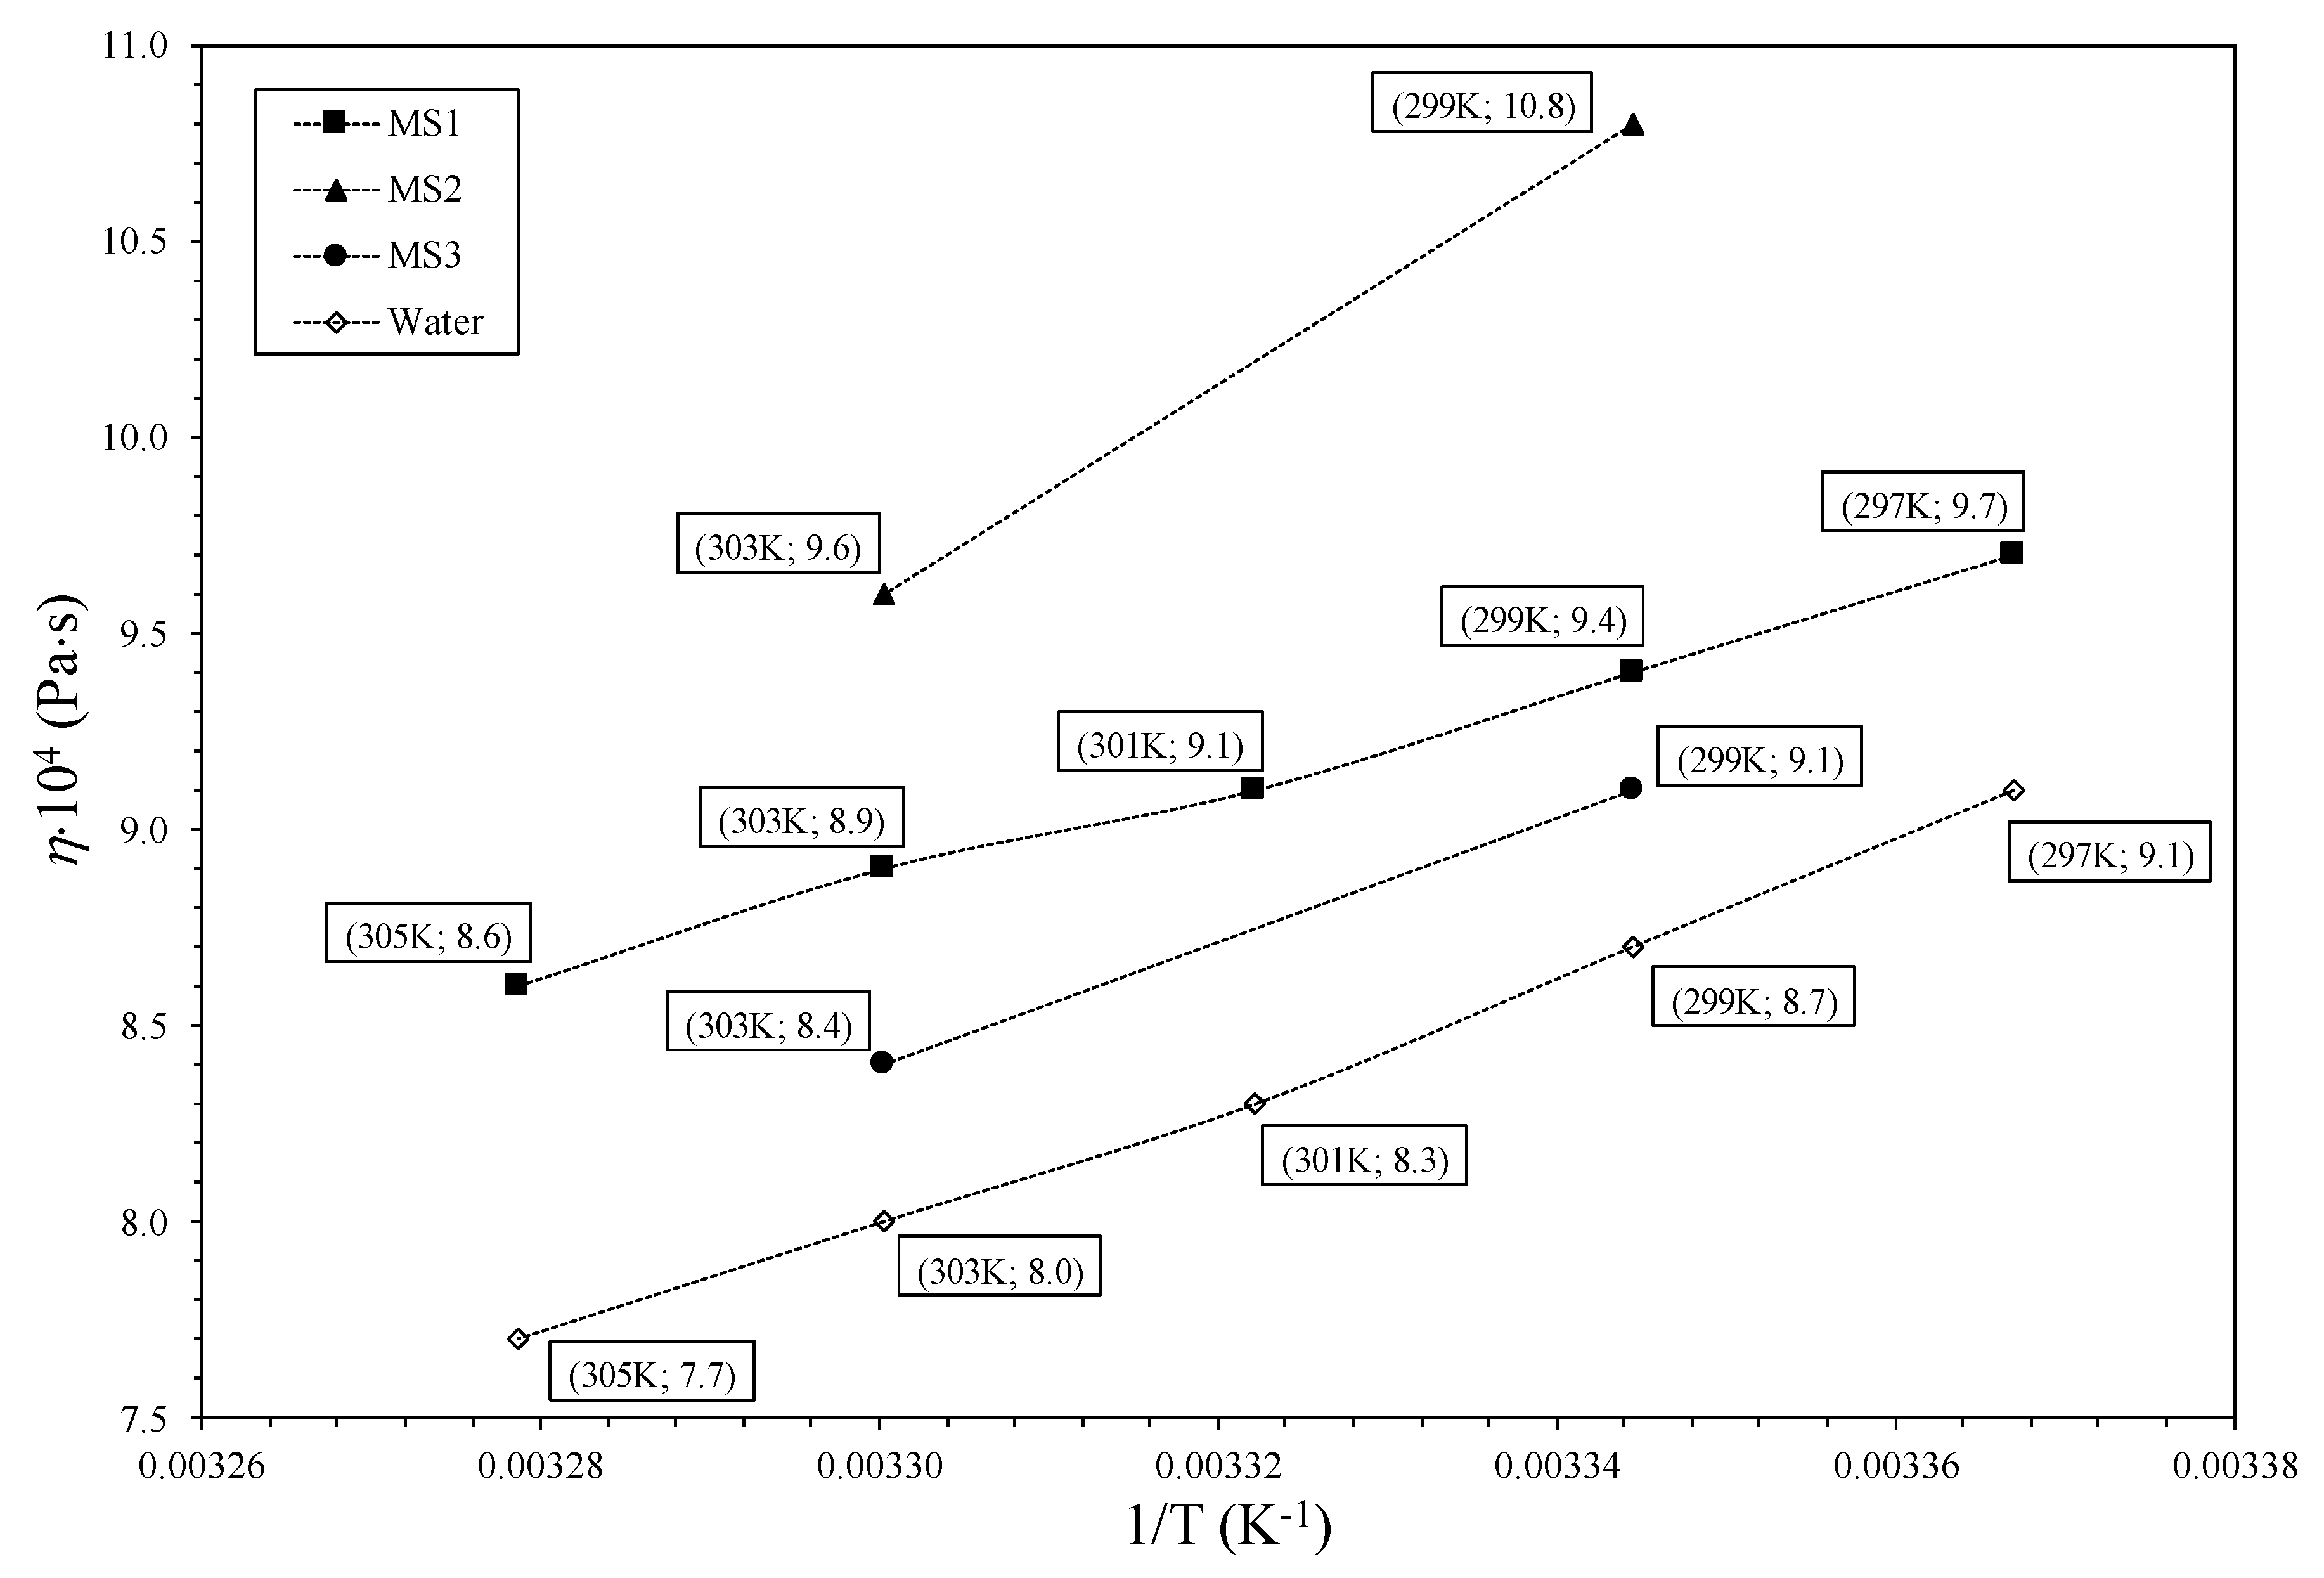
In Figure 2, the values of viscosities of investigated solutions were presented in comparison to pure water viscosities. It is important to notice that the difference between viscosities of model solutions and water varied between 4% and 24%.
The modeling in this study is considering each ion presented in the system, even ions originating from solutions used to set the desired values of pH. Such detailed approach is innovative in modeling of NF processes. Until now, researchers dealing with modeling with the DSPM model, did not consider ions originating from solutions used for regulating pH or at least had not shown it explicitly. The solutes dissociate in aqueous solutions, then they deliver specific ionic forms to the separated feed. Authors are convinced that the presence of additional ions (such as Na+, OH, Mg2+, or CO32−) may influence the total volume membrane charge density. It was also assumed in the ddDSPM, that the concentrations of the components in the feed are constant (i.e., steady state model), transmembrane pressure for the entire duration of the process is constant, pores are straight cylindrical in shape and of length equal to the effective membrane layer thickness. Due to the crossflow velocity and achieved Reynolds numbers within the membrane module in experiments equal to 2.3 m/s and 19,293, respectively, it was also assumed that concentration polarization effect and fouling phenomena are negligible. Additionally, as it is well known that the NF ceramic TiO2 membrane has a support layer (Al2O3), the influence of that layer was neglected in the view of ratio of ions radii to support layer pore radii and the assumption that support layer is uncharged (neutral).
The parameter estimations were conducted in the gPROMS software, which employs a rigorous optimization-based approach for model validation by offering parameter estimation capabilities, i.e., fitting model parameters to experimental data. Parameter estimation in gPROMS is based on the maximum likelihood formulation which provides simultaneous estimation of parameters in the physical model of the process [60]. Assuming independent, normally distributed measurement errors, with zero means and standard deviations, that maximum likelihood goal can be achieved through the objective function presented by Equation (21) [60]. In cases discussed in this study, the parameters estimation problems had the following values of parameters following Equation (21): NE = 3, NV = 1, NM = 1, N = 3.
Φ = N 2 ln ( 2 π ) + 1 2 min X d { i = 1 N E j = 1 N V i k = 1 N M j i [ ln ( σ i j k 2 ) + ( c i j k , m e s c i j k ) 2 σ i j k 2 ] }

4. Results and Discussion

Generally, it is well known that the following key parameters primarily affect the rejection of organic solutes during NF separations and are related to:
  • Solute parameters: molecular size, acid dissociation constant, hydrophobicity/hydrophilicity, and diffusion coefficient,
  • Membrane properties: cut-off, pore size, surface charge,
  • Feed composition: pH, ionic strength, hardness, and the presence of organic matter.
It has to be clearly stated that the negatively hydrophilic solutes can be rejected by electrostatic repulsion through negatively charged membrane surfaces. Electrostatic interactions between charged solutes and a porous membrane have been frequently reported to be an important rejection mechanism. Ions such as Na+, K+, Ca2+, and Mg2+ in feed water reduced the negative zeta potential of a membrane.
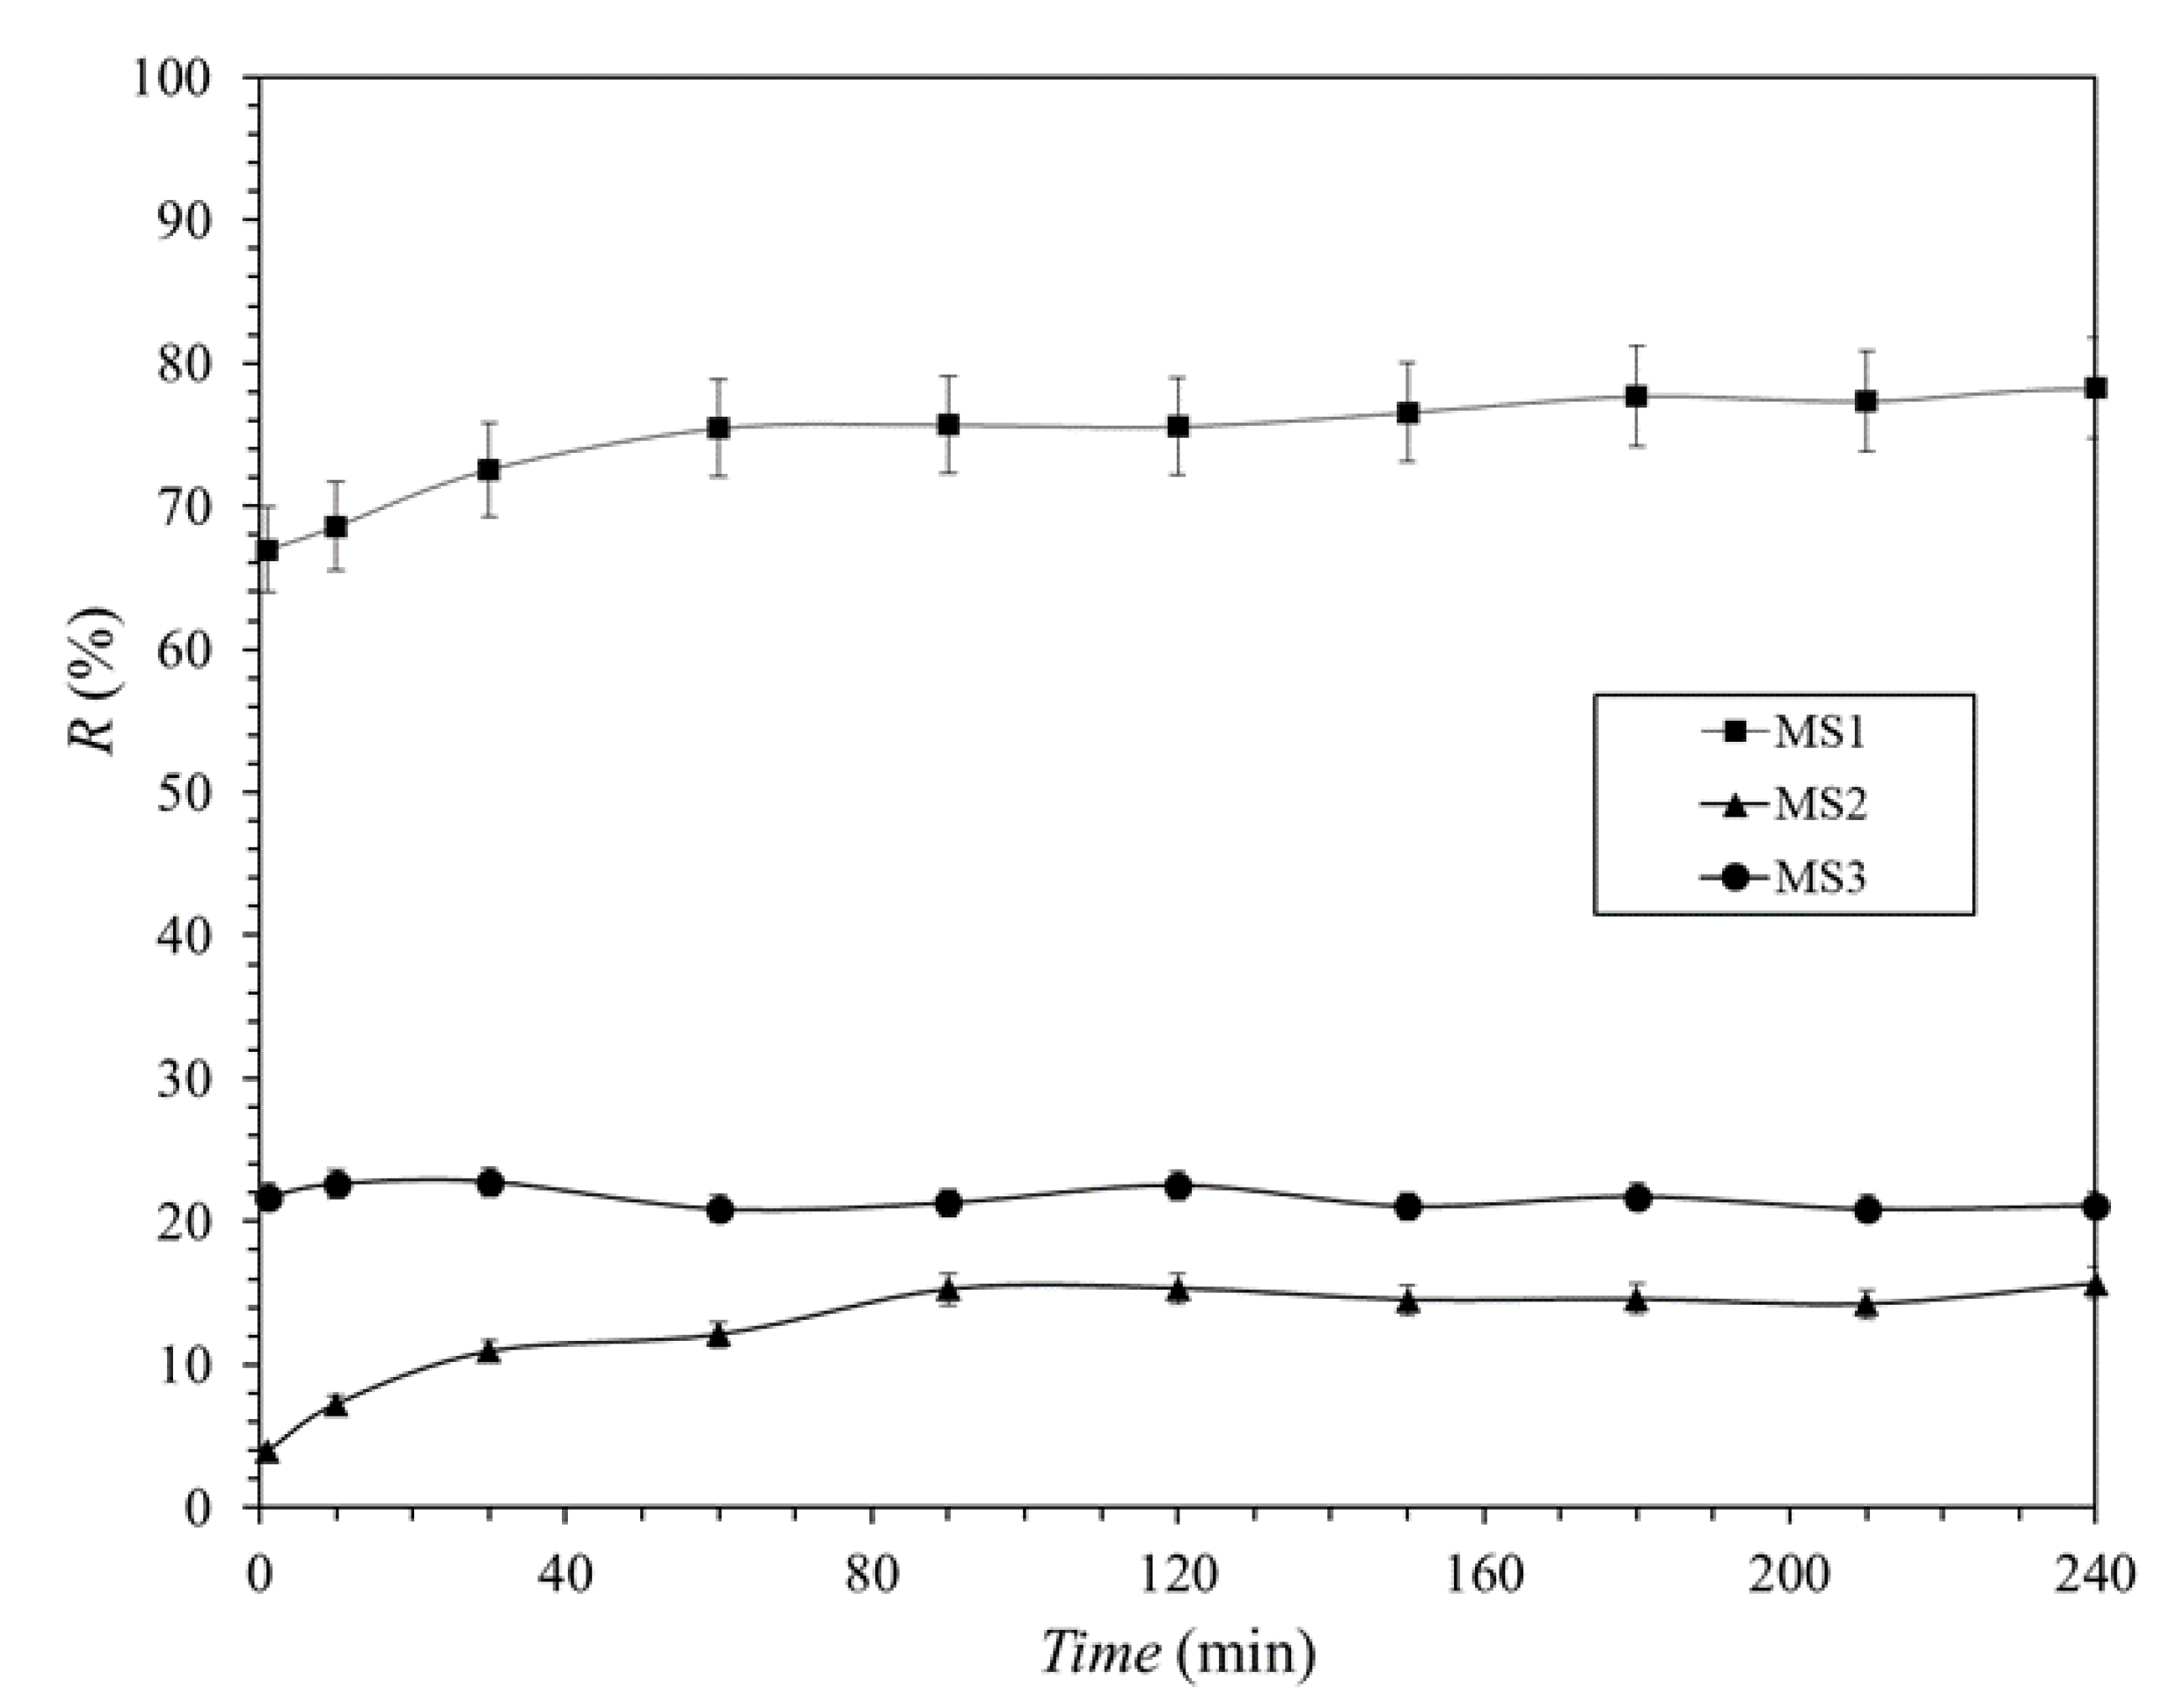
The experimentally obtained retention rates in the NF process for all model solutions were presented in Figure 3. The obtained retentions in process time slightly changed only initially and reached constant values after 40 min for whole processes which lasted up to 240 min. It has to be noticed, that two model solutions containing 3.6 g/L of succinic acid have displayed totally different values of retention. When sodium hydroxide was used as a pH regulator, the retention rate varied between 67% and 77% (see MS1 in Figure 3). When magnesium hydroxycarbonate was used, the retention decreased from significantly reaching a range of 20–22% (see MS3 in Figure 3). On the other hand, when the concentration of succinic acid increased from 3.6 g/L (MS1) to 36 g/L (MS2), the retention decreased form 67–77% to 3–16%. When retention profiles of MS1 and MS2 were analyzed separately, the initial increase of retention rate could be related to the fouling caused by concentration polarization, internal pore blocking or cake formation as it was described in [61]. However, since the MS2 has 10 times higher concentration than MS1, then it should be expected that retention rate would be kept at the same level, or that it should increase if there fouling would occur; but this was not the case. Therefore, it can be assumed that there is no typical fouling but a type of electrokinetic saturation of surface charges, the mathematical description of which is unknown to authors and requires further detailed studies.
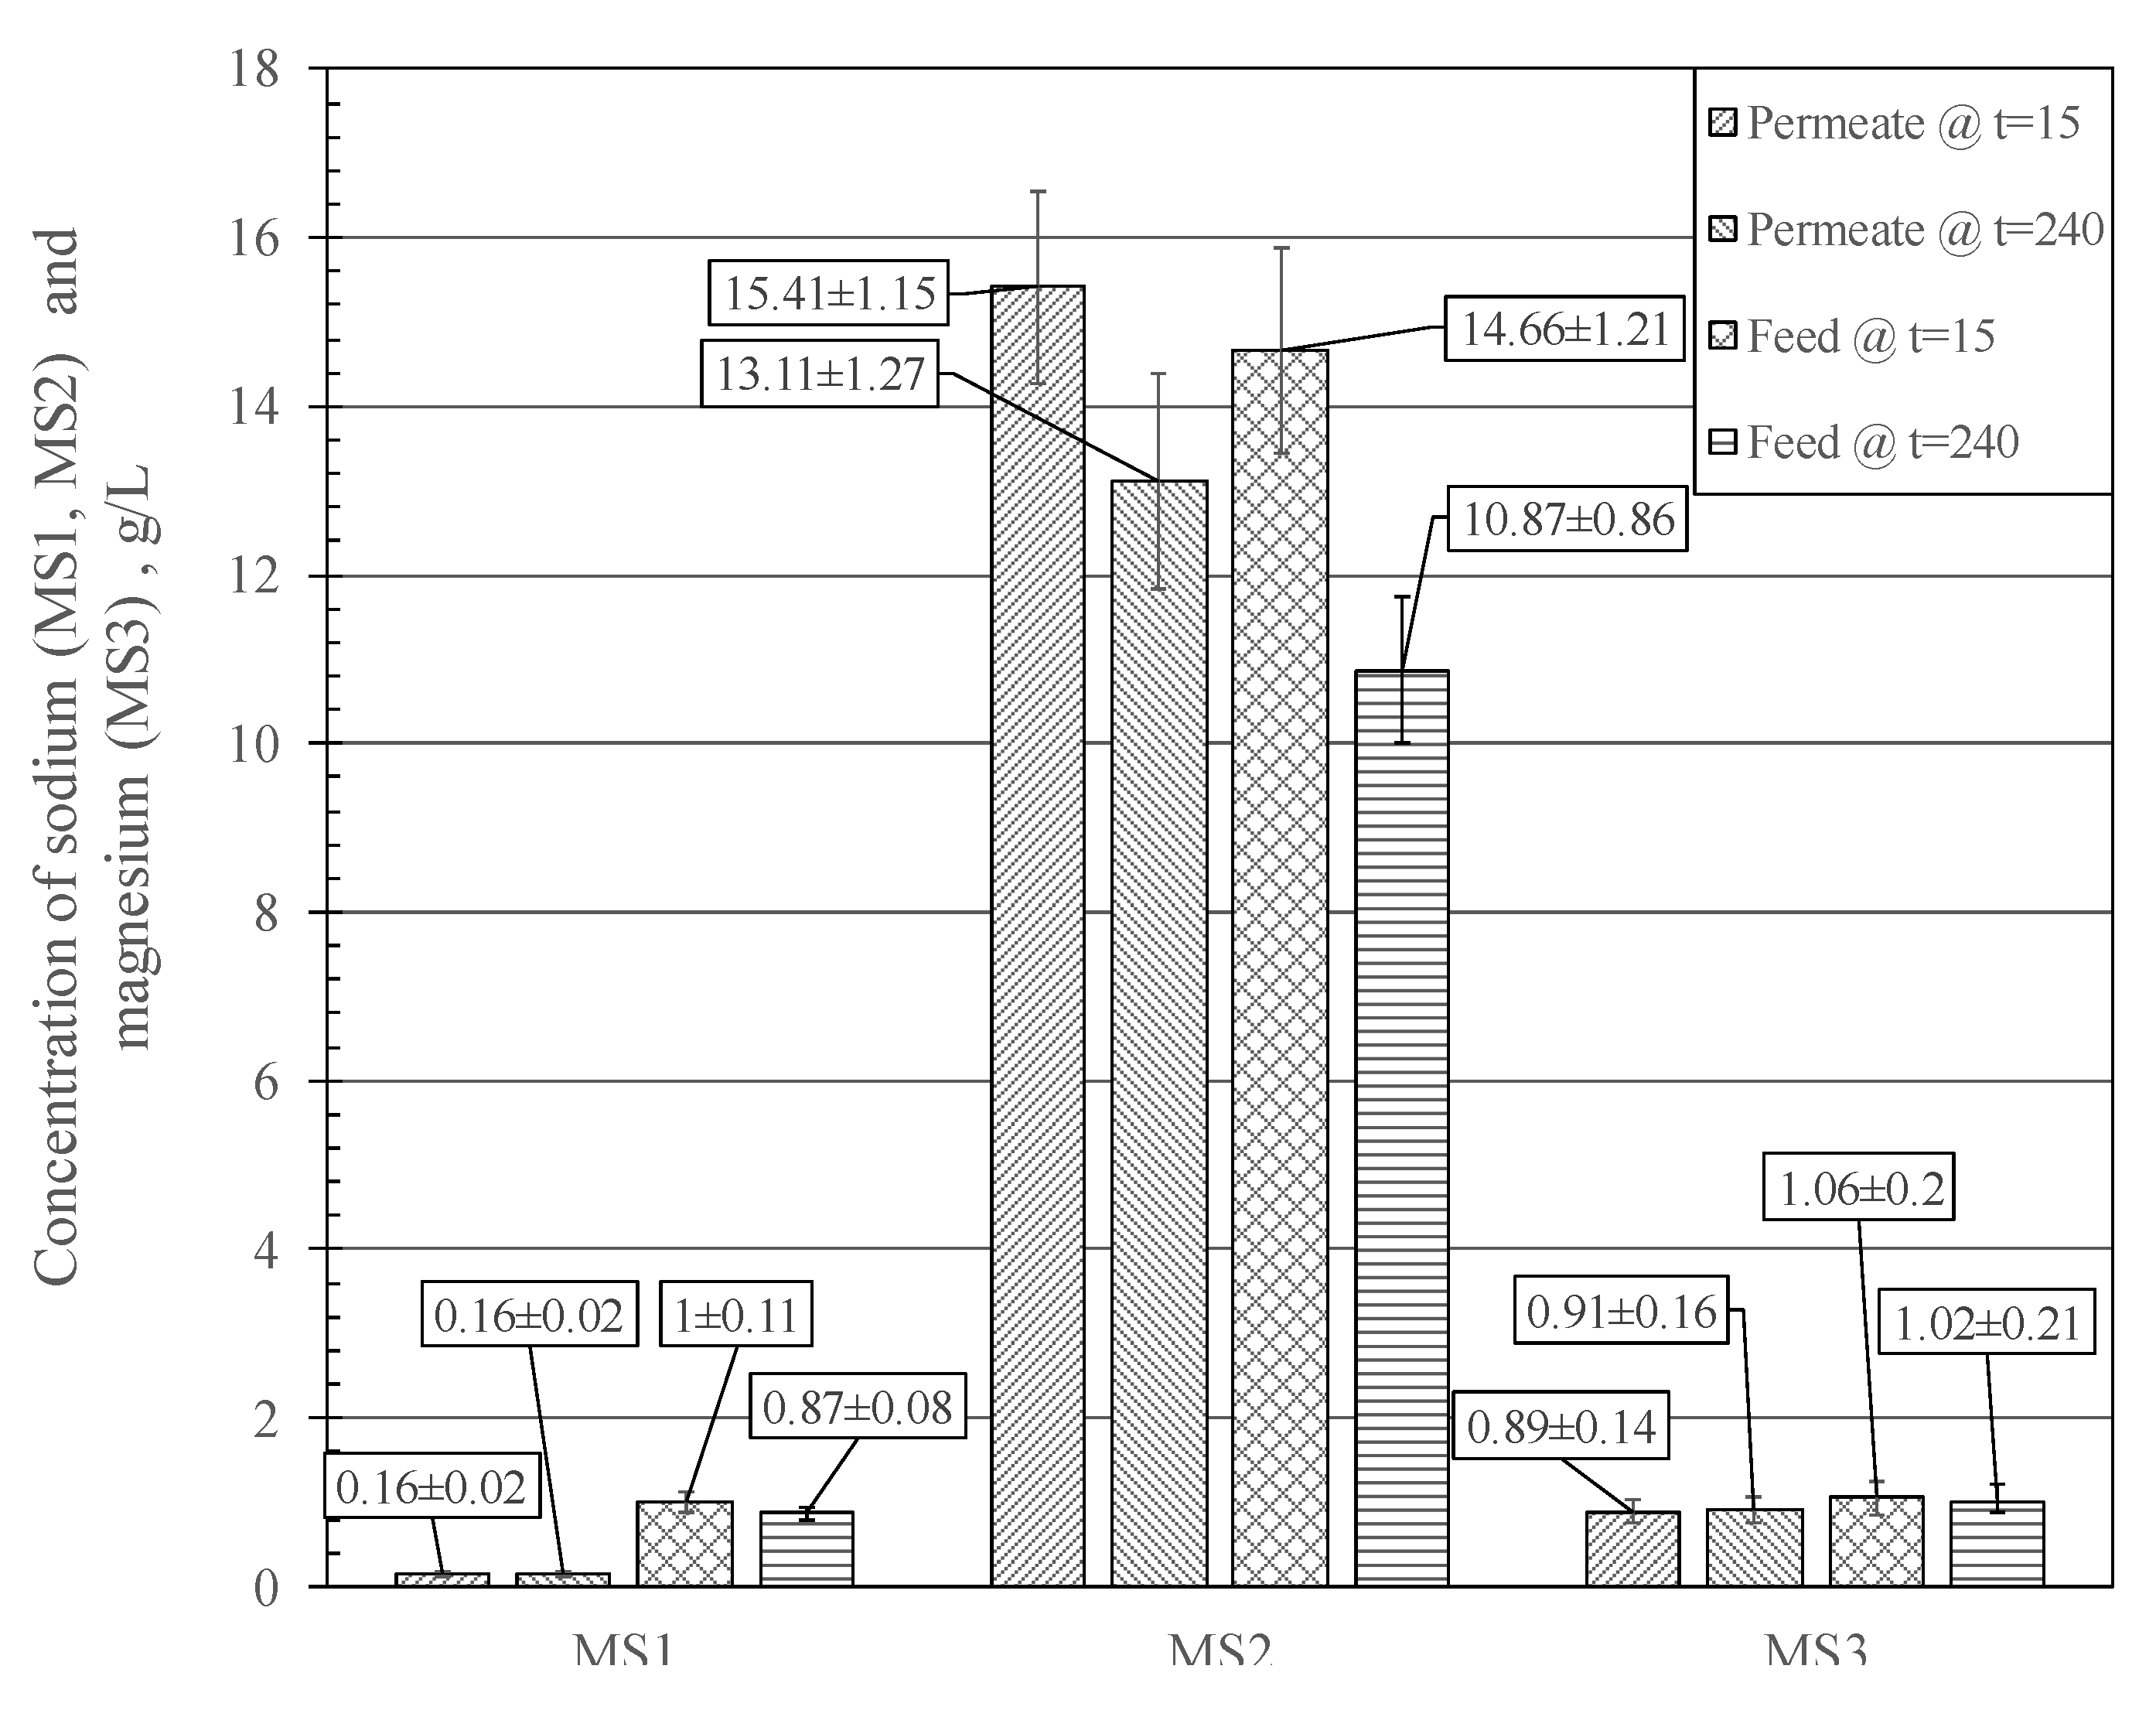
The concentrations of sodium in the feed and permeate have changed significantly in the end of MS2 separation experiments, which is not the case in MS1 (Figure 4). That observation indicates that there is a mechanism of ion binding by the pore wall at higher concentration of sodium. Based on the obtained results, the ion binding for lower concentrations of succinic acid and pH-regulators (MS1 and MS3) can be excluded.

4.1. Impact of Dynamic Viscosity on Modeled Permeate Flux

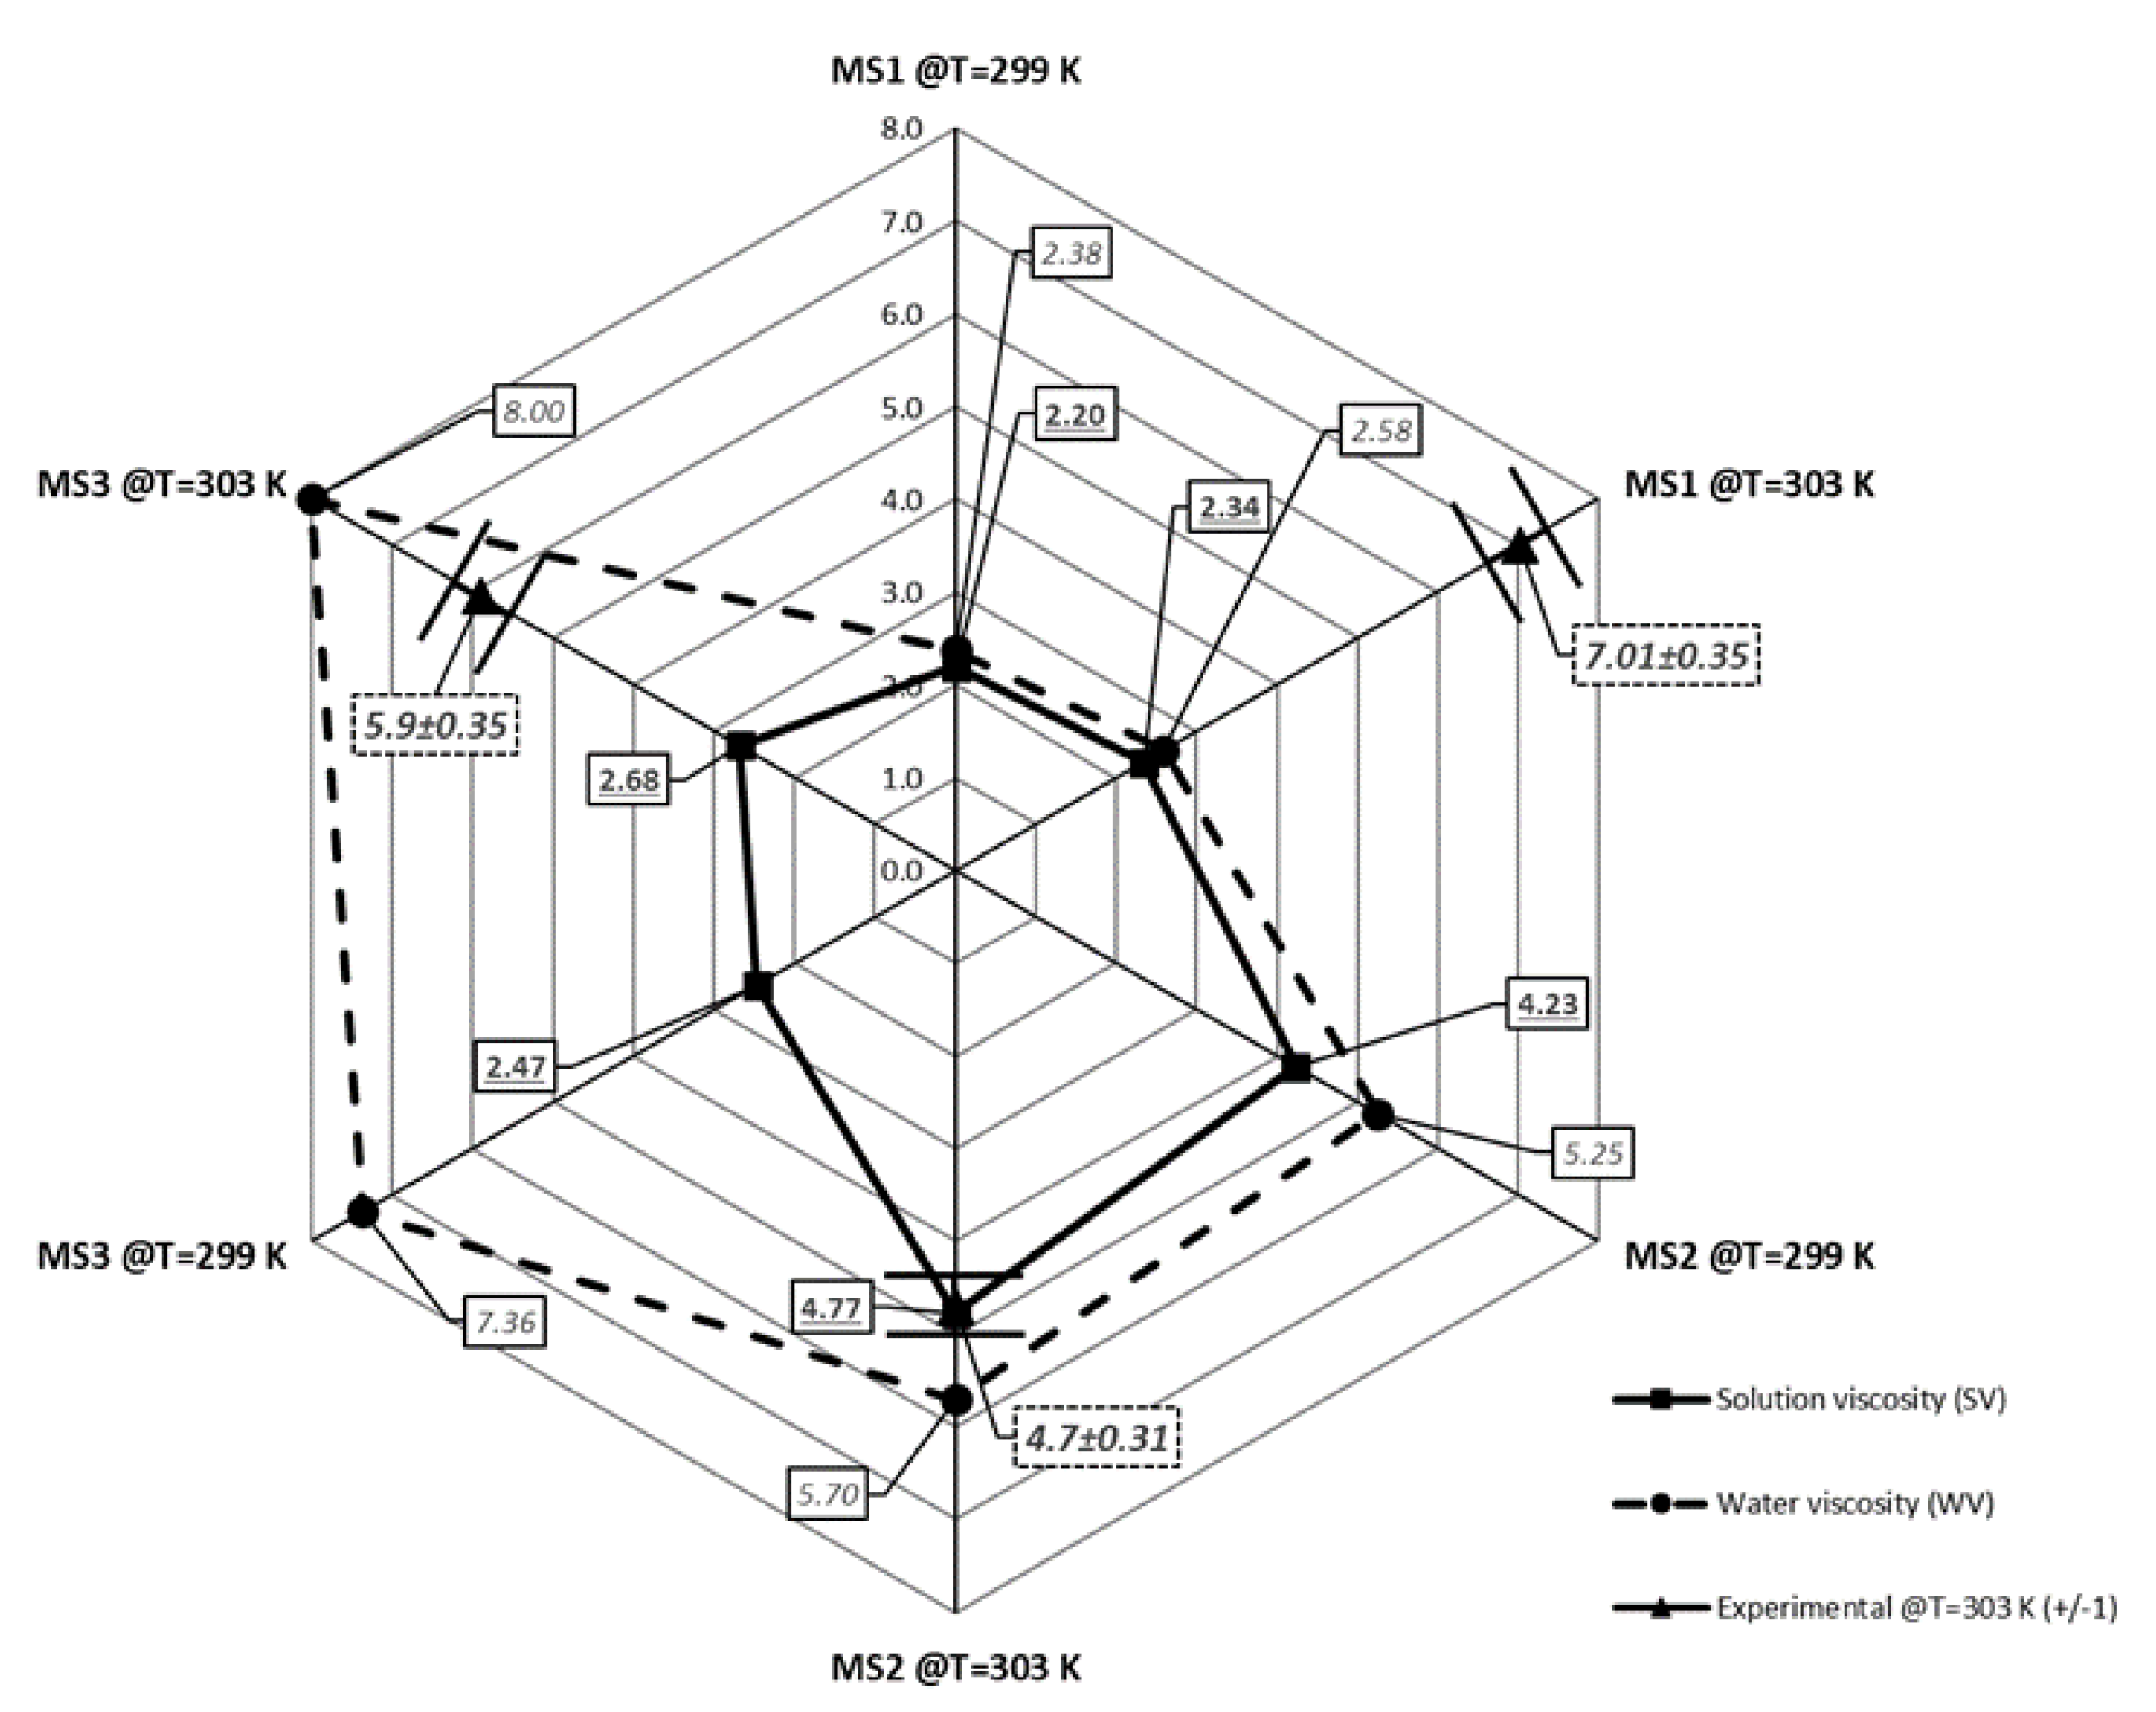
The obtained dynamic viscosity values for all model solutions were presented in relation to the temperature in Figure 2. In modeling, it is generally assumed that viscosities of aqueous solutions with low solute concentrations are equal to water viscosity. For the MS1 at 303 K, the obtained viscosity value differed by approximately 10% in comparison with reference water viscosity. Such difference can influence the modeling results, which is highlighted by comparison of volumetric fluxes calculated with experimentally obtained viscosities and with viscosity being equal to water at certain temperatures which was presented in Figure 5. In general, the experimental viscosities in calculations of volumetric fluxes for investigated solutions resulted in a decrease of calculated volumetric fluxes from 7.5% for MS1 and up to 66.4% for MS3 to those calculated with pure water viscosities. It has to be stated that including the experimentally obtained viscosities resulted in better description of the experimental volume flux for MS2. However, for MS1 and MS3 cases the discrepancies between utilization of water and experimental viscosities were rather far from the experimental, but still of the same order. Generally, for the investigated solutions, the use of experimental viscosities with combination of the Hagen–Poiseuille equation resulted in an underestimation of the calculated volume flux.

4.2. Comparison of the ddDSPM Model with the Standard Approach

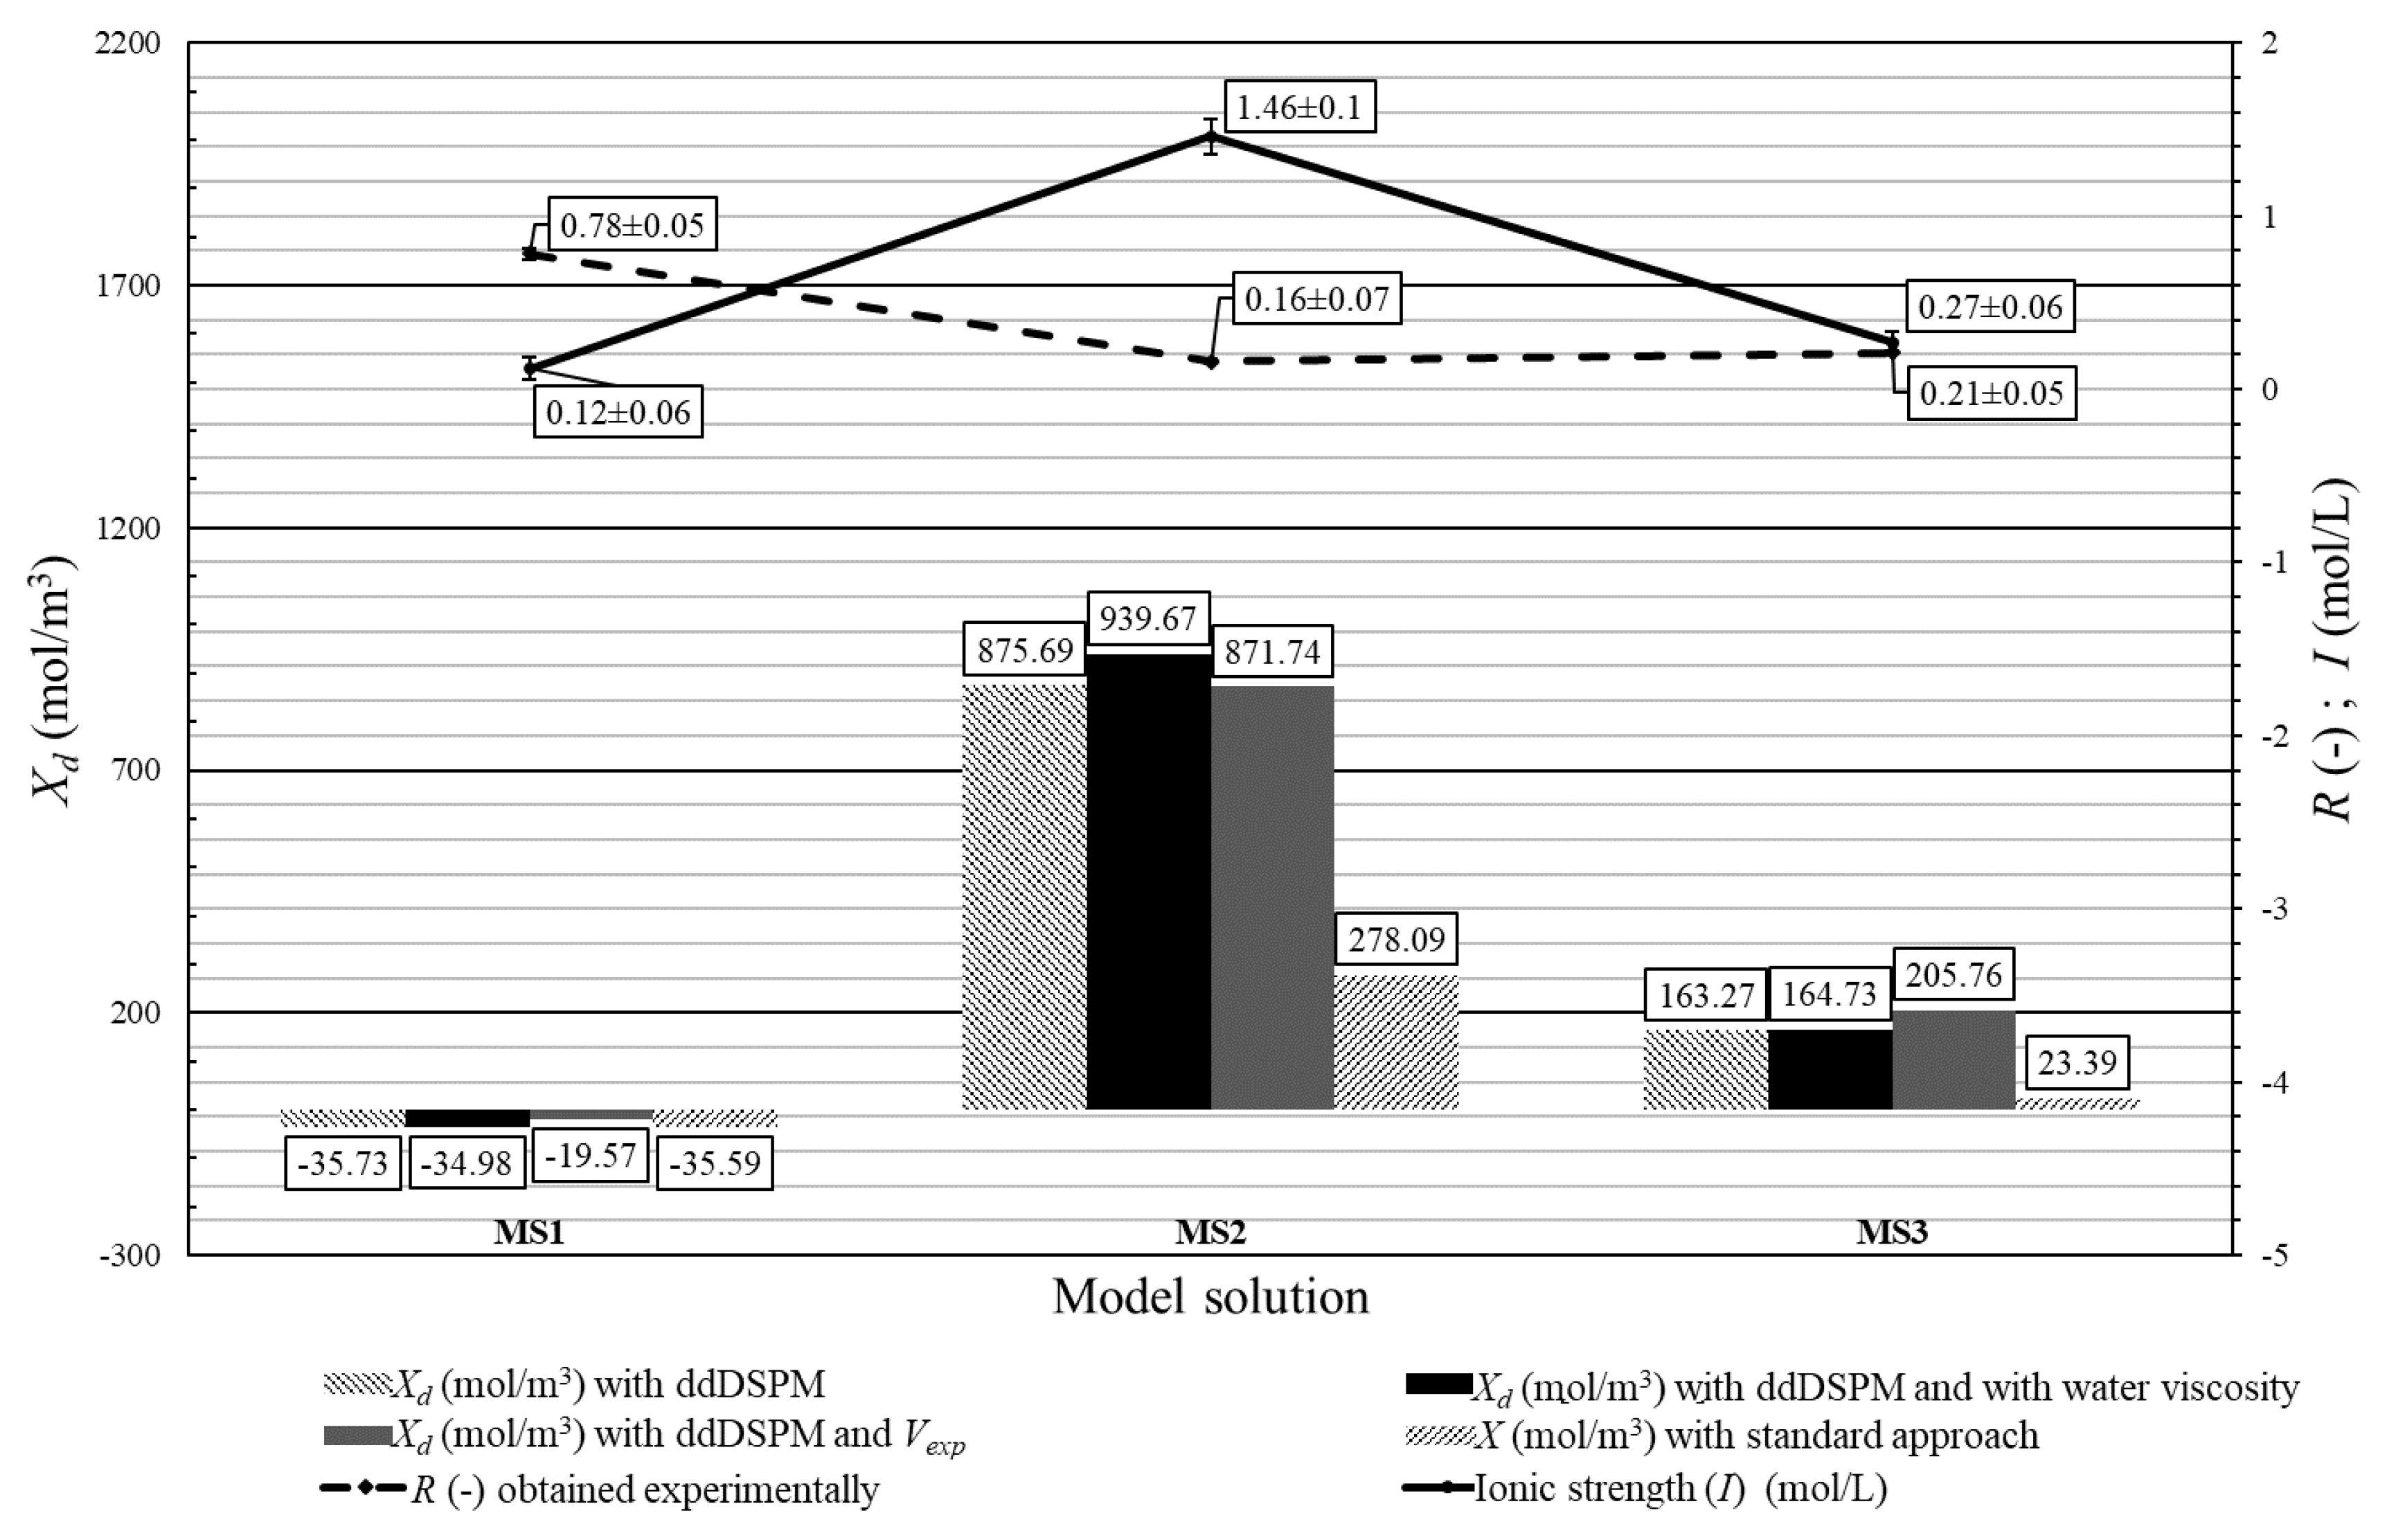
The standard approach considers only concentrations of solutes and ions coming from dissolved components, in the presented cases from succinic acid. The ddDSPM model takes into account all solutes, ions, and solvent, which include succinic acid, pH regulating solutions and water. In the standard approach, the model consists of 29 equations and 46 variables (NC = 2), while in the ddDSPM there are 62 equations with 88 variables (NC = 5), which were solved with the aim to estimate Xd. Additionally, estimation of Xd was also conducted under direct consideration of values of experimental fluxes (Vexp) instead of volume fluxes calculated with the Hagen–Poiseuille equation. All estimation results were compared in Figure 6. In the standard approach (i.e., DSPM model, ions coming from pH regulator not included), Xd is changing between −35.59 and +278.09 mol/m3, while in the detailed approach (i.e., ddDSPM model, ions coming from pH regulator included) the changes ranged between −35.73 and +875.69 mol/m3. The use of the water viscosity in the ddDSPM resulted in Xd values ranging between −34.98 and +939.67 mol/m3 and use of experimental values of volume fluxes (Vexp) in ddDSPM (i.e., ddDSPM model, ions coming from pH regulator included) resulted in Xd values ranging between −19.57 and +871.74 mol/m3. It is important to highlight that the retention obtained with the models overlaid with the experimental values, regardless of which model was used.
Based on the obtained results, it is difficult to postulate which modeling approach is the best, since it is impossible to experimentally obtain the overall membrane charge density Xd. However, it is evident that the obtained values of Xd for higher concentration of solutes (MS2) differ significantly depending on the applied modeling approach. At first glance, it seems that there is no clear reason to use the ddDSPM model for diluted solution such as MS1; however, when feed contains a higher number of components or polyanions like in MS3, the ddDSPM would be recommended. The presented results clearly show that use of experimentally obtained volumetric flux in comparison to the ddDSPM with experimentally obtained viscosities does not significantly influence the Xd when computed volumetric flux is in good comparison to the experimental one (MS2). Otherwise, use of experimental volumetric flux in estimation of Xd is recommended.

4.3. Variation of the Overall Volume Charge Densities in Relation to Used pH Regulator

Comparison of the estimated values of the total volume membrane charge densities with standard and detailed models was presented in Figure 6 along with ionic strength and obtained experimental rejections for each investigated solution. The ionic strength I for each model solution was calculated according to Equation (22).
I = 1 2 i = 1 N C ( c i z i 2 )
As presented in Figure 6, the estimated values of Xd for each model solutions were clearly different, but these values were adequate to retention rates obtained in the NF processes. In general, the higher ionic strength of the separated solutions resulted in a higher value of the total volumetric charge of the membrane. It should be noted that Xd values for all model solutions were values obtained for the experiments which reached the steady state and these values should not be confused with the fixed membrane charge because the Xd relates all electrokinetic phenomena present in the vicinity of membrane surface and not only those related to the membrane surface as it is in the case of fixed membrane charge [62,63,64]. The achieved Xd value for MS1 (3.6 g/L succinic acid of pH = 9.7 regulated with granulate NaOH) equal to −35.73 mol/m3 may indicate the presence of strong electrostatic repulsion between succinate anions present in aqueous solution and membrane surface functional groups, hence the Xd reached a negative value and retention achieved 78%. For two other cases, the Xd values were positive. Such behavior could be related to the amphoteric characteristics of TiO2 active membrane layer, although it is generally explained by the charge change at isoelectric point at specific pH [46].
T i O H + H 3 O + T i O H 2 + + H 2 O at   pH < I E P
T i O H + O H T i O + H 2 O at   pH > I E P
In the studied cases, when pH was equal to approximately 9, it was expected that the active layer would possess negatively charged groups. The succinate anion has the lowest diffusion coefficient among other ions present in the system (Table 4), therefore succinate anions should grind and penetrate the membrane as the last anions. Although such strongly positive Xd value obtained for MS2 (36.0 g/dm3 succinic acid at pH = 8.8 regulated with granulate NaOH) may reflect high concentration of sodium cations, their selective adsorption on membrane surface, which results in formation of additional surface layer and appearance of the electrostatic attraction of the succinic anions, resulted in very low retention (16%). In cases of basic salts, it is very difficult to determine which hypothetical mechanisms might influence the separation and could result in such charge values. Although the estimated value for the MS3 (3.6 g/dm3 of succinic acid with pH = 8.7 regulated with 4MgCO3 × Mg(OH)2 × 5H2O) was equal to +163.27 mol/m3, which suggests the selective adsorption of magnesium cations or other cations on the membrane active layer surface, also within the pores.
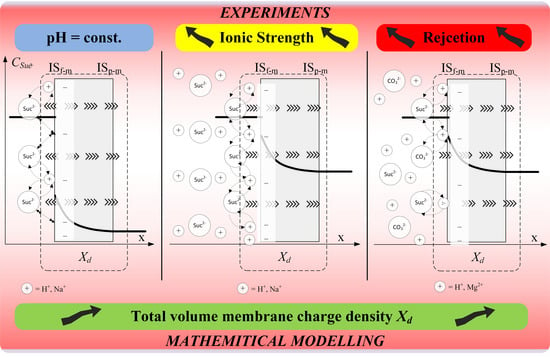
In general, the increase of the membrane charge densities with pH increase might be caused by the selective adsorption of ions at the membrane-separated mixture interface and additional adsorption in membranes’ pores in active layer [65]. In this work, authors consider the total volume membrane charge density as the sum of the fixed membrane charge density and the number of adsorbed ions in the whole active membrane volume and its close vicinity at the feed side and membrane pores. The possible mechanism for the formation of membrane charge assumes that ions are partitioned from the bulk solution into the membrane pore under the influence of the Donnan potential. Among the partitioned ions in the membrane pores, either cations or anions are adsorbed selectively by the pore walls. Next, the adsorbed ions are bound on the pore wall and provide the electric charge to the membrane, which is specific to the investigated cases. In view of all that was stated above, the values of total volume membrane charge densities Xd will always be different depending on the type of solution subjected to the NF process, although the pH values are the same. Despite that pH for all studied solutions was equal to approximately 9, the Xd values varied between −35.73 and +875.69 mol/m3 (Figure 6). Therefore, it can be assumed that, the mechanism of selective ion adsorption plays a significant role despite similar pH values, the schematic explanation of which was presented in Figure 7. The overall volume membrane charge density in MS1 is negative because not all negative membrane surface group are associated with cations present in the solution, therefore succinic ions are repulsed by the membrane interface. The MS3 contains a similar amount of added magnesium hydroxide as sodium hydroxide in MS1. Since the magnesium ion possesses two positive charges, it can interact with two negative membrane sites and more negative membrane sites can be associated. Therefore, in MS3, the succinic ions can permeate more easily than in case of MS1. The lowest retention observed for MS2 could be related to the highest overall volume membrane charge due to high concentration of dissociated succinic acid and the highest amount of added sodium hydroxide, which in that case could compensate all present negative membrane charges.

5. Conclusions

The main goal of the performed computer-aided simulations was to estimate the membrane surface charge densities with the use of the comprehensively described Donnan–Steric partitioning model, which is derived from the extended Nernst–Planck equation with Donnan partitioning assumption. The obtained total volume membrane charge densities Xd are consistent with experimental values of retention. Values such as charge density of the membrane are very important for explanation of the mechanism of ions transport across the membrane, defining retention, and describing influences on electrostatic repulsion between ions and membrane.
The presented work can be summarized in the following points: (1) separation of organic acids, such as succinic acid, on the ceramic membrane is affected by the acid concentration and the type of used pH regulator; (2) experiments clearly show that increase of the concentration of components can decrease the retention of separated components (MS1 and MS2); (3) use of a different pH regulator can dramatically change the performance of the separation (MS1 and MS3); (4) in case of low succinic acid concentration, the membrane functional group (-TiO2) dissociation has the greatest impact on the charge formation, whereas in case of higher succinic acid concentrations, it is postulated that the charge formation is determined by adsorption of specific ions on the membrane active layer; (5) defining separation performance at certain pH can be totally different in the vicinity of other components or impurities; (6) detailed description of experiments is required in order to compute Xd, even reporting the amount of added pH regulator; (7) including all components in mathematical modeling can allow for better understanding of nanofiltration separation.
Based on the obtained results and authors knowledge, it is impossible to state which modeling approach is the best, however it is clear to recommend the comprehensively described Donnan–Steric partitioning model to analyze the separation of multicomponent mixtures as it gives reasonable results and takes into account all components present in the mixture.

Author Contributions

Conceptualization, A.M.-M., P.T.M. and K.P.; Methodology, K.P., P.T.M., and J.R.; Modeling and simulation, A.M.-M.; Validation, A.M.-M. and P.T.M.; Experimental investigation, A.M.-M. and J.A.; Resources, K.P. and J.R.; Writing—original draft preparation, A.M.-M.; Writing—review and editing, A.M.-M., P.T.M., K.P., and J.R.; Supervision, P.T.M.

Funding

This research was supported by the Ministry of Science and Higher Education in Poland subsidy for Poznan University of Technology, Faculty of Chemical Technology (grant nos. 03/32/SBAD/0902 and 03/32/SBAD/0901).

Conflicts of Interest

The authors declare no conflict of interest.

Nomenclature

Akmean membrane porosity, %
Cf,H2Owater molar concentration in feed, mol/m3
Cf,iion concentration in the feed, mol/m3
Cp.iion concentration in the permeate, mol/m3
Didiffusion coefficient of component or ion, m2/s
FFaraday constant, C/mol
Iionic strength, mol/dm3
ISf-mfeed-membrane interface
ISf-mpermeate-membrane interface
Kc,Ihindrance factor for convection
Kd,Ihindrance factor for diffusion
MSmodel solution, numbering and details according the Table 1
Ntotal number of measurements taken during all the experiments
NCnumber of components
NEnumber of experiments performed
NMijnumber of measurements of the j-th variable in the i-th experiment
NVinumber of variables measured in the i-th experiment
Rideal gas constant, J/(mol × K)
Riretention coefficient of component i
Ttemperature, K
Vsolvent velocity (volume flux), m3/(m2 × s)
wmolar volume of water, m3/mol
Xdeffective membrane charge density, mol/m3
cijkk-th predicted value of variable j in experiment i
cijk,mesk-th measured value of variable j in experiment i
cm(0+),iion concentration in the membrane in the surface directly contacting with the feed, mol/m3
cm,iconcentration of ion in the membrane, mol/m3
kBBoltzmann constant (1.38×10⁻²³ J/K)
rppore radii, m
rs,iion radii, m
xf,imolar fraction on the feed side, mol/mol
xp,imolar fraction on the permeate side, mol/mol
zicharge of individual ion
Greek Letters
θset of model parameters to be estimated
Ψpotential gradient inside membrane pore, V
ΨDDonnan potential, V
Δπosmotic pressure difference, Pa
ΔPtransmembrane pressure, Pa
Δxthickness of membrane active layer, m
ηviscosity, Pa × s
ηssolvent viscosity, Pa × s
λiratio of solute to pore radius
πpermeateosmotic pressure on the permeate side, Pa
πfeedosmotic pressure on the feed side, Pa
σ ijk 2 variance of the k-th measurement of variable j in experiment i
Φisteric term

References

  1. Lisiecki, P.; Chrzanowski, Ł.; Szulc, A.; Ławniczak, Ł.; Białas, W.; Dziadas, M.; Owsianiak, M.; Staniewski, J.; Cyplik, P.; Marecik, R.; et al. Biodegradation of diesel/biodiesel blends in saturated sand microcosms. Fuel 2014, 116, 321–327. [Google Scholar] [CrossRef] [Green Version]
  2. Chrzanowski, Ł.; Dziadas, M.; Ławniczak, Ł.; Cyplik, P.; Białas, W.; Szulc, A.; Lisiecki, P.; Jeleń, H. Biodegradation of rhamnolipids in liquid cultures: Effect of biosurfactant dissipation on diesel fuel/B20 blend biodegradation efficiency and bacterial community composition. Bioresour. Technol. 2012, 111, 328–335. [Google Scholar] [CrossRef] [PubMed]
  3. Ma, F.; Hanna, M.A. Biodiesel production: A review. Bioresour. Technol. 1999, 70, 1–15. [Google Scholar] [CrossRef]
  4. BP Statistical Review of World Energy. Available online: https://www.bp.com/content/dam/bp/business-sites/en/global/corporate/pdfs/energy-economics/statistical-review/bp-stats-review-2018-full-report.pdf (accessed on 22 January 2019).
  5. Lalman, J.A.; Shewa, W.A.; Gallagher, J.; Ravella, S. Biofuels Production from Renewable Feedstocks. In Quality Living Through Chemurgy and Green Chemistry; Springer: Berlin/Heidelberg, Germany, 2016; pp. 193–220. ISBN 9783662537022. [Google Scholar]
  6. Gao, C.; Yang, X.; Wang, H.; Rivero, C.P.; Li, C.; Cui, Z.; Qi, Q.; Lin, C.S.K. Robust succinic acid production from crude glycerol using engineered Yarrowia lipolytica. Biotechnol. Biofuels 2016, 9, 179. [Google Scholar] [CrossRef] [PubMed]
  7. Antczak, J.; Regiec, J.; Prochaska, K. Separation and concentration of succinic adic from multicomponent aqueous solutions by nanofiltration technique. Pol. J. Chem. Technol. 2014, 16, 1–4. [Google Scholar] [CrossRef]
  8. Becker, J.; Lange, A.; Fabarius, J.; Wittmann, C. Top value platform chemicals: Bio-based production of organic acids. Curr. Opin. Biotechnol. 2015, 36, 168–175. [Google Scholar] [CrossRef] [PubMed]
  9. Piotrowska, E.; Szewczyk, K.W.; Jaworska, M.M.; Konieczna-Mordas, E. Biotechnologiczne wytwarzanie kwasu bursztynowego. Inż. Ap. Chem. 2012, 51, 171–173. [Google Scholar]
  10. Vinoth Kumar, R.; Pakshirajan, K.; Pugazhenthi, G. Malic and succinic acid: potential C4 platform chemicals for polymer and biodegradable plastic production. In Platform Chemical Biorefinery: Future Green Chemistry; Elsevier: Amsterdam, The Netherlands, 2016; pp. 159–179. ISBN 978-0-12-802980-0. [Google Scholar]
  11. Van Heerden, C.D.; Nicol, W. Continuous succinic acid fermentation by Actinobacillus succinogenes. Biochem. Eng. J. 2013, 73, 5–11. [Google Scholar] [CrossRef] [Green Version]
  12. Carvalho, M.; Matos, M.; Roca, C.; Reis, M.A.M. Succinic acid production from glycerol by Actinobacillus succinogenes using dimethylsulfoxide as electron acceptor. New Biotechnol. 2014, 31, 133–139. [Google Scholar] [CrossRef]
  13. Bradfield, M.F.A.; Nicol, W. Continuous succinic acid production by Actinobacillus succinogenes in a biofilm reactor: Steady-state metabolic flux variation. Biochem. Eng. J. 2014, 85, 1–7. [Google Scholar] [CrossRef] [Green Version]
  14. Pateraki, C.; Patsalou, M.; Vlysidis, A.; Kopsahelis, N.; Webb, C.; Koutinas, A.A.; Koutinas, M. Actinobacillus succinogenes: Advances on succinic acid production and prospects for development of integrated biorefineries. Biochem. Eng. J. 2016, 112, 285–303. [Google Scholar] [CrossRef]
  15. Staszak, K.; Woźniak, M.; Sottek, M.; Karaś, Z.; Prochaska, K. Removal of fumaric acid from simulated and real fermentation broth. J. Chem. Technol. Biotechnol. 2015, 90, 432–440. [Google Scholar] [CrossRef]
  16. Erickson, B.; Nelson; Winters, P. Perspective on opportunities in industrial biotechnology in renewable chemicals. Biotechnol. J. 2012, 7, 176–185. [Google Scholar] [CrossRef] [PubMed]
  17. López-Garzón, C.S.; Straathof, A.J.J. Recovery of carboxylic acids produced by fermentation. Biotechnol. Adv. 2014, 32, 873–904. [Google Scholar] [CrossRef] [PubMed]
  18. Efe, Ç.; Pieterse, M.; van der Wielen, L.A.M.; Straathof, A.J.J. Separation of succinic acid from its salts on a high-silica zeolite bed. Chem. Eng. Process. Process Intensif. 2011, 50, 1143–1151. [Google Scholar] [CrossRef]
  19. Pérez-Cisneros, E.S.; Mena-Espino, X.; Rodríguez-López, V.; Sales-Cruz, M.; Viveros-García, T.; Lobo-Oehmichen, R. An integrated reactive distillation process for biodiesel production. Comput. Chem. Eng. 2016, 91, 233–246. [Google Scholar] [CrossRef]
  20. Zaman, N.K.; Rohani, R.; Abdul Shukor, M.H.; Mohamad, A.W. Purification of High Value Succinic Acid from Biomass Fermentation Broth via Nanofiltration. Indian J. Sci. Technol. 2016, 9, 95244. [Google Scholar] [CrossRef]
  21. Zaman, N.K.; Rohani, R.; Mohammad, A.W.; Isloor, A.M.; Jahim, J.M. Investigation of succinic acid recovery from aqueous solution and fermentation broth using polyimide nanofiltration membrane. J. Environ. Chem. Eng. 2017. [Google Scholar] [CrossRef]
  22. Wang, Y.; Wang, X.; Liu, Y.; Ou, S.; Tan, Y.; Tang, S. Refining of biodiesel by ceramic membrane separation. Fuel Process. Technol. 2009, 90, 422–427. [Google Scholar] [CrossRef]
  23. Blumenschein, S.; Böcking, A.; Kätzel, U.; Postel, S.; Wessling, M. Rejection modeling of ceramic membranes in organic solvent nanofiltration. J. Memb. Sci. 2016, 510, 191–200. [Google Scholar] [CrossRef]
  24. Hilal, N.; Al-Zoubi, H.; Darwish, N.A.; Mohamma, A.W.; Abu Arabi, M. A comprehensive review of nanofiltration membranes: Treatment, pretreatment, modelling, and atomic force microscopy. Desalination 2004, 170, 281–308. [Google Scholar] [CrossRef]
  25. Bowen, W.R.; Welfoot, J.S. Predictive modelling of nanofiltration: Membrane specification and process optimisation. Desalination 2002, 147, 197–203. [Google Scholar] [CrossRef]
  26. Mitkowski, P.T.; Buchaly, C.; Kreis, P.; Jonsson, G.; Górak, A.; Gani, R. Computer aided design, analysis and experimental investigation of membrane assisted batch reaction-separation systems. Comput. Chem. Eng. 2009, 33, 551–574. [Google Scholar] [CrossRef]
  27. Van der Bruggen, B.; Mänttäri, M.; Nyström, M. Drawbacks of applying nanofiltration and how to avoid them: a review. Sep. Purif. Technol. 2008, 63, 251–263. [Google Scholar] [CrossRef]
  28. Vandezande, P.; Gevers, L.E.M.; Vankelecom, I.F.J. Solvent resistant nanofiltration: Separating on a molecular level. Chem. Soc. Rev. 2008, 37, 365–405. [Google Scholar] [CrossRef] [PubMed]
  29. Szymczyk, A.; Fatin-Rouge, N.; Fievet, P.; Ramseyer, C.; Vidonne, A. Identification of dielectric effects in nanofiltration of metallic salts. J. Memb. Sci. 2007, 287, 102–110. [Google Scholar] [CrossRef]
  30. Szymczyk, A.; Fievet, P. Investigating transport properties of nanofiltration membranes by means of a steric, electric and dielectric exclusion model. J. Memb. Sci. 2005, 252, 77–88. [Google Scholar] [CrossRef]
  31. Bellona, C.; Drewes, J.E.; Xu, P.; Amy, G. Factors affecting the rejection of organic solutes during NF/RO treatment—A literature review. Water Res. 2004, 38, 2795–2809. [Google Scholar] [CrossRef]
  32. Teixeira, M.; Rosa, M.; Nystrom, M. The role of membrane charge on nanofiltration performance. J. Memb. Sci. 2005, 265, 160–166. [Google Scholar] [CrossRef]
  33. Broniarz-Press, L.; Mitkowski, P.T.; Szaferski, W.; Marecka, A. Modelowanie procesu odzysku fumaranu diamonu metodą nanofiltracji. Inż. Ap. Chem. 2014, 53, 223–224. [Google Scholar]
  34. Mitkowski, P.T.; Broniarz-Press, L.; Marecka, A. Knowledge and model-based framework for nanofiltration modelling. In Proceedings of the 4th European Young Engineers Conference 2015, Warsaw, Poland, 27–29 April 2015. [Google Scholar]
  35. Perrin, D.D.; Dempsey, B.; Serjeant, E.P. pKa Prediction for Organic Acids and Bases; Springer: Dordrecht, The Netherlands, 1981; ISBN 978-94-009-5885-2. [Google Scholar]
  36. Puhlfürß, P.; Voigt, A.; Weber, R.; Morbé, M. Microporous TiO2 membranes with a cut off <500 Da. J. Memb. Sci. 2000, 174, 123–133. [Google Scholar]
  37. Zhang, Q.; Jing, W.; Fan, Y.; Xu, N. An improved Parks equation for prediction of surface charge properties of composite ceramic membranes. J. Memb. Sci. 2008, 318, 100–106. [Google Scholar] [CrossRef]
  38. Kong, F.; Yang, H.; Wang, X.; Xie, Y.F. Assessment of the hindered transport model in predicting the rejection of trace organic compounds by nanofiltration. J. Memb. Sci. 2016, 498, 57–66. [Google Scholar] [CrossRef]
  39. Ang, W.L.; Mohammad, A.W. Mathematical modeling of membrane operations for water treatment. In Advances in Membrane Technologies for Water Treatment; Elsevier: Amsterdam, The Netherlands, 2015; pp. 379–407. ISBN 9781782421214. [Google Scholar]
  40. Marchetti, P.; Jimenez Solomon, M.F.; Szekely, G.; Livingston, A.G. Molecular separation with organic solvent nanofiltration: A critical review. Chem. Rev. 2014, 114, 10735–10806. [Google Scholar] [CrossRef] [PubMed]
  41. Darvishmanesh, S.; Buekenhoudt, A.; Degrève, J.; Van der Bruggen, B. General model for prediction of solvent permeation through organic and inorganic solvent resistant nanofiltration membranes. J. Memb. Sci. 2009, 334, 43–49. [Google Scholar] [CrossRef]
  42. Tanimura, S.; Nakao, S.I.; Kimura, S. Transport equation for a membrane based on a frictional model. J. Memb. Sci. 1993, 84, 79–91. [Google Scholar] [CrossRef]
  43. Bowen, W.R.; Mukhtar, H. Characterisation and prediction of separation performance of nanofiltration membranes. J. Memb. Sci. 1996, 112, 263–274. [Google Scholar] [CrossRef]
  44. Bowen, W.R.; Mohammad, A.W. Diafiltration by nanofiltration: Prediction and optimization. AIChE J. 1998, 44, 1799–1812. [Google Scholar] [CrossRef]
  45. Bowen, W.R.; Mohammad, A.W. A theoretical basis for specifying nanofiltration membranes-dye/salt/water streams. Desalination 1998, 117, 257–264. [Google Scholar] [CrossRef]
  46. Van Gestel, T.; Vandecasteele, C.; Buekenhoudt, A.; Dotremont, C.; Luyten, J.; Leysen, R.; Van der Bruggen, B.; Maes, G. Salt retention in nanofiltration with multilayer ceramic TiO2 membranes. J. Memb. Sci. 2002, 209, 379–389. [Google Scholar] [CrossRef]
  47. Bernata, X.; Fortuny, A.; Stüber, F.; Bengoa, C.; Fabregat, A.; Font, J. Recovery of iron (III) from aqueous streams by ultrafiltration. Desalination 2008, 221, 413–418. [Google Scholar] [CrossRef]
  48. Izadpanah, A.A.; Javidnia, A. The ability of a nanofiltration membrane to remove hardness and ions from diluted seawater. Water 2012, 4, 283–294. [Google Scholar] [CrossRef]
  49. Ramadan, Y.; Pátzay, G.; Szabó, G.T. Transport of NaCl, MgSO4, MgCl2 and Na2SO4 across DL type nanofiltration membrane. Period. Polytech. Chem. Eng. 2010, 54, 81. [Google Scholar] [CrossRef]
  50. Prochaska, K.; Antczak, J.; Regel-Rosocka, M.; Szczygiełda, M. Removal of succinic acid from fermentation broth by multistage process (membrane separation and reactive extraction). Sep. Purif. Technol. 2018, 192, 360–368. [Google Scholar] [CrossRef]
  51. Antczak, J.; Szczygiełda, M.; Prochaska, K. Nanofiltration separation of succinic acid from post-fermentation broth: Impact of process conditions and fouling analysis. J. Ind. Eng. Chem. 2019, 77, 253–261. [Google Scholar] [CrossRef]
  52. Matusiewicz, H.; Ślachciński, M.; Hidalgo, M.; Canals, A. Evaluation of various nebulizers for use in microwave induced plasma optical emission spectrometry. J. Anal. At. Spectrom. 2007, 22, 1174. [Google Scholar] [CrossRef]
  53. Braeken, L.; Bettens, B.; Boussu, K.; Van der Meeren, P.; Cocquyt, J.; Vermant, J.; Van der Bruggen, B. Transport mechanisms of dissolved organic compounds in aqueous solution during nanofiltration. J. Memb. Sci. 2006, 279, 311–319. [Google Scholar] [CrossRef]
  54. Labbez, C.; Fievet, P.; Thomas, F.; Szymczyk, A.; Vidonne, A.; Foissy, A.; Pagetti, P. Evaluation of the “DSPM” model on a titania membrane: Measurements of charged and uncharged solute retention, electrokinetic charge, pore size, and water permeability. J. Colloid Interface Sci. 2003, 262, 200–211. [Google Scholar] [CrossRef]
  55. Ilie, O.; van Loosdrecht, M.C.M.; Picioreanu, C. Mathematical modelling of tooth demineralisation and pH profiles in dental plaque. J. Theor. Biol. 2012, 309, 159–175. [Google Scholar] [CrossRef]
  56. Periodic Table of Elements: Hydrogen—H. Available online: http://environmentalchemistry.com/yogi/periodic/H.html (accessed on May 22, 2018).
  57. Lide, D.R. CRC Handbook of Chemistry and Physics, 84th ed.; CRC Press: Boca Raton, FL, USA, 2003. [Google Scholar]
  58. Atomic and Ionic Radii—Wired Chemist. Available online: http://www.wiredchemist.com/chemistry/data/atomic-and-ionic-radii (accessed on 22 May 2018).
  59. Li, Y.-H.; Gregory, S. Diffusion of ions in sea water and in deep-sea sediments. Geochem. Cosmochim. Acta 1974, 38, 703–714. [Google Scholar]
  60. Process Systems Enterprise Limited gPROMS. Model Builder Documentation 2014. Release 4.0.0-April 2014; Process Systems Enterprise: London, UK, 2014 20 April. [Google Scholar]
  61. Aydiner, C.; Kaya, Y.; Gönder, Z.B.; Vergili, I. Evaluation of membrane fouling and flux decline related with mass transport in nanofiltration of tartrazine solution. J. Chem. Technol. Biotechnol. 2010, 85, 1229–1240. [Google Scholar] [CrossRef]
  62. Kamo, N.; Kobatake, Y. Fixed charge density effective to membrane phenomena—Part III. Transference number of small ions. Kolloid-Z. Z. Polym. 1971, 249, 1069–1076. [Google Scholar] [CrossRef]
  63. Bandini, S.; Bruni, L. Transport Phenomena in Nanofiltration Membranes. In Comprehensive Membrane Science and Engineering; Elsevier: Amsterdam, The Netherlands, 2010; Volume 2, pp. 67–89. ISBN 9780080932507. [Google Scholar]
  64. Hagmeyer, G.; Gimbel, R. Modelling the rejection of nanofiltration membranes using zeta potential measurements. Sep. Purif. Technol. 1999, 15, 19–30. [Google Scholar] [CrossRef]
  65. Takagi, R.; Larbot, A.; Cot, L.; Nakagaki, M. Effect of Al2O3 support on electrical properties of TiO2/Al2O3 membrane formed by sol–gel method. J. Memb. Sci. 2000, 177, 33–40. [Google Scholar] [CrossRef]
Figure 1. Pilot installation of the NF process: 1—feed tank; 2—rotameter; 3—heat exchanger; 4—pump; 5—membrane module; 6—temperature and flow rate controller; 7—permeate measuring cylinder; 8—pressure gauge; 9—heater.
Processes 07 00559 g001
Figure 2. Experimental viscosity values of model solutions (MS1, MS2, MS3) and reference water viscosity in relation to temperature. Data in labels are ordered according to temperature expressed in Kelvin and value of viscosity.
Processes 07 00559 g002
Figure 3. Experimental retention rates achieved for model solutions: MS1 (3.6 g/L succinic acid at pH = 9.7 regulated with granulate NaOH), MS2 (36.0 g/L succinic acid at pH = 8.8 regulated with granulate NaOH) and MS3 (3.6 g/L succinic acid at pH = 8.7 regulated with 4MgCO3 × Mg(OH)2 × 5H2O) in relation to duration of the NF process.
Processes 07 00559 g003
Figure 4. Concentration of sodium and magnesium cations in permeate and feed sides after 15 and 240 min of separation.
Processes 07 00559 g004
Figure 5. Comparison of calculated volume fluxes of model solutions (MS1, MS2, MS3) (10−5 m3/(m2·s)) with experimental viscosities (SV) and pure water viscosities (WV) at different temperatures.
Processes 07 00559 g005
Figure 6. Comparison of estimated total volume membrane charge densities (Xd) with different modeling approaches with relation to ionic strength (I) and experimentally obtained retentions (R) (ddDSPM—detailed described Donnan–Steric Partitioning Model; DSPM—Donnan–Steric Partitioning Model with standard approach; Vexp—experimental volume flux).
Processes 07 00559 g006
Figure 7. Schematic representation of separation mechanisms in nanofiltration of aqueous solutions of succinic acid with different pH regulators (for details about MS1, MS2, and MS3 see Table 4, Xd—total volume membrane charge density; Csuc2—molar concentration of succinate anion; ISf-m—feed-membrane interface; ISf-m—permeate-membrane interface).
Processes 07 00559 g007
Table 1. Compositions of investigated solutions
Model SolutionConcentration of Succinic Acid (g/L)Compound Used to Regulate pHAmount of Added Compound Which Regulated pH (g/L)
MS13.6NaOH2.49
MS236.0NaOH24.26
MS33.64MgCO3 × Mg(OH)2 × 5H2O3.85
Table 2. Variables in the ddDSPM model (NC—number of separated components)
Differential variables UnitNumber
Concentration of ion in the membranecm,imol/m3NC
Algebraic and implicit variables UnitNumber
Potential gradient inside the membrane poreψV1
Ratio of solute to pore radiusλiNC
Steric termϕiNC
Hindrance factor for diffusionKd,iNC
Hindrance factor for convectionKc,iNC
Ion concentration in the permeateCp.imol/m3NC
Retention coefficientRi%NC
Solvent velocity (volume flux)Vm3/(m2·s)1
Donnan potentialψDV1
Osmotic pressure differenceΔπPa1
Osmotic pressure on the feed sideπeedPa1
Osmotic pressure on the permeate sideπpermeatePa1
Molar fraction on the feed sidexf,imol/molNC
Molar fraction on the permeate sidexp,imol/molNC
Ion concentration in the membrane in the surface directly contacting with the feedcm(0+),imol/m3NC
Parameters and known variable UnitNumber
Effective membrane charge densityXdmol/m31
Pore radiirpm1
Ion radiirs,imNC
Transmembrane pressureΔPPa1
Ideal gas constantRJ/(mol·K)1
Faraday constantFC/mol1
TemperatureTK1
Solvent viscosityηsPa·s1
Thickness of membrane active layerΔxm1
Molar volume of waterwm3/mol1
Diffusion coefficient of ionDim2/sNC
Mean membrane porosityAk%1
Charge of individual ionziNC
Ion concentration in the feedCf,imol/m3NC
Water molar concentration in feedCf,H2Omol/m31
Total number of variables: 17 + 14NC
Table 3. List of equations in the ddDSPM model (NC—number of separated components).
Description of EquationsEquationsNumber of Equations
Solvent velocity (volume flux) based on Hagen–Poiseuille-type relationship(2)1
Osmotic pressure difference across the membrane(3)1
Component molar fraction in feed (4)NC
Component molar fraction in permeate (5)NC
Osmotic pressure at the feed side(6)1
Osmotic pressure at the permeate side(7)1
Ratio of the solute radii to the pore radii(8)NC
Steric partitioning coefficient(9)NC
Hindrance factor for diffusion(10)NC
Hindrance factor for convection(11)NC
Concentration gradient inside the membrane pore(12)NC
Potential gradient inside the membrane pore(13)1
Electroneutrality conditions in the membrane(14)1
Electroneutrality conditions in the permeate(15)1
Donnan steric partitioning(16)NC
Retention coefficient(17)NC
Boundary condition at the membrane feed side(18)NC
Boundary condition at the membrane active layer thickness(19)NC
Total number of equations:7 + 9NC + 2NC (boundary conditions)
Table 4. Characteristics of all ions present in the model solutions
Type of Ionri,s·1010 mDi·109 m2/szi
C4H4O42−2.520.99 [55]−2
H+0.01 [56]11.81 [55]+1
Na+1.02 [56]1.33 [57]+1
OH1.33 [58]6.70 [55]−1
Mg2+0.72 [58]0.71 [59]+2
CO32-1.78 [58]0.96 [59]−2