Article

Pore Network Simulation of Gas-Liquid Distribution in Porous Transport Layers

1
Institute of Process Engineering, Otto von Guericke University Magdeburg, 39106 Magdeburg, Germany
2
Max-Planck-Institute for Dynamics of Complex Technical Systems Magdeburg, 39106 Magdeburg, Germany
*
Author to whom correspondence should be addressed.
Processes 2019, 7(9), 558; https://doi.org/10.3390/pr7090558
Submission received: 13 July 2019 / Revised: 16 August 2019 / Accepted: 20 August 2019 / Published: 23 August 2019
(This article belongs to the Special Issue Electrolysis Processes)

Abstract

:
Pore network models are powerful tools to simulate invasion and transport processes in porous media. They are widely applied in the field of geology and the drying of porous media, and have recently also received attention in fuel cell applications. Here we want to describe and discuss how pore network models can be used as a prescriptive tool for future water electrolysis technologies. In detail, we suggest in a first approach a pore network model of drainage for the prediction of the oxygen and water invasion process inside the anodic porous transport layer at high current densities. We neglect wetting liquid films and show that, in this situation, numerous isolated liquid clusters develop when oxygen invades the pore network. In the simulation with narrow pore size distribution, the volumetric ratio of the liquid transporting clusters connected between the catalyst layer and the water supply channel is only around 3% of the total liquid volume contained inside the pore network at the moment when the water supply route through the pore network is interrupted; whereas around 40% of the volume is occupied by the continuous gas phase. The majority of liquid clusters are disconnected from the water supply routes through the pore network if liquid films along the walls of the porous transport layer are disregarded. Moreover, these clusters hinder the countercurrent oxygen transport. A higher ratio of liquid transporting clusters was obtained for greater pore size distribution. Based on the results of pore network drainage simulations, we sketch a new route for the extraction of transport parameters from Monte Carlo simulations, incorporating pore scale flow computations and Darcy flow.

1. Introduction

Pore network models (PNMs) are discrete mathematical models that are basically used to simulate and predict pore scale processes. Different types of PNMs are generally distinguished. These are (i) PNMs for quasi-static drainage invasion processes [1,2,3,4], (ii) PNMs for quasi-static imbibition invasion processes [1,3,4,5], (iii) PNMs of drainage with phase transition and diffusion of the vapor (especially applied in drying research) [6,7,8], and (iv) PNMs for the computation of dynamic pore scale fluid flow [9,10,11,12,13]. While the first three approaches usually assume quasi-static invasion of the pore space, the fourth approach considers viscous flow of the liquid phase and dynamic invasion of the pore space. There are several examples that combine (i) and (ii) [3,4,14]. There also exists a number of PNMs that additionally incorporate pore scale mechanisms, such as liquid film flow [15,16,17] or crystallization [18,19,20]. Only a few models are available that take into account coupled heat and mass transfer [21,22] or that at least consider the invasion and transport processes under non-isothermal conditions [23,24,25].
A wide range of PNM applications related to fuel cells is already available in literature, e.g., [26,27,28,29,30,31,32,33]. Major focus of the PN studies related to fuel cells is essentially on liquid water distribution in dependence of the pore structure [28], liquid clustering [29], the thickness of the gas diffusion layer [30], hydrophobicity [27], local variation of wetting properties, condensation-induced liquid water formation inside the pore structure [31,33], ice formation, model validation by X-ray tomography [32], and neutron tomography [34,35].
So far, PNMs are only rarely applied in water electrolysis research. Experimental studies incorporating microfluidic platforms of pore networks (PNs) are presented by Bazylak et al. [36,37,38,39]. Their investigations are based on the correlation of the oxygen flow rate with current density. The microfluidic platforms employed in their studies are based on the geometric information obtained from micro tomography measurements of different titanium porous transport layers (PTLs). They showed that the developing gas bubbles penetrate the porous structure of the model PTLs and form continuous fractal gas branches that cover the PN at the breakthrough point. The network covering gas fingers at the breakthrough point are assumed as stable as long as the volume flow rates correlating with the current density are constant (In [38,39], the air flow rates were 1, 5, and 10 µL min−1 with current densities of 1.4, 7.0, and 14 A cm−2, and the liquid flow rates were 5 and 10 µL min−1. The same liquid flow rates and air flow rate of 1 µL min−1 were applied in the numerical simulations in [37]. In [36], higher liquid flow rates of 505 µL min−1 and gas flow rates of 10 to 300 µL min−1 were applied.) It was illustrated that the shape of the penetrating gas fingers and the final saturation of the microfluidic PN with oxygen are dictated by the pore structure when the invasion occurs in a capillary regime. Higher gas saturation values were obtained for lower porosity of the PN and smaller pore and throat sizes (sintered PTL in [39]). However, an explanation for this outcome is not given in the paper. Additionally, only 2-dimensional (2D) microfluidic experiments are presented; as will be discussed in this paper, the relationship between pore size distribution and saturation is different in 3-dimensional (3D) PNs where essentially the interconnectivity of the pore space is higher. However, it is surmised from PN modeling that the pore size distribution (PSD), especially the standard deviation of pore and throat sizes, were different in the three cases studied in [39] (felt, sintered, and foam PTL). The presence of large and small pores results in the competitive invasion of the PTL. This can especially be illustrated for strongly heterogeneous pore structures, e.g., bimodal PSD, [40]. Principally, the invasion process follows the path of least resistance. In the hydrophilic micromodels used in experiments in [39], this is the path that follows the lowest invasion pressure thresholds of the neighboring pores; it is thus the route of the largest neighbor pores. In more detail, invasion of the PTL at constant current densities is a process of quasi-static drainage of water. This process occurs in distinct steps. This is designated as the mechanism ‘one throat at a time’ in [36] and can be simulated with PNMs. To invade any liquid filled pore or throat with water, the pressure inside the gas phase has to overcome a critical invasion pressure threshold that depends on the curvature of the gas-liquid interface. If the pore and throat sizes are distinct, the invasion events occur at distinct pressures. According to this, the pressure curve follows a trend of alternating pressure increase (to achieve the critical invasion pressure thresholds), during which the saturation of the microfluidic network remains constant, and the pressure drops during the sudden invasion (saturation decrease) when the critical invasion pressure is achieved [41]. In [36], it is also shown that the invasion of the PN can continue after the breakthrough of one gas branch if the oxygen flow rate, and thus the gas pressures are increased accordingly.
In this paper we focus on water electrolysis cells with in the sandwich coordinate countercurrent flow of water and oxygen (perpendicular to the catalyst layer and the proton exchange membrane) [42]. Additionally, we consider the situation of high oxygen production rates (current density = 0.6–6 A/cm2 [43]; oxygen flux < 4 µL s−1 mm−2). Based on this, we assume plug flow of oxygen and water. In the first approach presented in this paper, we use pore network Monte Carlo simulations (PNMCSs) for the prediction of the invasion of an initially fully water saturated PN with oxygen. We furthermore assume that a stationary distribution of oxygen and water inside the PTL is achieved when the oxygen flow paths connect the catalyst layer, where the oxygen is produced, with the water supply channel, while the water connectivity between both sides is maintained, presuming constant oxygen production rates and constant pressure and temperature along the PTL. As a result of the PNMCSs, we show and discuss the invasion patterns in the moment when the water supply route is disconnected, as well as the impact of isolated single liquid clusters on the relative permeability of oxygen and water. Following parameter estimation concepts, e.g., in drainage of soils [1] or drying [44,45], we propose to estimate relative permeability from the stationary final gas-liquid distribution obtained from the PN drainage simulation.

2. Pore Network Model

A schematic sketch of the PNM is given in Figure 1. Here we consider idealized 3D PNs with PSDs in the range of typical PTLs usually applied for water electrolysis (Figure 2). The application of idealized lattice structures is commonly practiced if the physical mechanisms and pore scale effects are analyzed. More advanced studies base the PN simulations on the real structure of the porous medium (e.g., [36,46]). This is also foreseen in our studies in the next step. However, in this paper we present and discuss the basics of the method and the basic outcomes of the drainage simulation and thus disregard the more expensive (concerning time and computational effort) method.
As can be seen in Figure 1a, the PN consists of circular pores, i.e., the sites and cylindrical throats, i.e., the bonds. Both pores and throats can in principal be occupied by either liquid water or gaseous oxygen. The liquid occupied pores are shown in black in Figure 1a; the gas occupied pores are shown in red. Similarly, the liquid occupied throats are shown in blue and the empty throats are shown in red. The pores at the bottom side of the network can be interpreted as water sources as they represent the connection links to the water supply channel. All of these pores are initially saturated with water (black pores in Figure 1). In contrast, pores at the top side of the PN are connected to the oxygen sources inside the catalyst layer at the anode side of the water electrolysis cell and directly supplied with gaseous oxygen (red pores in Figure 1). The water supply route from the water supply channel connected to the bottom of the PN towards the catalyst layer (at the top side) is given by the interconnected blue throats, while the red pores and throats provide distinct routes for the gas phase. Figure 1b shows the path of oxygen through the PN. As can be seen, the oxygen path covers the PN from the catalyst side to the water supply channel in this example. This situation is called a breakthrough. The breakthrough of the gas phase is achieved when one of the bottom pores is occupied with oxygen. On the other hand, the water supply is interrupted once the blue cluster is either completely split up into numerous smaller single clusters or disconnected from either side.
The geometric arrangement of pores and throats and the neighbor relations are specified by the different matrices pnp, tnt, tnp, and pnt. Following the example in Figure 1a, the neighbor relations of the 3D PN as illustrated here are:
pnp ( pore 10 ) = [ 1 11 12 13 16 19 ]
tnp ( throat 1 ) = [ 10 11 ]
pnt ( pore 10 ) = [ 1 3 28 34 55 64 ]
tnt ( throat 1 ) = [ 2 3 28 29 34 35 55 56 64 65 ]
From this, it follows that the coordination number of the PN is 6. Note that we apply periodic boundary conditions. This means that the pores at all lateral sides are connected to each other in order to reduce confinement effects. While the radius distribution of the throats and pores stochastically vary in the PNMCSs, the other geometrical parameter, such as throat length and the neighbor relations, are kept constant (Table 1). The PSDs of pores and throats in the PN simulations presented below are illustrated in Figure 2.
We assume that the oxygen is homogeneously distributed along the surface of the PN and neglect spatial and temporal pressure fluctuations. Instead, we assume a constant oxygen supply rate. Based on this, we anticipate plug flow of oxygen and water and compute the invasion of the PN based on the Young–Laplace equation, following the concepts in [8,47,48]:
P l , t , p = P 2 σ cos θ r t , p
The order of invasion thus follows the radius distribution of the throats (with index t) and pores (with index p). Viscous flow is disregarded for the drainage invasion computation. The liquid clusters are labeled based on the throat saturation, taking into account the saturation in neighboring pores. This means that any neighbor throats that contain water belong to the same liquid cluster if the pore between them is also saturated with water (Figure 1). The gas phase is not labeled as it is continuous. Note that liquid clusters that are disconnected from the cluster spanning the PTL from the catalyst side to the water channel side (all blue throats in Figure 1a) are not further invaded. These clusters remain in their original size and can be regarded as transport barriers for oxygen flow (Figure 3). In regard to an efficient PTL mass transfer, it would be affordable to avoid clustering of the liquid phase; relevant issues are also intensively studied e.g., in hydrodynamics of porous geological structures and soils [49]. However, in regard to the optimization of the PTL, several aspects interact with each other, including mass transfer, heat transfer, and electrical conductivity [50].
The PNMCSs presented here are restricted to the computation of the point when the fragmented clusters are not further invaded. In most cases, the fragmented clusters do not span the network as they are either connected to only one of its open sides (top or bottom) or isolated in the center of the PN. The simulation can result in several gas branches penetrating the network from top to bottom. (Note that the gas phase always forms a continuum). This is in good agreement with experimental findings reported in [36].
The computation of the quasi-static invasion profile does not incorporate the solution of mass transfer equations because invasion percolation with trapping is assumed here. Instead, the pore scale fluid transport equations are set-up and solved in the second step based on the stationary invasion patterns from step 1 (Figure 4). For the computation in step 2, the breakthrough invasion patterns, i.e., at disconnection of water transport routes, are used [29,30,37,38,39]. Only the liquid cluster spanning the PN from top to bottom in the moment before disconnection and the continuous gas phase are considered. The mass transfer through the spanning clusters and the gas phase is computed pore-to-pore, based on the Hagen–Poiseuille equation:
M ˙ l , g = ρ l , g π r t 4 8 η l , g L ( P l , g , 1 P l , g , 2 ) ,
for the liquid phase l and the gas phase g. Incompressible, Newtonian viscous flow is assumed (the compression factor of oxygen at operation conditions of P = 10 bar and T = 50 °C is roughly 1). Note that the assumption of the Hagen–Poiseuille flow is a strong model simplification for the pore flow because L d. A more advanced approach would account for the radial velocity of the flow [51]. In Equation (6), Pl,1 and Pg,1 are the liquid and vapor pressures in neighbor pore 1 of a throat (compare with Equation (2)) and Pl,2 and Pg,2 are the liquid and vapor pressures in neighbor pore 2 of that throat, respectively. The resulting set of linear equations is then transferred into the matrix notation:
P l , g = A l , g ( g l , g ) \ b l , g
In these equations, Al and Ag represent the matrices of liquid and vapor conductivities of the throats (e.g., refer to [52] for further details), with
g l , g = ρ l , g π r t 4 8 η l , g L .
Following discussions in [36], conductivities inside pores are not computed as the pores are not interpreted as hydraulic conductors. Validation of this assumption could be further studied by Lattice–Boltzmann simulation, e.g., [53,54].
The boundary conditions for each throat are given in bl and bg, which are specified for the pore neighbors 1 and 2 of a throat. Generally:
b l , g = g l , g P l , g
The boundary conditions for the PN simulation are P1 at the bottom side of the PN and P2 at the top side (Figure 4). Solving Equation (7) yields the vapor and liquid pressure fields in the PN. With this, Equation (6) can be solved for each throat. Once the liquid and vapor flow rates through the liquid throats in spanning liquid clusters and the gas throats are known, the overall mass flow rates are computed in step 3 (Figure 4c). From this follows the relative permeability for either the liquid (l) or gas phase (g):
K k l , g = η l , g ρ l , g M ˙ l , g A Δ z Δ P l , g .
The absolute permeability K is obtained for the same computations but a totally empty (gas permeability) or totally saturated (liquid permeability) network.
Note that high pressures up to P = 30 bar are postulated as usual operating conditions of water electrolysis cells. It is remarked that the evaporation of water, even at prevailing temperature of 50–80 °C, can be disregarded at such high pressures. Additionally, in the simulations presented here, we generally assumed hydrophilic conditions with cos θ = 1 and constant temperature and pressure as well.

3. PN Simulations and Results

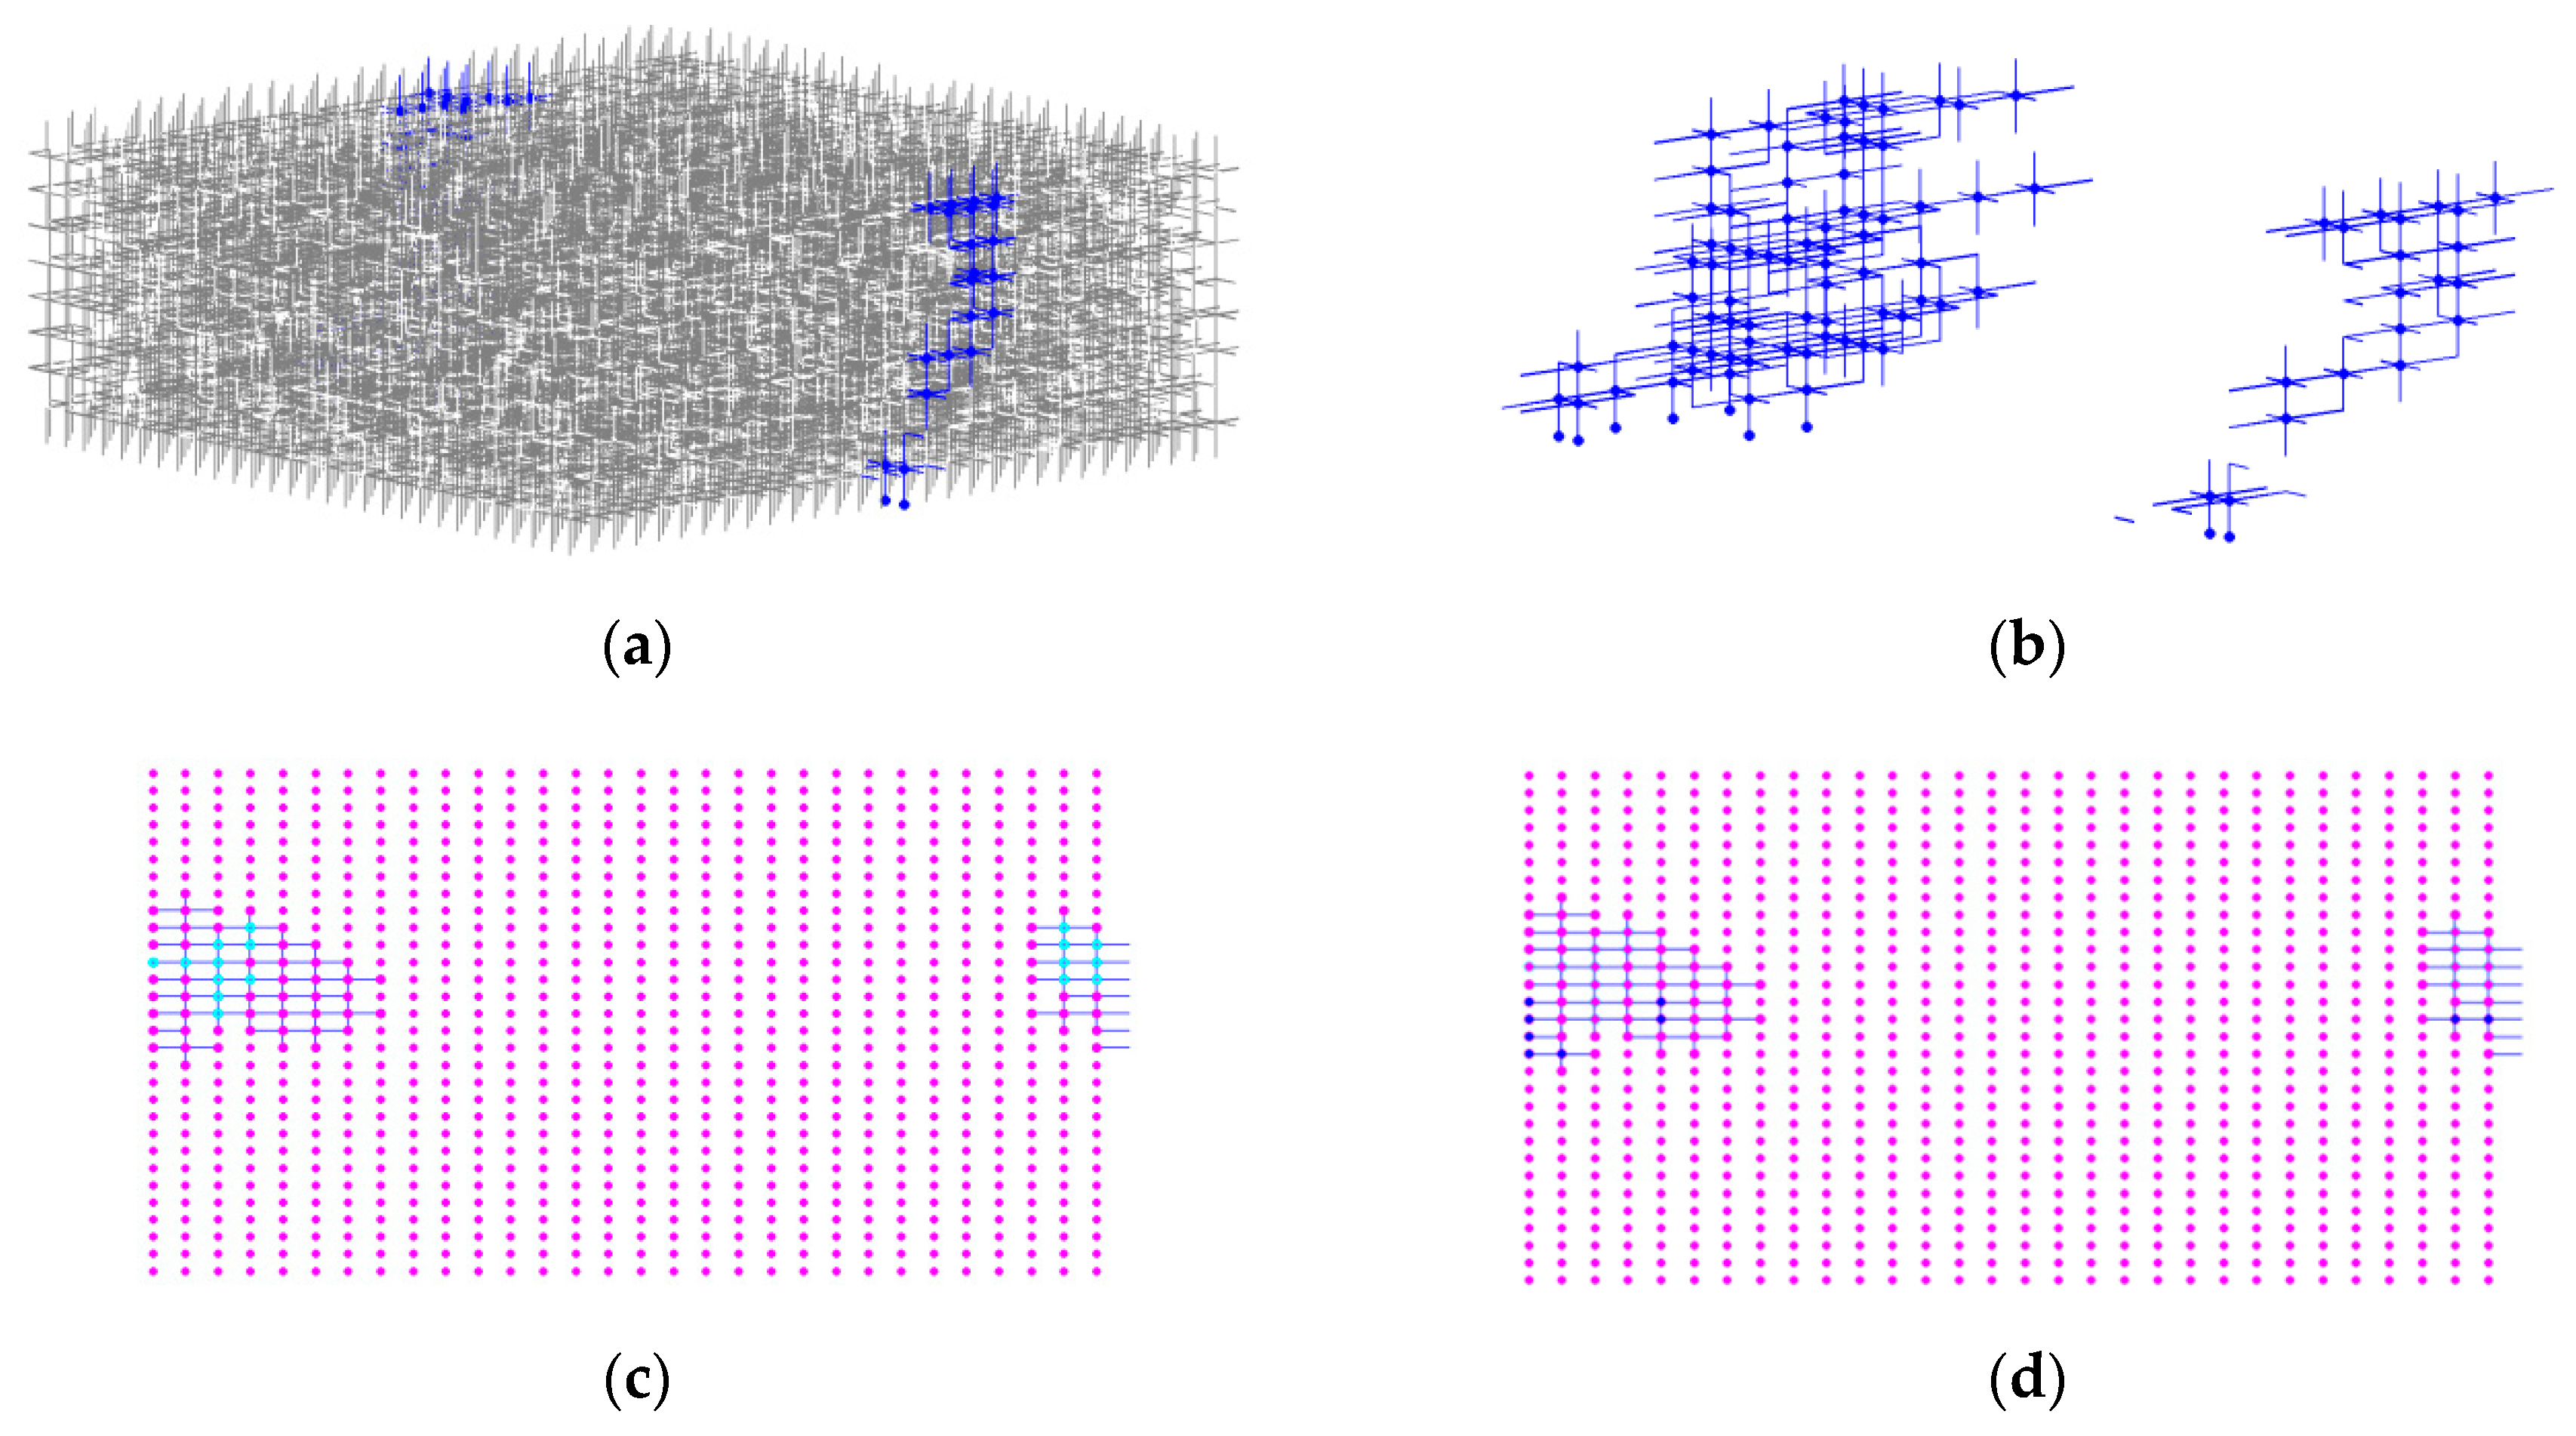
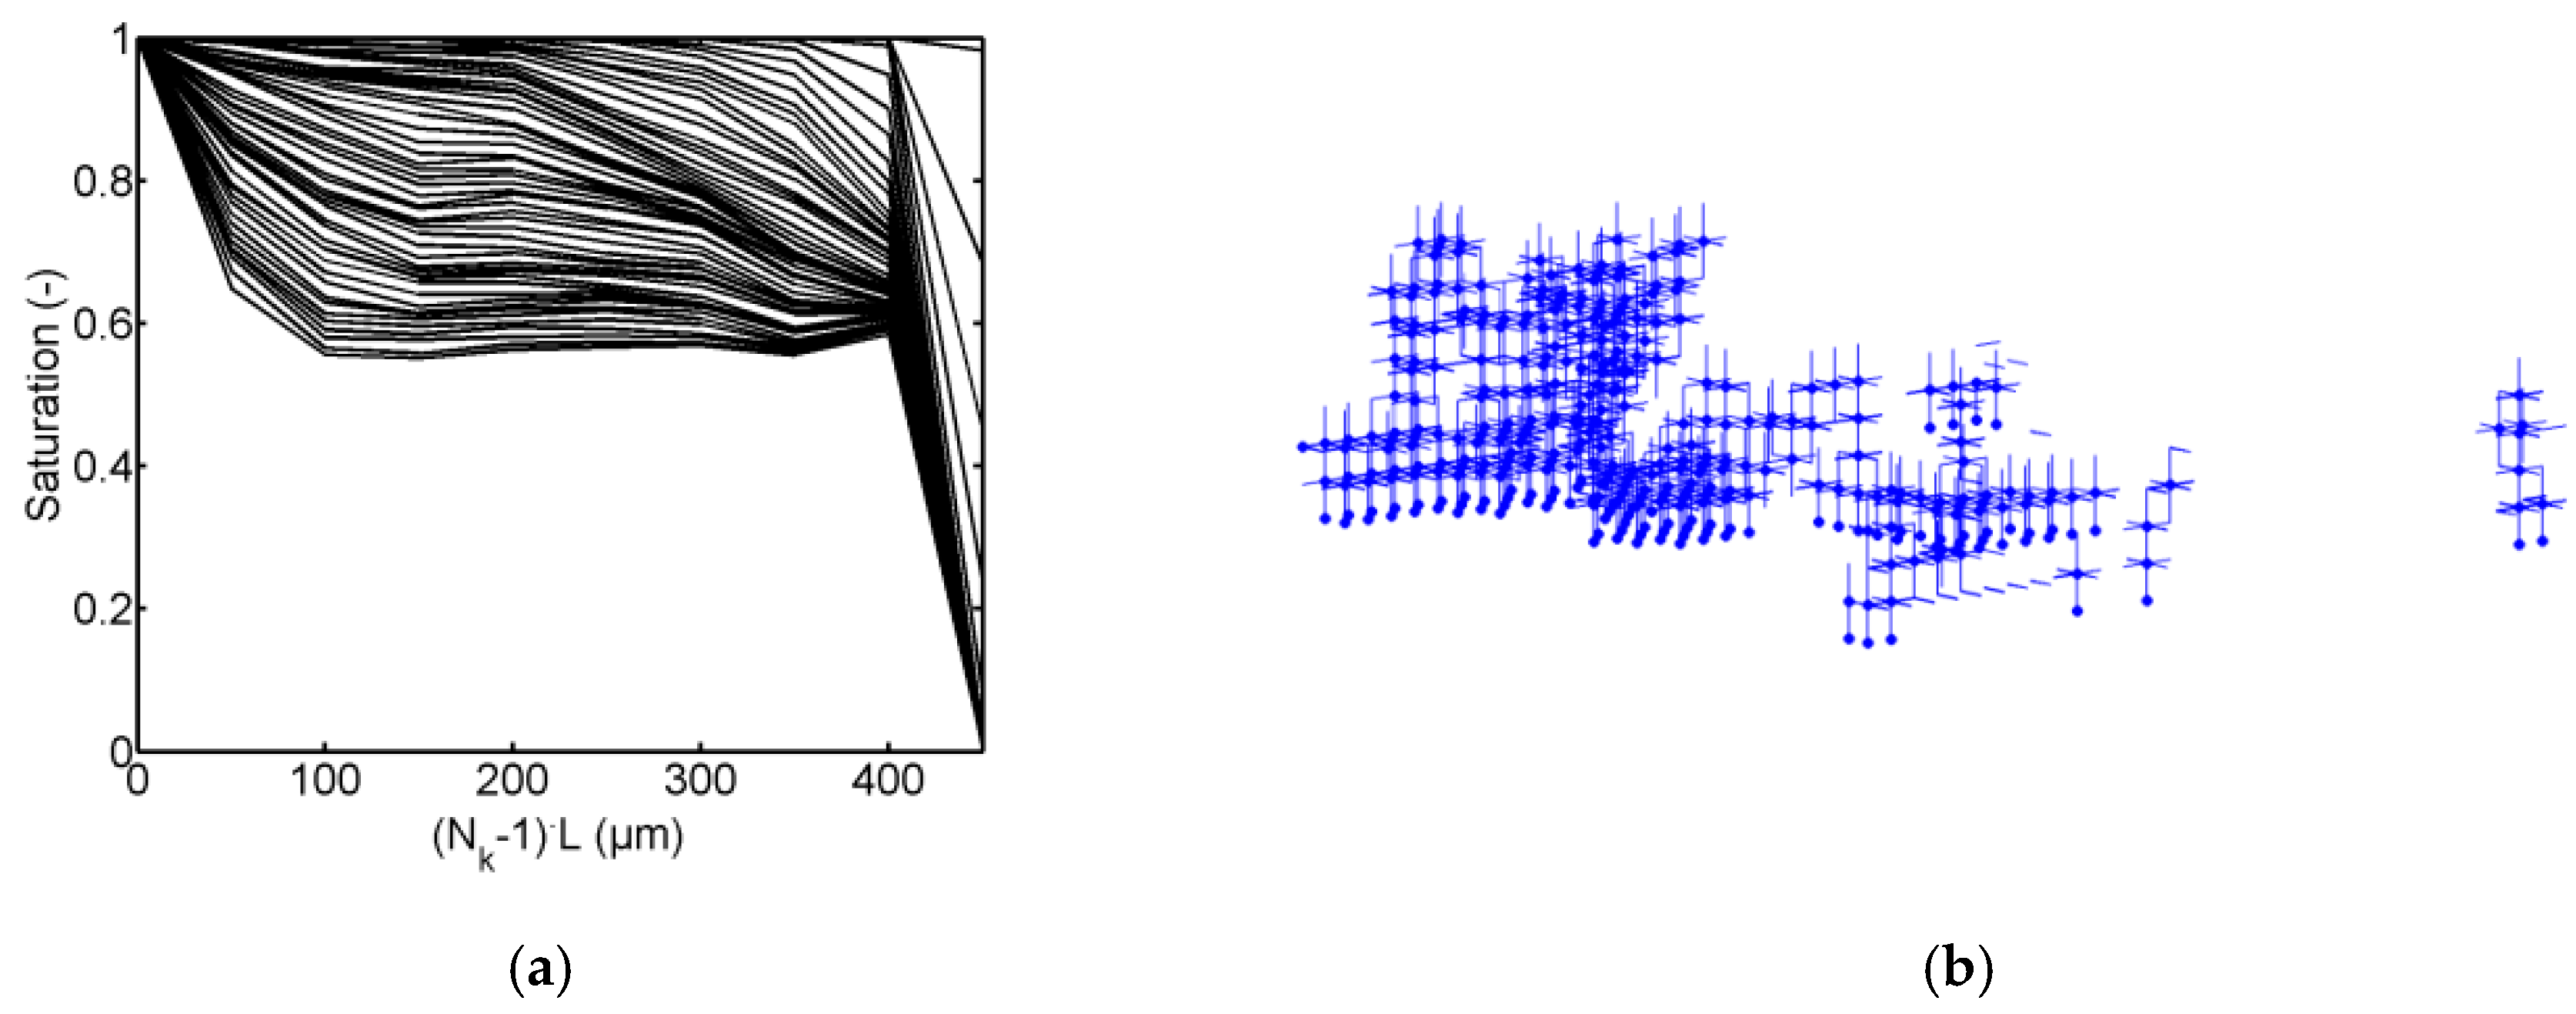
3.1. 3D PNMCS of Drainage

We present here the simulation of one realization of a 3D PN with square lattice and 30 × 30 × 10 pores (Figure 5). The simulation parameters are summarized in Table 1. The overall pressure, as well as the temperature, were kept constant. The lattice spacing between the pores was L = 50 µm and the throat length was kept constant with Lt = 27 µm. The pore and throat sizes varied in the range given in Figure 2, with standard deviations 0.5 µm and 1 µm. The simulations were repeated 20 times with randomly distributed pore and throat radii within the range given in Figure 2.
According to [55] or [36,46], porosity of the PTL usually varies between 54% and 85%, depending on the kind of the material. Usually, sintered powder has a lower porosity than felt PTLs or foam PTLs. However, the porosity in our simulations was only around 21%. Larger porosities would only be achieved in our PN with greater variation of the pore and throat sizes (i.e., by higher standard deviation) and much shorter throat lengths. To reach the high porosities given in the literature, overlapping of the pore volumes and negligible throat length would have been necessary. This would lead to different invasion effects than currently underlying in the proposed PNM, namely site invasion instead of bond invasion and different flow regimes than those postulated above. (Exemplarily, the porosity could be increased to 43% for throat lengths of 7 µm. Lt < rt would then require a revision for the assumption of a developed Poiseuille flow inside the throats). Instead, we expect to achieve higher porosities in PNs based on the real porous structure, with various heterogeneities of the pore space (see discussions in Section 4 below). Additionally, due to the relatively long throat length applied in our PN, the thickness is greater than the given values in literature [36,55] where the 10 pore rows correspond to a thickness between 170 µm and 300 µm. Independent of this, the PN simulations presented below nicely illustrate the invasion mechanisms that drive the drainage process. The presented method can be easily adapted to the simulation of the real porous structure.
In these simulations, pores were invaded independently of their throat neighbors. Note that the drainage process is principally a bond invasion process wherefore pores could be invaded together with the throat neighbors [4]. This is also revealed by the experiments presented in [36]. However, as shown in Figure 2 and also represented in Figure 6, the pores are comparably large in our PN with invasion pressure thresholds in the range of the throats. The curves of pore and throat capillary pressures partly overlap and thus indicate the competitive invasion. Apart from that, the invasion pressure thresholds vary linearly with the size of pores and throats if all other parameter are kept constant (Equation (5), Table 1). Figure 6 indicates that the capillary pressures are rather small in the given range of pore sizes, which results in the decrease of liquid pressure (against the gas pressure) of only a few millibars and thus a concave gas-liquid interface.
The simulation results of one PN simulation (with standard deviation 0.5 µm, Figure 2) are summarized below and in Figure 7, Figure 8 and Figure 9. At first, the capillary pressure curves of the PN simulation are shown in Figure 7. In the hydrophilic drainage process studied here, the available meniscus pore or throat with the lowest capillary pressure is first invaded. Since all surface pores are available with liquid menisci at the start of the simulation, the blue curve initially follows the radius distribution of the surface pores. Once all surface pores are invaded, the capillary curve passes into the trend of the throats, whereas the pore invasion becomes random depending on the distribution of the available meniscus pores. Note that more and more pores become available for invasion when the drainage front widens. However, the blue cloud only represents the pores in liquid clusters spanning the PN, since all other clusters are stationary and not invaded. This holds for the throats analogously. The black curve follows the invasion of the largest throats in the spanning clusters, while the randomly distributed points below the curve correspond again to the PSD of throats in the PN.
Figure 8 summarizes the gas-liquid distributions of the PN simulation. At first, the situation a few moments before loss of the liquid connectivity between the vertical throats in the top and bottom row is illustrated in Figure 8a. As can be seen, the liquid phase is multiply disconnected and penetrated by gas branches (in white). The gas phase forms a fractal structure that moves downwards towards the water supply channel. The invasion of the gas phase leads to the formation of isolated liquid clusters that remain behind the front. The size of these clusters is stable as they are not further invaded. It is remarked that the invasion process occurs in all three dimensions in the homogeneous pore structure underlying this simulation (isotropic invasion). This is explained with the equal distribution of liquid pressure (associated with PSDs) throughout the PN, constant wettability, temperature, and pressure conditions. However, it is noted that the horizontal breakthrough occurs much earlier than the vertical breakthrough. This is explained with the oxygen accessibility of the surface pores. In detail, all of the surface pores are initially connected to one liquid-filled throat (downwards) and the gas bulk phase (upwards). Essentially, based on the invasion percolation algorithm and due to the fact that the peak of the PSD of pores is shifted towards larger radii, all pores empty initially before any throat is invaded. This results in the formation of an oxygen front that spans the PN horizontally (the size is roughly NixNj) (Figure 8c,d). According to this, the liquid connectivity between the boundary pores at the top side and the bottom side is already lost at the start of the process. A different situation would be expected if the surface pores were smaller and the invasion pressure were higher.
At the moment when the liquid supply route is interrupted (or shortly before that moment), the overall saturation with liquid is S = 0.5996. However, as shown in Figure 8, there exists only one liquid transporting cluster (main cluster). The other liquid-filled throats are shown in grey and are either single throats or part of isolated clusters. The number of clusters at the interruption of liquid connectivity between the surface throats (first and last row of vertical throats) is 933. The maximum cluster size is 624 throats; this is the blue cluster in Figure 8a,b. The mean size of the other clusters is 9.5 throats, thus approximately two orders of magnitude smaller. The liquid transporting cluster contains approximately 5.7417 × 10⁻³ µL of water. Its volume referred to the total liquid volume contained in the PN at the interruption of the liquid path is only 3%. This reveals the relevance of the pore scale information about the liquid connectivity for the calculation of the liquid permeability. A different situation is expected in presence of wetting liquid films, as will be discussed below. It is also noted that higher permeabilities would be obtained if the drainage simulation would be interrupted already at a higher overall saturation. However, in the simulation presented in Figure 7, Figure 8 and Figure 9, a breakthrough of the gas phase occurred shortly before disconnection of the main cluster from the top side.
Furthermore, the saturation of the exchange interfaces plays a vital role. The surface and bottom saturations are highlighted in Figure 8c,d. Note that the light blue pores at the top side are already empty. These pores are connected to liquid-filled vertical throats right below the surface. The bottom pores shown in blue are liquid filled. The red pores in these images are either empty (filled with oxygen) or belong to isolated clusters. The ratio of the wetted surface (taking into account the vertical throats inside the first and last layer of the PN) is around 2% at the top surface and around 1% at the bottom side, thus very low. This results in low liquid permeabilities, as will be shown below.
From the distributions shown in Figure 8, the overall liquid saturation S l of the pore network can be calculated from:
S l = N t = 1 22500 V t S t + N p = 1 9000 V p S p V t + V p ,
with pore and throat saturation Sp and St. The overall gas saturation S g is:
S g = 1 S l ,
accordingly. The liquid and gas saturations are calculated for each network slice (Nk = 1:10) and illustrated as a function of the vertical position ((Nk − 1)⋅L, see Figure 1) in Figure 9a,b. Figure 9a,b shows the transient saturation profiles of one PN simulation. It reveals that the PN is basically invaded by oxygen from the top side. If one disregards the top and bottom surface layers of the PN (as they have a different overall volume, Figure 1), the saturation of liquid is evenly distributed. This means that isolated liquid clusters homogeneously cover the PN. The liquid confined in the liquid transporting main cluster spanning the PN is illustrated in Figure 9c. The liquid saturation of the main cluster is calculated analog to Equation (11) by only taking into account the liquid inside it. Two different options are compared with the liquid saturation profiles in Figure 9c. These are option 1:
S M C , V t o t = N t ( N k ) V t S t , M C + N p ( N k ) V p S p , M C N t ( N k ) V t + N p ( N k ) V p ,
saturation on the base of the total void volume contained in slice Nk; and option 2:
S M C , V l = N t ( N k ) V t S t , M C + N t ( N k ) V p S p , M C N t ( N k ) V t S t + N p ( N k ) V p S p ,
saturation on the base of the total liquid volume contained in that slice. Note that only the profiles for S = 1 till S = 0.62 are shown here, because the main cluster splits into two clusters at S = 0.62. The agreement of the curves in Figure 9a,c is good at the start of drainage (when the overall saturation S is high), indicating that initially nearly all the liquid is contained in one cluster. At later stages of the invasion process, a gradient develops. Comparison of the blue and black lines in Figure 9c with the red curves reveals that the center of the volume of the main cluster is located at the bottom side of the PN, thus closer to the water supply channel, whereas connectivity to the top side is lost already at the very beginning of the drainage (when all surface pores are invaded). The difference between the black curves and the red curves is related to the liquid volume contained in single clusters. As can be seen, more single clusters are found inside the upper region of the pore network (i.e., at higher values of (Nk − 1)⋅L). This reveals that the main cluster is traveling through the PN, leaving the isolated clusters behind its front. From this it can be expected that the relative permeability of the liquid phase continuously decreases with progress of invasion, while the oxygen permeability is 0 as long as the breakthrough of the gas phase is not observed (Section 3.2). This outcome might be an indicator for the relevance of the thickness of the PTL for water exchange processes in water electrolysis cells [56]. According to this, thinner PTLs might be more convenient in terms of the water supply routes. However, further simulations are necessary to proof the consistency of this assumption. This finding is essentially an explanation for the low permeability of the liquid phase, as discussed below.
It is remarked that different simulation results are obtained for a higher standard deviation (1 µm) (Figure 10). The liquid saturation is still homogeneously distributed throughout the network, but the level of the final slice saturation is lower, namely S = 0.575 (in Figure 9 S = 0.6). Moreover, the main liquid cluster is larger and appears more dense. It contains 8% of the total liquid volume. This reflects the importance of studying the impact of the PSD rather than the impact of porosity, which is around 21% in both PNs [57].
Consistency of these results is proven by each 20 repetitions of the PN simulation (PNMCS). The results are illustrated in Figure 11, which shows the steady state saturation profiles at the moment of interruption of liquid transport. It is highlighted that the average saturation in the center of the PN is slightly higher in the network with lower standard deviation. This means that more liquid is contained in isolated clusters in this case, as previously observed.
Similar simulation results are obtained if the PN surface is invaded at only one sight. In the simulation shown in Figure 12, the one open pore at the surface is highlighted in light blue. Note that the PN is identical to the one shown in Figure 7, Figure 8 and Figure 9. The invasion follows a similar route as before and the main cluster spanning the PN at breakthrough is almost identical. The saturation profiles in Figure 12 are obviously different because the surface pore row basically remains saturated. However, the average saturation in the center of the PN is again 0.6 at the end of the process. Isotropy of the invasion process can be shown for such a situation, i.e., when only one pore in the center of the surface area is accessible for oxygen (Figure 13).
Figure 13a plots the label of that in the invasion event invaded vertical (Nk-direction) or horizontal (Ni and Nj-direction) throat (also refer to Figure 1). The three clouds at the start of the process indicate that throats are invaded in each direction (red circles). The breakthrough point is achieved when the throat with the lowest label in each horde is invaded. This is highlighted in Figure 13a. The plot furthermore reveals that, afterwards, horizontal and vertical throats are equally invaded. Figure 13b shows the invasion velocity:
d I d I t o t = N v e r , h o r N t o t ,
i.e., the number of invasions in the horizontal and vertical throats (Nhor and Nver, respectively) I’ related to the total number of invasions (pores and throats) Itot. According to Figure 13b, more vertical throats are initially invaded, whereas, at later stages of the drainage process, the invasion occurs more often in horizontal throats. This is explained with the PN geometry in Figure 5. It is the main reason for the clustering effect discussed above. In order to prevent the clustering effect, it would be more convenient if the invasion process was anisotropic and occurred mainly in vertical throats. Taking the invasion pressure curve in Figure 6 as a reference, this could be achieved by a gradient in throat sizes (small at the top side, large at the bottom side).
It is highlighted that a different invasion behavior would occur if also temperature, pressure, or wettability would spatially vary along the vertical or the horizontal direction. Depending on the situation, anisotropic invasion can also be expected. We plan to illustrate such situations in a forthcoming paper.

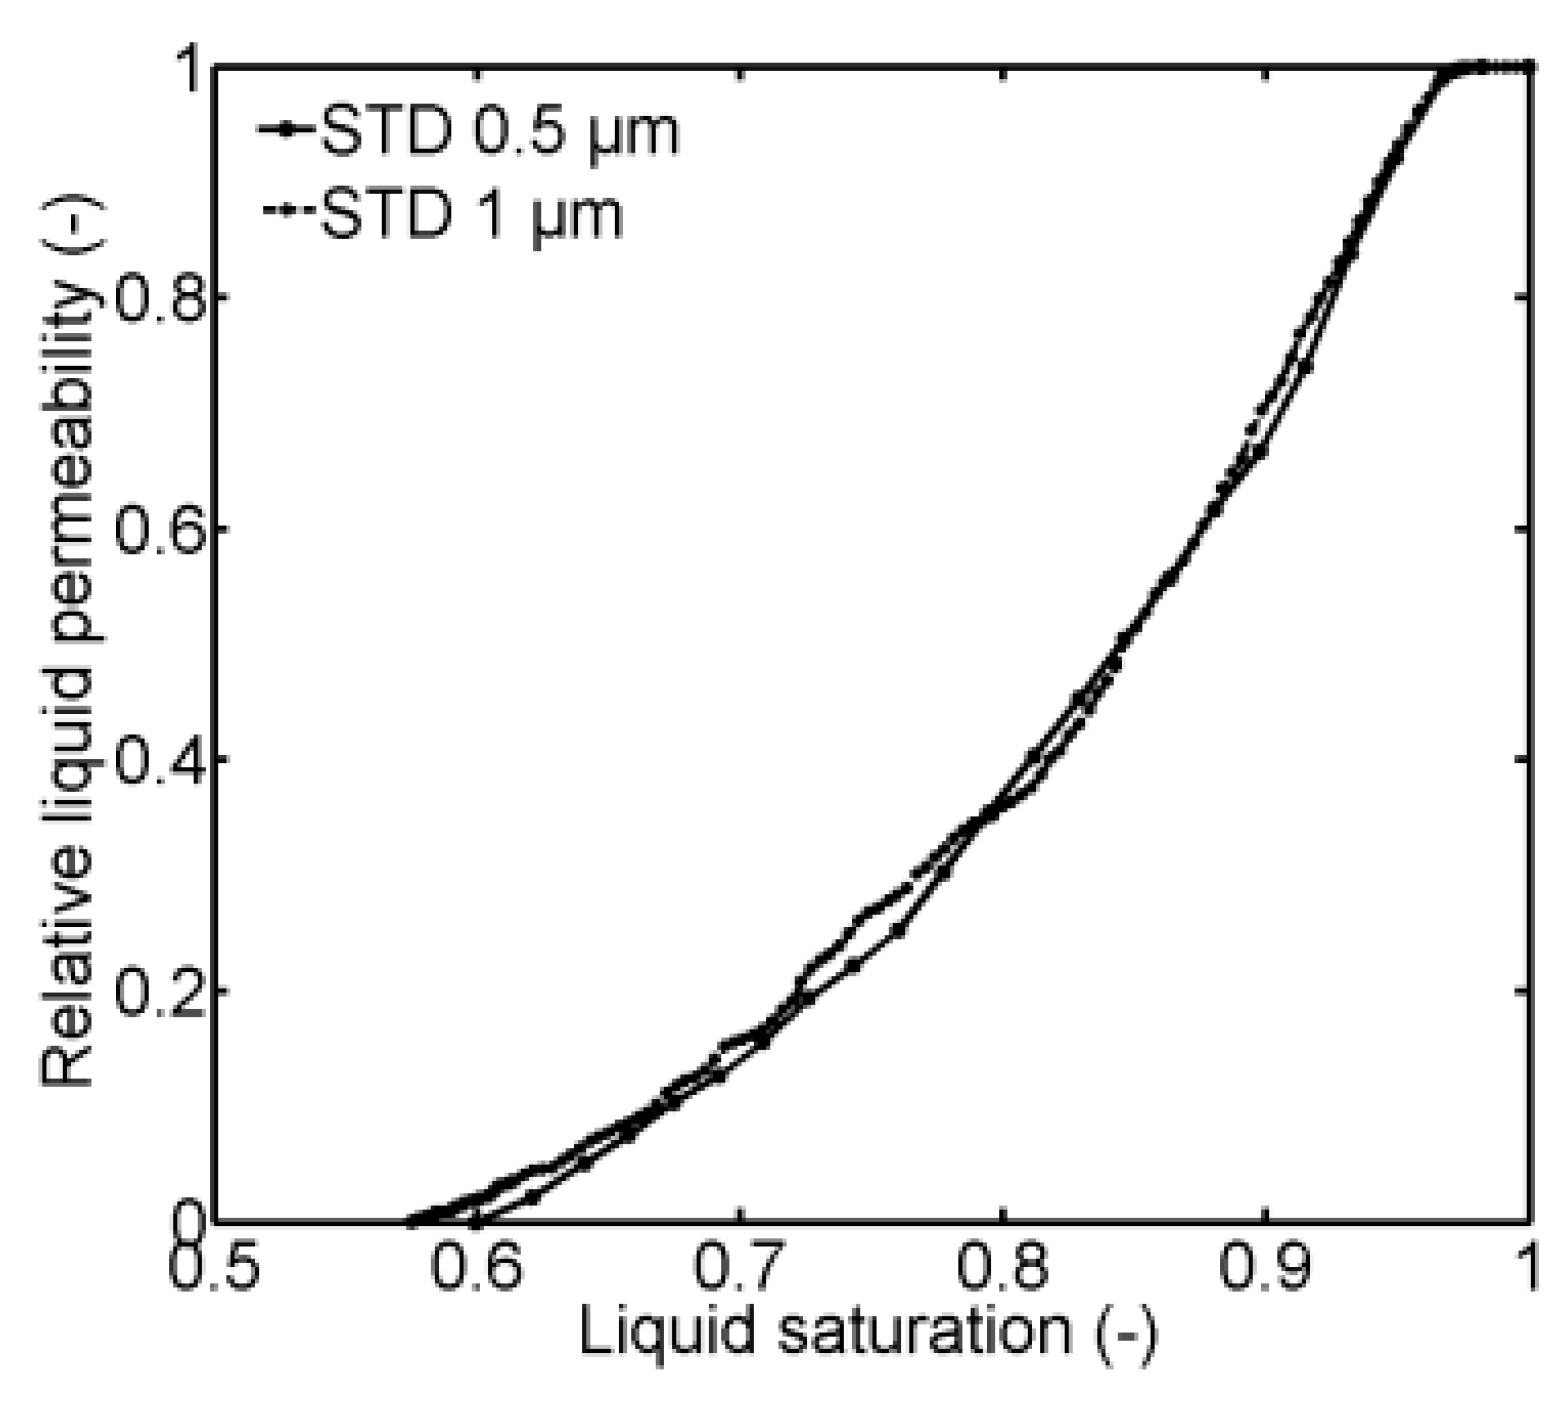
3.2. Estimation of Relative Permeabilities

The final gas-liquid phase distribution of the PN drainage simulation is employed for the calculation of gas and liquid permeability. Note that due to the trapping of clusters, the relative permeabilities of the liquid and gas phases cannot be related to each other (kl 1 − kg).
For calculation of the absolute and relative permeabilities, we have considered the liquid flow through pores in Nk = 2 and Nk = 9 (Figure 1 and Figure 5) because all surface pores are initially invaded. The pressure gradient is imposed between the pores in these rows. The relative permeability of the liquid phase is related to the total surface area, although only 1–2% of the interfaces are wetted by the liquid spanning cluster. For the PN simulation presented in Figure 7, Figure 8 and Figure 9, we found an absolute permeability of K = 1.9639 × 10⁻¹² m2 (liquid phase) and K = 6.5612 × 10⁻¹² m2 (gas phase) (in [50], similar values are obtained for a porosity of 50%). The relative permeabilities are kl = 7.8439 × 10⁻⁴ for the liquid phase and kg = 0.0068 for the gas phase. The relatively low oxygen permeability is associated to the hindrance by isolated liquid clusters. Higher liquid permeabilities are obtained if the calculations are repeated for higher liquid saturations of the PN, i.e., if the PN is not fully drained (Figure 14). (Note that the gas phase is not penetrating the PN for liquid saturations shown in Figure 14). These values are in good agreement with previous results in [45] and they clearly illustrate the different relative permeabilities of 2D and 3D PNs, which are related to the higher connectivity of the 3D PN and the associated clustering effect. This situation can change if wetting liquid films are considered in the PNM [57]; however, their development and extension depend on the wettability of the surface, temperature, pressure, and process conditions. (In [57] it is mentioned that the wettability alteration of titanium PTLs occurs due to the oxidation of its surface.) Additionally, a heterogeneous pore structure with interpenetrating large and small pores can lead to higher relative permeabilities if the breakthrough occurs in the large pores, whereas the small pores remain saturated and provide the pathway for water transport. The relative permeabilities are thus a function of PSD [57]. The absolute permeability depends on the ratio of pore space to solid, i.e., on the porosity (e.g., [1,50]). However, according to Equation (10), higher absolute permeability does not necessarily increase relative permeabilities.

3.3. Oxygen Production Rate

The decomposition of water occurs if a voltage higher than the thermoneutral voltage is supplied to the electrolysis cell, e.g., U = 1.5–2.2 V [43]. It is anticipated that, at low voltages, oxygen can be solved inside the water that is transported through the PTL towards the catalyst layer. However, if higher oxygen production rates are achieved, the gas can invade the PTL if the pressure in the gas phase is high enough. In [58,59], the different transport regimes for oxygen through the PTL that correlate with the current density of the electrolyzer are shown. In this, dispersed bubbly flow (#1), plug flow (#2), slug flow (#3), churn flow (#4), and annular flow (#5) are distinguished. The latter flow regime is based on wetting liquid films forming along the surface of the pores and sustaining liquid transport between the water flow channel and catalyst layer. For simplicity, we assumed that the current density is always high enough to allow for a plug flow of the gas phase without formation of liquid films; this is option #6 (Figure 15a,b). This assumption is reasonable in the face of the total volume of the pore network of only a few µL (see below). However, if good wettability of the PTL surface is anticipated (hydrophilic properties), liquid films are likely to form along the solid pore surface. These films can enhance liquid transport through invaded pores as they can connect the water supply channel with liquid clusters at the top side of the PTL [15,16,60]. Basically, in presence of liquid films, the previously (and above discussed) isolated clusters would not occur, but rather the complete liquid phase in the PN would be interconnected and participate in liquid transport. This could enhance liquid transport properties significantly. (Exemplarily, in drying processes, liquid films can reduce the overall drying time by orders of magnitude, e.g., [15,17]). The presence of these films strongly depends on the surface roughness, the geometry of pore corners, wettability, temperature, and pressure, as previously mentioned.
The drainage algorithm presented above in Section 2 works independently of the current oxygen production rate. We postulate that the oxygen production rate is always high enough to (i) exceed the solubility threshold of oxygen in water (around 40 mg/kg water at 25 °C and 1 bar up to 1 g/kg water at the same temperature and around 25 bar [61]) and to (ii) simultaneously flood the drained channels with oxygen. If this is fulfilled, the invasion process can be seen as fast and is expected to take place in a very short time period.
The oxygen production rate can be calculated using Faraday’s law, assuming that the current efficiency of oxygen is equal to 1 and stochiometry
2 H 2 O 4 H + + 4 e + O 2 .
Based on Faraday’s law:
Q = I t = F z N O 2 ,
where z is the number of exchanged electrons (z = 4) and F is Faraday’s constant (F = 9.64853 × 10⁴ A s mol−1) the moles of electrolyzed water can be correlated with the current of the electrolyzer. From this follows:
d N O 2 d t = N ˙ O 2 = I F z ,
the formed molar amount of oxygen per unit time. The volume flux of oxygen can be further calculated from:
v ˙ O 2 [ m 3 m 2 s ] = N ˙ O 2 A R ˜ T P = J F z R ˜ T P ,
with current density
J = I A
in A m−2. The relationship in Equation (19) is illustrated in Figure 16a; the linear dependence is in agreement with values reported in [39]. Taking the PN from Section 3.1 as a basis, the surface area connected to the catalyst layer is roughly 0.22 mm2. If it is furthermore assumed that the complete surface area is electrolytically reactive, the oxygen flux in Figure 16a can be converted into a volumetric flow rate:
V ˙ O 2 [ μ L   min 1 ] = 0.22 [ mm 2 ] v ˙ O 2 [ mm   min 1 ] 10 3 .
Figure 16b illustrates the time dependence of the PN invasion on the reversed volumetric flow 1 / V ˙ O 2 = 1 / v ˙ O 2 A [sµL−1], with the slope being the total volume of the PN in Section 3.1,
t = V P N 1 v ˙ O 2 A ,
and A being the total cross section of the PN surface. The total volume of the PN discussed in Section 3.1 is approximately VPN = 0.19 µL; the pore volume is 0.0234 µL and the throat volume is 0.17 µL. In detail, at a current density of 2 A cm−2, the complete PN could be invaded within 0.0675 s, whereas reduction of the current density by factor 1000 increases the invasion time to roughly 1 min. This is in agreement with experiments reported in [36], where, at postulated current densities of 7 A cm−2, the according volume flow rates of the gas phase resulted in invasion times <1 min. Note that always only the dry part of the PN is available for the gas phase. Since this region is much smaller than the total volume, the breakthrough of the gas phase can occur in a shorter time. Additionally, the available cross section for gas invasion is usually lower than the given value in the presence of some liquid pores at the surface (Figure 8).

4. Summary and Discussions

We have presented a method to study the pore scale transport of oxygen and water through the PTL of water electrolysis cells. The method is based on Monte Carlo pore network simulations (PNMCS). It allows simulation of the distribution of the two fluids inside the pore space on a physical base, i.e., without incorporating effective parameters. We have shown that this can be a useful and reliable tool to numerically estimate the pore scale distribution of gas and liquid and the transport coefficients of PTLs, such as relative and absolute permeabilities. More clearly, if these are estimated more accurately based on the proposed method, transport characteristics of PTLs could be predicted more precisely in the future. Moreover, it is highlighted that the discrete method allows correlation of specific transport characteristics with the individual structure of the pore space. The proposed method, therefore, opens up a new route for designing powerful PTLs on customized demand in the future.
The developed PNM basically incorporates invasion percolation rules for hydrophilic drainage with trapping of liquid clusters. Pores and throats are separately invaded in our PN because of their similar invasion pressure thresholds. We assumed plug flow of the liquid and gas phases and negligible film flow. We also assumed that the oxygen production rate is always high enough to homogeneously invade the PN through all surface pores; pressure gradients were disregarded. The correlation with Faraday’s law showed that the small PN can be invaded during less than one minute if the current density is higher than 2 mA cm−2. The invasion process was simulated until the disconnection of the spanning liquid clusters, i.e., when the transport route for water from the top (assumed to be connected to the catalyst layer) to the bottom (assumed to be connected to water supply channel) was interrupted. Due to the discrete character of the model, it was possible to distinguish between isolated clusters, which do not contribute to liquid transport but rather hinder the oxygen flow, and the liquid transporting clusters, which span the network. The possibility to separate single liquid pores and throats depending on their designation as transporting or non-transporting elements particularly reveals the strength of PN modeling and the perspectives for future applications. Different situations were studied. At first, we illustrated relevance of the pore size distribution (PSD). Secondly, we changed the invasion rules of surface pores. For the latter, we allowed invasion of all surface pores in the first situation and restricted invasion to only one pore in the center of the PN in the second situation. We have shown that the final saturation of the PNs with liquid as well as the liquid volume contained in the spanning liquid cluster depends primarily on the PSD; the porosity was kept constant in the situations studied in this paper. Additionally, our simulations revealed that the liquid transporting clusters cover only a very small percentage of the total volume of the PN, whereas most of the liquid phase is disconnected in isolated single clusters if the drainage simulation is continued until disconnection of the water supply route. Additionally, the spanning cluster was travelling through the PN during the drainage invasion and had its center of mass at the bottom side at the moment when liquid connectivity was interrupted. The clustering effect and the travelling spanning cluster are major outcomes of the PN drainage simulation with a significant impact on the liquid and gas permeabilities, which were very low in the studied cases. Furthermore, we found that the spanning liquid clusters providing the transport route for water cover less than 2% of both surfaces (top, bottom). Though this low value can be attributed to the idealized PN structure, the associated low porosity, and the postulated constant boundary conditions, new PN simulations shall further enlighten the major characteristics of mass transfer in PTLs. Therefore, we plan to incorporate micro tomography scans of the PTL in the PNM in the next step. The instrument to be used is a Procon CT alpha with maximum resolution of 0.6 µm, equipped with image processing software, Mavi, from the Fraunhofer Institute for Industrial Mathematics ITWM Kaiserslautern. Following concepts, e.g., described in [1,2,62], we aim to run the PN simulation using the extracted real structure of the porous medium. This will allow more realistic prediction of the gas-liquid distribution for real PTLs as well as study of the role of heterogeneous pore structures, such as bimodal PSDs. Furthermore, microfluidic experiments will be necessary to validate the assumptions of the model. Current open questions concern the limits of the flow regimes (based on discussion in [58,59]), the relevance of liquid flow through corner films [57], the impact of local temperature and wettability variations, as well as the dynamic invasion in the presence of current density fluctuations. Based on [36], we plan to illustrate in more detail the impact of flow regimes (in terms of higher capillary numbers), as well as unsteady operation conditions related to the fluctuation of the current density. In the latter case, we expect multiple redistribution of liquid due to pressure (and eventually also temperature) variations. This implies the application of imbibition invasion rules additionally to drainage rules. In this context, it will also be worth studying if the disconnected liquid clusters can be reconnected and open up more routes for water transport, especially in the situation where liquid films support liquid flow through corners.

Author Contributions

Conceptualization, N.V., E.T., and T.V.-K.; methodology, N.V., E.T., and T.V.-K.; software, N.V. and H.A.; validation, N.V., H.A., and T.V.-K.; formal analysis, N.V. and T.V.-K.; investigation, N.V.; resources, N.V. and E.T.; data curation, N.V. and H.A.; writing—original draft preparation, N.V.; writing—review and editing, T.V.-K.; visualization, N.V.; supervision, N.V.; project administration, N.V., E.T., and T.V-K.; funding acquisition, N.V., E.T., and T.V.-K.

Funding

This research received no external funding.

Conflicts of Interest

The authors declare no conflict of interest.

Abbreviations

SymbolParameter (Unit)
AArea (m2)
A Matrix of conductances (-)
bVector of boundary conditions (-)
dDiameter (m)
FFaraday constant (A s mol−1)
gConductance (m s)
ICurrent (A)
I’, ItotNumber of invasion events (-)
JArea related current (A m−2)
kRelative permeability (-)
KAbsolute permeability (m2)
LLength (m)
M ˙ Flow rate (kg s−1)
NMolar amount (mol), number (-)
Ni, Nj, NkRoom coordinates (-)
PPressure (Pa)
PcCapillary pressure (Pa)
pnpMatrix of pore neighbor relations (-)
pntMatrix of pore and throat neighbor relations (-)
QElectric charge (C)
rRadius (m)
R ˜ Universal gas constant (J mol−1 K−1)
SSaturation (-)
tTime (s)
tnpMatrix of throat and pore neighbor relations (-)
tntMatrix of throat neighbor relations (-)
TTemperature (K)
UVoltage (V)
VVolume (m3)
v ˙ Velocity (m s−1)
V ˙ Volume flow rate (m3 s−1)
zValency number (-), room coordinate (m)
η Dynamic viscosity (Pa s)
θ Contact angle (°)
ρ Density (kg m−3)
σ Surface tension (N m−1)
Subscripts
1,2Pore 1 or 2
avAverage value
gGas phase
horHorizontal throats
kSlice index/number
lLiquid phase
pPore
PNPore network
MCMain cluster
tThroat
totTotal
VVolume related
verVertical throats
Abbreviations
PNPore network
PNMPore network model
PNMCSPore network Monte Carlo simulation
PSDPore size distribution
PTLPorous transport layer

References

  1. Blunt, M.J. Multiphase Flow in Permeable Media, 1st ed.; Cambridge University Press: Cambridge, UK, 2017. [Google Scholar]
  2. Bultreys, T.; Van Hoorebeke, L.; Cnudde, V. Multi-scale, micro-computed tomography-based pore network models to simulate drainage in heterogeneous rocks. Adv. Water Resour. 2015, 78, 36–49. [Google Scholar] [CrossRef]
  3. Niasar, V.J.; Hassanizadeh, S.M.; Pyrak-Nolte, L.J.; Berentsen, C. Simulating drainage and imbibition experiments in a high-porosity micromodel using an unstructured pore network model. Water Resour. Res. 2009, 45, W02430. [Google Scholar]
  4. Patzek, T.W. Verification of a complete network simulator of drainage and imbibition. SPE J. 2000. [Google Scholar] [CrossRef]
  5. Sun, Y.; Kharaghani, A.; Tsotsas, E. Micro-model experiments and pore network simulations of liquid imbibition in porous media. Chem. Eng. Sci. 2016, 150, 41–53. [Google Scholar] [CrossRef]
  6. Metzger, T. A personal view on pore network models in drying technology. Dry. Technol. 2019, 37, 497–512. [Google Scholar] [CrossRef]
  7. Vorhauer, N.; Tsotsas, E.; Prat, M. Drying of thin porous disks from pore network simulations. Dry. Technol. 2017, 36, 651–663. [Google Scholar] [CrossRef]
  8. Prat, M. Percolation model of drying under isothermal conditions in porous media. Int. J. Multiph. Flow 1993, 1, 691–704. [Google Scholar] [CrossRef]
  9. Börnhorst, M.; Walzel, P.; Rahimi, A.; Kharaghani, A.; Tsotsas, E.; Nestle, N.; Besser, A.; Kleine Jäger, F.; Metzger, T. Influence of pore structure and impregnation: Drying conditions on the solid distribution in porous support materials. Dry. Technol. 2016, 34, 1964–1978. [Google Scholar] [CrossRef]
  10. Segura, L.A. Modeling at pore-scale isothermal drying of porous materials: Liquid and vapor diffusivity. Dry. Technol. 2007, 25, 1677–1686. [Google Scholar] [CrossRef]
  11. Metzger, T.; Tsotsas, E. Viscous stabilization of drying front: Three-dimensional pore network simulations. Chem. Eng. Res. Des. 2008, 86, 739–744. [Google Scholar] [CrossRef]
  12. Yiotis, A.G.; Stubos, A.K.; Boudouvis, A.G.; Tsimpanogiannis, I.N.; Yortsos, Y.C. Pore-network modeling of isothermal drying in porous media. Transp. Porous Med. 2005, 58, 63–86. [Google Scholar] [CrossRef]
  13. Prat, M.; Bouleux, F. Drying of capillary porous media with a stabilized front in two dimensions. Phys. Rev. E 1999, 60, 5647–5656. [Google Scholar] [CrossRef] [PubMed]
  14. Fenwick, D.H.; Blunt, M. Three-dimensional modeling of three phase imbibition and drainage. Adv. Water Res. 1998, 21, 121–143. [Google Scholar] [CrossRef]
  15. Prat, M. On the influence of pore shape, contact angle and film flows on drying of capillary porous media. Int. J. Heat Mass Tran. 2002, 50, 1455–1468. [Google Scholar] [CrossRef]
  16. Yiotis, A.G.; Boudouvis, A.G.; Stubos, A.K.; Tsimpanogiannis, I.N.; Yortsos, Y.C. Effect of liquid films on the drying of porous media. AIChE J. 2004, 50, 2721–2737. [Google Scholar] [CrossRef]
  17. Vorhauer, N.; Wang, Y.; Kharaghani, A.; Tsotsas, E.; Prat, M. Drying with formation of capillary rings in a model porous medium. Transp. Porous Med. 2015, 110, 197–223. [Google Scholar] [CrossRef]
  18. Rahimi, A.; Metzger, T.; Kharaghani, A.; Tsotsas, E. Discrete modelling of ion transport and crystallization in layered porous media during drying. In Proceedings of the 21th International Drying Symposium (IDS2018), Valencia, Spain, 11–14 September 2018. [Google Scholar]
  19. Rahimi, A.; Kharaghani, A.; Metzger, T.; Tsotsas, E. Pore network modelling of a salt solution droplet on a porous substrate: Imbibition, evaporation and crystallization, In Proceedings of the 20th International Drying Symposium (IDS2016), Gifu, Japan, 7–10 August 2016.
  20. Veran-Tissoires, S.; Prat, M. Evaporation of a sodium chloride solution from a saturated porous medium with efflorescence formation. J. Fluid Mech. 2014, 749, 701–749. [Google Scholar] [CrossRef] [Green Version]
  21. Surasani, V.; Metzger, T.; Tsotsas, E. Drying simulations of various 3D pore structures by a nonisothermal pore network model. Dry. Technol. 2010, 28, 615–623. [Google Scholar] [CrossRef]
  22. Plourde, F.; Prat, M. Pore network simulations of drying of capillary porous media: Influence of thermal gradients. Int. J. Heat Mass Tran. 2003, 46, 1293–1307. [Google Scholar] [CrossRef]
  23. Huinink, H.P.; Pel, L.; Michels, M.A.J.; Prat, M. Drying processes in the presence of temperature gradients: Pore-scale modelling. Eur. Phys. J. 2002, 9, 487–498. [Google Scholar] [CrossRef]
  24. Vorhauer, N.; Tsotsas, E.; Prat, M. Temperature gradient induced double-stabilization of the evaporation front within a drying porous medium. Phys. Rev. Fluids 2018, 3, 114201. [Google Scholar] [CrossRef]
  25. Vorhauer, N.; Tran, Q.T.; Metzger, T.; Tsotsas, E.; Prat, M. Experimental investigation of drying in a model porous medium: Influence of thermal gradients. Dry. Technol. 2013, 31, 920–929. [Google Scholar] [CrossRef]
  26. Hinebaugh, J.; Bazylak, A. Condensation in PEM fuel cell gas diffusion layers: A pore network modeling approach. J. Electrochem. Soc. 2010, 157, 1382–1390. [Google Scholar] [CrossRef]
  27. Shahraeeni, M.; Hoorfar, M. Pore-network modeling of liquid water flow in gas diffusion layers of proton exchange membrane fuel cells. Int. J. Hydrog. Energy 2014, 39, 10697–10709. [Google Scholar] [CrossRef]
  28. Lee, K.J.; Kang, J.H.; Nam, J.H. Liquid water distribution in hydrophobic gas diffusion layers with interconnect rib geometry: An invasion-percolation pore network analysis. Int. J. Hydrog. Energy 2014, 39, 6646–6656. [Google Scholar] [CrossRef]
  29. Lee, K.J.; Nam, J.H.; Kim, C.J. Steady saturation distribution in hydrophobic gas-diffusion layers of polymer electrolyte membrane fuel cells: A pore-network study. J. Power Sources 2010, 195, 130–141. [Google Scholar] [CrossRef]
  30. Lee, K.J.; Kang, J.H.; Nam, J.H.; Kim, C.J. Steady liquid water saturation distribution in hydrophobic gas-diffusion layers with engineered pore paths: An invasion-percolation pore-network analysis. J. Power Sources 2010, 195, 3508–3512. [Google Scholar] [CrossRef]
  31. Straubhaar, B.; Pauchet, J.; Prat, M. Pore network modelling of condensation in gas diffusion layers of proton exchange membrane fuel cells. Int. J. Heat Mass Tran. 2016, 102, 891–901. [Google Scholar] [CrossRef] [Green Version]
  32. Agaesse, T.; Lamibrac, A.; Büchi, F.N.; Pauchet, J.; Prat, M. Validation of pore network simulations of ex-situ water distributions in a gas diffusion layer of proton exchange membrane fuel cells with X-ray tomographic images. J. Power Sources 2010, 331, 462–474. [Google Scholar] [CrossRef]
  33. Aghighi, M.; Gostick, J. Pore network modeling of phase change in PEM fuel cell fibrous cathode. J. Appl. Electrochem. 2017, 47, 1323–1338. [Google Scholar] [CrossRef]
  34. De Beer, F.; van der Merwe, J.H.; Bessarabov, D. PEM water electrolysis: Preliminary investigations using neutron radiography. Phys. Procedia 2017, 88, 19–26. [Google Scholar] [CrossRef]
  35. Biesdorf, J.; Oberholzer, P.; Bernauer, F.; Kästner, A.; Vontobel, P.; Lehmann, E.H.; Schmidt, T.J.; Boillat, P. Dual spectrum neutron radiography: Identification of phase transitions between frozen and liquid water. Phys. Rev. Lett. 2014, 112, 248301. [Google Scholar] [CrossRef] [PubMed]
  36. Lee, C.H.; Hinebaugh, J.; Banerjee, R.; Chevalier, S.; Abouatallah, R.; Wang, R.; Bazylak, A. Influence of limiting throat and flow regime on oxygen bubble saturation of polymer electrolyte membrane electrolyzer porous transport layers. Int. J. Hydrog. Energy 2017, 42, 2724–2735. [Google Scholar] [CrossRef]
  37. Arbabi, F.; Montazeri, H.; Abouatallah, R.; Wang, R.; Bazylak, A. Three-dimensional computational fluid dynamics modelling of oxygen bubble transport in polymer electrolyte membrane electrolyzer porous transport layers. J. Electrochem. Soc. 2016, 163, 3062–3069. [Google Scholar] [CrossRef]
  38. Arbabi, F.; Kalantarian, A.; Abouatallah, R.; Wang, R.; Wallace, J.; Bazylak, A. Visualizing bubble flows in electrolyzer GDLs using microfluidic platforms. ECS Trans. 2013, 58, 907–918. [Google Scholar] [CrossRef]
  39. Arbabi, F.; Kalantarian, A.; Abouatallah, R.; Wang, R.; Wallace, J.S.; Bazylak, A. Feasibility study of using microfluidic platforms for visualizing bubble flows in electrolyzer gas diffusion layers. J. Power Sources 2014, 258, 142–149. [Google Scholar] [CrossRef]
  40. Vorhauer, N.; Metzger, T.; Tsotsas, E.; Prat, M. Experimental investigation of drying by pore networks: Influence of pore size distribution and temperature. In Proceedings of the 4th International Conference on Porous Media and its Applications in Science, Engineering and Industry, Potsdam, Germany, 17–22 June 2012. [Google Scholar]
  41. Morrow, N.R. Physics and thermodynamics of capillary action in porous media. Ind. Eng. Chem. 1970, 62, 32–56. [Google Scholar] [CrossRef]
  42. Babic, U.; Suermann, M.; Büchi, F.N.; Gubler, L.; Schmidt, T.J. Critical Review—Identifying critical gaps for polymer electrolyte water electrolysis development. J. Electrochem. Soc. 2017, 164, 387–399. [Google Scholar] [CrossRef]
  43. Bernt, M.; Gasteiger, H.A. Influence of ionomer content in IrO2/TiO2 electrodes on PEM water electrolyzer performance. J. Electrochem. Soc. 2016, 163, 3179–3189. [Google Scholar] [CrossRef]
  44. Moghaddam, A.A.; Kharaghani, A.; Tsotsas, E.; Prat, M. Kinematics in a slowly drying porous medium: Reconciliation of pore network simulations and continuum modeling. Phys. Fluids 2017, 29, 022102. [Google Scholar] [CrossRef] [Green Version]
  45. Vorhauer, N.; Metzger, T.; Tsotsas, E. Extraction of effective parameters for continuous drying model from discrete pore network model. In Proceedings of the 17th International Drying Symposium (IDS 2010), Magdeburg, Germany, 3–6 October 2010; pp. 415–422. [Google Scholar]
  46. Schuler, T.; De Bruycker, R.; Schmidt, T.J.; Büchi, F.N. Polymer Electrolyte Water Electrolysis: Correlating porous transport layer structural properties and performance: Part I. Tomographic analysis of morphology and topology. J. Electrochem. Soc. 2019, 166, 555–565. [Google Scholar] [CrossRef]
  47. Metzger, T.; Irawan, A.; Tsotsas, E. Influence of pore structure on drying kinetics: A pore network study. AIChE J. 2007, 53, 3029–3041. [Google Scholar] [CrossRef]
  48. Blunt, M.J.; Jackson, M.D.; Piri, M.; Valvatne, P.H. Detailed physics, predictive capabilities and macroscopic consequences for pore-network models of multiphase flow. Adv. Water Resour. 2002, 25, 1069–1089. [Google Scholar] [CrossRef]
  49. Lenormand, R. Flow through porous media: Limits of fractal patterns. Proc. R. Soc. Lond. A 1989, 423, 159–168. [Google Scholar] [CrossRef]
  50. Zielke, L.; Fallisch, A.; Paust, N.; Zengerle, R.; Thiele, S. Tomography based screening of flow field/current collector combinations for PEM water electrolysis. RSC Adv. 2014, 4, 58888. [Google Scholar] [CrossRef]
  51. Tang, T.; Yu, P.; Shan, X.; Chen, H.; Su, J. Investigation of drag properties for flow through and around square arrays of cylinders at low Reynolds numbers. Chem. Eng. Sci. 2019, 199, 285–301. [Google Scholar] [CrossRef]
  52. Metzger, T.; Tsotsas, E.; Prat, M. Pore-network models: A powerful tool to study drying at the pore level and understand the influence of structure on drying kinetics. In Drying Technology, Modern Computational Tools at Different Scales; Tsotsas, E., Mujumdar, A.S., Eds.; Wiley-VCH: Weinheim, Germany, 2011; Volume 1, pp. 57–102. [Google Scholar]
  53. Zachariah, G.T.; Panda, D.; Surasani, V.J. Lattice Boltzmann modeling and simulation of isothermal drying of capillary porous media. In Proceedings of the 21th International Drying Symposium (IDS2018), Valencia, Spain, 11–14 September 2018. [Google Scholar]
  54. Yiotis, A.G.; Psihogios, J.; Kainourgiakis, M.E.; Papaioannou, A.; Stubos, A.K. A lattice Boltzmann study of viscous coupling effects in immiscible two-phase flow in porous media. Colloids Surf. A Physicochem. Eng. Asp. 2007, 300, 35–49. [Google Scholar] [CrossRef]
  55. Dhanushkodi, S.R.; Capitanio, F.; Biggs, T.; Merida, W. Understanding flexural, mechanical and physicochemical properties of gas diffusion layers for polymer membrane fuel cell and electrolyzer systems. Int. J. Hydrog. Energy 2015, 40, 16846–16859. [Google Scholar] [CrossRef]
  56. Siracusano, S.; Di Blasi, A.; Baglio, V.; Brunaccini, G.; Briguglio, N.; Stassi, A. Optimization of components and assembling in a PEM electrolyzer stack. Int. J. Hydrog. Energy 2011, 36, 3333–3339. [Google Scholar] [CrossRef]
  57. Bromberger, K.; Ghinaiya, J.; Lickert, T.; Fallisch, A.; Smolinka, T. Hydraulic ex situ through-plane characterization of porous transport layers in PEM water electrolysis cells. Int. J. Hydrog. Energy 2018, 43, 2556–2569. [Google Scholar] [CrossRef]
  58. Ito, H.; Maeda, T.; Nakano, A.; Hwang, C.M.; Ishida, M.; Kato, A.; Yoshida, T. Experimental study on porous current collectors of PEM electrolyzers. Int. J. Hydrog. Energy 2012, 37, 7418–7428. [Google Scholar] [CrossRef] [Green Version]
  59. Ito, H.; Maeda, T.; Nakano, A.; Hasegawa, Y.; Yokoi, N.; Hwang, C.M.; Ishida, M.; Kato, A.; Yoshida, T. Effect of flow regime of circulating water on a proton exchange membrane electrolyzer. Int. J. Hydrog. Energy 2010, 35, 9550–9560. [Google Scholar] [CrossRef]
  60. Geistlinger, H.; Ding, Y.; Apelt, B.; Schlüter, S.; Küchler, M.; Reuter, D.; Vorhauer, N.; Vogel, H.J. Evaporation study based on micromodel-experiments: Comparison of theory and experiment. Water Resour. Res. 2019. [Google Scholar] [CrossRef]
  61. Kolev, N.I. Multiphase Fluid Dynamics 4: Turbulence, Gas Adsorption and Release, Diesel Fuel Properties, 1st ed.; Springer: Berlin, Germany, 2011. [Google Scholar]
  62. Pashminehazar, R.; Ahmed, S.J.; Kharaghani, A.; Tsotsas, E. Spatial morphology of maltodextrin agglomerates from X-ray microtomographic data: Real structure evaluation vs. spherical primary particle model. Powder Technol. 2018, 331, 204–217. [Google Scholar] [CrossRef]
Figure 1. (a) Schematic illustration of the pore network model (PNM) of drainage with pore and throat numbering (pore numbers in blue; throat numbers in black). (b) Breakthrough path of oxygen from the catalyst side to the water supply channel. Note the periodic boundary conditions that allow connection of edge throats and pores with each other.
Processes 07 00558 g001
Figure 2. Representative pore size distribution (PSD) of the pore networks (PNs) studied in the pore network Monte Carlo simulations (PNMCSs) in Section 3.1. The PN with low standard deviation (STD) of pore and throat sizes is denoted STD 0.5 µm, and the PN with a higher standard variation is denoted STD 1 µm (refer to discussions below in Section 3.1). The first peaks correspond to the sizes of throats and the second peaks to the pore sizes, respectively. Note that the overlap of pore and throat sizes is greater for a higher standard deviation. The porosity of both PNs is 21%.
Processes 07 00558 g002
Figure 3. Liquid clustering in a 3-dimensional (3D) PN on the example of a small 10 × 10 × 10 network with homogeneous PSD and the parameters specified in Table 1. The transport barrier clusters (isolated and discrete) are shown in grey (a,b); the liquid transporting clusters are shown in blue (a,b); and the continuous gas phase is shown in magenta (a). Pores are not shown for reasons of readability.
Processes 07 00558 g003
Figure 4. Extraction of efficient transport parameters based on PNMCSs. (a) Step 1: Computation of the steady state invasion patterns at the disconnection of the water supply route by PNMCS. (b) Step 2: Computation of the pore scale fluid flow based on the patterns obtained from step 1. (c) From the flow rates in step 2, the relative and absolute permeabilities of the PN are computed in step 3 on the Darcy scale.
Processes 07 00558 g004
Figure 5. 3D PN under study. Pores are shown in black and throats in blue. The top and bottom pore rows are only vertically connected to their neighbor throats. All pores and throats are initially saturated with liquid.
Processes 07 00558 g005
Figure 6. Capillary pressure variation in the studied range of pore sizes (standard deviation of 0.5 µm, Figure 2). Due to the overlapping of the curves the pore invasion is computed independently of the throat invasion.
Processes 07 00558 g006
Figure 7. Capillary pressure curves of the drainage invasion process initiated in all surface pores. Note that the small pores and throats with higher capillary pressures (Figure 6) are not invaded.
Processes 07 00558 g007
Figure 8. (a) PN shortly before loss of connectivity of the liquid supply route through the blue cluster. (b) Only the liquid transporting cluster (main cluster) is shown here. Note that due to the applied periodic boundary conditions, the cluster appears at two sides of the PN, while it is disconnected in the center. (c) Empty surface pores at the top side (catalyst side). Pores connected to a liquid-filled throat of the spanning cluster are shown in light blue. (d) Surface pores at the bottom side (water channel side). Pores connected to the spanning (main) cluster in blue; all other pores in red.
Processes 07 00558 g008
Figure 9. (a) Transient liquid saturation profiles of the one PN simulation shown in Figure 7 and Figure 8. (b) The according gas saturation profiles. The catalyst side is found on the right (corresponding to the top of PN) and the water supply channel is found on the left (corresponding to the bottom of PN). The saturation profiles are shown for overall liquid saturation S = [1:0.61] (the final saturation is S = 0.6). (c) Saturation profiles of the liquid transporting clusters for S = [1:0.62].
Processes 07 00558 g009
Figure 10. (a) Transient saturation profiles of PN with a standard deviation of 1 µm. The saturation profiles are shown for overall liquid saturation S = [1:0.58] (the final saturation is S = 0.575). (b) Main cluster.
Processes 07 00558 g010
Figure 11. (a) Steady state saturation profiles of 20 PN realizations with standard deviation 0.5 µm. (b) Steady state saturation profiles of 20 PN realizations with standard deviation 1 µm.
Processes 07 00558 g011
Figure 12. (a) PN invasion from one surface pore (shown is the complete PN with gas phase in white, disconnected clusters in grey, and the liquid transporting cluster at the breakthrough of the gas phase in blue). (b) Saturation profiles for S = [1:0.64].
Processes 07 00558 g012
Figure 13. (a) Order of invasion on the example of the PN discussed above. According to Figure 1, higher throat labels are associated with the top side of the PN. (b) Invasion velocities in vertical and horizontal direction.
Processes 07 00558 g013
Figure 14. Permeability variation for simulations with low and high standard deviation of PSD.
Processes 07 00558 g014
Figure 15. (a) Plug flow invasion of the gas phase (invasion regime #6) completely separating the gas transporting from the liquid transporting pore space. (b) Annular invasion of the gas phase according to [58] (invasion regime #5), leading to annularly wetted pore space transporting gas towards the water supply channel in the center and liquid films transporting water towards the catalyst layer, as well as fully saturated pores and throats.
Processes 07 00558 g015
Figure 16. (a) Linear dependence of the oxygen volume flux on current density. (b) Required invasion time for the constant PN volume VPN (slope) in dependence of the reversed volumetric production flow rate.
Processes 07 00558 g016
Table 1. Simulation parameters.
ParameterValue
Network size30 × 30 × 10
Pore number9000
Throat number22,500
PTL temperature T50 °C
Cell pressure P10 bar
Contact angle θ
Throat length Lt27 µm
Lattice spacing L50 µm
Thickness of the PN450 µm
Porosity21%

