Abstract
Organic waste exploitation is crucial for waste emissions restraint in air, soil and water. This type of waste can be exploited to produce biogas, a valuable fuel exploitable for energy purposes. A circular approach for energy production is much cleaner and more sustainable than the traditional linear approach. In this work, organic waste was used for biogas production to feed a highly efficient solid oxide fuel cell power generator, which requires an ultra-purified fuel. Commercial sorbents were experimentally studied in conjunction with a dynamic adsorption model to predict the breakthrough time and organize the material change-over. In the presence of 0.1% oxygen in the gas mixture, AirDep® CKC showed a marked increase in the adsorption capacity (from 3.91 to 84.87 mg/g), overcoming SulfaTrap® R8G (49.91 mg/g). The effect of several operating parameters on adsorption capacity was evaluated: inlet H2S concentration, filter geometry and gas mixture velocity. Experimental data revealed that adsorption capacity increases with initial H2S concentration, following the typical trend of the Langmuir isotherm. Model simulations were in good agreement compared to experimental results, with an average relative error lower than 7%. A sensitivity analysis on the adsorption capacity was accomplished considering parameters from operational and empirical correlations.
1. Introduction
Organic waste exploitation is crucial for waste emissions restraint in air, soil and water. This type of waste can be exploited for the production of energy in a clean way in order to limit emissions, the use of fossil fuels and to improve the circular recovery approach [1]. Biogas is a mixture of methane and carbon dioxide, with usually small amounts of hydrogen sulfide (H2S), moisture and siloxanes and other trace compounds depending on the substrates and processes adopted [2,3,4,5]. Such a gas mixture can be exploited in several ways [6,7,8,9,10]:
- Heat generation, directly burning the biogas or recovering thermal energy in combined heat and power (CHP) installations;
- Electric energy production, in cogeneration systems, which is the main biogas energy recovery form;
- Upgrading to biomethane (methanation), which can be injected into natural gas grids having very similar properties.
Recently, fuel cell technology is becoming very interesting in several fields, from industrial to residential sectors. Coupling between high temperature fuel cell (in particular solid oxide fuel cell) and energy recovery plants, is a subject of great study and could be a viable market opportunity for electricity generation. This is mainly because solid oxide fuel cell (SOFC) shows higher electricity conversion as compared to other devices such as internal combustion engines (ICE) or gas turbines. Another crucial aspect that differentiates SOFC is the very low emissions CO2 and other atmospheric pollutants such as NOx, SOx and volatile organic compounds (VOCs), as well as particulate matter (PM). The major drawback is the high standards required for the feeding fuel quality. In fact, the presence of contaminants such as hydrogen sulfide (H2S), chlorine and siloxanes in the fuel must be reduced to very low levels to avoid degradation of the main cell components, reducing its useful life [8,11,12,13,14]. Therefore, when dealing with fuel cells, a prior fuel cleaning by means of suitable adsorbent materials is mandatory [15,16,17,18].
As reported in Lanzini et al., a plausible layout of the clean-up unit requires: a first bulk removal stage, which is followed by one or more guard beds, properly designed for selectively removing pollutants down to ppb(v) [19]. Guard bed materials are generally activated carbons using chemicals or physical methods [20,21,22]. To summarize, impregnated activated carbons with caustic bases (Na2CO3, NaOH, KI, NaHCO3), have adsorption capacities around a few hundred mg per g of activated carbon. Non-impregnated carbons show adsorption capacities for sulfur compounds one order of magnitude lower than activated carbons [18,23].
The saturation of these guard beds is crucial for the designing of a proper clean-up layout, at least with two lines, and for the scheduling of filter maintenance. This aspect is crucial for the prediction of the column breakthrough and to know when the adsorbent is saturated and must be changed. After a literature review, two modeling approaches are proposed to describe the biogas desulfurization: the first approach consists of an axially dispersed plug flow model with a Langmuir non-linear isotherm based on the linear driving force (LDF) approximation, whereas the second approach is based on the simpler Wheeler–Jonas reaction kinetic equation. The comparison between simulated and experimental data obtained from laboratory tests is provided for the model’s validation, as well as a sensitivity analysis of the numerical model and operational parameters. Finally, to apply the validated model, a scaling up from lab scale to real plant conditions is performed, discussed and assessed.
The purpose of this work is to characterize some selected commercial activated carbons, together with the implementation of a suitable model able to predict the material replacement of a gas cleaning reactor, using a dynamic adsorption process.
2. Theoretical Approach
2.1. Dynamic Adsorption Model—Axially Dispersed Plug Flow Model
A dynamic adsorption model usually includes:
- A partial differential mass balance equation for the gas bulk phase, represented by Equation (1).
- A mass balance equation within the particle, depicted by LDF approximation expressed by Equation (2).
- An adsorption isotherm equation, in this case the Langmuir isotherm, has been chosen as Equation (3).
Several assumptions have been made to build the model:
- The adsorption process is isothermal [24,25];
- The axial dispersion is neglected in the radial direction, and is only considered longitudinally [25,26];
- The adsorbent particles are spherical and homogeneous in size and density [25,26];
- The film diffusion coefficient depicts the mass transfer across the boundary layer [25,26];
- The intra-particle mass transport is characterized by the effective pore diffusion coefficient [25,26];
- Linear velocity is independent from the concentration [27];
- A local equilibrium is established between the amount of gas molecules adsorbed and the adsorbent solid particles [28];
- The pressure drop between the entrance and exit of the filter is considered negligible [25,28].
The interstitial velocity is calculated through linear velocity and bed porosity, knowing both the bulk (apparent) and skeletal density of the activated carbon. Then, using Fuller’s equation [29], the molecular diffusivity of H2S is obtained and exploited to calculate the axial dispersion by the Wakao and Funazkri correlation, provided that the Péclet dimensionless number is lower than 100 [30].
In the adsorption process, the transport rate of the adsorbate from the fluid phase to the solid structure of the adsorbent is the controlling step and can be modeled by the LDF model [31], which provides a good approximation of the intra-particle mass transfer and is easy to manage. Knudsen diffusion and effective diffusion have been found. To apply the linear driving force approximation, the overall mass transfer coefficient can be evaluated with the following equation [32]:
This approach assumes that the mass transfer rate is represented as proportional to the deviation from the equilibrium condition between the fluid and solid phase [33]:
The equilibrium adsorption capacity is qeq,i consisting of the maximum amount of adsorbate that can be captured by the adsorbent at a given temperature and pressure, and qi indicates the real amount of adsorbate in the adsorbent solid phase. In most models, assumptions and simplifications are necessary to reduce calculation time and the number of unknown variables. The following figure explains the simplification introduced by the LDF model.
The solution of the partial different equation (PDE) and gas bulk equation represents the evolution in time and space of the contaminant concentration C = C(x,t) into the fixed bed and can be only achieved by imposing some initial boundary conditions at the domain borders:
In other words, at t = 0 there is no contaminant in the adsorbent bed.
That is a Dirichlet type boundary condition: at any time, t > 0 the bed entrance sees a constant concentration of the contaminant equal to the initial concentration in the gas phase C0.
The third Neumann boundary condition specifies that at the bed exit there is no contaminant concentration gradient, therefore considering negligible the concentration difference between the last two sections of the bed.
To numerically solve the problem, the method of lines (MOL) was adopted and then implemented. The filter bed was considered as a one-dimensional object and discretized in space through the finite difference (FD) method, as follows (red dots in Figure 1):
where Δx is the space interval between one node and another. In this way an ordinary differential equation (ODE) system is obtained; each of which corresponds to the node i of the space discretization in which the governing equation is solved. The time derivative can be approximated as:
where Δt is the time step, while j corresponds to a certain time in the integration interval. In the following figure (Figure 2) there is an illustration on how the MOL works. The method of lines depicted below could be described in the following mode: At time t = 0 (j = 0) (bottom line), there is a certain concentration distribution in the filter bed (red dots). The concentration gradient in the bed after some time (i.e., t = dt and j = 1,2,3…) is obtained by exploiting that t = 0 and this mechanism is valid for the whole integration period. Simultaneous integration in the time domain is implemented using the MATLAB® command ODE15s which is the ideal tool to manage such stiff problems since it can quickly reach the solution convergence as compared to the more known ODE45. ODE15s is an implicit method that solves equations at each time step and its variable order is based on backward differentiation formulas. The flow chart of the numerical simulation process is described in Figure 3.
Figure 1.
Illustration of a simplified linear driving force (LDF) model.
Figure 2.
Method of lines (MOL): basic concept illustration.
Figure 3.
Structure of the simulation program.
Firstly, the input parameters required to physically characterize the phenomenon are evaluated and put into three fundamental equations. Then the simulation program combines these equations leading to the contaminant concentration distribution in the bed.
2.2. Simplified Model: Wheeler–Jonas Equation
For breakthrough time prediction in adsorption processes, the Wheeler–Jonas equation was chosen for the investigations, mainly because of its apparent simplicity: the combination of a single capacity term and an overall kinetic effect strongly enhances its applicability to different adsorption circumstances. In this way it is far more potent than many other equations that require the exact knowledge of several, not readily available, input parameters:
where, tb is the breakthrough time to reach Cout, M the weight of the carbon bed, We the equilibrium adsorption capacity, Q the volumetric flow rate, Cin the contaminant concentration in the gas phase, Cout the chosen breakthrough concentration, pb the bulk density of the carbon bed and kV the overall adsorption rate coefficient. Almost all parameters are macroscopic imposed physical quantities or can be easily evaluated, such as pb: it was determined in different ways since in the experimental tests carried out in the laboratory, cartridges of different sizes were used and filled with powdered, granular or pellet-activated carbon. This equation needs two parameters regarding the carbon-adsorbate system to be calculated, which are the static adsorption capacity We and the overall adsorption rate kV. The two main correlations for the evaluation of We and kV are provided by equations:
Concerning We, it was preferred to take advantage of the values obtained in laboratory tests, thus not using the provided empirical correlation, being a valid and accepted practice [34]. The overall adsorption rate coefficient was evaluated through a semi-empirical equation, where the affinity coefficient β was taken from literature, more precisely from [35], a historical review presenting the assumptions and approximations made in the Polanyi and Dubinin adsorption theories, which have experimentally defined affinity coefficients for several chemicals adsorption on activated carbons. Basically, there are two ways to verify the applicability of the Wheeler–Jonas relation.
The first one is based on one single breakthrough curve and foresees a plot of tb against ln[(Cin − Cout)/Cout]. The result should be a straight line for high values of ln[(Cin − Cout)/Cout], as shown in Figure 4 [34]. Furthermore, this graph could be useful to extract We and kV, which are linked respectively to the intercept with the y-axis and to the slope of the line. However, this procedure presents several drawbacks, such as the high uncertainty of the calculated We and kV, or the fact that is it not specified how the point must be considered for the fitting. Another validation method consists of performing several experiments with different amounts of activated carbon simply by changing the length-to-diameter ratio (L/D). Plotting breakthrough times against the bed weight should yield a straight line, through which it is possible once again to extrapolate We and kV from the slope and intercept. However, the final test to prove unambiguously the applicability of the Wheeler–Jonas equation is to try using it in a predictive role by exploiting a limited number of experimental tests to evaluate We and kV: the equation should be able to predict breakthrough times for different amounts of carbon, inlet concentrations and flow rates. Therefore, if used in the right way, the Wheeler–Jonas equation can be considered a powerful tool to describe any type of single vapor adsorption on a suitable adsorbent. Moreover, the scope of the Wheeler–Jonas equation may even be extended to co-adsorption, as already demonstrated by its ability to predict organic vapors’ breakthrough times under humid conditions [36]. The validation of both proposed models will be accomplished.
Figure 4.
Validity of the Wheeler–Jonas equation using the first method [34]; points are experimental values versus Wheeler–Jonas estimated values.
3. Materials and Methods
Four commercial-activated carbons were selected to study their cleaning performances: CKC, CKI, C64 (from the company AirDep, srl. San Bonifacio (VR) Italy [37]) and R8G (sold by Sulfatrap, Inc. Arvada, CO, USA [38]).
- AirDep CKC is an activated carbon of mineral origin, extruded in cylinders (pellet) of 4 mm, and thermally activated in an inert atmosphere by means of steam impregnated with 5% potassium bicarbonate (KHCO3). It is particularly suitable for the removal of hydrogen sulfide (H2S), low molecular weight mercaptans, acid gases and organic sulfurs.
- AirDep CKI is of mineral origin, extruded in 4 mm diameter pellets, thermally steam activated and impregnated with 2% potassium iodide (KI). It is mainly used for the removal of acid gases and sulfur compounds from biogas.
- AirDep C64 is produced in the same way as AirDep CKC and AirDep CKI (4 mm pellet and impregnation). The activity level and the typical porosity makes it particularly advisable for the removal of volatile organic compounds (VOCs).
- SulfaTrap R8G is a fast-reacting sorbent that effectively removes organic sulfur compounds such as mercaptans, tiophene (C4H4S), di-sulfides and tri-sulfides, as well as hydrogen sulfide (H2S), reducing the sulfur concentration in the fuel to ppb(v) levels. It can be found in granular particulate with sizes ranging from 4 to 10 mesh (2–4.76 mm). Its main application consists of sulfur removal from gaseous flow streams, including natural gas.
The experimental test rig layout is reported in Figure 5. Mass flow controllers (Bronkhorst High-Tech B.V., Ruurlo, The Netherlands) were adopted with an exploitable range from 100 to 200 Nml/min. The simulated biogas mixture with pollutants is regulated with three electronic mass flow controllers to feed a carbon cartridge; a blank line was also built using a three-way valve. This blank condition represents the biogas mixture with pollutants that need to be removed from the filter. Single-filter bed configuration is tested using the different commercial sorbents described above.
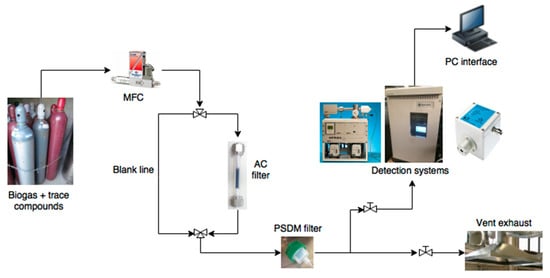
Figure 5.
Experimental set-up for biogas cleaning.
According to the scheme, PFA tubes (perfluoroalkoxy) (1/4 in. diameter, ~3 m length) and fittings (Swagelok Ltd., Solon, OH, USA) were adopted. Carbon cartridges were made with Teflon tubes. Sterile gauze was placed at both ends of the cartridges to physically support the carbon sample (composition of gauze: 85% cotton, 7% polyamide and 8% elasthan—Evercare®). The authors investigated the effect of sterile gauze on the sulfur removal capacity to exclude possible interactions. A blank cartridge (without carbon filter), with and without the sterile gauze, was used to reveal the negligible adsorption capacity from the adopted experimental setup. At saturation condition (i.e., 100% of H2S breakthrough at an inlet concentration of 500 ppm(v) and under a CH4/CO2 60%/40% vol. mixture), the adsorption capacity varied from 0.0038 mg/g (piping and reactor only, without gauze) to 0.0040 mg/g (with gauze). These values show the negligible interaction of the gauze with sulfur.
3.1. Experimental Campaigns Definition
3.1.1. Screening Performance Campaign
The first test campaign was devoted to the analysis of single compound removal, considering only a simulated biogas mixture (CH4/CO2 = 1.66) with a H2S concentration fixed to 20 ppm(v). The reason for the low sulfur content in the screening phase was the focus of the current work on low-H2S level biogases, like sewage gas from wastewater treatment plants (WWTPs). Sewage biogas from WWTPs is generally ‘cleaner’ than other biogas (agricultural wastes, crops, food waste or landfills): H2S level is indeed usually limited to the range of 50–200 ppm(v). The reason for this is found in a typical practice in WWTPs, in which dosing of iron salts (usually ferric chloride) in the wastewater cleaning line precipitates phosphorous. Even if the main goal is the removal of phosphorous, ferric chloride also generates a precipitation of sulfur which is later translated in low H2S content in the biogas. Other plants directly inject iron salts inside the anaerobic digester to specifically reduce sulfur content in the outlet biogas stream. In some of the authors’ previous works [19,39], literature analysis confirmed the low-sulfur content in sewage biogas; the practice of ferric chloride dosing to control—as a sub-goal—the sulfur level, is also abundantly discussed in the literature [40,41,42,43].
Other biogas plants (agricultural waste, food waste, municipal solid waste, and landfills), usually show higher sulfur contents. For this reason, the cleaning system is usually composed of a first stage of chemical or biological desulphurization (for bulk sulfur removal), followed by a second filtration stage based on adsorption. The system presented in this work can thus be considered as the second cleaning stage of high H2S-level biogases.
3.1.2. Influence of Pollutants’ Concentration
In the second testing campaign, the research was focused on the influence of pollutants’ concentration on the adsorption capacity (H2S range from 10.5 ppm(v) to 471.7 ppm(v)). The fixed parameters were the gas velocity (0.32 m/s), aspect ratio (L/D = 10) and temperature (30 °C).
3.1.3. Influence of Oxygen Concentration
In the first two testing campaigns, sorbent materials were tested in anaerobic conditions. However, this is not fully representative of real biogas composition. In the majority of the anaerobic digestion plants, oxygen is available in the biogas mixture even if in very small quantities, sometimes not even detected by common analyzers [7]. The presence of oxygen can strongly influence the performance of hydrogen sulfide removal. This enhancement of the H2S removal performance due to oxygen is represented by the following reaction:
According to Equation (15) oxygen is required in a maximum 3/2 (1.5) ratio in respect to hydrogen sulfide. In WWTPs, as discussed above, the average H2S content in sewage biogas is 50–200 ppm(v); oxygen is thus required in a 75–300 ppm(v) range, which is usually not measured by common biogas composition analyzers because of their detection limits. This behavior has been demonstrated in many literature works [44,45,46,47,48] where O2 content is usually <0.1% or in the range 0–1%, depending on the plant. Furthermore, the authors have performed—through an external certified laboratory—an analysis of the sewage biogas composition in the SMAT Collegno WWTP (Società Metropolitana Acque Torino S.p.A., Torino, Italy) [49]. Results, shown in Table 1, point out a variable oxygen content between 0.01% and 0.33%, which confirms the constant presence of a minimum oxygen amount.

Table 1.
Biogas composition analysis in the SMAT Collegno wastewater treatment plant (WWTP).
For this reason, further investigations were made on selected sorbents from the first tests (AirDep CKC, AirDep CKI and SulfaTrap R8G) considering the addition of 0.1% O2 in the inlet biogas stream, with an H2S inlet concentration of 95 ppm(v).
3.1.4. Influence of Filter Geometry
In the third testing campaign, the research was focused on the influence of filter geometry on adsorption capacity. This was accomplished by varying the L/D ratio from 1 to 3.3, with an H2S concentration fixed to 750 ppm(v).
3.2. Sorbents Characterization
As previously reported [17], the sorbents were characterized in terms of surface area, composition, morphology structure and micropore volume. The principal characteristics, in terms of composition and morphology structure, are displayed in Table 2 and Table 3.
Table 2.
Weight composition for the materials tested (% mass).
Table 3.
Physical features for the materials tested.
For carbon-based materials, the pore size has been evaluated through the DFT method (Density Functional Theory), using the NLDFT equilibrium model (non-linear density functional theory) for slit/cylindrical pores.
The isotherm graph (available in the Appendix A), according to IUPAC (International Union of Pure and Applied Chemistry) classification, is type I, typical of microporous materials, with a sharp increase of adsorbed volume at low relative pressures due to the capillary condensation of the adsorbate inside the micropores. At higher relative pressure, the presence of a hysteresis loop can be observed; whose shape suggests the presence of slit porosities, due to the aggregation of the primary particles.
3.3. Test Description
A homogenous powder was obtained with particle sizes in the range of 54–76 μ. Carbon samples were pre-treated using N2 flow (30 Nl/h) for 30 min, to remove residual gases inside the pores. The removal performance was measured considering two different gas flow rates: 100 Nml/min and 200 Nml/min. A first performance screening campaign was accomplished. The latter flow rate value was chosen for all the tests because it was closest to the real case study, in terms of gas velocity and gas hourly space velocity (GHSV). Dynamic tests were performed measuring the output concentration and obtaining the breakthrough time for different sorbent materials. More specifically:
- ▪
- t0 was fixed as the cleaning service time;
- ▪
- t1 was fixed as the last detection interval, corresponding to 1% of the initial concentration for sulphur compounds.
For each trace compound, the adsorption capacity was calculated in terms of mg/g, according to:
where:
- Qtot = total gas flow rate (Nl/h);
- MW = molecular weight of the trace compound removed (g/mol);
- Cin = inlet trace compound concentration (ppm(v));
- Vm = molar volume (22.414 Nl/mol);
- m = mass of sorbent (g).
According to Barelli et al., Equation (1) was corrected. In fact, the area enclosed by the breakthrough curve and the saturation line (Cout = Cin) up to t1 is well approximated by the difference between the rectangle (t1 (h)·Cin (ppm(v))) and the triangle areas (0.5·(t1 – t0)(h)·1 (ppm(v)) [50].
The biogas and pollutant trace compounds were detected using a high sensitivity mass analytical instrument, particularly well-suited for measurements of gases [51,52,53,54]. The mass spectrometer adopted for the measurements was an HPR 20 (Hiden Ltd., Warrington UK). Soft ionization allows users to selectively ionize different gases by setting the ionization energy for a particular mass. The ionization energy can be altered from 4 to 150 eV, in 0.1 eV increments. Standard operation is at 70 eV. To protect the instrument against carbon particles, a 50 μm polymeric dimethylsiloxane (PDMS) membrane was inserted. This experimental set-up was already adopted in several other works, such as [1,36,55]. Data acquired for the PDMS membrane was in good agreement with existing literature values for diffusion coefficients [56].
4. Results and Discussion
4.1. Performance Screening
In this section, a screening of selected materials was performed by assessing their adsorption capacities under the same operating conditions. The inlet H2S concentration was fixed to 20 ppm(v), the gas velocity was 0.032 m/s and the L/D ratio was equal to 1. The tested concentration is a typical average value recorded in real wastewater treatment plants [57,58,59]. Results, shown in Table 4, are in terms of measured adsorption capacities and breakthrough times.
Table 4.
Breakthrough times (tb) and adsorption capacity (Cads) of the selected adsorbent materials.
R8G shows the highest adsorption capacity (10.87 mg/g). When dealing with the physical adsorption of H2S on the carbon surface, the most important parameters are the adsorbent pore volume and specific surface area [60]. The high adsorption capacity of R8G is attributable to a catalytic oxidation mechanism activated by iron and copper active sites. Transition metals such as iron (Fe), zinc (Zn) and copper (Cu), irreversibly react with H2S to form harmless solid salts or elemental sulfur [32,60]:
Concerning AirDep C64, the lowest H2S adsorption capacity may be justified considering “physisorption” as the only adsorption mechanism that occurs. For AirDep CKI and CKC, which showed identical capacities, the proposed adsorption mechanism is the combination between physisorption and chemisorption. The rapid chemisorption of H2S with alkaline carbons takes place mostly at the carbon surface, whereas physisorption is slower and mostly takes place at the inner pores of carbon [60].
Results for experiments with the presence of oxygen are summarized in Table 5 and Table 6 in terms of adsorption capacity in anaerobic condition and in the presence of oxygen.
Table 5.
Adsorption capacities of the selected materials before and after 0.1% oxygen addition.
Table 6.
Parameters used for mathematical model simulations at different feed concentrations.
By adding 0.1% of oxygen, the removal efficiency of AirDep CKI shows a six-fold increase (Figure 6). The adsorption capacity of AirDep CKC shows the largest increment, from 3.91 to 84.87 mg/g (more than 20 times greater), becoming the best performing material, even more so than SulfaTrap R8G, whose rate of uptake increased only from 38.03 to 49.91 mg/g.
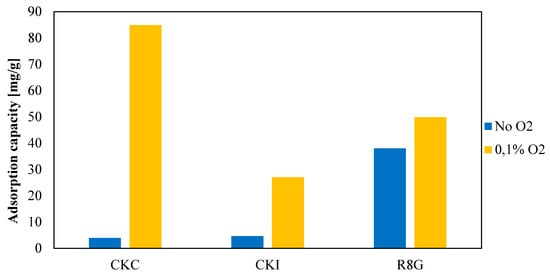
Figure 6.
Activated carbons removal efficiencies with and without oxygen addition.
The presence of oxygen leads to the formation of elemental solid sulfur that is adsorbed on carbon pores with consequent water release, as shown by the following equations [61]:
Oxidation reactions also determine chemical bonds between sulfur molecules and KOH active sites on carbon surfaces producing potassium sulphate (K2SO4) [61]. The above considerations explain the performance enhancement of AirDep CKC and CKI, while the mild improvement in SulfaTrap R8G may be due to the fact that oxidation reactions on its surface already occurs thanks to the presence of iron and copper, therefore introducing another element which exploits the same removal mechanism.
Based on such assumptions and considering the real plant situation in which little amounts of oxygen are found, AirDep CKC seems to be the most interesting among the candidate materials. Hence, the study of influencing parameters and the subsequent model validation will focus on this material only.
4.2. Effect of H2S Concentration
The effect of H2S inlet concentration was investigated for AirDep CKC, using a simulated biogas with 62.5% CH4 and 37.5% CO2 as a gas matrix, in the range of 10.5–471.2 ppm(v), keeping constant the other operating parameters (velocity = 0.32 m/s, L/D = 10 and temperature = 30 °C). As shown in Figure 7 and Table 6 (red dots), the highest measured H2S adsorption capacities, around 6 mg/g, are obtained at high values of H2S concentrations (hundreds of H2S ppm(v)).
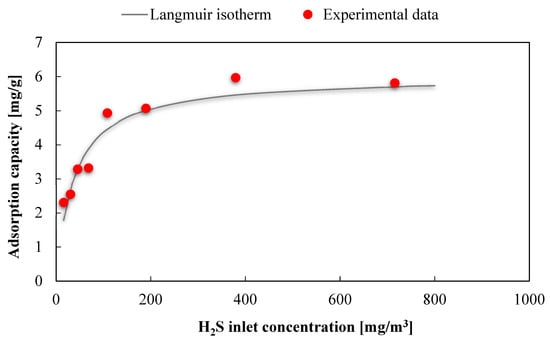
Figure 7.
Fitting of the experimental data to a Langmuir isotherm for the adsorbent AirDep CKC.
We fitted the available experimental data using the Langmuir isotherm, adopting a linear regression method and minimizing the error between predicted and experimental data. The isotherm equation for the adsorbent AirDep CKC is as follows:
where, qe is the equilibrium H2S adsorption capacity in (mg/g) corresponding to the inlet contaminant concentration in (mg/m3). The maximum adsorption capacity qm and the Langmuir constant kL obtained from data extrapolation are respectively equal to 5.9 mg/g and 0.027 m3/mg, with a determination coefficient R2 = 92.6%. These parameters were used for the mathematical model.
The results achieved from the model were compared to experimental breakthrough curves at different feed concentrations as shown in Figure 8.
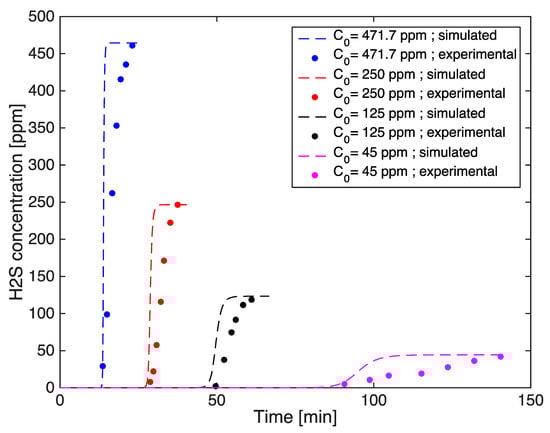
Figure 8.
Experimental and simulated breakthrough curves at four different H2S feed concentrations.
The slope of the breakthrough curves increases with the initial concentration in both the real and predicted breakthrough curves due to a higher mass transfer rate than at the end, where the small slope indicates that the adsorption rate becomes very small when the adsorbent is close to saturation [62]. The experimental curves are more rounded than the predicted ones and this may be due not only to a lower driving force, but also a higher resistance through the pores, because they become saturated, thus decreasing the overall mass transfer coefficient. The overall mass transfer coefficient (1.28 × 10⁻¹, 7.9 × 10⁻², 3.3 × 10⁻², 2.7 × 10⁻² s−1 corresponding to a H2S feed concentration of 471.2, 250, 125, 45 ppm(v)) seems to be overestimated. This was determined by means of an empirical correlation (Equation (4)) without using the experimental points shown, which were set aside to validate the model. Furthermore, the estimated breakthrough times slightly anticipate the experimental values, with relative errors lower than 10%, proving a good agreement.
The experimental data presented above were also useful to apply and validate the Wheeler–Jonas model. The governing equation input parameters were macroscopic: flow rate (Q), contaminant molecular weight (MW), catalyst amount (M), bed volume and inlet contaminant concentration. The breakthrough concentration was set to 30 ppb(v), which is the max sulfur content accepted at fuel cells system inlet of a plausible real plant. The adsorption capacities were evaluated through the Langmuir isotherm expressed by Equation (22), whereas the overall adsorption rate coefficient kV was obtained using the average sieved particle diameter dp = 60 μm and the affinity coefficient β = 0.5 as inputs [35].
Model and experimental results data for the breakthrough time varying the starting pollutant concentration are reported in Figure 9. The modeled breakthrough time values seem to agree with the experimental results. A marked decline in tb can be observed with increasing inlet contaminant concentration, as reported by our previous study [36]. The higher relative error was 12.9%, registered with an initial concentration equal to 250 ppm(v): the predicted breakthrough time was 24.9 min against the experimental value registered at 28.6 min.
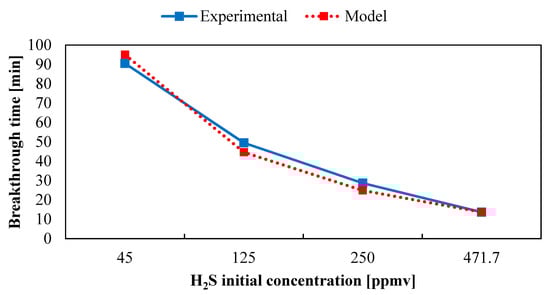
Figure 9.
Trend of breakthrough time evaluated with Wheeler–Jonas equation versus initial pollutant concentration.
The applicability of the Wheeler–Jonas equation was verified by the plot of tb against ln[(Cin − Cout)/Cout] yielding a straight line (see Figure 10), as reported in [34].
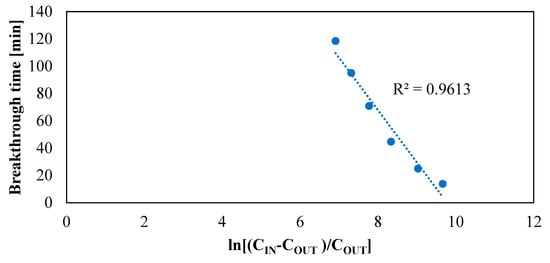
Figure 10.
Validity of Wheeler–Jonas equation.
Table 7 shows the breakthrough times predicted through the hmathematical model and Wheeler–Jonas equation compared to the experimental results. It can be seen that the mathematical model tends to anticipate a little bit the experimental breakthrough times, in a conservative way. On the other hand, the results from the Wheeler–Jonas model are visibly influenced by the adsorption capacities evaluated with the Langmuir equation; indeed, the predicted values are greater or lower than the experimental data.
Table 7.
Comparison between experimental and predicted breakthrough times at four feed concentrations.
However, the goodness of simulations are proven, since for the mathematical model and Wheeler–Jonas equation the average relative errors are 6.1% and 6.9%, respectively.
4.3. Effect of Filter Geometry
The effect of filter geometry was evaluated for the activated carbon AirDep CKC, in terms of filter length to diameter ratio, for four representative values of L/D: 1, 2, 2.75, 3.33. For this campaign, the used gas matrix was the same used in the previous experimental campaign. To accelerate the experimental testing procedure, the inlet H2S concentration was fixed to 750 ppm(v) and the gas velocity was 0.006 m/s. The results of this experimental campaign are summarized in Table 8.
Table 8.
Hydrogen sulfide adsorption capacity of AirDep CKC for different configurations of filter geometry.
Figure 11 depicts the obtained sorption capacities trend varying L/D ratio. This figure was used to extrapolate the mathematical correlation that describes how the rate of H2S uptake changes with the filter geometry:
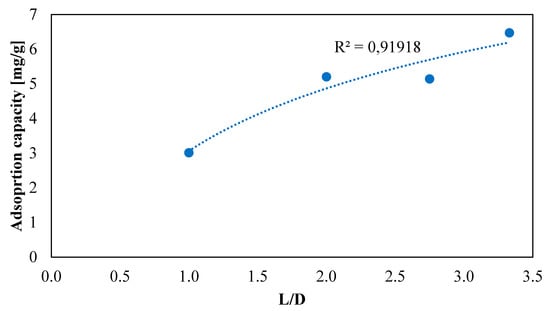
Figure 11.
Adsorption capacity ofAirDep CKC for different L/D ratios.
Results highlight how L/D affects the H2S adsorption capacity of the filter. At the beginning, it was expected to find a linear relationship, as found by Sisani et.al [61]. On the contrary, a logarithmic correlation showed the best fit with determination coefficient R2 = 91.9% against R2 = 89.5% obtained through linear interpolation. This is probably due to the wider range of L/D values investigated in this work, from 1 to 3.3, against 0.32–1.32 of Sisani’s. In fact, considering a smaller L/D range the logarithmic curve can be approximated to a straight line.
The application of the mathematical model to these experimental tests requires a new evaluation of the Langmuir equation coefficients qm and kL (L/D was 10). As reported in Gutiérrez et al. [63], these parameters have been extrapolated fitting experimental data in similar conditions. In this case another isotherm, obtained with L/D = 2.5, was used. This selected value is included in the tested range. As expected, the values of adsorption capacities are lower than those with L/D = 10. It results with qm = 1.25 mg/g and kL = 0.0155 m3/mg with a determination coefficient R2 equal to 96.6%. These parameters were used for the mathematical model.
The breakthrough curves were simulated for different bed lengths: 58, 116, 159.5 and 193.14 mm (Table 9). The earliest breakthrough occurred for L/D = 1, while an increase of breakthrough times was registered for higher L/D values, accompanied by the H2S adsorption capacity enhancement (see Figure 12 and Figure 13). The results can be explained considering that, with the configuration characterized by L/D ≥ 1, it is possible to obtain a better gas distribution inside the filter, allowing the gas mixture to also reach the peripheral parts of the filter itself.
Table 9.
Parameters used for mathematical model simulations at different bed lengths.
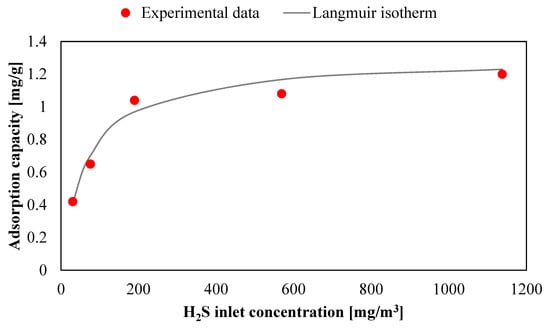
Figure 12.
Langmuir isotherm for the adsorbent AirDep CKC with L/D = 2.5.
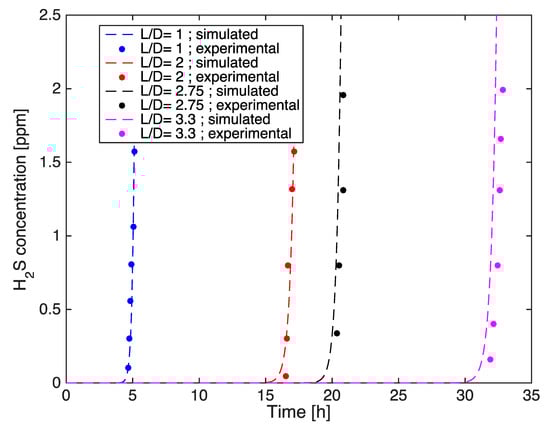
Figure 13.
Comparison between experimental and simulated initial breakthrough curves at four bed lengths.
It is observed that the experimental and the simulation results match quite well (Table 10), excluding the initial part of the curves which confirm even in this case the model tendency to slightly anticipate the breakthrough times as compared to the experimental results.
Table 10.
Comparison between experimental and predicted breakthrough times at values of L/D.
A sensitivity analysis on empirical and operational parameters is evaluated and reported in the Appendix Section (A). Their effect on the dynamic adsorption behavior was studied.
5. Conclusions
The main objective of this paper was to study the dynamic adsorption behavior of H2S in fixed-bed reactors of activated carbons. Based on experimental data, we developed a tool for predicting performance in terms of breakthrough time. Two different models were chosen. The first one was the Wheeler–Jonas model, which is based on a simple equation that considers the macroscopic parameters of the considered system. The other mathematical model was a combination of three main equations, also considering microscopic aspects of the adsorption phenomenon. The governing equation was a partial differential equation (PDE) derived from the reactor mass balance, which expresses the evolution of contaminant concentration in the gas phase. The second equation was the linear driving force (LDF) approximation, which describes the gas molecules transfer at the interface between gas bulk and sorbent particle. The last equation was the Langmuir non-linear isotherm and concerns the contaminant accumulation into the adsorbent porous structure. Laboratory experiments allowed us to characterize physically and chemically the selected commercial activated carbons (AirDep CKC, AirDep CKI, AirDep C64 and SulfaTrap R8G), as well as provide experimental data for the model validation. From a first screening testing campaign, SulfaTrap R8G performed the best under anoxic conditions (Cads = 10.87 mg/g), exploiting catalytic oxidation mechanism promoted by iron and copper particles found on the activated carbon surfaces. In presence of 0.1% oxygen in the gas mixture, AirDep CKC showed a marked increase in the adsorption capacity (from 3.91 to 84.87 mg/g), overcoming SulfaTrap R8G (49.91 mg/g). At this point the study focused on AirDep CKC. The experimental screening activity among different sorbents was also used for selecting the activated carbons to be installed in a real industrial-size biogas-fed SOFC plant; the system is the one installed in the framework of the DEMOSOFC project [64,65,66] at the SMAT Collegno waste water treatment plant (IT). Selected activated carbons for the real installations were AirDep CKC for sulfur removal (since oxygen was found in the biogas stream) and AirDep C64 for siloxanes removal (as demonstrated by the authors in other publications) [17,23].
Then, the effect of several operating parameters on AirDep CKC adsorption capacity was evaluated: inlet H2S concentration, filter geometry and gas mixture velocity. Experimental data revealed that adsorption capacity increases with initial H2S concentration, following the typical trend of the Langmuir isotherm, whose coefficients were extrapolated through experimental fitting. Model simulations were in good agreement compared to experimental results, with average relative error lower than 7%. Also filter geometry (i.e., bed length) is a parameter that seems to positively affect the adsorption capacity, as demonstrated from the logarithmic correlation which links Cads to the L/D ratio. In the range from 1 to 3.33 of the L/D ratio, the adsorption capacity increased from 3.01 to 6.47 mg/g. This is probably due to a better gas distribution in the filter and higher residence time with increasing bed length. In this case the mathematical model maintained the previous standards, predicting the breakthrough times with an error less than 9%. The Wheeler–Jonas equation showed some limitations, estimating breakthrough times very different from the experimental results. There are two possible explanations for this behavior: the size increase of the adsorbent particles with respect to screening tests (from 60 µm to 4 mm) affecting the kinetic constant kV; and its peculiar feature to consider only macroscopic parameters, thus neglecting the actual mass transport mechanism occurring at a microscopic level. Gas speed was found to negatively affect H2S adsorption capacity. Through the numerical simulation it was observed how gas mixture velocity reduces residential time of the gas molecule into the filter reactor, leading to a decrease in adsorption capacity. Moreover, increasing velocity slightly shifts the breakthrough curve towards lower breakthrough times, confirming its negative effect. The bed void fraction was also investigated in a sensitivity analysis to verify the influence on breakthrough curve shape. The curve is very sensitive to this parameter, in fact, by increasing the porosity value to 28%, the breakthrough time reduced significantly. The sensitivity analysis also investigated the influence of parameters calculated by empirical correlations, such as overall mass transfer coefficient and axial dispersion on breakthrough curve shape. By increasing the overall mass transfer coefficient, the curve becomes steeper, since the mass transfer resistance decreases, thus increasing the rate of adsorption. Therefore, the overall mass transfer coefficient affects the slope of the breakthrough curve. Lower values of the mass transfer coefficient lead to a lower adsorption rate, meaning that adsorptive molecules have time to reach the bed exit before being adsorbed in the pore structure, causing premature breakthrough. On the other hand, growing axial dispersion seems to influence the symmetry of the breakthrough curve leading to lower breakthrough times. Probably, higher axial dispersion causes a more pronounced spreading of H2S molecules along the filter axial direction and can more easily reach the bed exit.
Author Contributions
D.P. provided the conceptual work with the supervision of M.G. and A.L.
Funding
This research received no external funding.
Conflicts of Interest
The authors declare no conflict of interest.
Abbreviations
| Nomenclature | |
| β | affinity coefficient |
| pb | bulk density of the carbon bed (g/cm3) |
| B.C. | base case |
| C = C(x,t) | contaminant concentration |
| Cads | adsorption capacity (mg/g) |
| CHP | combined heat and power |
| Cin | inlet trace compound concentration (ppm(v)) |
| Cout | concentration outlet fixed to change the filter |
| Dax | axial dispersion term (m2/s) |
| De | dispersion term (m2/s) |
| dp | average sieved particle diameter (μm) |
| εb | bed void fraction |
| ICE | internal combustion engine |
| ki | overall mass transfer coefficient |
| kf | film diffusion coefficient |
| kL | Langmuir mass transfer coefficient |
| kV | the overall adsorption rate coefficient (min−1) |
| LDF | linear driving force |
| M | weight of the carbon bed (g) |
| MOL | method of lines |
| MW | molecular weight of the trace compound removed (g/mol) |
| ODE | ordinal differential wquations |
| PDE | partial differential equations |
| PM | particulate matter |
| ppb(v) | parts per billion by volume |
| ppm(v) | parts per million by volume |
| Q | volumetric flow rate (cm3/min) |
| qeq,i | equilibrium adsorption capacity, maximum amount of adsorbate capturable from sorbent (mg/g) |
| qi | real amount of adsorbate in solid phase (mg/g) |
| Qtot | total gas flow rate (Nl/h) |
| rp | radius particle (m) |
| SOFC | solid oxide fuel cell |
| tb | breakthrough time to reach the outlet concentration (min) |
| Vm | molar volume (22.414 Nl/mol) |
| VOCs | volatile organic compounds |
| We | equilibrium adsorption capacity (gpollutant/gsorbent) |
| Subscripts: | |
| exp | experimental |
| model | results achieved using the ODE model |
| WJ | results achieved using Wheeler–Jonas equation |
Appendix A. Sensitivity Analysis
In the proposed adsorption model, the most influential parameters can be divided into parameters calculated by empirical correlations (overall mass transfer and axial dispersion coefficient) and operating parameters (initial concentration, bed length, gas velocity and void fraction). A sensitivity analysis was performed varying these parameters. Their effect on the dynamic adsorption behavior was studied.
The starting case considered is described:
- -
- 20 ppm(v) of H2S;
- -
- De 8.55 × 10⁻⁸ m2/s;
- -
- ki 1.15 × 10⁻² s−1,
- -
- Dax 4.57 × 10⁻⁴ m2/s
- -
- Péclet number is 6.01.
Appendix A.1. Effect of Parameters Calculated by Empirical Correlations
The effect of varying the overall mass transfer coefficient and the axial dispersion coefficient was studied by fixing operating variables, although it should be noted that the input parameters of the model are related to each other.
Figure A1 shows the predicted breakthrough curves using an overall mass transfer coefficient previously determined in the numerical model (1.15 × 10⁻² s−1) and varying this coefficient by one order of magnitude.
As also shown by [63], the slope of the breakthrough curve increases with the overall mass transfer coefficient due to the decrease in the mass transfer resistance, and therefore, the faster rate of adsorption. The dotted black breakthrough curve shows an interesting behavior. In this case the kinetics are too slow and adsorptive molecules travel to the adsorbent bed outlet before they can enter the pores of the particle, causing a spontaneous breakthrough.

Figure A1.
Simulated breakthrough curves varying the overall mass transfer coefficient.
Figure A1.
Simulated breakthrough curves varying the overall mass transfer coefficient.

Changing the axial dispersion coefficient by one order of magnitude has a significant effect on the shape of the breakthrough in the lab scale modeling, as depicted in Figure A2.

Figure A2.
Simulated breakthrough curves varying the overall mass transfer coefficient.
Figure A2.
Simulated breakthrough curves varying the overall mass transfer coefficient.

By increasing the axial dispersion coefficient from 4.57 × 10⁻⁴ m2/s to 8 × 10⁻³ m2/s, the slope of the curve decreases and the breakthrough time is noticeably reduced.
Appendix A.2. Effect of Operational Parameters
The influence of gas velocity and void fraction on the shape of the breakthrough curve was also investigated, since initial concentration and bed length were already studied.
The curves have a slightly steeper slope at higher gas velocity (Figure A3), because as the Reynolds number increases, both the external and overall mass transfer coefficients also rise, thereby decreasing the resistance to mass transfer.
In addition, the curves shift in such a way that the breakpoint decreases due to the reduction in the residence time of molecules of H2S in the filter. Further, by decreasing the gas velocity the residence time would increase, thus leading to higher adsorption capacity.

Figure A3.
Simulated breakthrough curves varying the gas velocity.
Figure A3.
Simulated breakthrough curves varying the gas velocity.

Likewise, a change in void fraction without modifying the bed length is possible by varying the bulk density of the adsorbent, which results in a change in the amount of carbon catalyst in the filter. It can be observed (Figure A4) that by increasing the bed porosity value by 0.1, the breakthrough time clearly decreases, highlighting a visible sensitivity of the adsorption phenomenon towards this parameter. A lower residence time may be due to the higher fraction of void volume, thus some H2S molecules could find free channels to cross the bed, avoiding adsorption in the carbon pores. This assumption can be mathematically verified considering that the bed void fraction is involved in the adsorption term of the gas bulk equation. By increasing the bed porosity, the importance of the adsorption term in the governing equation decreases, which means that a lower amount of adsorbate is accumulating in the solid phase of adsorbent particles.

Figure A4.
Simulated breakthrough curves varying the bed void fraction.
Figure A4.
Simulated breakthrough curves varying the bed void fraction.

References
- Papurello, D.; Lanzini, A.; Tognana, L.; Silvestri, S.; Santarelli, M. Waste to energy: Exploitation of biogas from organic waste in a 500 Wel solid oxide fuel cell (SOFC) stack. Energy 2015, 85, 145–158. [Google Scholar] [CrossRef]
- Kwaśny, J.; Balcerzak, W. Sorbents Used for Biogas Desulfurization in the Adsorption Process. Pol. J. Environ. Stud. 2016, 25, 37–43. [Google Scholar] [CrossRef]
- De Arespacochaga, N.; Valderrama, C.; Raich-Montiu, J.; Crest, M.; Mehta, S.; Cortina, J.L. Understanding the effects of the origin, occurrence, monitoring, control, fate and removal of siloxanes on the energetic valorization of sewage biogas—A review. Renew. Sustain. Energy Rev. 2015, 52, 366–381. [Google Scholar] [CrossRef]
- Kuo, J.; Dow, J. Biogas production from anaerobic digestion of food waste and relevant air quality implications. J. Air Waste Manag. Assoc. 2017, 67, 1000–1011. [Google Scholar] [CrossRef]
- Papurello, D.; Silvestri, S.; Tomasi, L.; Belcari, I.; Biasioli, F.; Santarelli, M. Biowaste for SOFCs. Energy Procedia 2016, 101, 424–431. [Google Scholar] [CrossRef]
- Pablo-Romero, M.D.P.; Sánchez-Braza, A.; Salvador-Ponce, J.; Sánchez-Labrador, N. An overview of feed-in tariffs, premiums and tenders to promote electricity from biogas in the EU-28. Renew. Sustain. Energy Rev. 2017, 73, 1366–1379. [Google Scholar] [CrossRef]
- Santarelli, M.; Briesemeister, L.; Gandiglio, M.; Herrmann, S.; Kuczynski, P.; Kupecki, J.; Lanzini, A.; Llovell, F.; Papurello, D.; Spliethoff, H.; et al. Carbon recovery and re-utilization (CRR) from the exhaust of a solid oxide fuel cell (SOFC): Analysis through a proof-of-concept. J. CO2 Util. 2017, 18, 206–221. [Google Scholar] [CrossRef]
- Papurello, D.; Iafrate, C.; Lanzini, A.; Santarelli, M. Trace compounds impact on SOFC performance: Experimental and modelling approach. Appl. Energy 2017, 208, 637–654. [Google Scholar] [CrossRef]
- Patrizio, P.; LeDuc, S.; Chinese, D.; Dotzauer, E.; Kraxner, F. Biomethane as transport fuel – A comparison with other biogas utilization pathways in northern Italy. Appl. Energy 2015, 157, 25–34. [Google Scholar] [CrossRef]
- Mostbauer, P.; Lombardi, L.; Olivieri, T.; Lenz, S. Pilot scale evaluation of the BABIU process – Upgrading of landfill gas or biogas with the use of MSWI bottom ash. Waste Manag. 2014, 34, 125–133. [Google Scholar] [CrossRef]
- Papurello, D.; Lanzini, A. SOFC single cells fed by biogas: Experimental tests with trace contaminants. Waste Manag. 2017, 72, 306–312. [Google Scholar] [CrossRef]
- Kupecki, J.; Papurello, D.; Lanzini, A.; Naumovich, Y.; Motylinski, K.; Blesznowski, M.; Santarelli, M. Numerical model of planar anode supported solid oxide fuel cell fed with fuel containing H2S operated in direct internal reforming mode (DIR-SOFC). Appl. Energy 2018, 230, 1573–1584. [Google Scholar] [CrossRef]
- Madi, H.; Lanzini, A.; Diethelm, S.; Papurello, D.; Van Herle, J.; Lualdi, M.; Larsen, J.G.; Santarelli, M. Solid oxide fuel cell anode degradation by the effect of siloxanes. J. Power Sources 2015, 279, 460–471. [Google Scholar] [CrossRef]
- Facci, A.L.; Cigolotti, V.; Jannelli, E.; Ubertini, S. Technical and economic assessment of a SOFC-based energy system for combined cooling, heating and power. Appl. Energy 2016, 192, 563–574. [Google Scholar] [CrossRef]
- De Arespacochaga, N.; Valderrama, C.; Mesa, C.; Bouchy, L.; Cortina, J.L. Biogas deep clean-up based on adsorption technologies for Solid Oxide Fuel Cell applications. Chem. Eng. J. 2014, 255, 593–603. [Google Scholar] [CrossRef]
- Papurello, D.; Schuhfried, E.; Lanzini, A.; Romano, A.; Cappellin, L.; Märk, T.D.; Silvestri, S.; Santarelli, M.; Biasioli, F. Proton transfer reaction-mass spectrometry as a rapid inline tool for filter efficiency of activated charcoal in support of the development of Solid Oxide Fuel Cells fueled with biogas. Fuel Process. Technol. 2015, 130, 78–86. [Google Scholar] [CrossRef]
- Papurello, D.; Tomasi, L.; Silvestri, S. Proton transfer reaction mass spectrometry for the gas cleaning using commercial and waste-derived materials: Focus on the siloxane removal for SOFC applications. Int. J. Mass Spectrom. 2018, 430, 69–79. [Google Scholar] [CrossRef]
- Papurello, D.; Tomasi, L.; Silvestri, S.; Belcari, I.; Santarelli, M.; Smeacetto, F.; Biasioli, F. Biogas trace compound removal with ashes using proton transfer reaction time-of-flight mass spectrometry as innovative detection tool. Fuel Process. Technol. 2016, 145, 62–75. [Google Scholar] [CrossRef]
- Lanzini, A.; Madi, H.; Chiodo, V.; Papurello, D.; Maisano, S.; Santarelli, M.; Van Herle, J. Dealing with fuel contaminants in biogas-fed solid oxide fuel cell (SOFC) and molten carbonate fuel cell (MCFC) plants: Degradation of catalytic and electro-catalytic active surfaces and related gas purification methods. Prog. Energy Combust. Sci. 2017, 61, 150–188. [Google Scholar] [CrossRef]
- Coppola, G.; Papurello, D. Biogas Cleaning: Activated Carbon Regeneration for H2S Removal. Clean Technol. 2018, 1, 40–57. [Google Scholar] [CrossRef]
- Lashaki, M.J.; Fayaz, M.; Wang, H.; Hashisho, Z.; Philips, J.H.; Anderson, J.E.; Nichols, M. Effect of Adsorption and Regeneration Temperature on Irreversible Adsorption of Organic Vapors on Beaded Activated Carbon. Environ. Sci. Technol. 2012, 46, 4083–4090. [Google Scholar] [CrossRef]
- Yahya, M.A.; Al-Qodah, Z.; Ngah, C.Z. Agricultural bio-waste materials as potential sustainable precursors used for activated carbon production: A review. Renew. Sustain. Energy Rev. 2015, 46, 218–235. [Google Scholar] [CrossRef]
- Papurello, D.; Boschetti, A.; Silvestri, S.; Khomenko, I.; Biasioli, F. Real-time monitoring of removal of trace compounds with PTR-MS: Biochar experimental investigation. Renew. Energy 2018, 125, 344–355. [Google Scholar] [CrossRef]
- Vizhemehr, A.K.; Haghighat, F.; Lee, C.S. Gas-phase filters breakthrough models at low concentration – Effect of relative humidity. Build. Environ. 2014, 75, 1–10. [Google Scholar] [CrossRef]
- Vizhemehr, A.K.; Haghighat, F. Modeling of gas-phase filter model for high- and low-challenge gas concentrations. Build. Environ. 2014, 80, 192–203. [Google Scholar] [CrossRef]
- Vizhemehr, A.K.; Haghighat, F.; Lee, C.S. Predicting gas-phase air-cleaning system efficiency at low concentration using high concentration results: Development of a framework. Build. Environ. 2013, 68, 12–21. [Google Scholar] [CrossRef]
- Delgado, J.M. A critical review of dispersion in packed beds. Heat Transf. 2006, 42, 279–310. [Google Scholar] [CrossRef]
- Xu, Z.; Cai, J.G.; Pan, B.C. Mathematically modeling fixed-bed adsorption in aqueous systems. J. Zhejiang Univ. A 2013, 14, 155–176. [Google Scholar] [CrossRef]
- Giddings, J.C.; Schettler, P.D.; Fuller, E.N. A new method for prediction of binary gas-phase diffusion. Ind. Eng. Chem. 1966, 58, 19. [Google Scholar] [CrossRef]
- Wakao, N.; Funazkri, T. Effect of fluid dispersion coefficients on particle-to-fluid mass transfer coefficients in packed beds. Chem. Eng. Sci. 1978, 33, 1375–1384. [Google Scholar] [CrossRef]
- Glueckauf, E.; Coates, J.I. Theory of chromatography. Part 4-The influence of incomplete equilibrium on the front boundary of chromatogram and on the effectiveness of separation. J. Chem. Soc. 1947, 241, 1315–1321. [Google Scholar] [CrossRef]
- Myers, A.L.; Prausnitz, J.M. Thermodynamics of mixed-gas adsorption. AIChE J. 1965, 11, 121–127. [Google Scholar] [CrossRef]
- Chauveau, R.; Grévillot, G.; Marsteau, S.; Vallières, C. Values of the mass transfer coefficient of the linear driving force model for VOC adsorption on activated carbons. Chem. Eng. Res. Des. 2013, 91, 955–962. [Google Scholar] [CrossRef]
- Lodewyckx, P.; Wood, G.; Ryu, S. The Wheeler–Jonas equation: A versatile tool for the prediction of carbon bed breakthrough times. Carbon 2004, 42, 1351–1355. [Google Scholar] [CrossRef]
- Wood, G. Affinity coefficients of the Polanyi/Dubinin adsorption isotherm equations. Carbon 2001, 39, 343–356. [Google Scholar] [CrossRef]
- Papurello, D.; Tomasi, L.; Silvestri, S.; Santarelli, M. Evaluation of the Wheeler-Jonas parameters for biogas trace compounds removal with activated carbons. Fuel Process. Technol. 2016, 152, 93–101. [Google Scholar] [CrossRef]
- AirDep. AirDep—Impianti di Depurazione Aria e Biogas San Bonifacio—Verona. 2019. Available online: https://www.airdep.eu/ (accessed on 8 May 2019).
- Sulfatrap. Desulfurization—SulfaTrap—Global Leader in Sulfur Removal Sorbents. 2019. Available online: https://sulfatrap.com/ (accessed on 8 May 2019).
- Lanzini, A.; Ferrero, D.; Papurello, D.; Santarelli, M. Reporting Degradation from Different Fuel Contaminants in Ni-anode SOFCs. Fuel Cells 2017, 17, 423–433. [Google Scholar] [CrossRef]
- Firer, D.; Friedler, E.; Lahav, O. Control of sulfide in sewer systems by dosage of iron salts: Comparison between theoretical and experimental results, and practical implications. Sci. Total. Environ. 2008, 392, 145–156. [Google Scholar] [CrossRef]
- DeVries, R. Ferric Chloride in Wastewater Treatment. Environ. Sci. 2011, 2, 6–26. [Google Scholar]
- Aslanidou, N.; Lydakis-Simantiris, C.; Kotsifaki, D.; Pentari, E.; Katsivela, S. Ferric Chloride (Fecl 3) as Regulatory Agent for the Reduction of Hydrogen Sulfide (H 2 S) in Municipal Wastewater. Available online: http://lydakis.chania.teicrete.gr (accessed on 18 July 2019).
- DeVries IV, V. Ferric Chloride in Wastewater Treatment, Environment Science Water Life. 2011. Available online: https://pdfs.semanticscholar.org (accessed on 18 July 2019).
- Manyuchi, C.; Mbohwa, E.; Muzenda, M.M. Resource Recovery from Municipal Sewage Plants: An Energy-Water-Nutrients Nexus for Developing Countries. Available online: https://biust.pure.elsevier.com/en/publications (accessed on 18 July 2019).
- Chicheportiche, R.; Balerna, M.; Lombet, A.; Romey, G.; Lazdunski, M. Synthesis and mode of action on axonal membranes of photoactivable derivatives of tetrodotoxin. J. Biol. Chem. 1979, 254, 1552–1557. [Google Scholar]
- Rasi, S.; Läntelä, J.; Rintala, J. Trace compounds affecting biogas energy utilization—A review. Energy Convers. Manag. 2011, 52, 3369–3375. [Google Scholar] [CrossRef]
- Paolini, V.; Petracchini, F.; Carnevale, M.; Gallucci, F.; Perilli, M.; Esposito, G.; Segreto, M.; Occulti, L.G.; Scaglione, D.; Ianniello, A.; et al. Characterisation and cleaning of biogas from sewage sludge for biomethane production. J. Environ. Manag. 2018, 217, 288–296. [Google Scholar] [CrossRef]
- Vinh-Thang, H.; Chen, X.Y.; Ramirez, A.A.; Rodrigue, D.; Kaliaguine, S. Membrane gas separation technologies for biogas upgrading. RSC Adv. 2015, 5, 24399–24448. [Google Scholar]
- SMAT. Società Metropolitana Acque Torino, S.P.A., Official Website. 2019. Available online: http://www.smatorino.it/ (accessed on 12 April 2019).
- Barelli, L.; Bidini, G.; Hernàndez-Balada, E.; Mata-Álvarez, J.; Sisani, E. Performance characterization of a novel Fe-based sorbent for anaerobic gas desulfurization finalized to high temperature fuel cell applications. Int. J. Hydrog. Energy 2016, 42, 1859–1874. [Google Scholar] [CrossRef]
- Papurello, D.; Silvestri, S.; Lanzini, A. Biogas cleaning: Trace compounds removal with model validation. Sep. Purif. Technol. 2018, 210, 80–92. [Google Scholar] [CrossRef]
- Wang, J.; Wang, L.; Fan, H.; Wang, H.; Hu, Y.; Wang, Z. Highly porous copper oxide sorbent for H 2 S capture at ambient temperature. Fuel 2017, 209, 329–338. [Google Scholar] [CrossRef]
- Barba, D.; Palma, V.; Ciambelli, P. Screening of catalysts for H2S abatement from biogas to feed molten carbonate fuel cells. Int. J. Hydrogen Energy 2013, 38, 328–335. [Google Scholar] [CrossRef]
- Žák, M.; Bendová, H.; Friess, K.; Bara, J.E.; Izák, P. Separation and Purification Technology Single-step puri fi cation of raw biogas to biomethane quality by hollow fi ber membranes without any pretreatment—An innovation in biogas upgrading. Sep. Purif. Technol. 2018, 203, 36–40. [Google Scholar] [CrossRef]
- Alexander, M.; Boscaini, E.; Lindinger, W.; Märk, T.D. Membrane introduction proton-transfer reaction mass spectrometry. Int. J. Mass Spectrom. 2003, 223, 763–770. [Google Scholar] [CrossRef]
- Grate, J.W.; Abraham, M.H. Solubility interactions and the design of chemically selective sorbent coatings for chemical sensors and arrays. Sens. Actuators B Chem. 1991, 3, 85–111. [Google Scholar] [CrossRef]
- DEMOSOFC Project Official Website. 2016. Available online: www.demosofc.eu (accessed on 20 December 2015).
- Gandiglio, M. The DEMOSOFC Project: Industrial-Size Demonstration of a Biogas-Fed Solid Oxide Fuel Cell. In Proceedings of the Fundamentals & Development of Fuel Cells, Stuttgart, Germany, 31 January–2 February 2017; p. 2020. [Google Scholar]
- Gandiglio, M.; Lanzini, A.; Santarelli, M. Large Stationary Solid Oxide Fuel Cell (SOFC) Power Plants; Springer: Cham, Switzerland, 2018; pp. 233–261. [Google Scholar]
- Yan, R.; Chin, T.; Ng, Y.L.; Duan, H.; Liang, D.T.; Tay, J.H. Influence of Surface Properties on the Mechanism of H2S Removal by Alkaline Activated Carbons. Environ. Sci. Technol. 2004, 38, 316–323. [Google Scholar] [CrossRef]
- Sisani, E.; Cinti, G.; Discepoli, G.; Penchini, D.; Desideri, U.; Marmottini, F. Adsorptive removal of H 2 S in biogas conditions for high temperature fuel cell systems. Int. J. Hydrog. Energy 2014, 39, 21753–21766. [Google Scholar] [CrossRef]
- Aguilera, P.; Ortiz, F.G.; Ortiz, F.J.G. Prediction of fixed-bed breakthrough curves for H 2 S adsorption from biogas: Importance of axial dispersion for design. Chem. Eng. J. 2016, 289, 93–98. [Google Scholar] [CrossRef]
- Ortiz, F.G.; Aguilera, P.; Ollero, P.; Ortiz, F.J.G.; De Castro, P.A.O. Biogas desulfurization by adsorption on thermally treated sewage-sludge. Sep. Purif. Technol. 2014, 123, 200–213. [Google Scholar] [CrossRef]
- Gandiglio, M.; Lanzini, A.; Soto, A.; Leone, P.; Santarelli, M. Enhancing the Energy Efficiency of Wastewater Treatment Plants through Co-digestion and Fuel Cell Systems. Front. Environ. Sci. 2017, 5, 70. [Google Scholar] [CrossRef]
- Giarola, S.; Forte, O.; Lanzini, A.; Gandiglio, M.; Santarelli, M.; Hawkes, A. Techno-economic assessment of biogas-fed solid oxide fuel cell combined heat and power system at industrial scale. Appl. Energy 2018, 211, 689–704. [Google Scholar] [CrossRef]
- Mosayebnezhad, M.; Mehr, A.; Gandiglio, M.; Lanzini, A.; Santarelli, M. Techno-economic assessment of biogas-fed CHP hybrid systems in a real wastewater treatment plant. Appl. Therm. Eng. 2018, 129, 1263–1280. [Google Scholar] [CrossRef]


© 2019 by the authors. Licensee MDPI, Basel, Switzerland. This article is an open access article distributed under the terms and conditions of the Creative Commons Attribution (CC BY) license (http://creativecommons.org/licenses/by/4.0/).