Article

Experimental and Numerical Study of Double-Pipe Evaporators Designed for CO2 Transcritical Systems

School of Energy and Safety Engineering, Tianjin Chengjian University, Tianjin 300384, China
*
Author to whom correspondence should be addressed.
Processes 2019, 7(8), 547; https://doi.org/10.3390/pr7080547
Submission received: 18 July 2019 / Revised: 8 August 2019 / Accepted: 15 August 2019 / Published: 19 August 2019
(This article belongs to the Section Advanced Digital and Other Processes)

Abstract

:
The performance of a CO2 double-pipe evaporator was studied through experiments and a simulation model that was established by the steady-state distribution parameter method and experimentally verified while using a CO2 transcritical water‒water heat pump system. The effects of different operating parameters on heat transfer performance were studied over a range of evaporation temperatures (−5 to 5 °C), mass velocity (100‒600 kg/m2s), and heat flux (5000‒15,000 W/m2). It was found that the dryout quality increased at a small evaporation temperature, a large mass velocity, and a small heat flux. The simulation yield means relative error (RE) of heat transfer for the evaporation temperature and that of the CO2 pressure drop for the chilled water inlet temperature were 5.21% and 3.78%, respectively. The effect of tube diameter on the performance of CO2 double-pipe evaporator is probed through simulations. At the same time, this paper defines a parameter α , which is the proportion of the pre-dryout region to the whole heat transfer region. A larger α value is desirable. A further theoretical basis is provided for designing an efficient and compact CO2 evaporator.

Graphical Abstract

1. Introduction

Significant attention has been directed towards alternative energy conversion systems due to environmental concerns [1]. Important steps are being taken to drastically reduce the production and consumption of powerful greenhouse gasses known as hydrofluorocarbons (HFCs) and limit global warming. Initiatives like the Kigali Amendment to the Montreal Protocol on Substances that Deplete the Ozone Layer entered into force on 1 January 2019. The current Kigali amendment contract has already made practical arrangements for the implementation of the amendment. CO2 is an alternative refrigerant to replace chlorofluorocarbons (CFCs) and hydro chlorofluorocarbons (HCFCs) due to its zero ODP (ozone depression potential) and low GWP (global warming potential) [2]. CO2 has low surface tension, a low gas‒liquid density ratio, and low viscosity, which leads to more evaporation cores and it improves its heat transfer coefficient [3]. Under the same experimental conditions, the heat transfer coefficient of boiling CO2 is twice that of other refrigerants [4,5,6]. In 1992, the experimental results of the first CO2 automotive air conditioning system using a transcritical cycle were presented [7]. Currently, many researchers are focusing on the heat transfer performance of pure CO2. The use of CO2 as a refrigerant had some disadvantages, such as the degradation of the COP as compared to other refrigerants [2]. The optimization of system components can effectively improve the efficiency of the component [8]. As a key component, evaporators play an important role in the energy efficiency and physical size of systems.
Much effort has been made to improve the performance of the CO2 heat exchanger. Jin et al. [9] and Rin et al. [10] used the finite volume method to predict the performance of an evaporator for a CO2 air-conditioning system. Sarkar [11] and Bai et al. [12] demonstrated a dual-evaporator transcritical CO2 refrigeration cycle. Kravanja et al. [13] developed a double pipe heat exchanger and investigated the performance of the evaporator. Pettersen et al. [14] compared the performance of microchannel evaporators and plate-fin evaporators designed, with the results illustrating that the evaporator with a 2.0-mm inner diameter (ID) tube had the highest capacity per unit volume.
Moreover, there is a focus on improving the performance of different forms of CO2 evaporators. Patino et al. [15] developed a finite-volume mathematical model to study a concentric counter-current evaporator for CO2. Silvia et al. [16] used a new method for feeding the flooded evaporators in R744 plants. Wiebke et al. [17] developed a one-dimensional discretized steady-state model to study the performance of a CO2 minichannel evaporator with parallel channels. Ge and Tassou [18] utilized the CFD technique-based evaporator models to optimize the design of CO2 cabinet evaporators. Ke et al. [19] used the variable property segmented method to investigate the heat transfer and pressure drop characteristics of supercritical CO2 (S-CO2). Son et al. [20] used artificial neural networks to predict the inner pinch for a S-CO2 heat exchanger. Cui et al. [21] simulated novel airfoil fins for heat exchanger using S-CO2. Paradise [22] investigated a hybrid photovoltaic/thermal (PV/T) solar evaporator while using CO2 through a semi-transient numerical model. The special properties of CO2 pose serious challenges to the design and optimization of conventional heat exchangers [23]. Therefore, the thermal physical properties in heat transfer and flow of CO2 have to be taken into account when designing heat exchangers. Particular attention should be paid to the components in transcritical CO2 refrigeration systems due to the high operating pressure of these systems, as well as the special thermophysical and transport properties of CO2 in the near-critical region to design efficient and compact heat exchangers.
This paper studies the performance of CO2 double-pipe evaporators for transcritical CO2 through experiments and a simulation model that was established by steady-state distribution parameter method. In this paper, Matlab software (MathWorks, Beijing, China) is used to study the performance of the evaporator from structural parameters. The efficacy of the model for the optimization of CO2 double-pipe evaporator is verified. Moreover, this paper defines one parameter, α , the proportion of pre-dryout region to the whole heat transfer region.

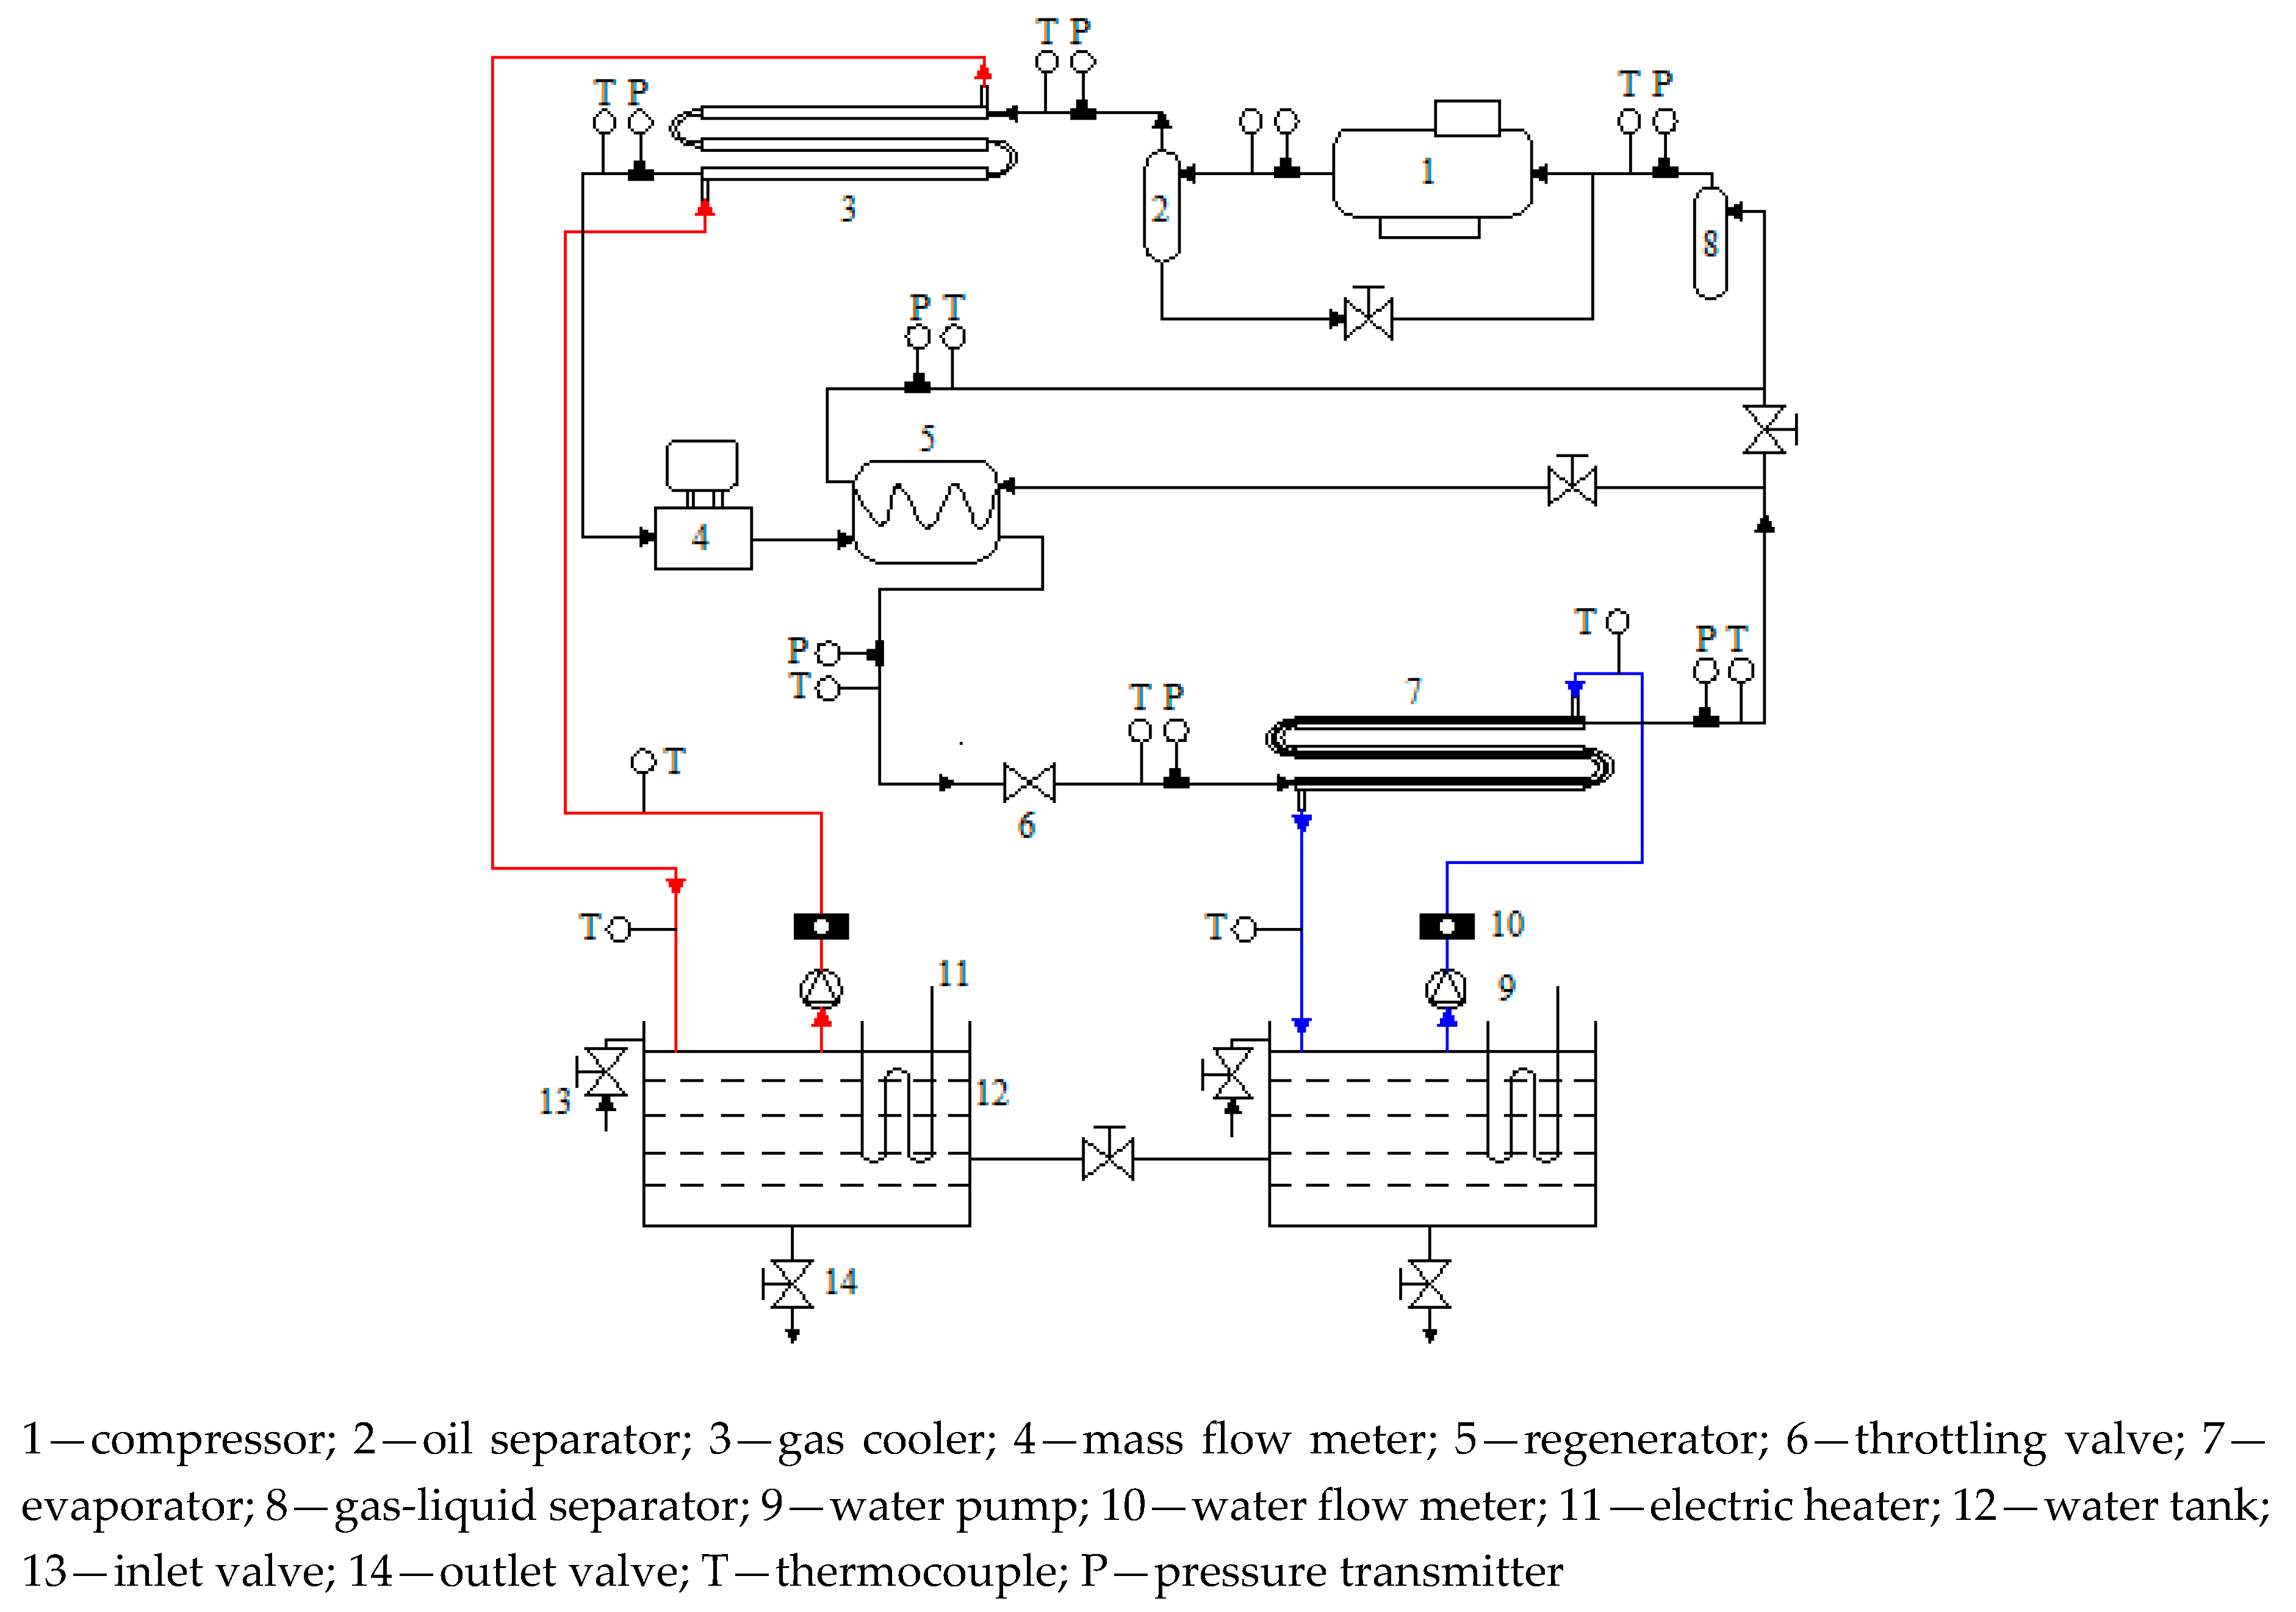
2. Experimental Installation and Test Procedure

Experiments were conducted based on a water‒water heat pump system under different operating conditions to test the performance of the CO2 double-pipe evaporator. As shown in Figure 1, the test rig consisted of the heat pump and water flow loops. The system comprised of a compressor, an oil separator, a gas cooler, a mass flow meter, a regenerator, a throttling valve, an evaporator, a gas‒liquid separator, a water pump, a water flowmeter, an electric heater, hot and cold thermal storage tanks, a platinum resistance temperature sensor, and a pressure transmitter. Table 1 lists detailed specifications of the major components of the heat pump system. The gas cooler and evaporator were double-type heat exchangers with a counter-flow pattern between the refrigerant and water.
The gas‒liquid separator between the evaporator and the compressor prevents the liquid shock of the compressor and stores the refrigerant. The oil separator between the gas cooler and the compressor separates the lubricating oil from the refrigerant. Water flow loops for the evaporator and gas cooler include two water pumps and two water tanks. A variable speed pump and a valve control the water flow rate.
Platinum resistance temperature sensors were installed to measure the refrigerant-side and water-side temperatures of the system; among them, four platinum resistance temperature sensors were installed in each water tank, as shown in Figure 1. Seven pressure sensors were installed to measure the pressure in the refrigerant side of the setup. One mass flow meter was installed to measure the refrigerant’s mass flow rate. Two turbine flow meters were installed to measure the water flow rates. Table 2 summarizes the specifications and uncertainties of sensors. An electric heating tube is provided in each of the chilled water tanks and the cooling water tank. An air-cooled unit is also connected outside the cooling water tank. Intelligent control of the temperature of the two tanks is realized. When the water temperature is different from the preset temperature, the unit automatically starts the cooling or heating device.
The first step in testing is to determine full charge under standard conditions: water temperatures of 25 °C and 12 °C entering the gas cooler and CO2 evaporator, respectively. The water flow rate in the test setup was measured at the selected locations while using a turbine flowmeter and the evaporation temperature in the test setup was measured using platinum resistance temperature sensors. The pressure and heat flux entering the evaporator were kept at 8 MPa and 10,000 W/m2, respectively, and the CO2 mass velocity entering the evaporator varied from 100 to 600 kg/m2s. The CO2 mass velocity and heat flux entering the evaporator were set at 200 kg/m2s and 10,000 W/m2, respectively, and the evaporation temperature varied from −5 °C to 5 °C. The CO2 mass velocity and pressure entering the evaporator were set to 200 kg/m2s and 8 MPa, respectively, to test the performance of the heat flux on the evaporator. Temperature, pressure, and mass velocity were monitored while using a data collection system. The performance of the double-pipe evaporator was tested by the control variable method and Table 3 lists the test conditions.
The mean heat transfer coefficient of refrigerant is calculated, as follows [24]:
h r = 1 1 K δ λ ln d w 1 d m ( 1 h w + γ w ) d w 1 d w 2 γ i
K = Q r A Δ t
Q r = c p ν w ρ w 3600 ( T w i T w o )
The heat transfer coefficient of chilled water (hw) is from Dittus-Boelter [25].

3. Experimental Results and Discussion

The effects of evaporation temperature, mass velocity, and heat flux on the heat transfer coefficient and cooling capacity of CO2 double-pipe evaporator were studied. The dryout, which causes a drop in the heat transfer coefficient, forms two regions: the pre-dryout and post-dryout. The mass quality corresponding to dryout is denoted as xcr.

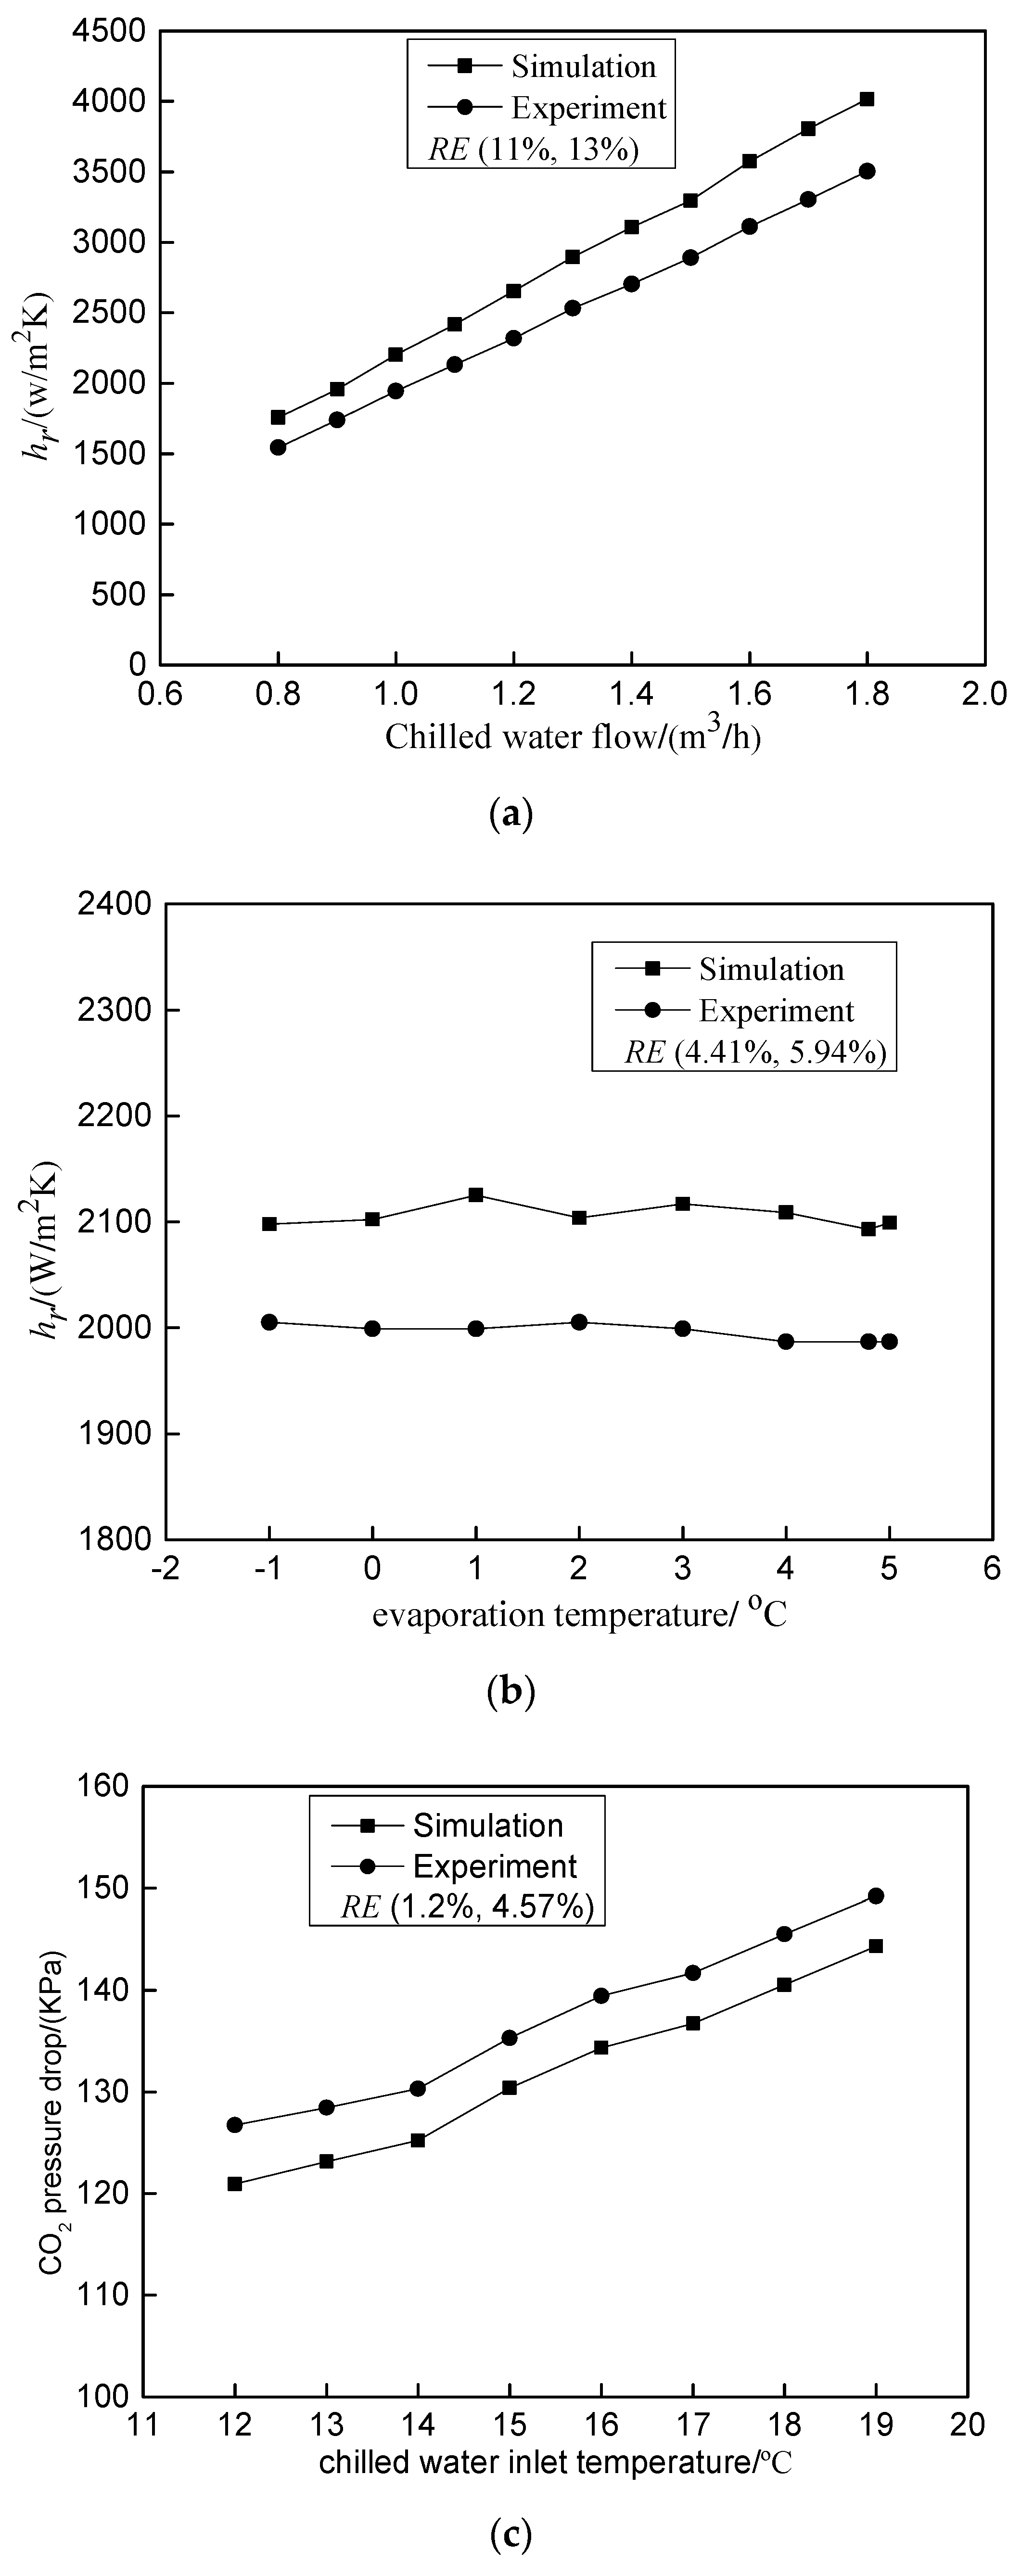
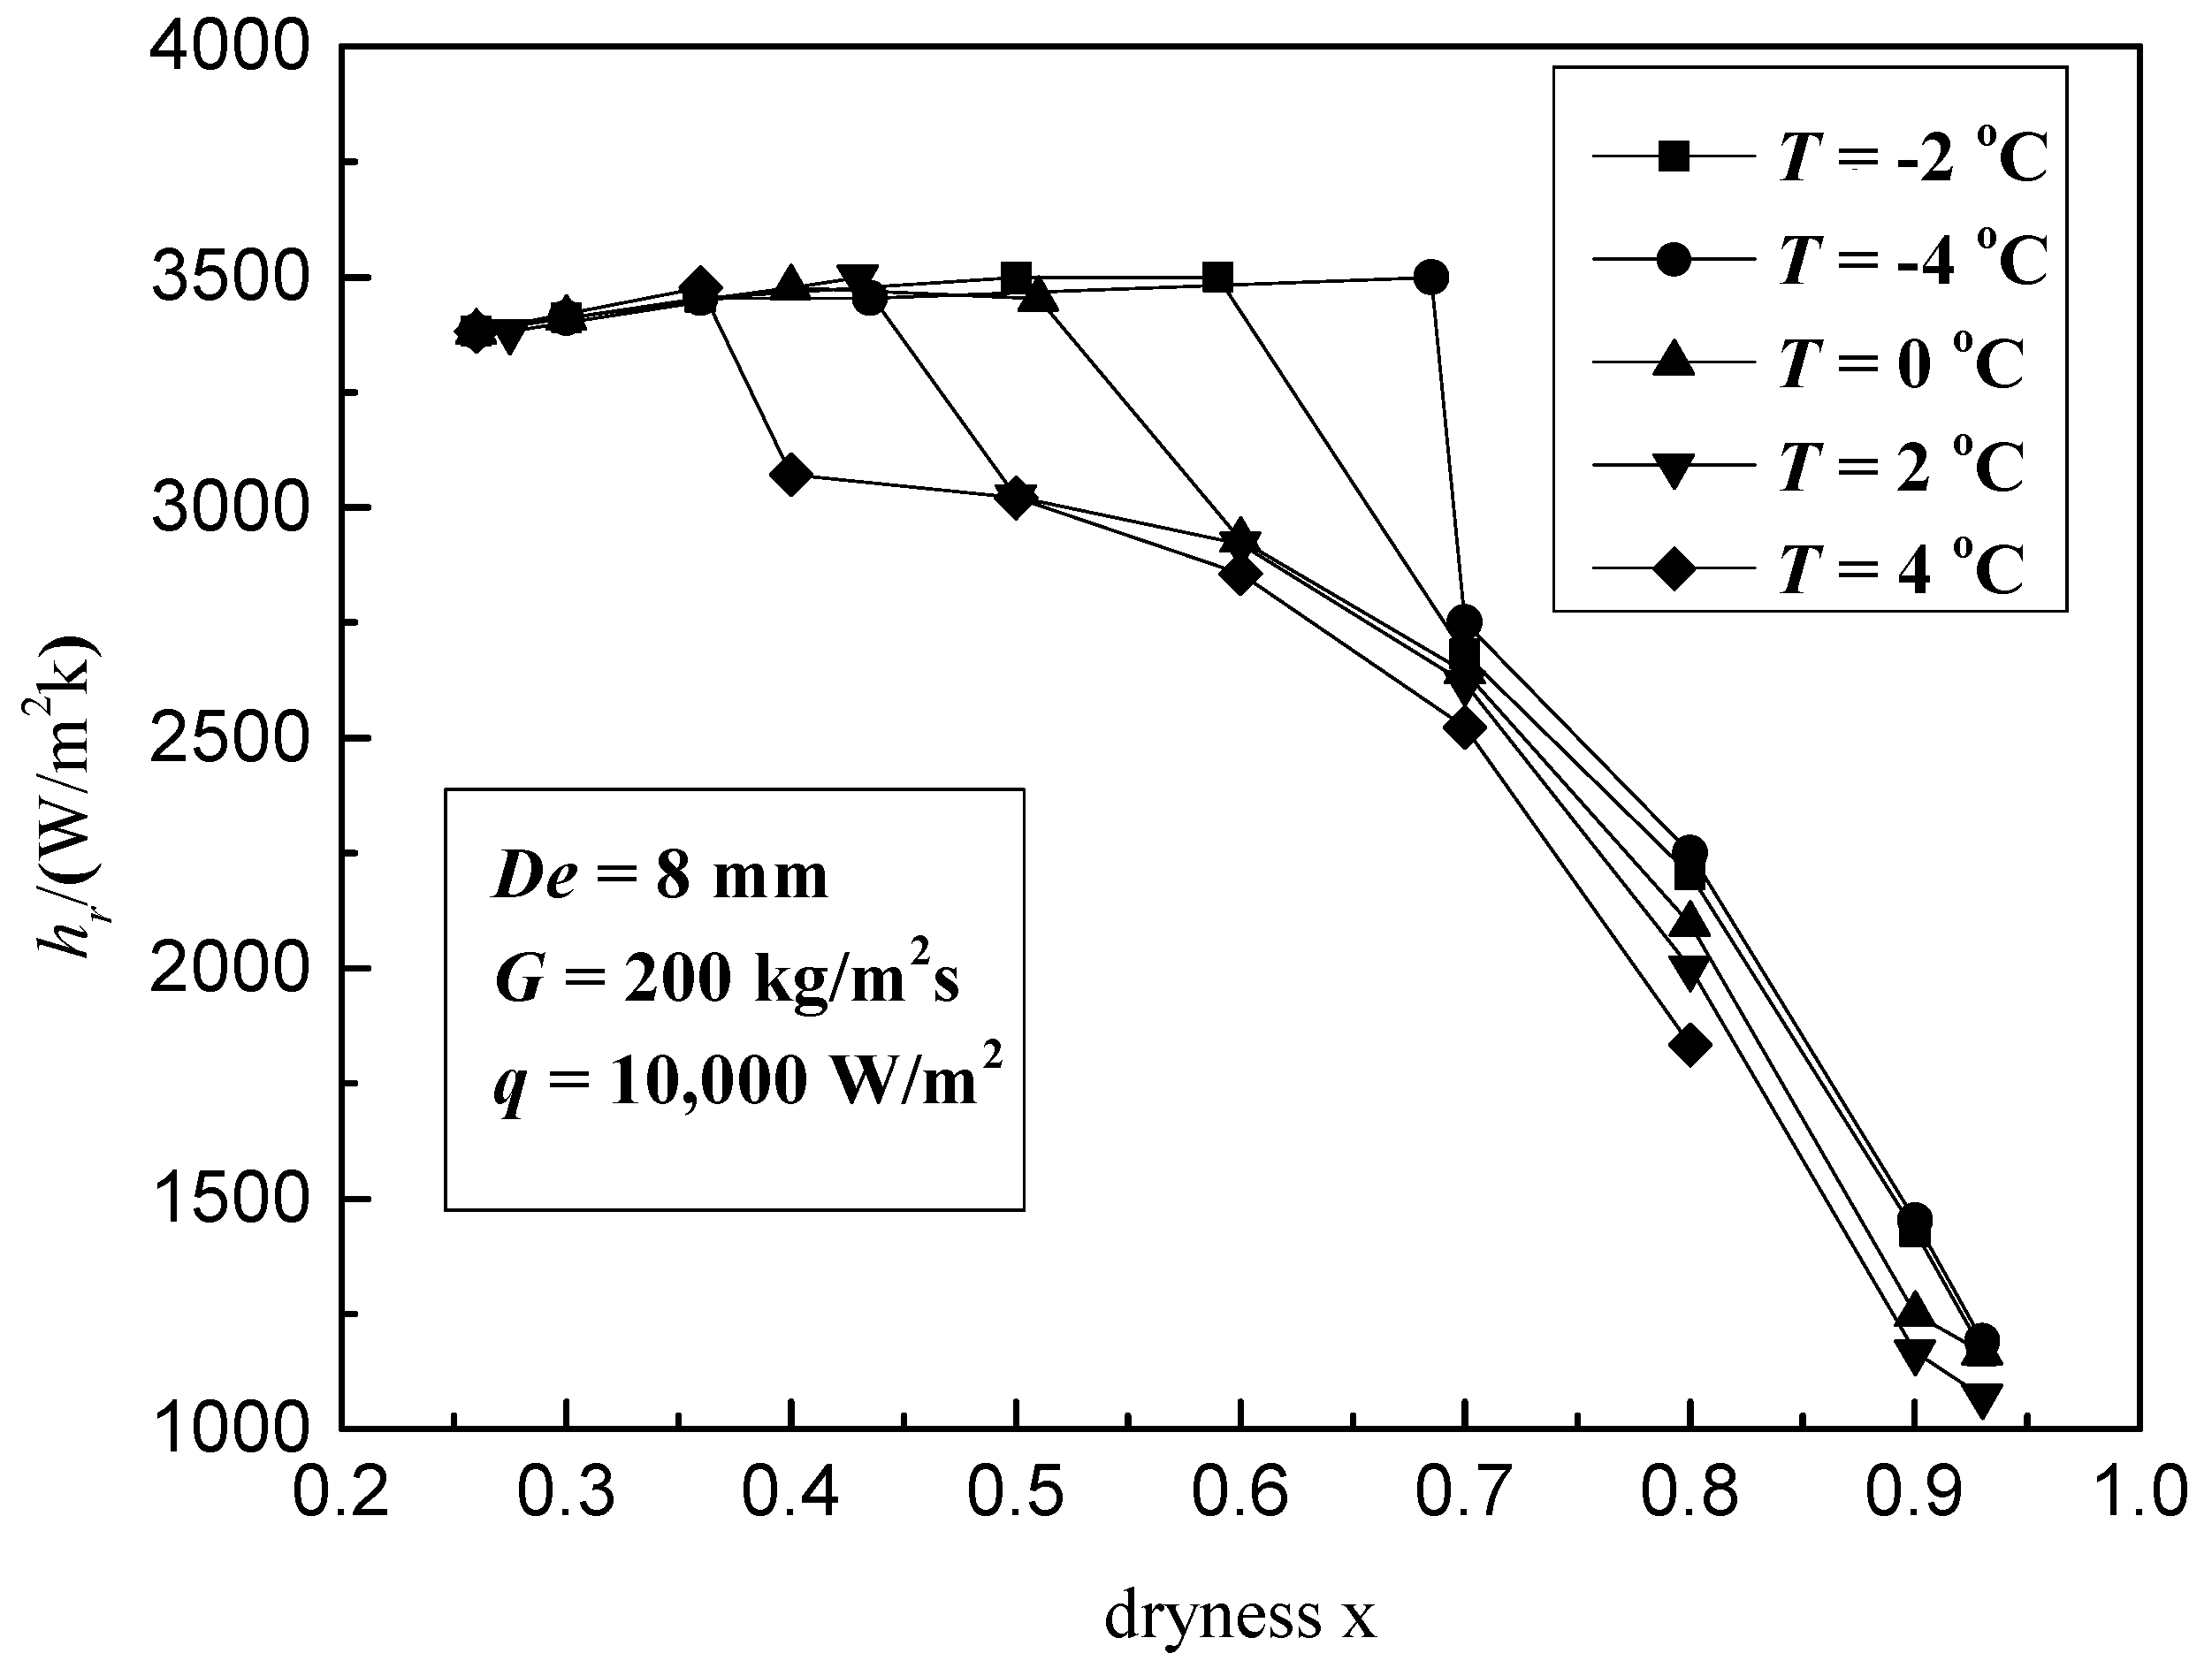
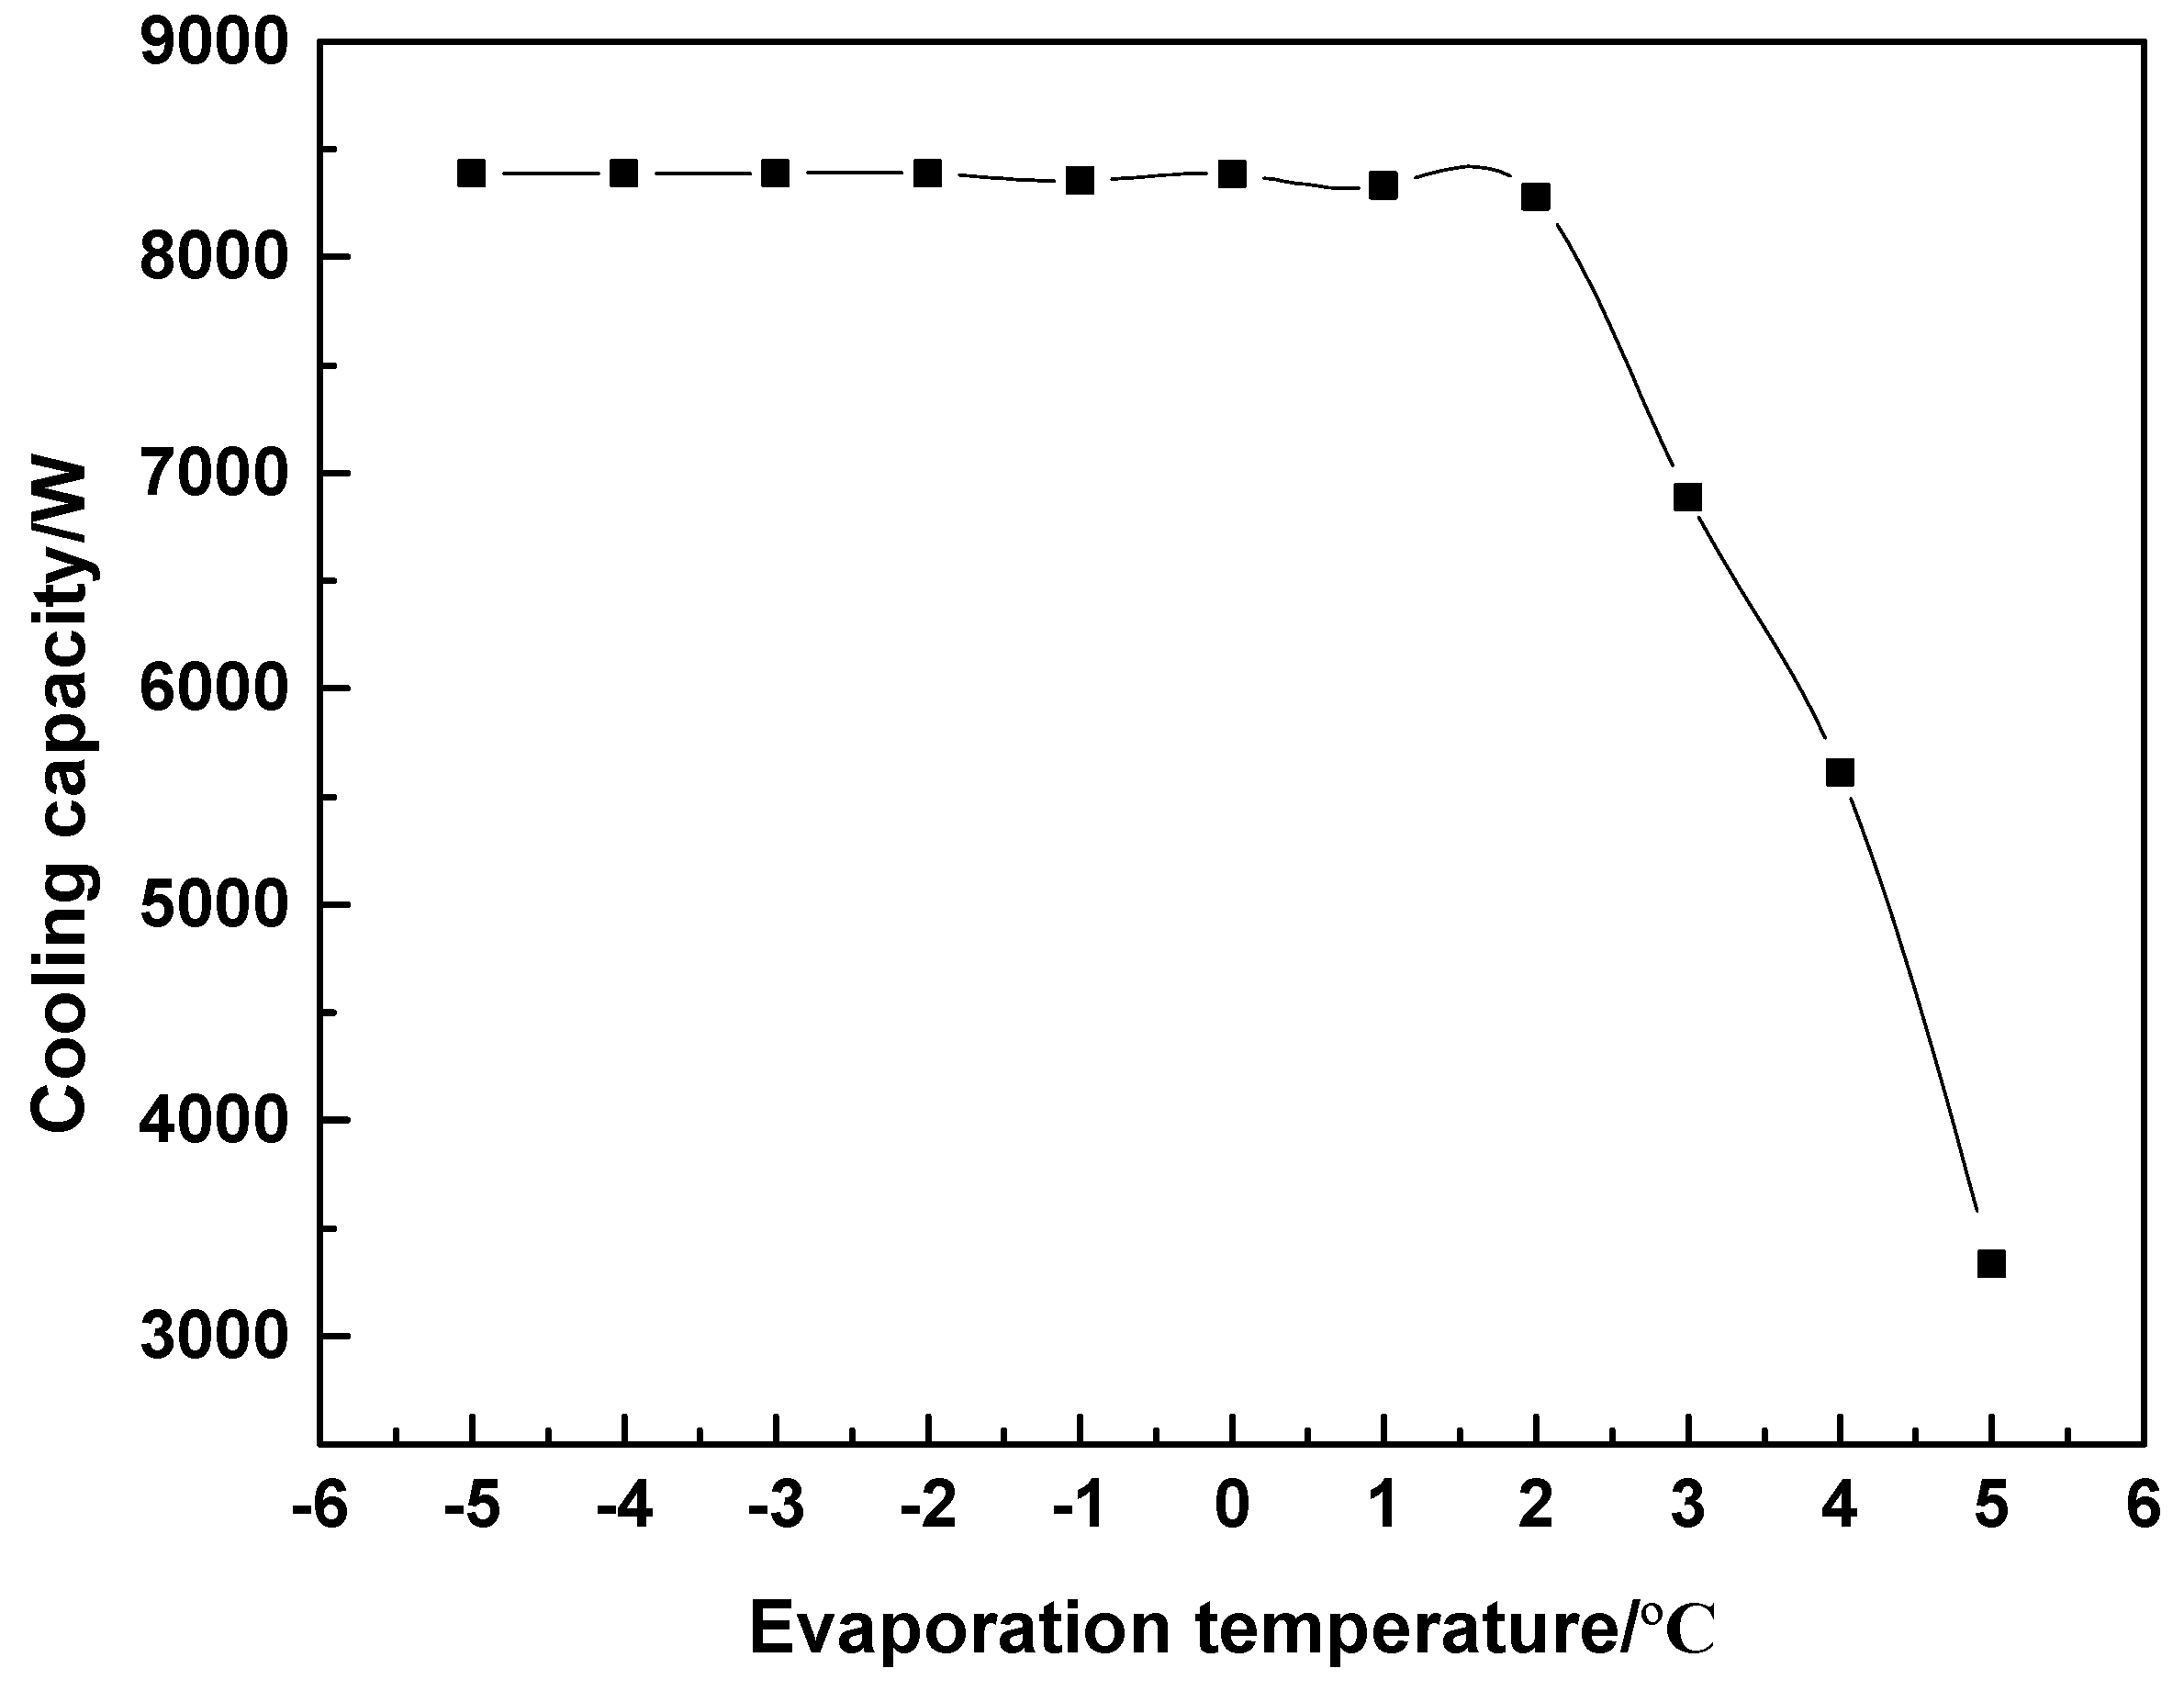
3.1. Effect of Evaporation Temperature

Figure 2 shows the impact of evaporation temperature on the CO2 heat coefficient. In the pre-dryout zone, hr varied slightly with T, since nuclear boiling is the main heat transfer mechanism. However, hr decreased with the increase in T in the post-dryout zone. This is due to the fact that the nuclear boiling heat transfer is converted to convective heat transfer. xcr was 0.685 for an evaporation temperature of −4 °C. However, the xcr of −2, 0, 2, and 4 °C was decreased by 13.87%, 25.55%, 37.23%, and 47.45% as compared with 0.685, respectively. This is due to the surface tension of the fluid and the liquid‒gas density ratio decreasing with increasing T, leading to the rupture of the liquid film on the pipe wall.
The cooling capacity, corresponding to 2 °C, decreased by 1.32% as compared to the −5 °C case, as shown in Figure 3. However, the cooling capacity at 5 °C decreased by 59.7% when compared to the 2 °C case. This was attributed to the decrease in the temperature difference between the refrigerant and the water with increasing T.

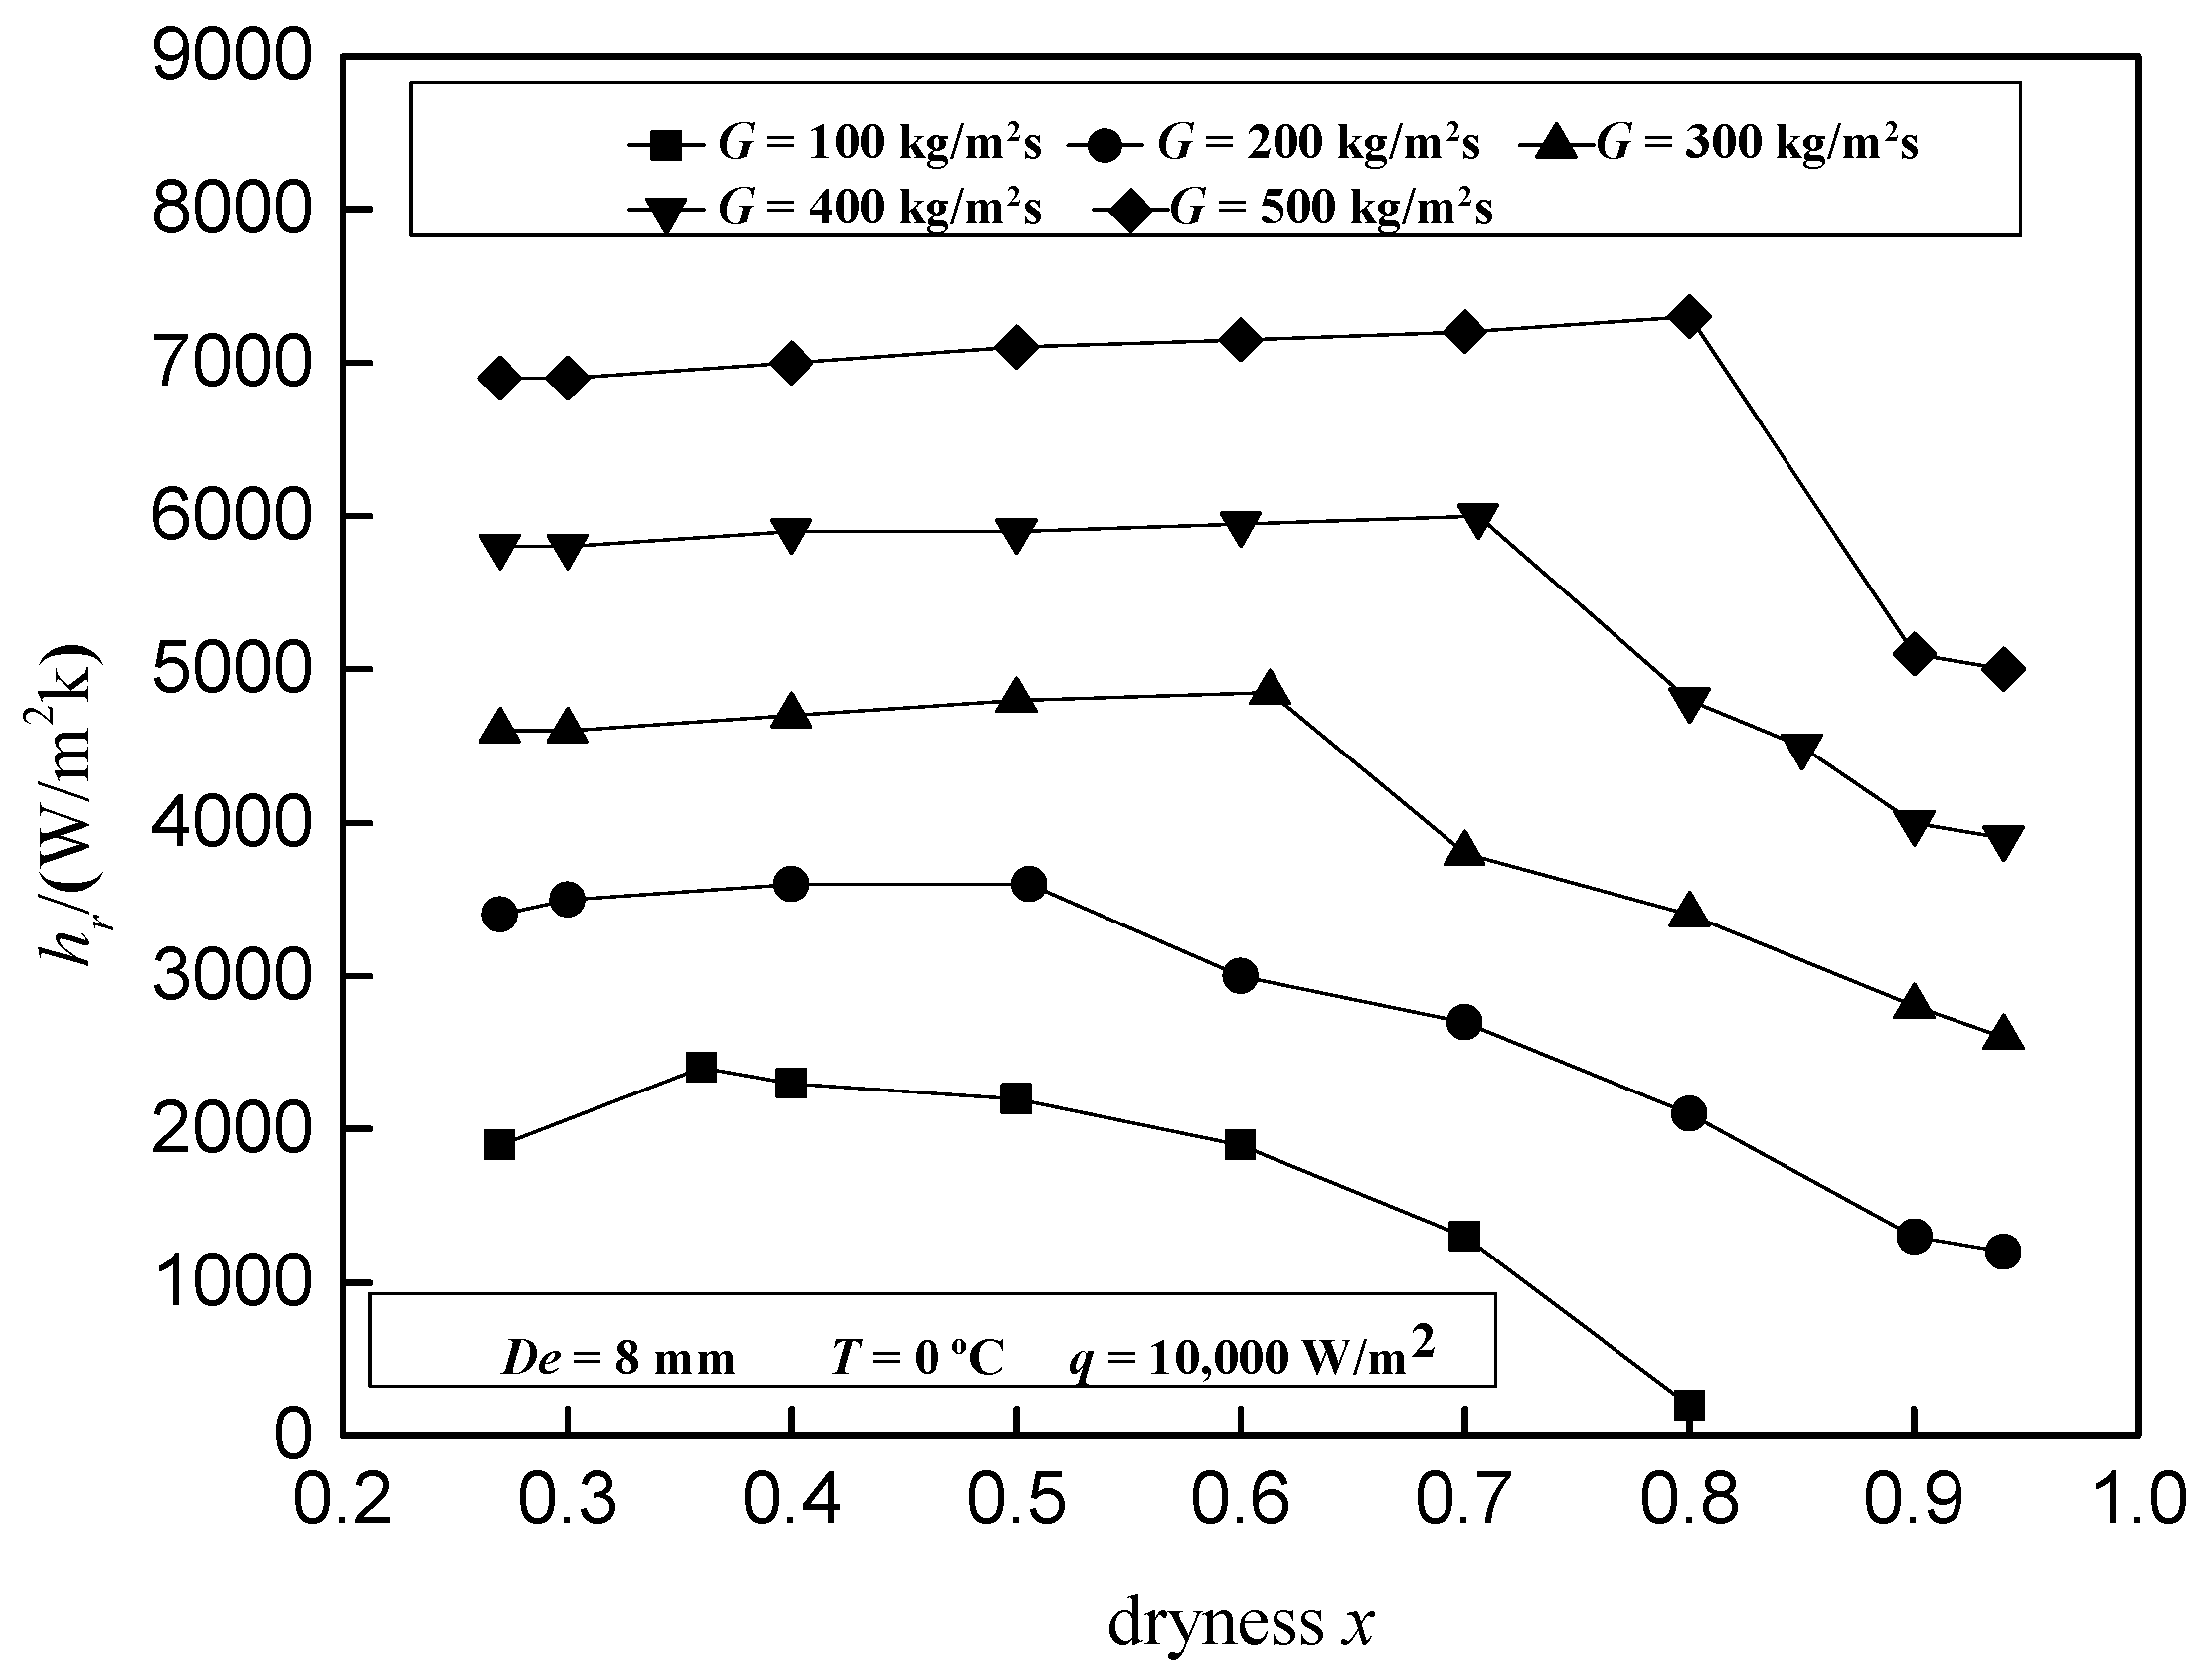
3.2. Effect of Mass Velocity

Figure 4 shows the impact of mass velocity (G) on the heat transfer coefficient (hr), where an increase of G resulted in an increase in hr. This is due to a high G value increasing the concentration of droplets in the vapor flow, which increases the collisions between the droplets and the wall. The xcr was 0.36 when G was 100 kg/m2s; the xcr increased by 40.5%, 70.3%, 95.8%, and 122% for 200, 300, 400, and 500 kg/m2s, respectively, which thereby confirms that xcr is sensitive to G. This is explained by the fact that the concentration of liquid droplets in the vapor flow increased under the effect of large G. The collision between the droplets and the wall increased, which causes a slow reduction in the thickness of the liquid film until the appearance of dry zones on the wall. In the post-dryout zone, hr decreased with the increase in x. This can be explained by the fact that convective heat transfer is the dominant mechanism when there is high vapor quality, CO2 primarily exists as a gas, and the nuclear boiling is suppressed. As can be seen from Figure 5a, the maximum cooling capacity was obtained when G was 500 kg/m2s. This was due to the mass velocity being too high to allow the fluid to adequately perform the heat transfer. As can be seen from Figure 5b, the cooling capacity increases with increasing tube length at the same mass velocity. This is due to the increased fluid flow time over a larger tube length under the same operating conditions.

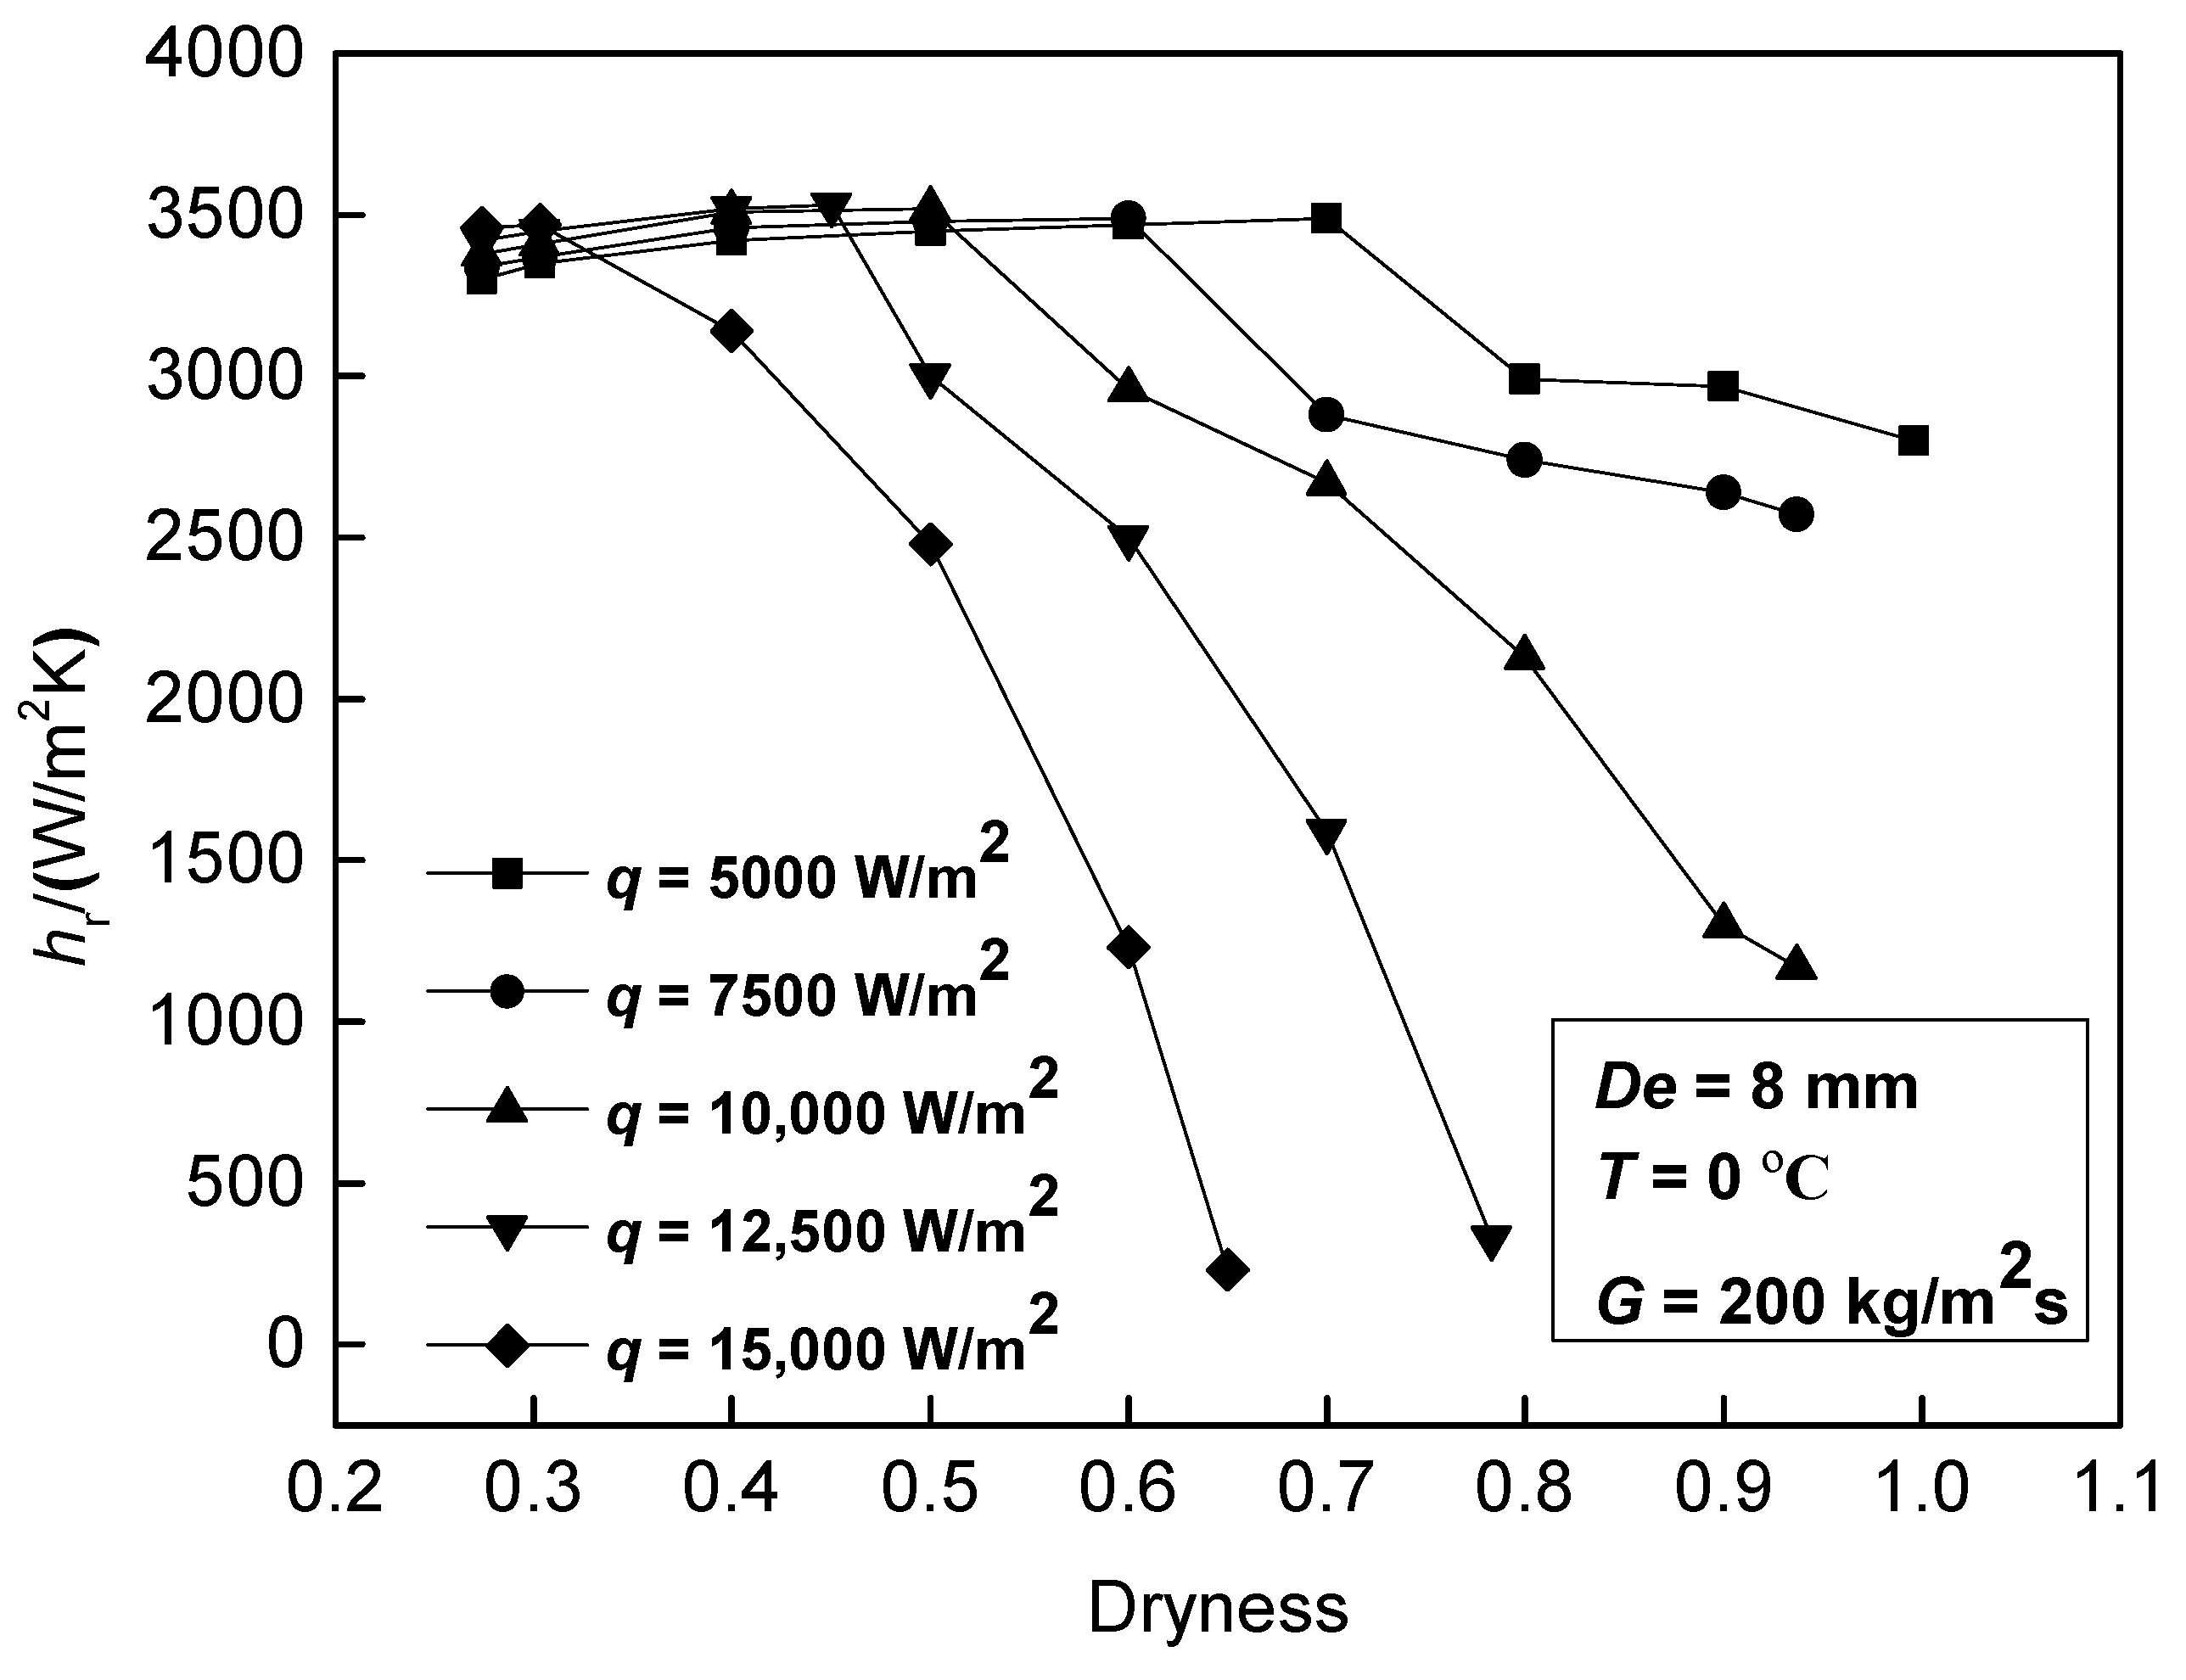
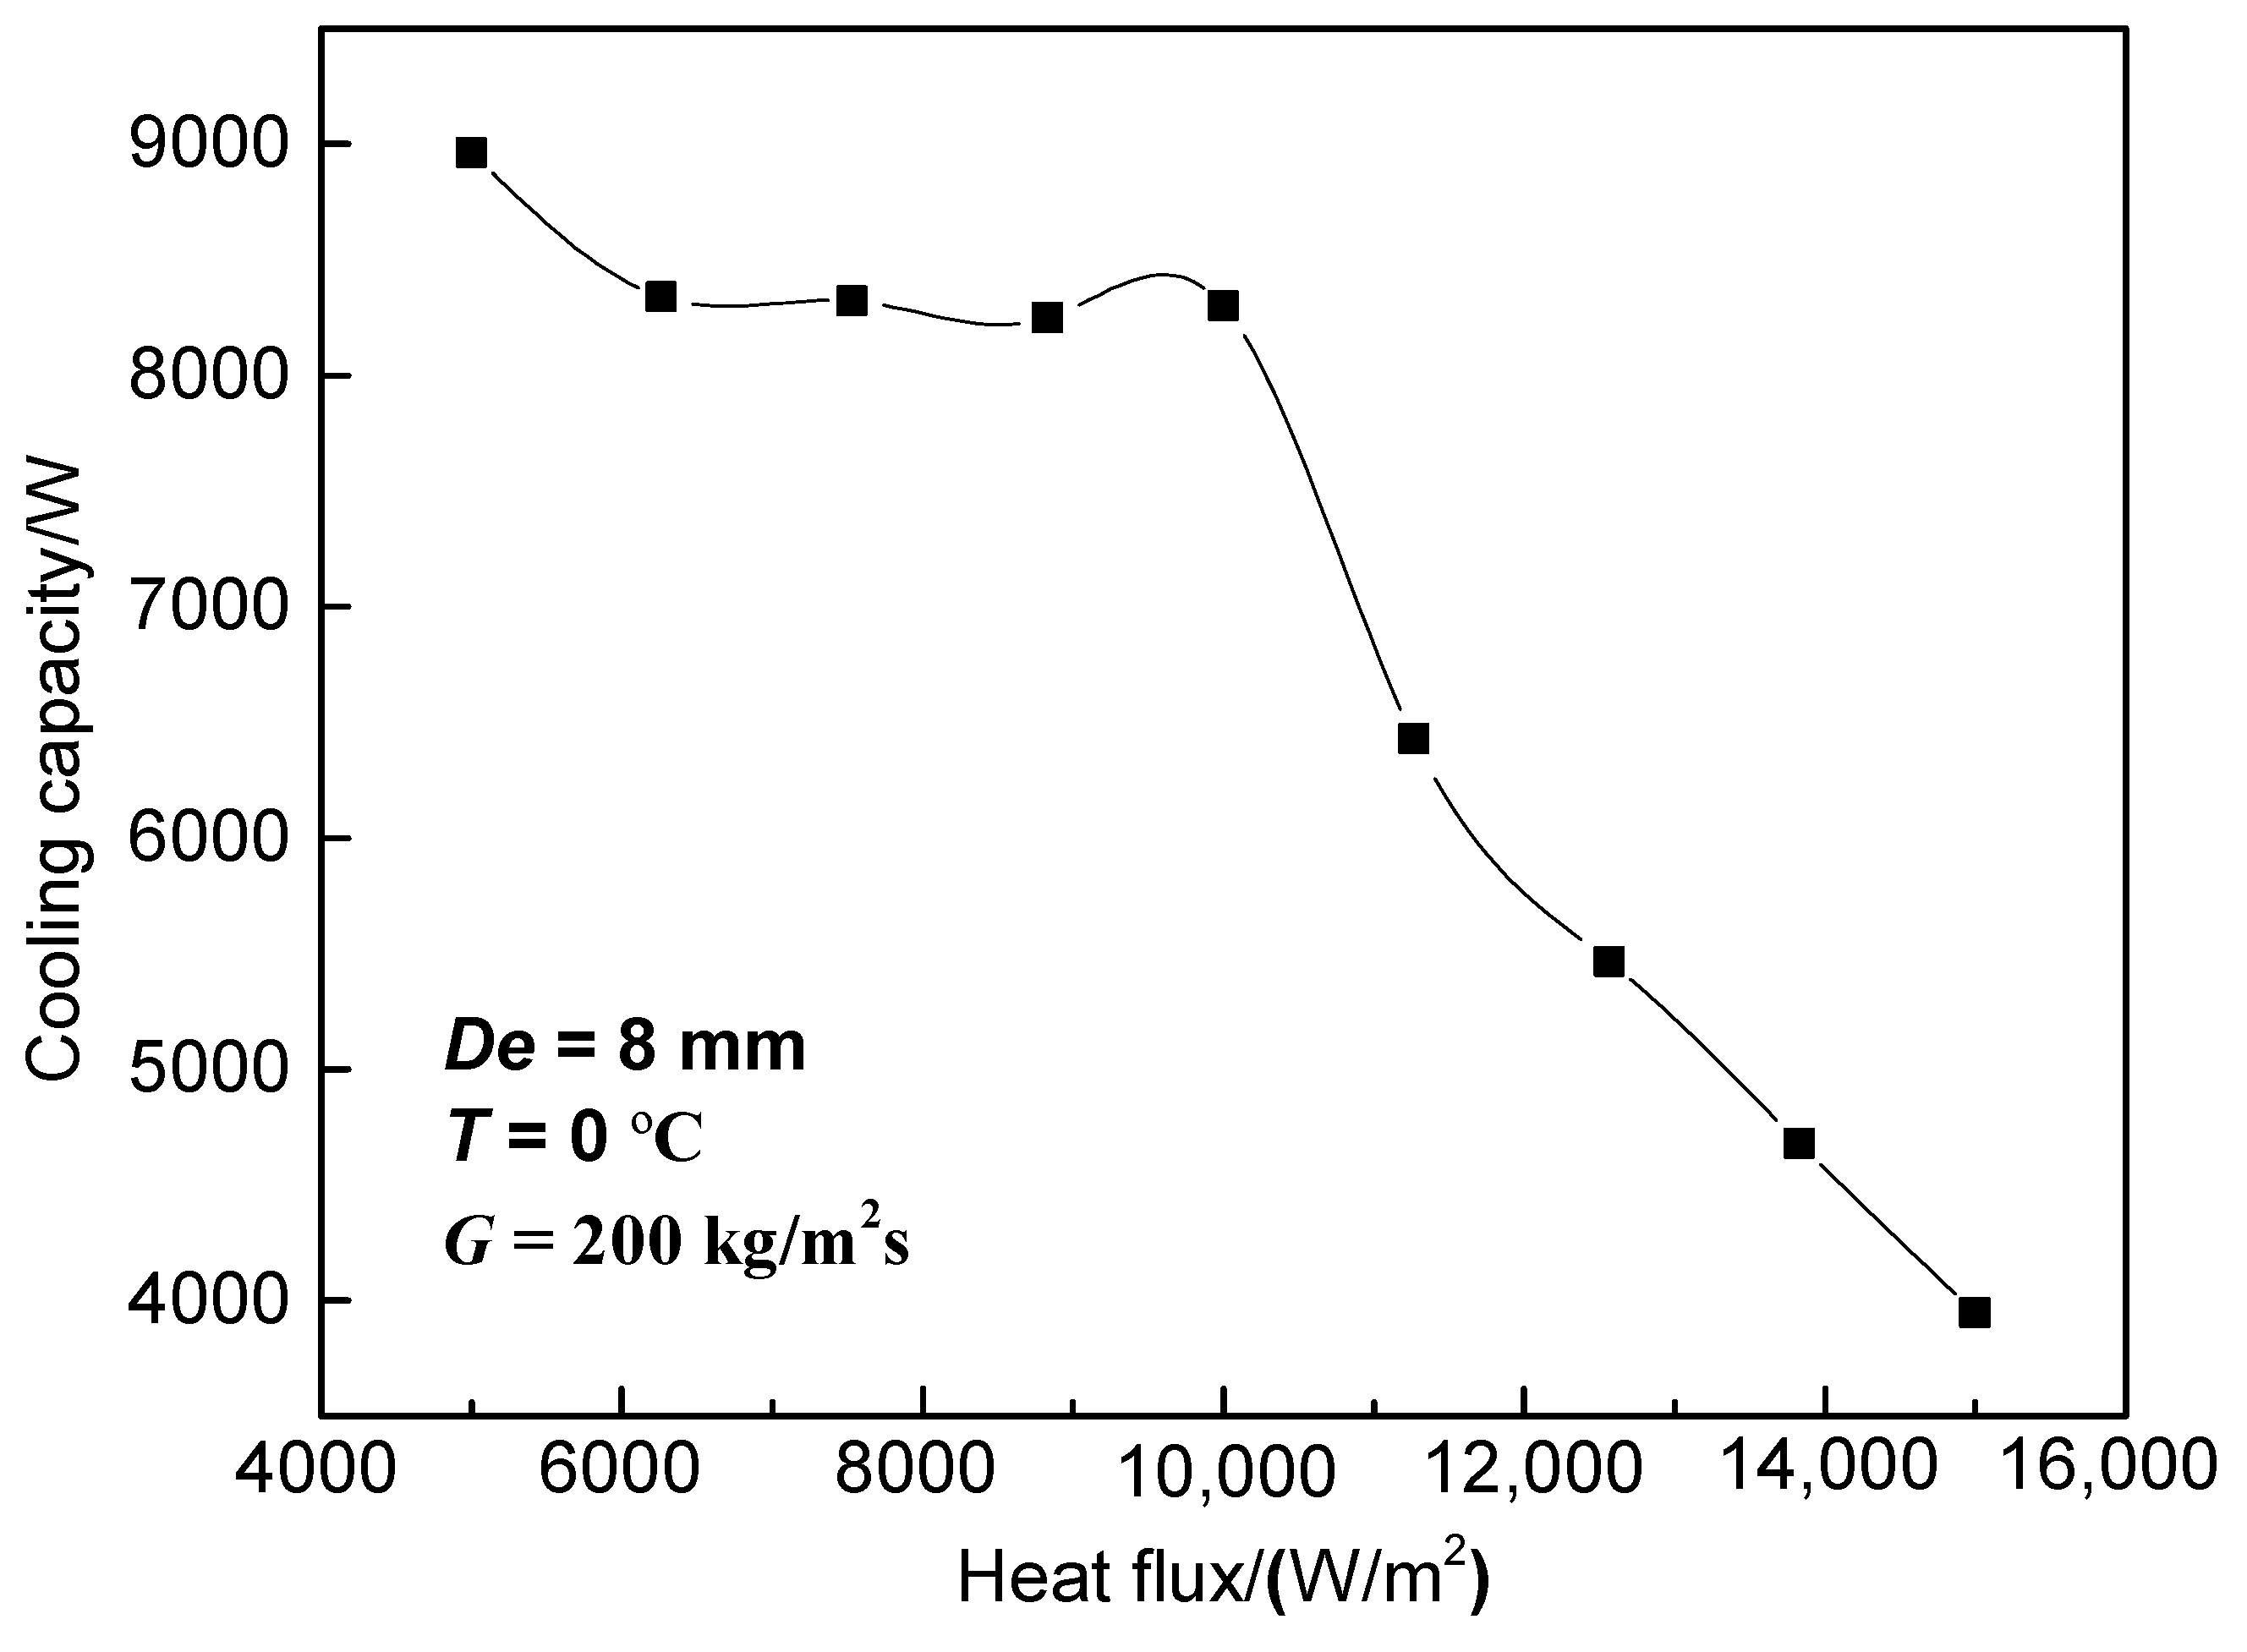
3.3. Effect of Heat Flux

Figure 6 shows the effect of heat flux (q) on heat transfer. In the pre-dryout zone, hr remained unchanged by the heat flux due to the heat transfer mechanism of nuclear boiling. However, hr and xcr decreased with increasing heat flux. xcr was 0.7 when q was 5000 W/m2, and then the xcr decreased by 14.3%, 28.6%, 35.7%, and 42.9% for 7500, 10,000, 12,500, and 15,000 W/m2, respectively. This was due to the heat transfer mechanism changing from nuclear boiling to convective heat transfer, resulting in a rapid decrease in the heat transfer coefficient. xcr decreased with increasing heat flux due to the evaporation of liquid film intensifying with increasing heat flux, and the liquid film on the wall of the pipe eventually evaporates and dryout occurs. Nuclear boiling is inhibited and the heat transfer coefficient gradually decreases in the high vapor quality region. At this point, heat flux has a weaker influence on the heat transfer coefficient, which led to the change in fluid from annular flow to mist flow.
As a result, the heat transfer deteriorated. As can be seen from Figure 7, the maximum cooling capacity of 9 kW was obtained when q was 5 kW/m2. This is due to the heat exchange area before drying being larger when q was smaller.

4. CO2 Double-Pipe Evaporator Model

It is necessary to study the influence of tube diameter on the pre-dryout and dryout regions by establishing a model in order to delay dryout and determine the range of the pipe diameter.

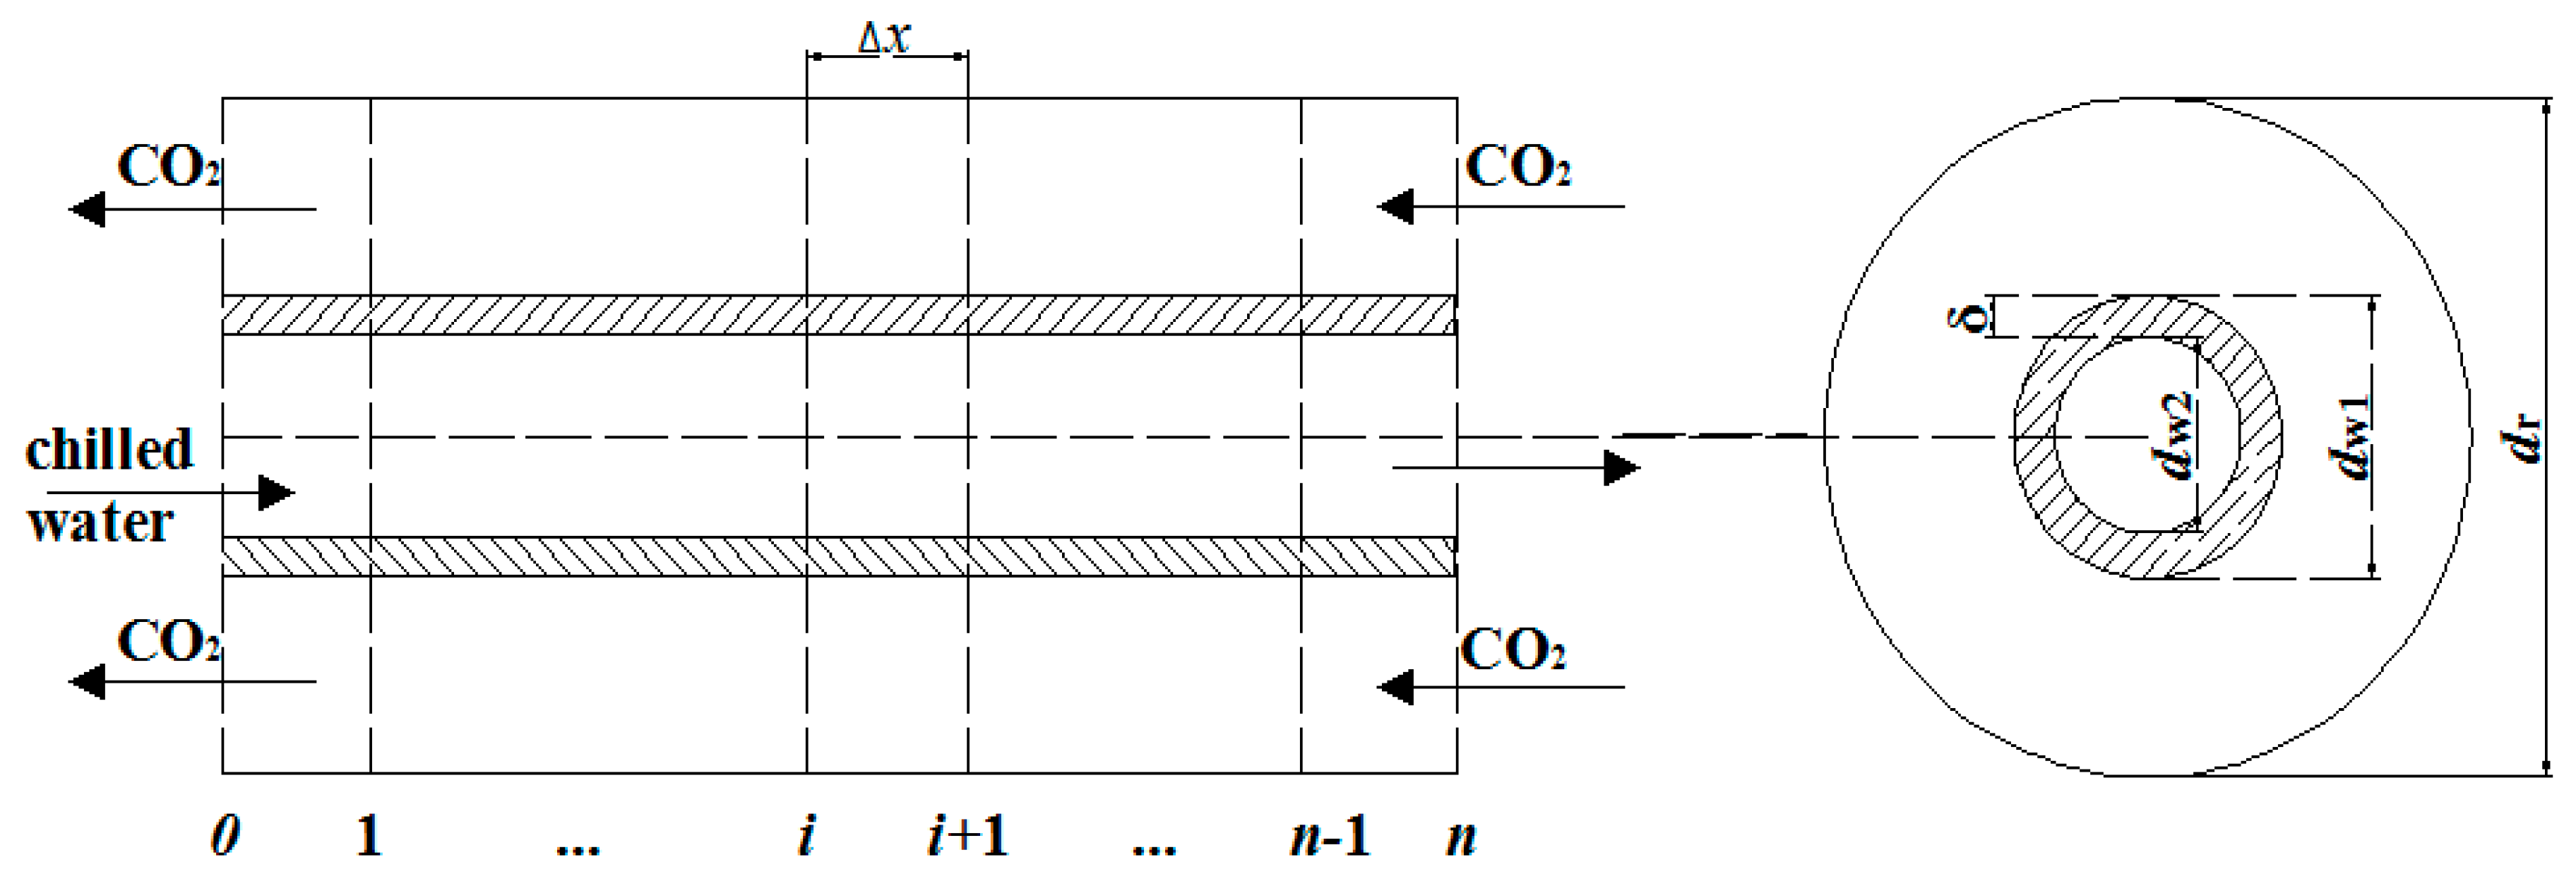
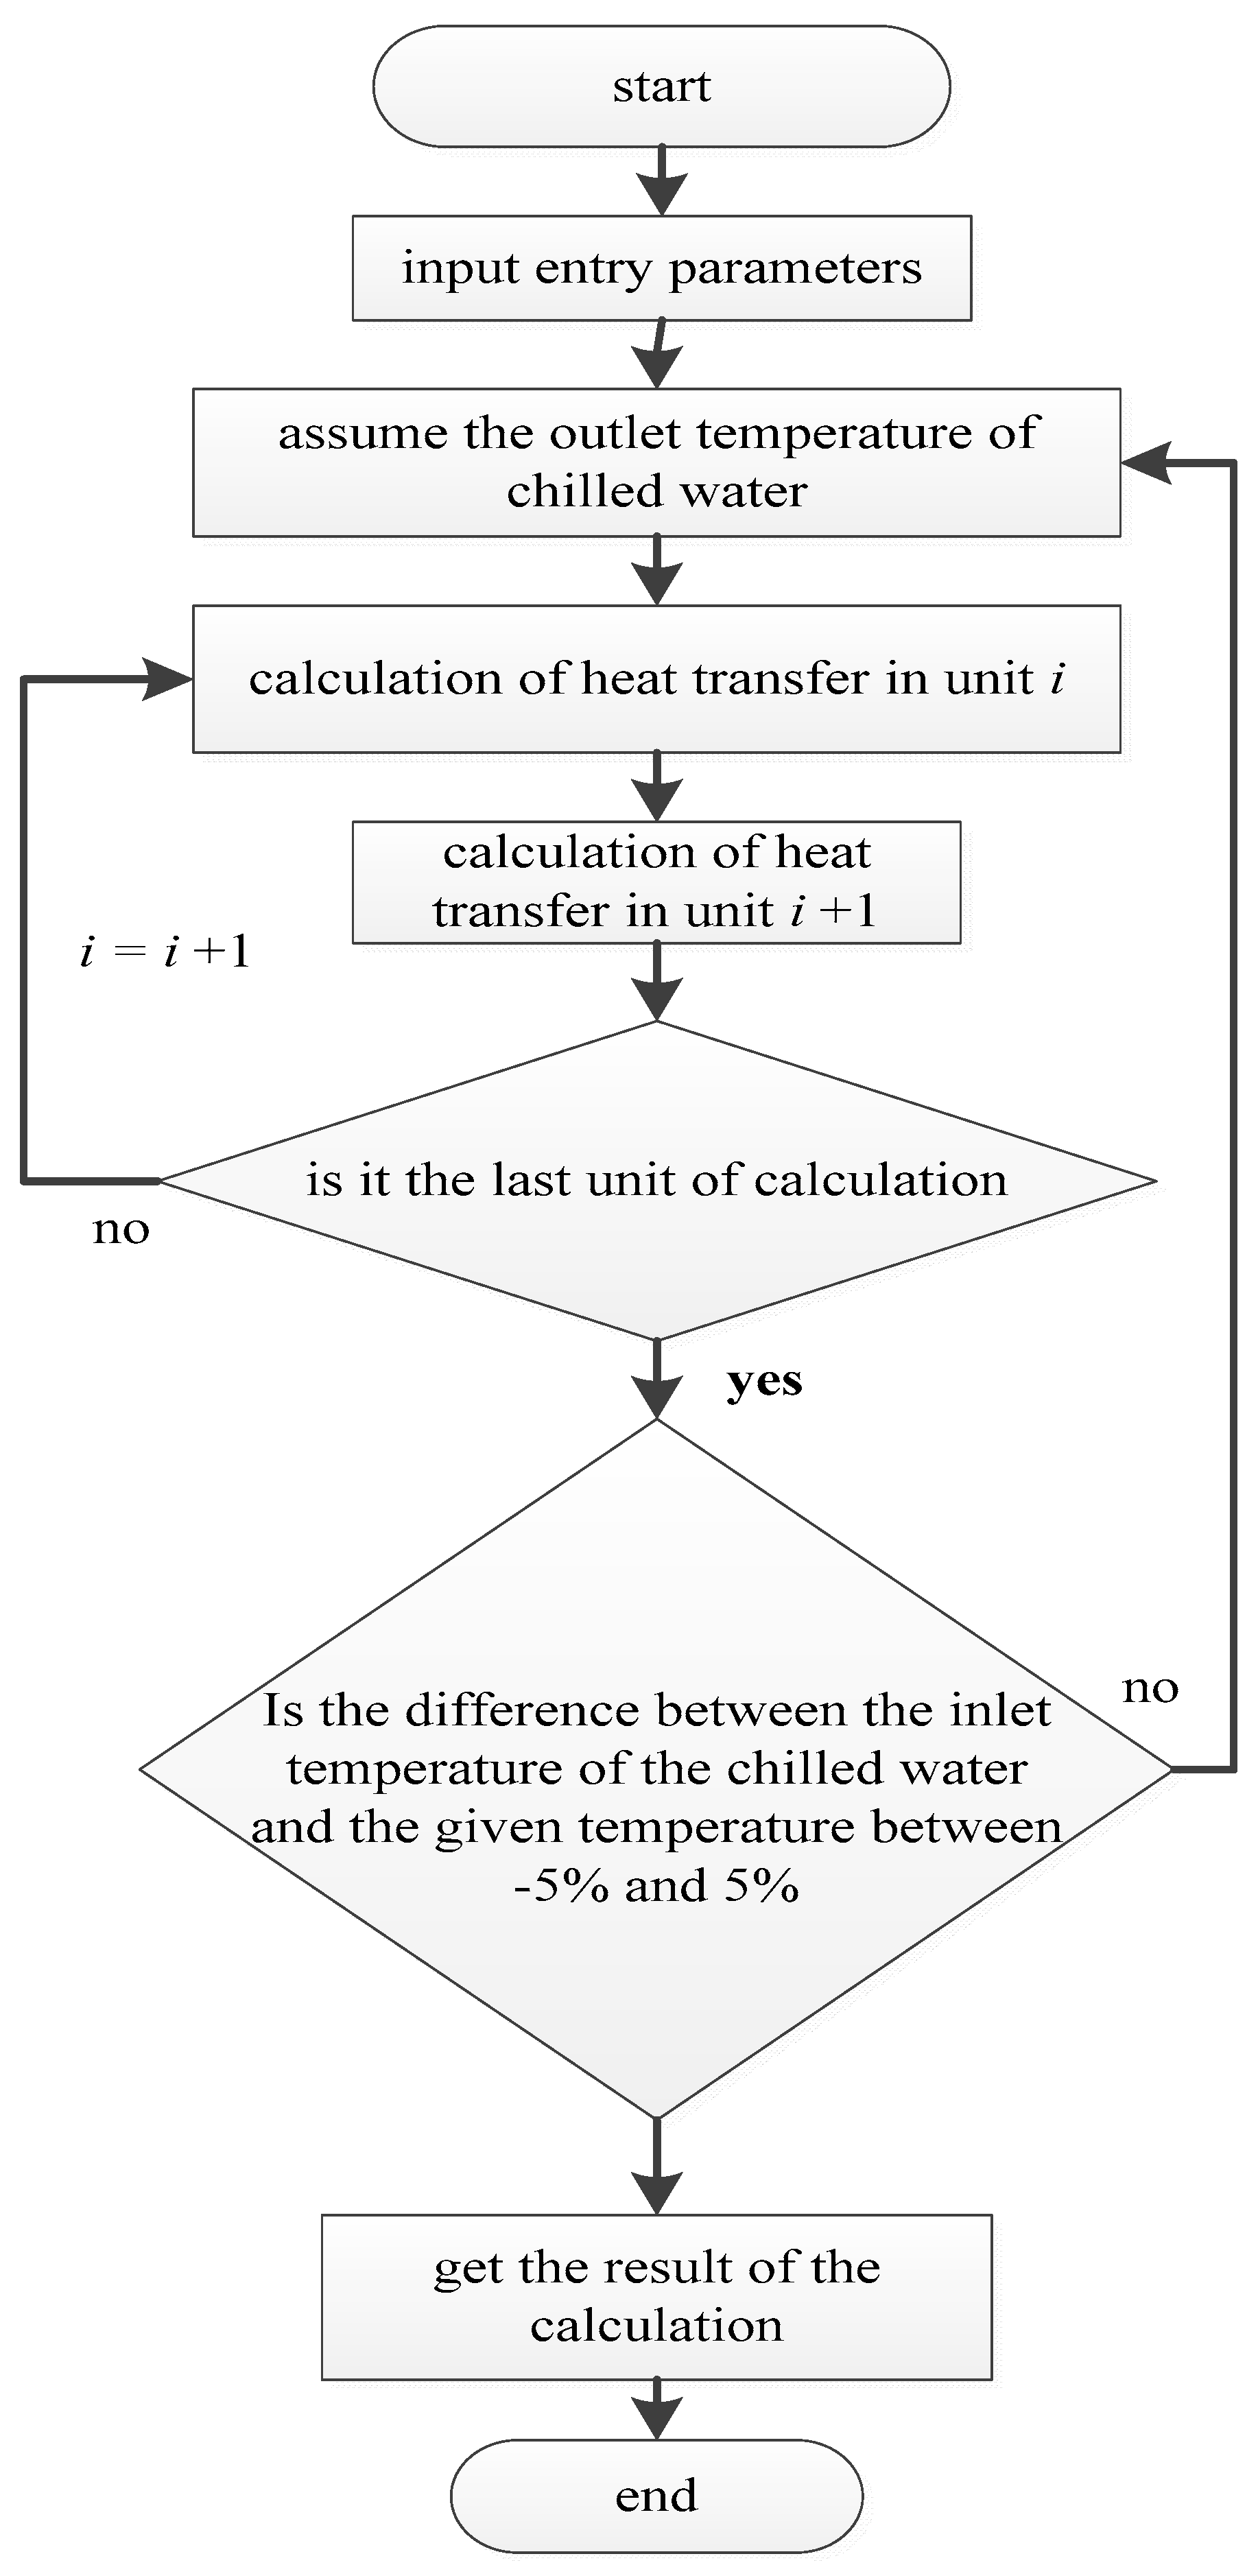
4.1. Establishment of a CO2 Double-Pipe Evaporator Model

The steady-state distributed-parameter method was used to establish the CO2 double-pipe evaporator. As shown in Figure 8, CO2 and chilled water flowed outside and inside the tube, respectively. The evaporator was divided into n controlled volume elements along the pipe length, and each part included CO2 fluid, chilled water, and the pipe wall. For the governing equations of the various parts in the micro-element, the flow of fluid in the inner and outer tubes is regarded as one-dimensional flow [26]. The changes in fluid conductivity, fluid density, and specific heat as compared to those of CO2 are negligible when the oil concentration is small [27]. In addition, as long as a separate liquid CO2 phase exists, the saturated temperature of the CO2‒oil mixture is assumed to be equivalent to that of pure CO2 and the properties of the CO2‒oil mixture are the same as those of pure CO2 [27]. The aim of this simulation is to meet the requirement that the length to diameter ratio of the pipeline be greater than 70, that is L/d > 70, and thus the inlet effect is not required in determining the heat transfer characteristics of the fully developed fluid [28,29]. The steady-state distributed-parameter model was based on the following assumptions:
(1)
The flow of fluid in the inner and outer tubes was regarded as one-dimensional flow [26].
(2)
The outer wall was considered to be adiabatic without considering leakage heat loss.
(3)
The loss of water-side pressure drop in the evaporator and the momentum equation were not considered.
(4)
When the refrigerants underwent phase transition, the two phases of the fluid were in a state of thermal equilibrium.
(5)
The effect of the lubricating oil and other substances on all heat transfer processes was not considered [27].
For each microelement, the heat absorption on the refrigerant side, the heat release on the chilled water side, and the total heat transfer of the evaporator were the same. The heat transfer temperature difference in the microelement was calculated by the logarithmic mean temperature difference method. The heat transfer characteristics are calculated with Equations (4)–(11) according to thermodynamics and Li’s research [24].
The refrigerant-side energy is calculated by
Q r , n = m r ( h r o , n h r i , n )
The energy equation of the chilled water-side is calculated by
Q w , n = c p w × m w × ( t w i , n t w o , n )
Total heat transfer in evaporator is calculated by
Q n = K n × A n × Δ t n
The energy conservation equation of each part is calculated by
Q r , n = Q w , n = Q n
The total heat transfer coefficient equation is calculated by
K n = 1 ( 1 h r , n + γ w ) + δ λ ln d w 1 d m + ( 1 h w + γ r ) d w 1 d w 2
Logarithmic mean temperature difference is expressed, as follows:
Δ t n = Δ t 1 , n Δ t 2 , n ln ( Δ t 1 , n Δ t 2 , n )
Δ t 1 , n = t w i , n t w o , n
Δ t 2 , n = t w o , n t r i , n
The water-side heat transfer coefficient is calculated as follows [25]:
h w = N u w λ w d w i
N u = 0.023 R e 0.8 P r 0.3
The correlation form established by Yoon [30] is used for the calculation of the CO2-side heat transfer coefficient since the equivalent diameter of the model established in this paper belongs to the range of conventional pipe diameters. The heat transfer coefficient of pre-dryout is expressed, as follows:
h r , n = ( E h l ) 2 + ( S h p o o l ) 2
E = [ 1 + 9.36 × 10 3 x Pr l ( ρ l ρ g 1 ) ] 0.11
S = 1 1 + 1.62 × 10 6 E 0.69 Re l 1.11
The heat transfer coefficient of post-dryout is expressed, as follows:
h r , n = θ d r y h g + ( 2 π θ d r y ) h w e t 2 π
h w e t = E h l
E = 1 + 3000 B o 0.86 + 1.12 ( x 1 x ) 0.75 ( ρ l ρ g ) 0.41
The corresponding pipe lengths in the two regions were recorded as L1 and L2. The mass quality corresponding to dryout (xcr) is expressed, as follows [29]:
x c r = 38.27 Re l 2.12 ( 1000 B o ) 1.64 B d 4.7
Bo is the boiling number. Bd is the Bond number, which is calculated, as follows [29]:
B d = g ( ρ l ρ g ) D e σ
De is the hydraulic diameter. L1 and L2 are calculated, as follows:
L 1 = A c r π D e
L = A π D e
L 2 = L L 1
Acr is the heat exchange area when the mass quality is xcr. L is the total tube length, m. The parameter α is defined, as follows:
α = L 1 / L
This parameter indicates the proportion of the dryout stage to the entire heat transfer stage, where a larger value of α is desirable.
This model utilized the Matlab package for programming and calculation. The input was divided into three categories: the structural parameters of the evaporator, such as pipe length and diameter; the refrigerant import and export parameters, such as mass flux, evaporation temperature, and pressure; and, the import and export parameters of chilled water, such as flow rate, pressure, and temperature. First, the outlet temperature of chilled water was assumed to calculate the inlet temperature of chilled water, until the difference between the inlet temperature and the given temperature was between −5% and 5%.
Figure 9 shows a flowchart of the simulation.

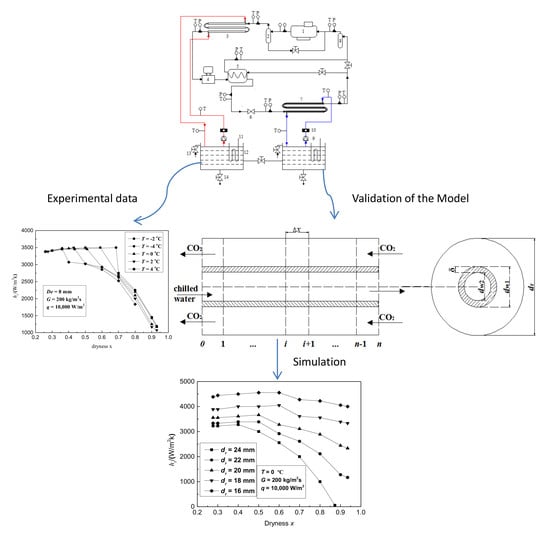
4.2. Validation of the Model

The simulation values of hr and pressure were compared with the experimental results in order to verify the accuracy of the model, as shown in Figure 10. The RE is calculated, as follows:
RE = |   s i m u l a t i o n   v a l u e e x p e r i m e n t a l   v a l u e   | e x p e r i m e n t a l   v a l u e × 100 %
Figure 10a shows the effects of the chilled water flow rate on the heat transfer. The heat transfer coefficient was found to proportionally increase with the increase in the chilled water flow rate. As can be seen from Figure 10a, the simulation value is slightly higher than the experimental value. This was attributed to variations in the experimental conditions. The temperature continued to decrease although there was an electric heating wire in the chilled water tank to maintain the constant temperature of the chilled water, which resulted in a decrease in the heat transfer temperature difference, resulting in decreased heat transfer. With the increase in the evaporation temperature, both the simulation value and the experimental value of the average heat transfer coefficient exhibited lower fluctuations, as shown in Figure 10b. When the evaporation temperature is −1 °C, RE showed a minimum value of 4.41%. When the evaporation temperature was 1 °C, RE showed a maximum value of 5.94% with a 5.21% mean value. Figure 10c shows the effects of the chilled water inlet temperature on the CO2 pressure drop. The pressure drop was found to increase proportionally with the increase in the chilled water inlet temperature. When the chilled water inlet temperature was 12 °C, RE has a maximum value of 4.57% and a mean of 3.78%.
This model is used to simulate and analyze the performance of a double-pipe evaporator designed for CO2 transcritical systems since the overall trend of experimental and simulated values is consistent.

5. Simulation Results and Discussion

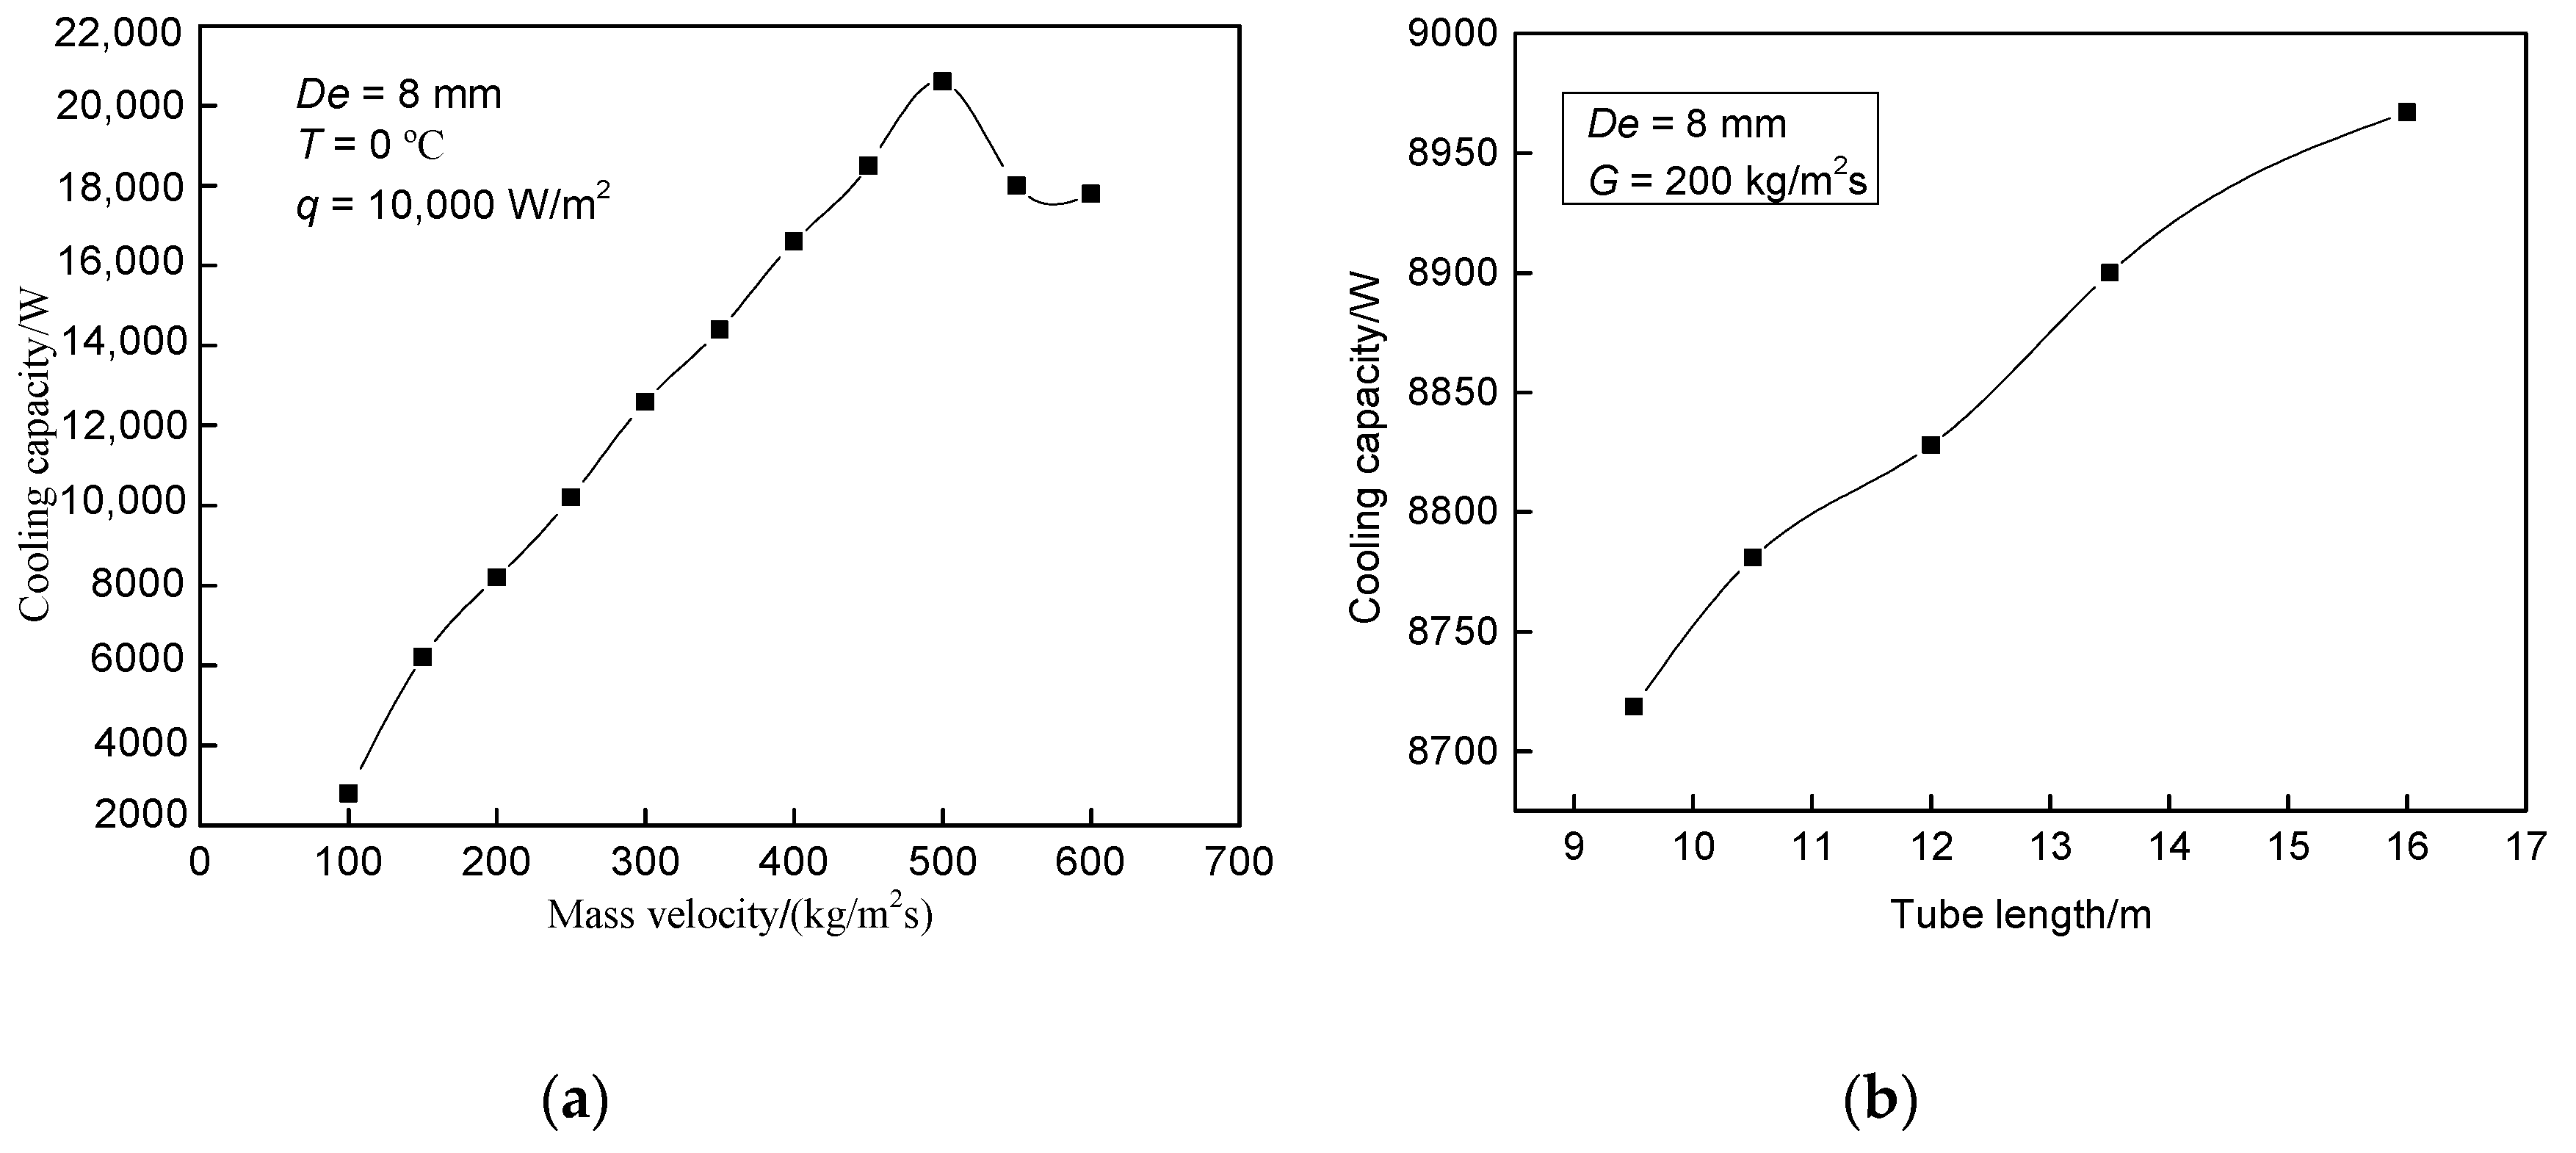
5.1. Effect of Outer Tube Diameter

Figure 11 shows the influence of CO2 side diameter on heat transfer, where hr and xcr were observed to increase with decreasing diameter, although the drop rate of the hr gradually decreased. hr increased by 38.9% and xcr increased by 50%. This shows that the smaller the outer tube diameter, the higher the heat transfer coefficient and the greater the xcr. This is due to the cross-sectional area of the outer tube decreasing with the decrease in diameter, which resulted in more contact between the CO2 fluid and the tube wall; smaller diameters promote nuclear boiling heat transfer. The heat transfer coefficient of the smaller pipe diameter slowly decreases as x increases in the post-dryout zone. This can be explained by the fact that the convective heat transfer is the main mechanism in the post-dryout zone, and the flow velocity of the working fluid increases with the decrease in the pipe diameter, which enhances the convective heat transfer in the small pipe diameter.
Table 4 shows a comparison of the α of each heat transfer process under different dr. α decreased with increasing dr, as is evident from Table 4. L1 accounted for 67% of the L (3 m) when dr was 17 mm; the cooling capacity was 9846.2 W, as seen in Figure 12. The cooling capacity decreased with an increase in dr, which is also evident from Figure 12. This was due to dr being too large to allow the fluid to make full contact with the wall, causing a reduction in the effective heat transfer area. In addition, under the same operating conditions, the flow velocity of the fluid decreases as the diameter of the pipe increases, so the amount of heat exchange decreases.

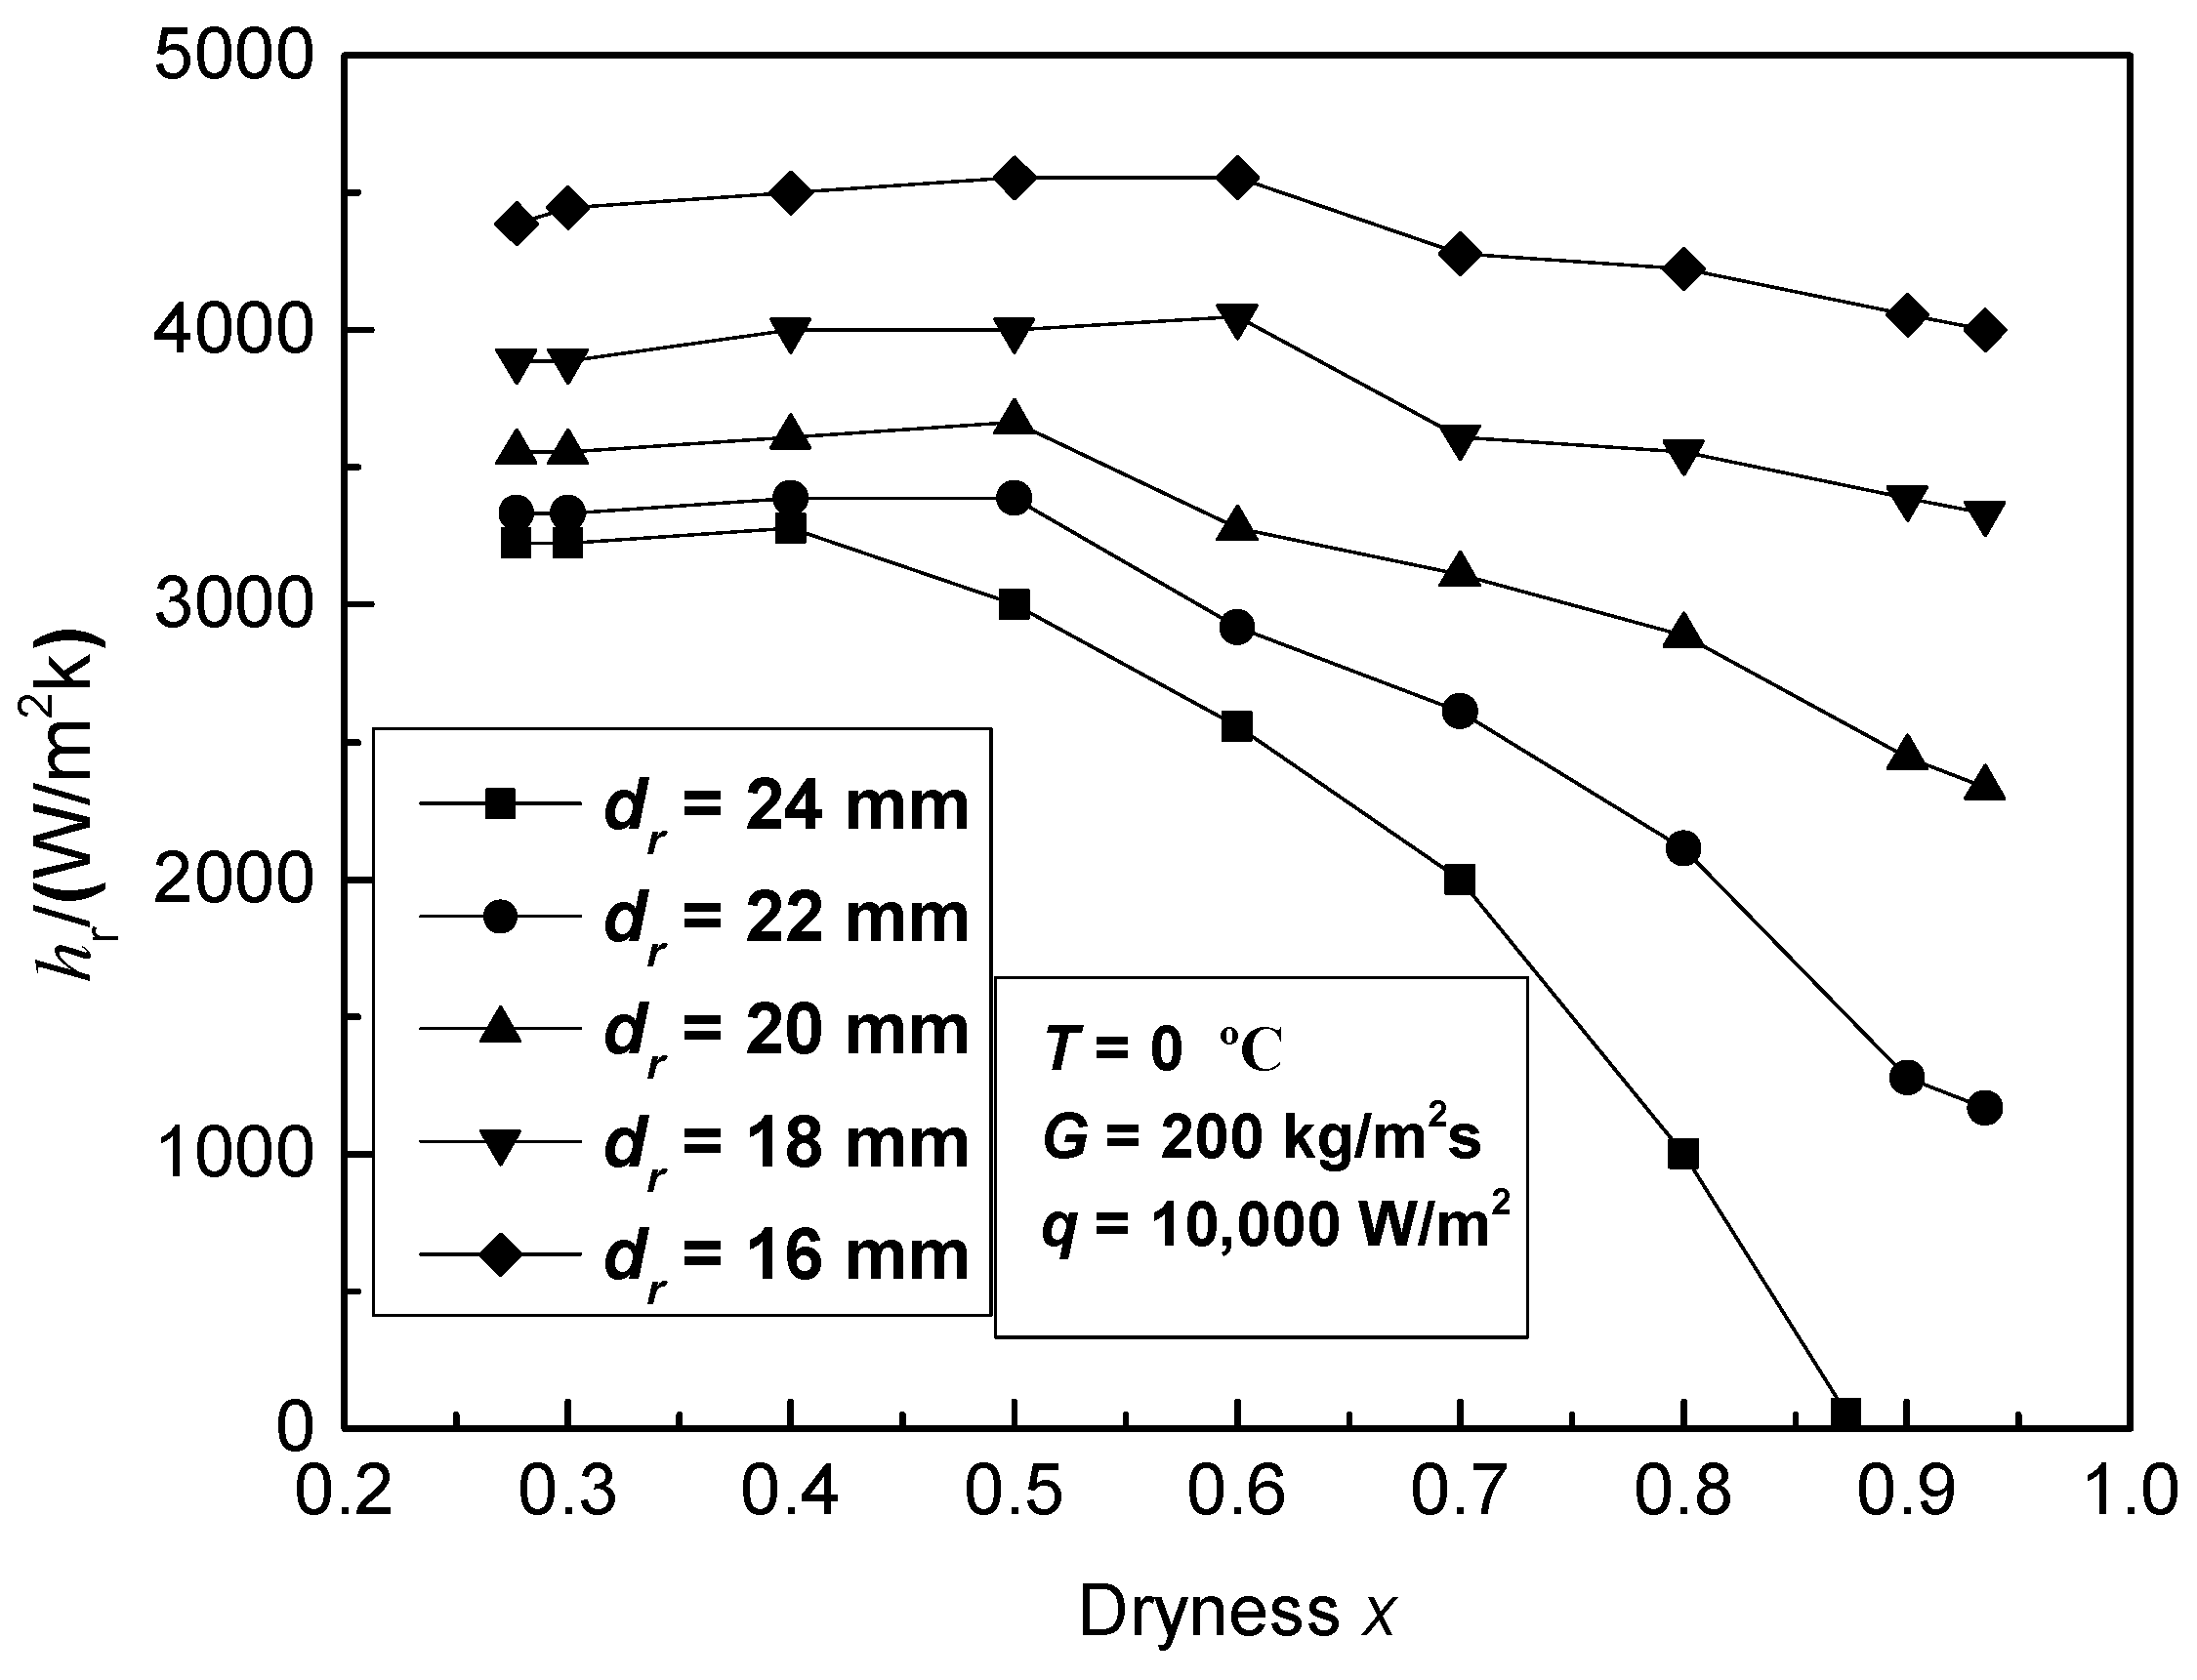
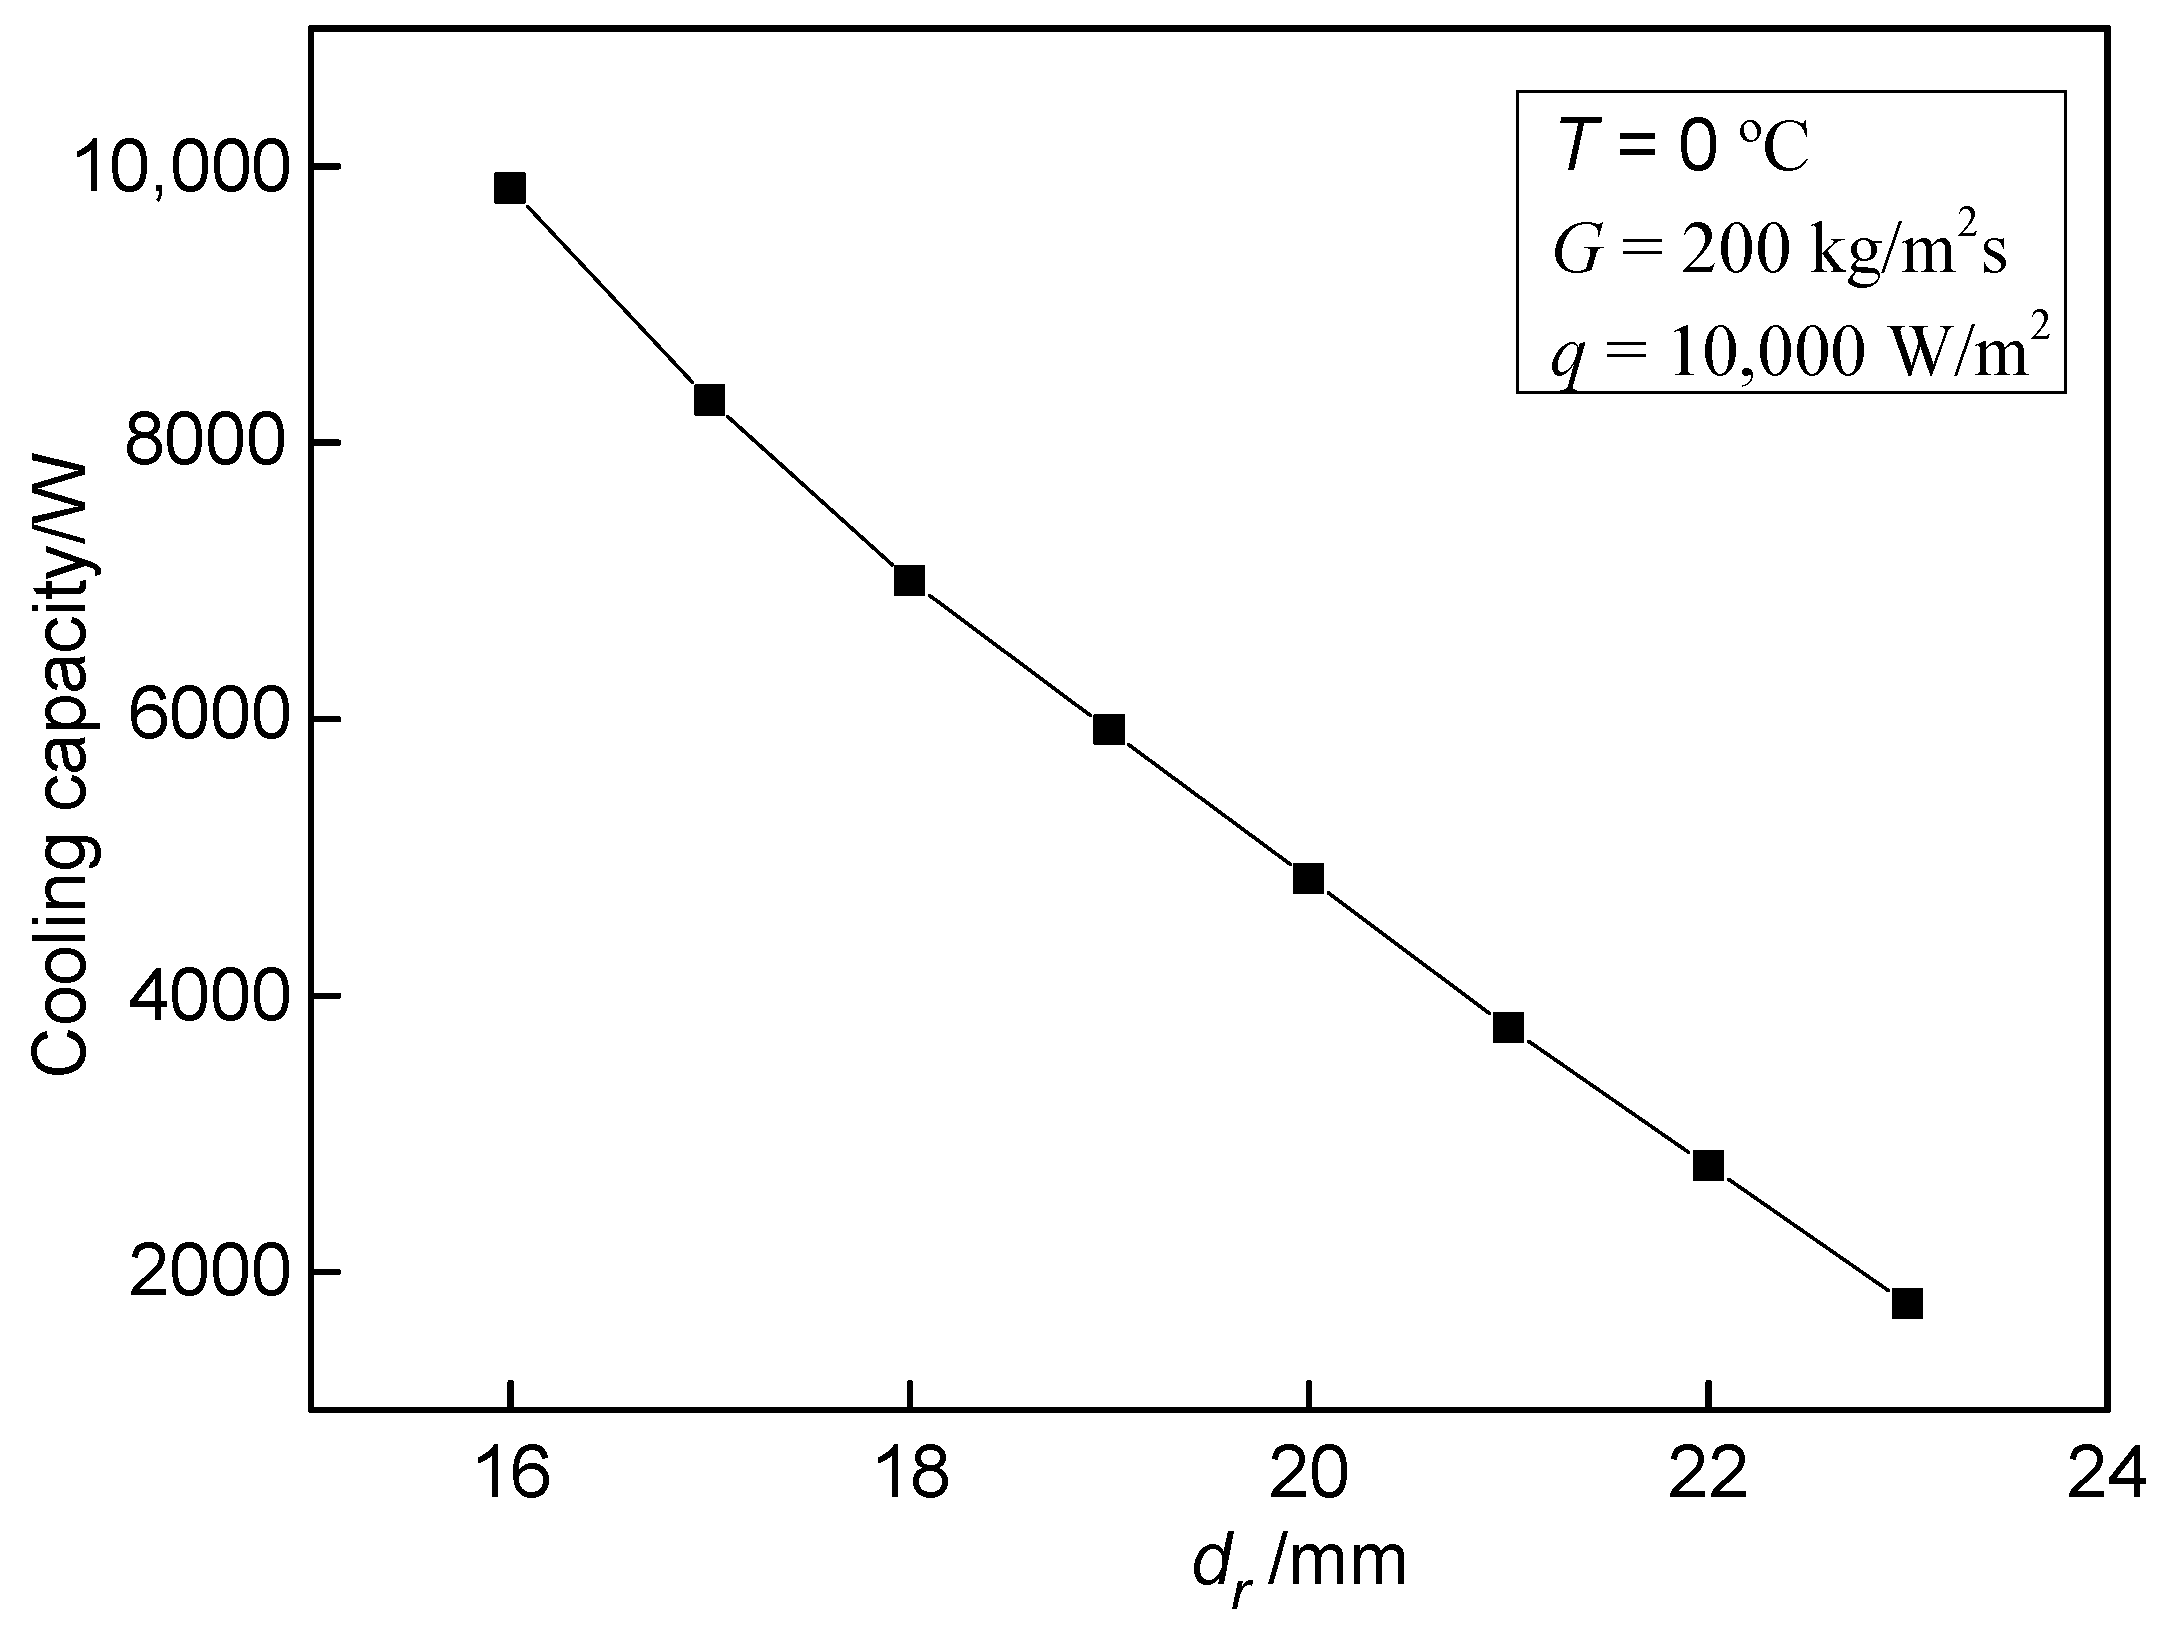
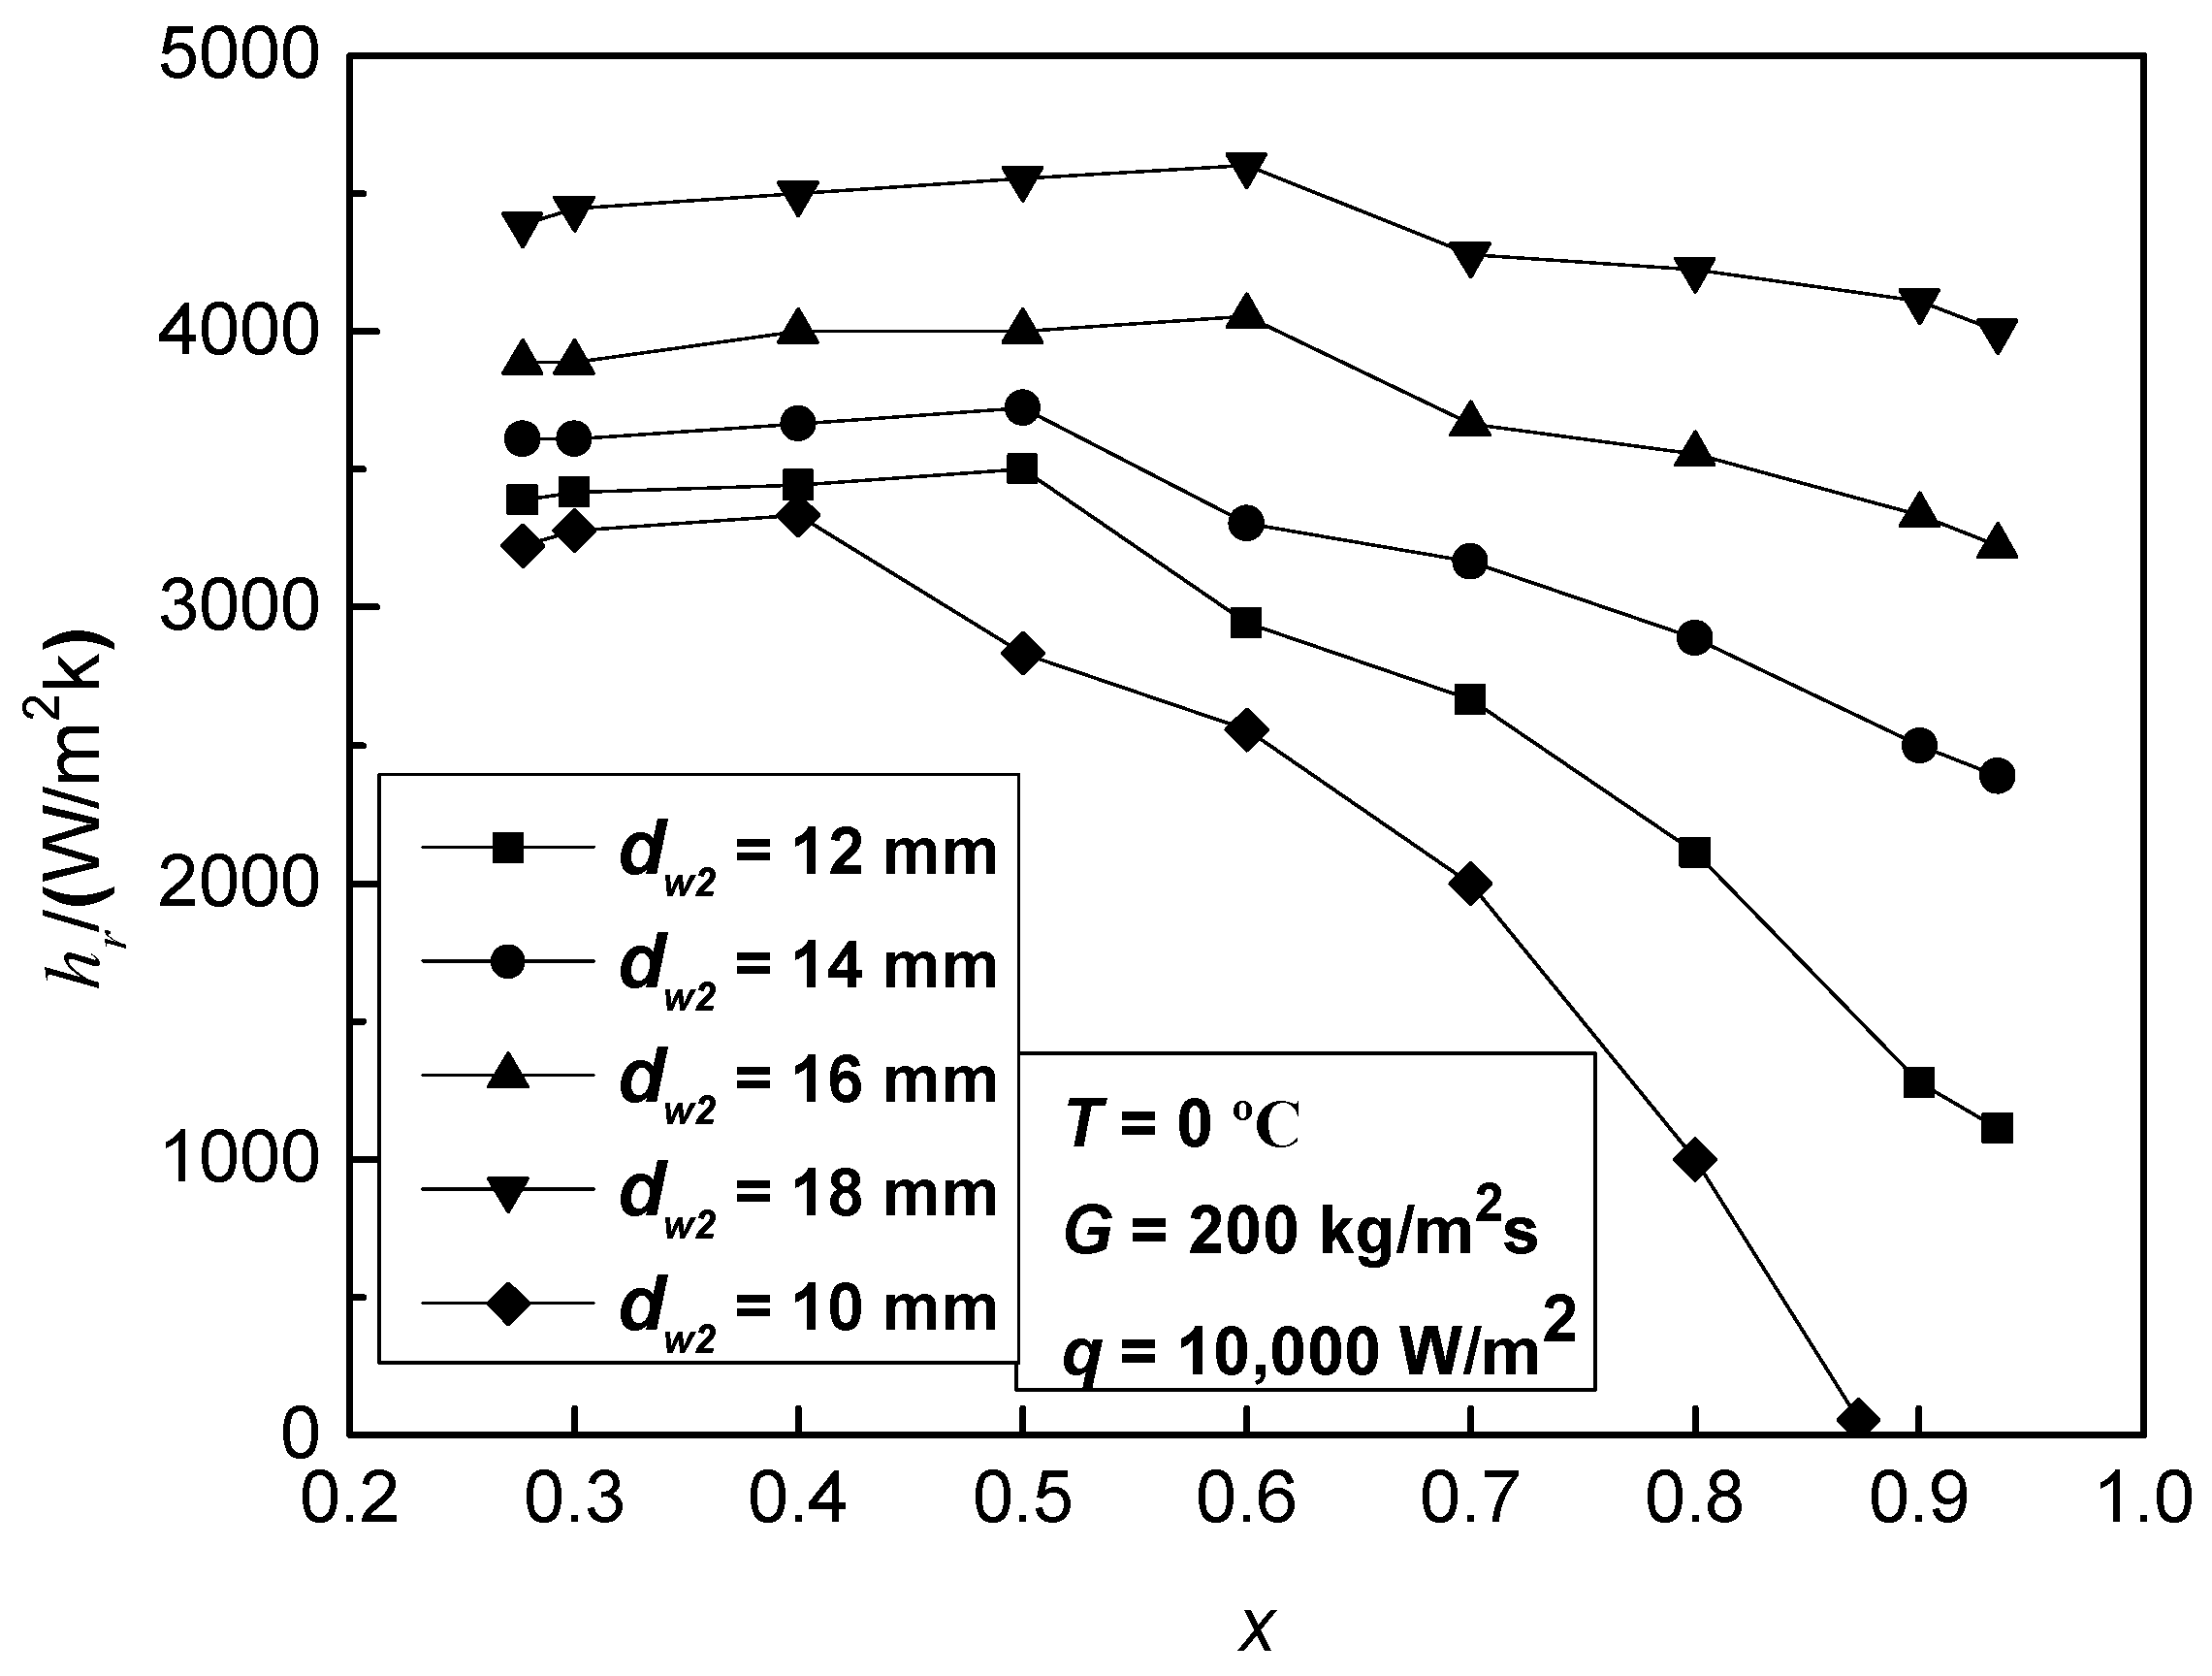
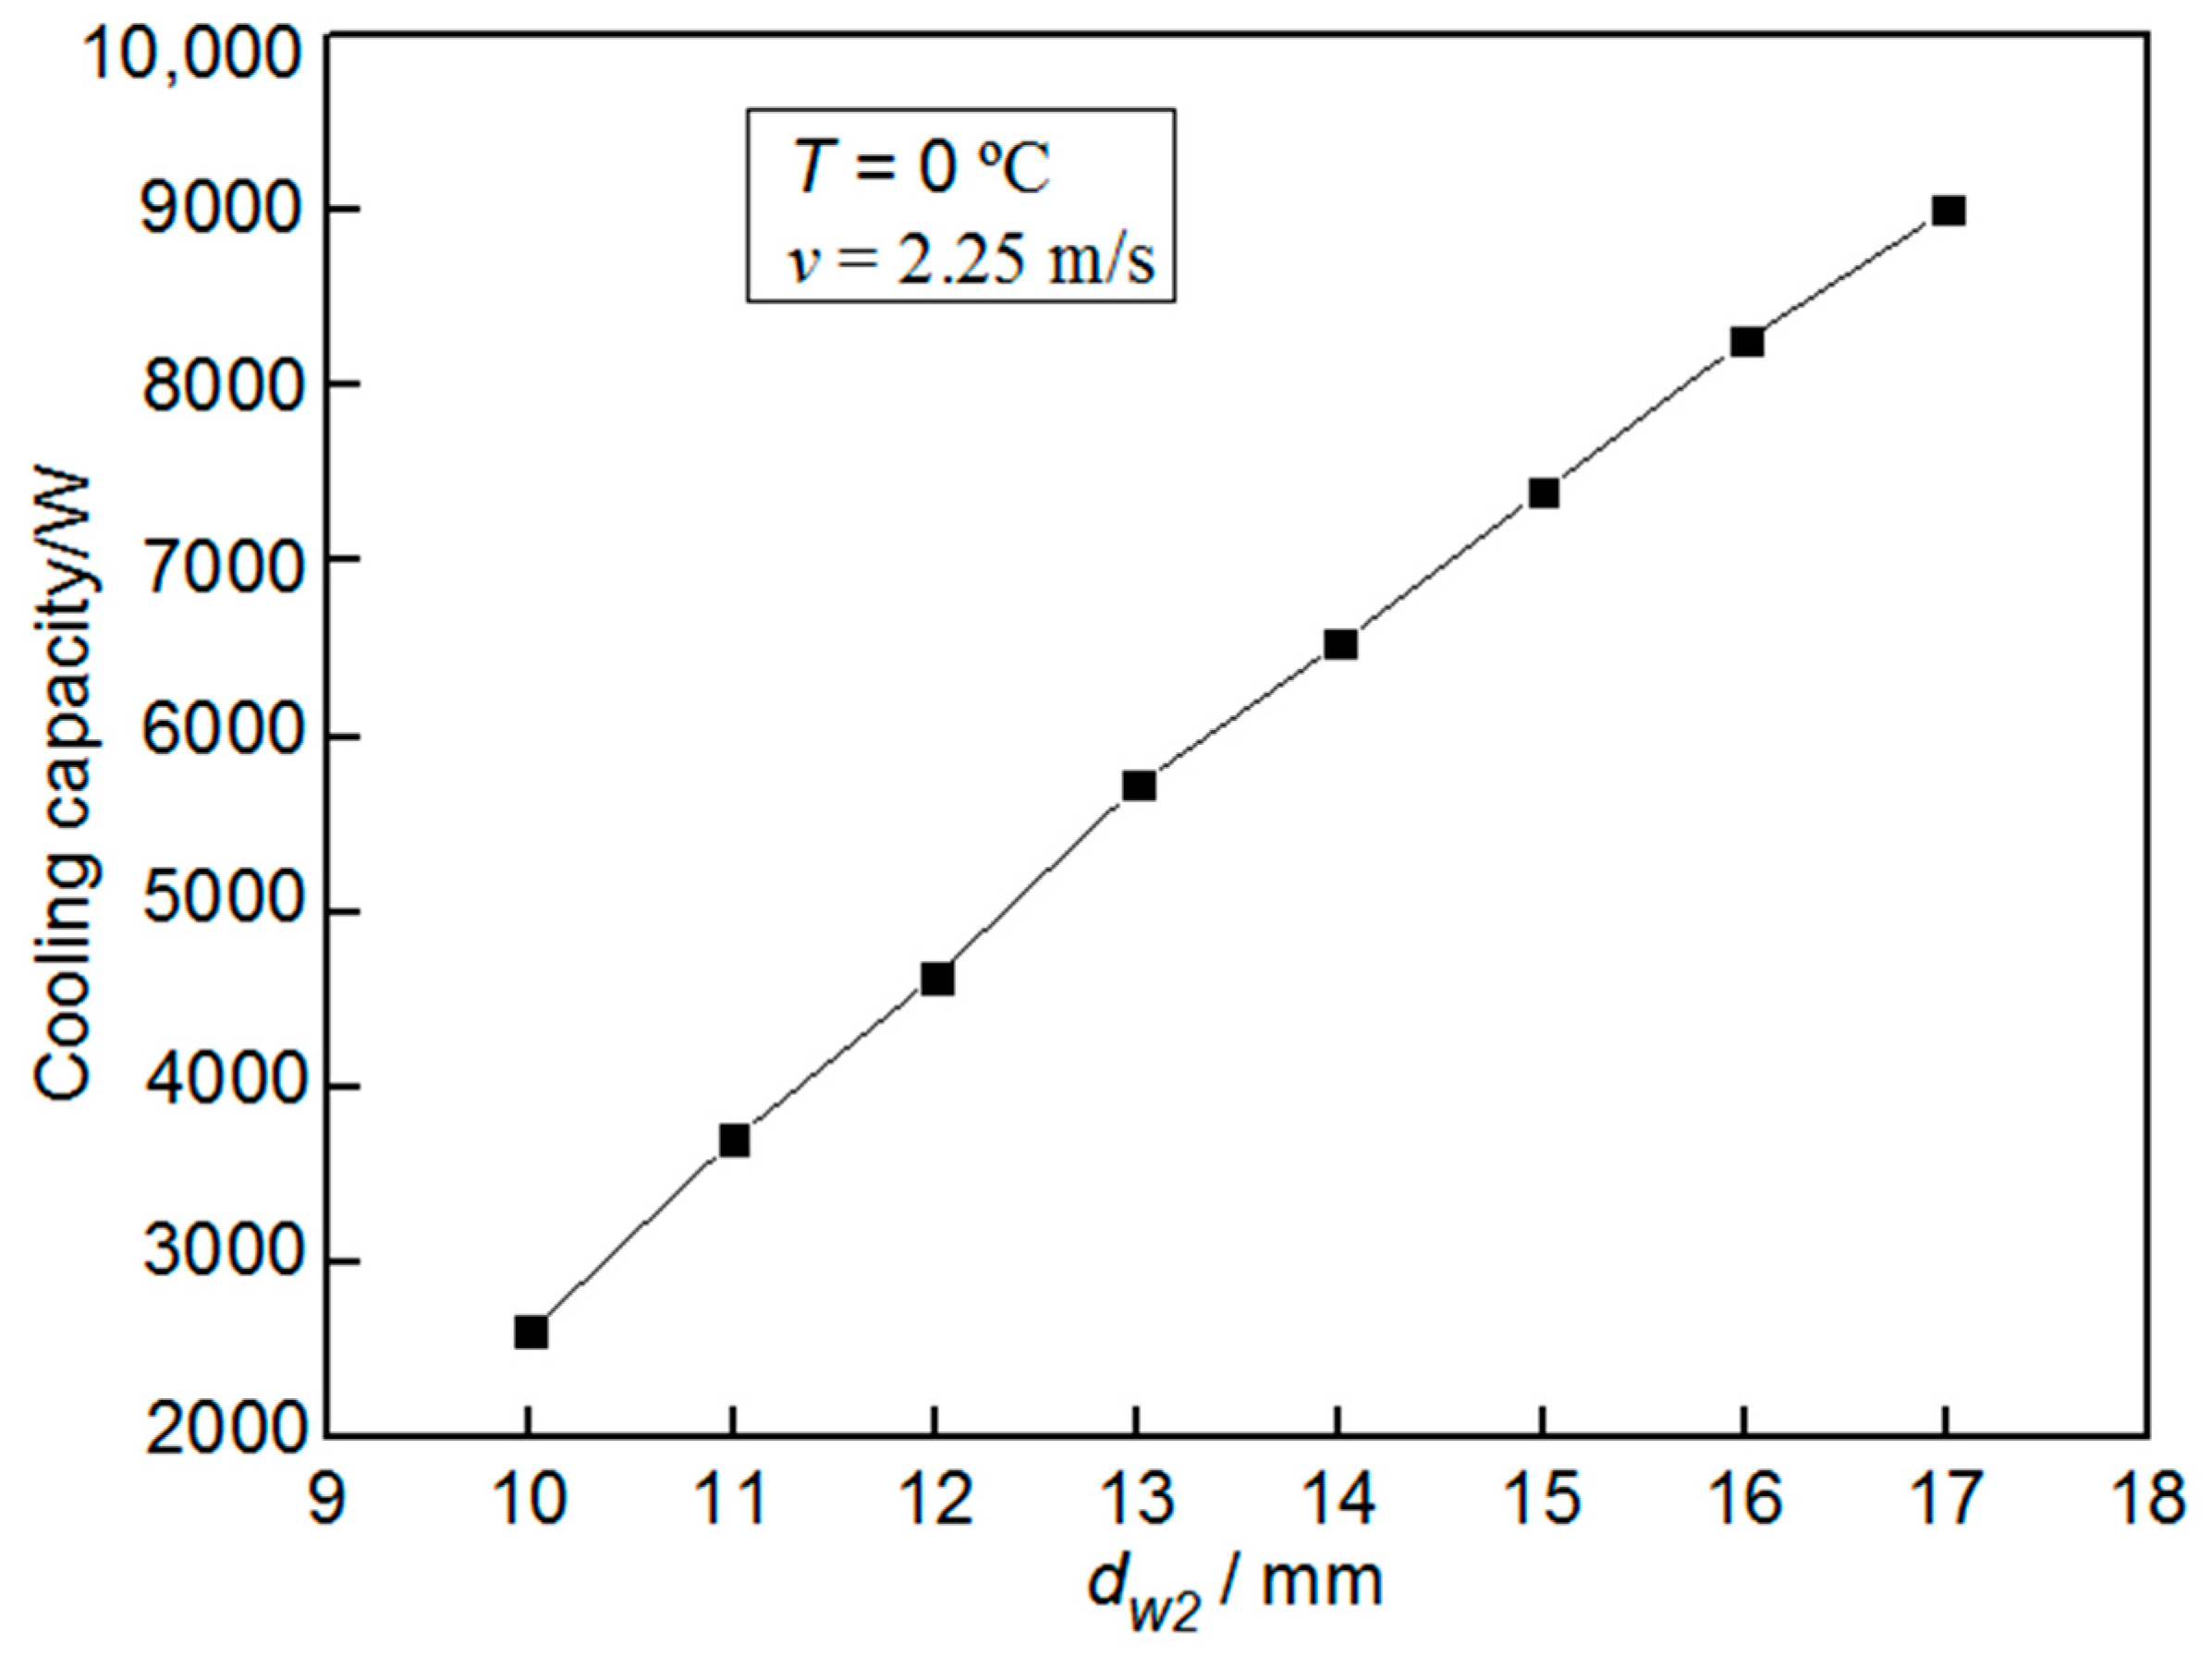
5.2. Effect of Inner Tube Diameter

Figure 13 shows the influence of the inner tube diameter on hr, where hr and xcr were observed to increase with increasing diameter, but the drop rate of hr gradually decreased. Overall, hr increased by 38% and xcr increased by 50%. This shows that the larger the inner tube diameter, the higher the heat transfer coefficient and the greater the xcr. This was due to the decrease in the cross-sectional area of the outer tube with an increase in the inner tube diameter, which resulted in more than sufficient contact between the CO2 fluid and the tube wall. The heat transfer coefficient of the larger inner tube diameter slowly decreases as x increases in the post-dryout zone. This can be attributed to the convective heat transfer being the main mechanism in the post-dryout zone, and the equivalent diameter of the outer tube diameter decreasing with a larger inner tube diameter, which enhances the convective heat transfer in the outer tube diameter.
Table 5 shows the comparison of α of each heat transfer process under different dr. α increased with increasing dw2 for the case of dw2 < 14 mm, as is evident from Table 5. For the case of dw2 > 14 mm, α was found to be 0.62. L1 accounted for 63% of the L (7.6 m) when dw2 was 14 mm. From Figure 14, at a certain fluid velocity, the cooling capacity increases as the pipe diameter increases. The maximum cooling capacity was 9010 W, when dw2 was 17 mm. This can be explained by the fact that the increase in the diameter of the water side causes the distance between the inner and outer tubes to decrease, which results in an increase in the heat exchange area of the CO2 fluid and the water, in cases where the outer diameter is constant. In addition, as the water-side pipe diameter increases, the heat transfer coefficient gradually increases. Therefore, the cooling capacity increases with the increase in the water-side pipe diameter.

6. Conclusions

This work established a CO2 double-pipe evaporator model by applying a steady-state distributed parameter method, and then built a CO2 transcritical water‒water heat pump experimental system. The performance of the double-pipe evaporator for CO2 transcritical systems was studied through simulations and experiments. The test rig consisted of a heat pump and water flow loops. In the double-pipe evaporator, CO2 and chilled water flowed outside and inside the tube, respectively. The effects of evaporation temperature, mass velocity, and heat flux on the heat transfer coefficient and cooling capacity of the CO2 double-pipe evaporator were experimentally studied. The results revealed that large mass velocity, small evaporation temperature, and heat flux could delay the dryout. The maximum cooling capacity was obtained when G was 500 kg/m2s and the maximum cooling capacity of 9 kW was obtained when q was 5 kW/m2. In the pre-dryout zone, hr varied slightly with T, since nuclear boiling is the main heat transfer mechanism. Convective heat transfer is the dominant mechanism at high vapor quality.
The simulation value of hr and pressure were compared with the experimental results in order to verify the accuracy of the model. The results revealed that the mean relative error (RE) of heat transfer for the evaporation temperature and that of the CO2 pressure drop for chilled water inlet temperature were 5.21% and 3.78%, respectively. The simulation results showed that, under given conditions, the small outer tube diameter and large inner tube diameter could cause the heat transfer coefficient and xcr increase. This indicates that the equivalent diameter of the refrigerant side is as small as possible. α was 67% and 63% for a 17 mm outer tube diameter and 14 mm inner tube diameter, respectively. A larger α is desirable; this indicates that the heat exchange zone mainly occurs in the pre-dryout and the heat transfer mechanism is mainly nuclear boiling. A further theoretical basis is provided for designing an efficient and compact CO2 double-pipe evaporator.

Author Contributions

J.Y. contributed to the conception of the study and designed the experiments; S.N. performed the data analyses and wrote the manuscript. And the APC was funded by J.Y.

Funding

This research was funded by the Natural Science Foundation of Tianjin, China under Grant 17JCZDJC31400 and the Scientific Special Commissioner of Tianjin, China under Grant 16JCTPJC52800.

Conflicts of Interest

The authors declare no conflict of interest.

Nomenclature

Aarea (m2)
Cpspecific heat (J/kg/K)
ddiameter (mm)
Deequivalent diameter (mm)
Eenhancement factor
Gmass velocity (kg/m2s)
ggravity acceleration (m/s2)
hwwater heat transfer coefficient (W/m2/K)
henthalpy (kJ/kg)
hrheat transfer coefficient (W/m2/K)
hlheat transfer coefficient of liquid (W/m2/K)
hwetheat transfer coefficient of wet pipe wall (W/m2/K)
hggas phase heat transfer coefficient (W/m2/K)
hpoolboiling heat transfer coefficient (W/m2/K)
Ktotal heat transfer coefficient (W/m2/K)
Ltotal tube length (m)
L1tube length in pre-dryout zone (m)
L2tube length in post-dryout zone (m)
mmass flux (kg/s)
qheat flux (W/m2)
Qheat quantity (W)
RErelative errors
Ssuppression factor
ttemperature (°C)
Tevaporation temperature (°C)
vvolume flow (m3/h)
Greek symbols
λthermal conductivity (W/m2/K)
ρdensity (kg/m3)
σ surface tension (N/m)
PrPrandtl number
ReReynolds number
NuNusselt number
δwall thickness (mm)
γdirty factor
xmass quality
Boboiling number
BdBond number
αL1/L
θdrydry angle
Subscripts
wwater
w1refrigerant side wall
w2water side wall
mmean
crcritical
o; ioutlet; inlet
nunit
rrefrigerant

References

  1. Lillo, G.; Mastrullo, R.; Mauro, A.W.; Viscito, L. Multi criteria optimization of plate heat exchanger for super critical CO2 power systems. Energy Procedia 2017, 129, 979–986. [Google Scholar] [CrossRef]
  2. Ayad, F.; Benelmir, R.; Souayed, A. CO2 evaporators design for vehicle HVAC operation. Appl. Therm. Eng. 2012, 36, 330–344. [Google Scholar] [CrossRef]
  3. Oh, H.K.; Son, C.H. Flow boiling heat transfer and pressure drop characteristics of CO2 in horizontal tube of 4.57-mm inner diameter. Appl. Therm. Eng. 2011, 31, 163–172. [Google Scholar] [CrossRef]
  4. Choi, K.I.; Pamitran, A.S.; Oh, C.Y.; Oh, J.T. Boiling heat transfer of R-22, R-134, and CO2 in horizontal smooth minichannels. Int. J. Refrig. 2007, 30, 1336–1446. [Google Scholar] [CrossRef]
  5. In, S.; Jeong, S. Flow boiling haet transfer characteristics of R123 and R134a in a micro-channel. Int. J. Multipase Flow 2009, 35, 987–1000. [Google Scholar] [CrossRef]
  6. Oh, H.K.; Ku, H.G.; Roh, G.S.; Son, C.H.; Park, S.J. Flow boiling heat transfer characteristics of carbon dioxide in a horizontal tube. Appl. Therm. Eng. 2008, 28, 1022–1030. [Google Scholar] [CrossRef]
  7. Lorentzen, G.; Pettersen, J. New Possibilities for Non-CFC Refrigeration. In Proceedings of the IIR International Symposium on Refrigeration, Energy and Environment, Trondheim, Norway, 22–24 June 1992. [Google Scholar]
  8. Neksa, P.; Girotto, S. CO2 as refrigerant with incommercial refrigeration-theoretical consideration and experimental results. In Proceedings of the 5th IIR-Gustav Lorentzen Conference on Natural Working Fluids, Guangzhou, China, 17–20 September 2002; pp. 221–228. [Google Scholar]
  9. Jin, J.F.; Chen, J.P.; Chen, Z.J. Development and validation of a microchannel evaporator model for a CO2 air-conditioning system. Appl. Therm. Eng. 2011, 31, 137–146. [Google Scholar] [CrossRef]
  10. Yun, R.; Kim, Y.C.; Park, C. Numerical analysis on a microchannel evaporator designed for CO2 air-conditioning systems. Appl. Therm. Eng. 2007, 27, 1320–1326. [Google Scholar] [CrossRef]
  11. Jahar, S. Performance characteristics of multi-evaporator transcritical CO2 refrigeration cycles with hybrid compression/ejection. Proc. Inst. Mech. Eng. Part A Power Energy 2010, 224, 773–780. [Google Scholar]
  12. Bai, T.; Yan, G.; Yu, J. Thermodynamics analysis of modified dual-evaporator CO2 transcritical refrigeration cycle with two-stage ejector. Energy 2015, 84, 325–335. [Google Scholar] [CrossRef]
  13. Kravanja, G.; Zajc, G.; Knez, Ž.; Škerget, M.; Marčič, S.; Knez, M.H. Heat transfer performance of CO2, ethane and their azeotropic mixture under supercritical conditions. Energy 2018, 152, 190–201. [Google Scholar] [CrossRef]
  14. Pettersen, J.; Hafner, A.; Skaugen, G. Development of compact heat exchangers for CO2 air-conditioning systems. Int. J. Refrig. 1998, 21, 180–193. [Google Scholar] [CrossRef]
  15. Patiño, J.; Llopis, R.; Sánchez, D.; Sanz-Kock, C.; Cabello, R.; Torrella, E. A comparative analysis of a CO2 evaporator model using experimental heat transfer correlations and a flow pattern map. Int. J. Heat Mass Transf. 2014, 71, 361–375. [Google Scholar] [CrossRef]
  16. Minetto, S.; Brignoli, R.; Zilio, C.; Marinetti, S. Experimental analysis of a new method for overfeeding multiple evaporators in refrigeration systems. Int. J. Refrig. 2014, 38, 1–9. [Google Scholar] [CrossRef]
  17. Brix, W.; Kærn, M.R.; Elmegaard, B. Modelling distribution of evaporating CO2 in parallel minichannels. Int. J. Refrig. 2010, 33, 1086–1094. [Google Scholar] [CrossRef]
  18. Ge, Y.T.; Tassou, S.A. The impact of geometric structure and flow arrangement on the performance of CO2 evaporators in multi-deck medium temperature display cabinets. Int. J. Refrig. 2012, 35, 142–149. [Google Scholar] [CrossRef]
  19. Ke, H.; Xiao, Q.; Cao, Y.; Ma, T.; Lin, Y.; Zeng, M.; Wang, Q. Simulation of the printed circuit heat exchanger for S-CO2 by segmented methods. Energy Procedia 2017, 142, 4098–4103. [Google Scholar] [CrossRef]
  20. Son, S.; Heo, J.Y.; Lee, J.I. Prediction of inner pinch for supercritical CO2 heat exchanger using Artifical Neutral Network and evaluation of its impact on cycle design. Energy Convers. Manag. 2018, 163, 66–73. [Google Scholar] [CrossRef]
  21. Cui, X.; Guo, J.; Huai, X.; Cheng, K.; Zhang, H.; Xiang, M. Numerical study on novel airfoil fins for printed circuit heat exchanger using supercritical CO2. Int. J. Heat Mass Transf. 2018, 121, 354–366. [Google Scholar] [CrossRef]
  22. Paradis, P.L.; Rousse, D.R.; Lamarche, L.; Nesreddine, H. A hybrid PV/T solar evaporator using CO2: Numerical heat transfer model and simulation results. Solar Energy 2018, 170, 1118–1129. [Google Scholar] [CrossRef]
  23. Guo, J.F.; Huai, X. Coordination analysis of cross-flow heat exchger under high variations in thermodynamic properties. Int. J. Heat Mass Transf. 2017, 113, 935–942. [Google Scholar] [CrossRef]
  24. Li, H.; Tang, C.C.; Liu, W.; Yu, X.M.; Sun, H.Y. Establishment and simulation of dynamic mathmatical model of double-pipe heat exchanger. Liaoning Chem. Ind. 2018, 47, 651–654. [Google Scholar]
  25. Dittus, F.W.; Boelter, L.M.K. Heat transfer in automobile radiators of the tubular type. International Commun. Heat Mass Transf. 1985, 12, 3–22. [Google Scholar] [CrossRef]
  26. Liu, T.; Ding, G.L.; Zhang, P.; Wu, Z.G. Improved algorithm for dynamic distributed parameter model of near-phase flow in a double-tube heat exchanger. J. Shanghai Jiaotong Univ. 2008, 42, 122–127. [Google Scholar]
  27. Li, M.X.; Dang, C.B.; Hihara, E.J. Flow boiling heat transfer of carbon dioxide with polyalkylene glycol-type lubricating oil in pre-dryout region inside horizontal tube. Int. J. Refrig. 2014, 41, 45–49. [Google Scholar] [CrossRef]
  28. Yun, H.M.; Cheng, L.; Wang, L.Q.; Qu, Y. Numerical study of single-phase flow and heat transfer in smooth rectangular microchannels. J. Eng. Thermophys. 2007, S2, 33–36. [Google Scholar]
  29. Hu, H.T. Study on Flow Boiling Heat Transfer and Pressure Drop Characteristics in R410a-Lubricating Oil Mixture; Shanghai Jiaotong University: Shanghai, China, 2008; pp. 24–28. [Google Scholar]
  30. Yoon, S.H.; Cho, E.S.; Hwang, Y.W.; Kim, M.S.; Min, K.; Kim, Y. Characteristics of evaporative heat transfer and pressure drop of carbon dioxide and correlation development. Int. J. Refrig. 2004, 27, 111–119. [Google Scholar] [CrossRef]
Figure 1. Schematic of the experimental setup.
Processes 07 00547 g001
Figure 2. Effect of T on hr.
Processes 07 00547 g002
Figure 3. Effect of T on cooling capacity.
Processes 07 00547 g003
Figure 4. Effect of G on hr.
Processes 07 00547 g004
Figure 5. Effect of G on cooling capacity.
Processes 07 00547 g005
Figure 6. Effect of heat flux on hr.
Processes 07 00547 g006
Figure 7. Effect of heat flux on cooling capacity.
Processes 07 00547 g007
Figure 8. CO2 double-pipe evaporator model.
Processes 07 00547 g008
Figure 9. Flowchart of simulation.
Processes 07 00547 g009
Figure 10. Comparison of experimental and calculated results. (a) Effect of chilled water flow on hr; (b) Effect of evaporation temperature on hr; and, (c) Effect of chilled water inlet temperature on CO2 pressure drop.
Processes 07 00547 g010
Figure 11. Effect of dr on hr.
Processes 07 00547 g011
Figure 12. Effect of dr on cooling capacity.
Processes 07 00547 g012
Figure 13. Effect of dw2 on hr.
Processes 07 00547 g013
Figure 14. Effect of dw2 on cooling capacity.
Processes 07 00547 g014
Table 1. Specifications of the main components of the system.
ComponentsSpecifications
CompressorManufacturerDorin
Model no.CD380H
Rated capacity (kW)3.3
Gas cooler and EvaporatorManufacturerDeveloped in house
TypeDouble tube
Diameter of inner tube (mm)12
Length of tube (mm)16,000
RegeneratorManufacturerDeveloped in house
TypeDouble tube
Diameter of inner tube (mm)12
Diameter of outer tube (mm)19
Table 2. Specifications and uncertainties of sensors.
ParameterDeviceUncertaintyFull Scale
TemperaturePlatinum resistance temperature sensor±0.01 °C−50–400 °C
PressurePressure sensor±0.25%1‒40 MPa
PowerElectric power transmitter±0.2%0‒866 W
Water flowTurbine flowmeter±1.3%0‒1.6 m3·h−1
CO2 mass flowElectromagnetic mass flowmeter±0.2%0‒250 kg·h−1
Table 3. Test conditions.
ParametersUnitFull ScaleSet Value
Compressor exhaust pressureMPa 8
Evaporation temperature°C−5 to 50
CO2 mass velocitykg/m2s100‒600200
Heat fluxkW/m25000‒15,00010,000
Table 4. Comparison of α under different dr.
dr mm161718192021222324
α 0.640.670.600.570.520.490.450.300.23
Table 5. Comparison of α under different dw2.
dw2 mm101112131415161718
α 0.230.280.450.560.630.620.620.620.62

