Abstract
The widespread penetration of hydrogen in mainstream energy systems requires hydrogen production processes to be economically competent and environmentally efficient. Hydrogen, if produced efficiently, can play a pivotal role in decarbonizing the global energy systems. Therefore, this study develops a framework which evaluates hydrogen production processes and quantifies deficiencies for improvement. The framework integrates slack-based data envelopment analysis (DEA), with fuzzy analytical hierarchy process (FAHP) and fuzzy technique for order of preference by similarity to ideal solution (FTOPSIS). The proposed framework is applied to prioritize the most efficient and sustainable hydrogen production in Pakistan. Eleven hydrogen production alternatives were analyzed under five criteria, including capital cost, feedstock cost, O&M cost, hydrogen production, and CO2 emission. FAHP obtained the initial weights of criteria while FTOPSIS determined the ultimate weights of criteria for each alternative. Finally, slack-based DEA computed the efficiency of alternatives. Among the 11, three alternatives (wind electrolysis, PV electrolysis, and biomass gasification) were found to be fully efficient and therefore can be considered as sustainable options for hydrogen production in Pakistan. The rest of the eight alternatives achieved poor efficiency scores and thus are not recommended.
1. Introduction
Hydrogen is identified as the most critical and indispensable energy alternative that forms a viable option for the decarbonization of the global energy system [1]. A growing body of literature suggests five essential factors that enable hydrogen to become a future low-carbon energy pathway [2,3]. Firstly, hydrogen is the universe’s most abundant element [4]. Secondly, hydrogen has a massive potential to reduce greenhouse gases (GHGs) [5]. Thirdly, it is a versatile energy carrier that can operate across various sectors, including industry [6], transport [7], heat [8], and electricity [9]. Fourthly, it can offset electricity as zero-carbon energy that can be easily transported and stored [10]. Lastly, it enhances energy security by reducing dependence on fossil fuel [11]. The objective of this study is to provide a framework to assess the feasibility of hydrogen production processes for mass exploitation of this abundant natural resource.
A variety of energy sources and processes can be used to produce hydrogen. Currently, 96% of hydrogen is produced from fossil fuels using steam methane reforming (SMR) process. Three major fossil fuels used for hydrogen production are natural gas (48%), oil (30%), and coal (18%) [3]. Hydrogen production comprises extraction and isolation of hydrogen in the shape of independent molecules, at a purity level that is necessary for a given application. The methods of hydrogen production typically rely on starting point, and the presently leading technique of production from methane can only be reasonable if the energy is firstly contained in methane or can be easily transformed to methane. Therefore, in the case of fossil fuels, the hydrogen production from natural gas is relatively easy, from oil is a little bit more intricate, while from coal needs initially high-temperature gasification [12].
For hydrogen production from electricity, the process of electrolysis is commonly used. Currently, this process produces the rest of the 4% of total hydrogen [3]. The electrolysis process which uses renewable electricity is called renewable electrolysis. The two most common renewable electrolysis methods are wind electrolysis and solar electrolysis. Renewable electrolysis offers some additional and promising benefits such as hydrogen fuels storage that can reinforce increased penetration of renewable energy. Other renewable energy sources (RES) such as biomass is also used for hydrogen production. However, unlike other RES, biomass requires some special treatment, depending on the form of biomass feedstock. For instance, at high temperature, direct decomposition of water or photo-induced are considered, while at low temperature, more complicated and multistep processes are required, such as the ones offered by steam from concentrating solar power plants or nuclear reactors [12].
The wide-ranging availability of hydrogen production processes complicates the decision-making regarding the selection of the most sustainable process [13]. These processes use massive inputs, such as capital cost, feedstock cost, and operation and maintenance (O&M) cost, to produce hydrogen, while simultaneously producing undesirable outputs, such as GHGs emissions, as a byproduct. Therefore, to enable decision makers to choose the best hydrogen production process, it is crucial to evaluate the economic viability and environmental efficiency of various hydrogen production processes [5]. This task can be achieved by using the environmental data envelopment analysis (DEA), which is the most common method of efficiency evaluation when undesirable outputs are involved. However, the DEA model calculates the preference weights of variables (i.e., inputs, desirable outputs, and undesirable outputs) automatically, while ignoring the relative importance of these variables to each other in the calculation [14]. Hence, DEA considers the equal importance of each variable. However, this is contrary to reality, in which the preference of variables changes depending on stakeholders’ considerations.
Therefore, to address the problem of equal weights, this study develops a framework which applies multi-criteria decision analysis (MCDA) techniques to determine the importance of each variable, before assessing the economic and environmental efficiency of hydrogen production processes. Two most popular MCDA techniques, i.e., fuzzy analytical hierarchy process (FAHP), and the fuzzy technique for order of preference by similarity to ideal solution (FTOPSIS) were combined with slack-based environmental DEA to accomplish the task. Conventional analytical hierarchy process (AHP) and technique for order of preference by similarity to ideal solution (TOPSIS) could also have been used. However, the techniques lack in dealing with the vagueness and bias involved in stakeholders’ considerations. Fuzzy, on the other hand, is proficient in handling the uncertainty and vagueness involved in the experts’ feedback [15]. Likewise, using slack-based environmental DEA, instead of a simple environmental DEA, is more useful as it provides the information of slack-variables (i.e., excess of inputs and undesirable outputs, and the shortfall of desirable outputs) and overcoming slacks can help to improve efficiency performance [16]. The proposed framework is employed to analyze the case of Pakistan, which is an energy deficient and environmentally vulnerable country.
Initially, the hydrogen production processes also referred to as alternatives, available in Pakistan, were shortlisted. After that, variables also termed as criteria, used to evaluate the performance of those processes/alternatives were finalized. Three input criteria (capital cost, O&M cost, and feedstock cost), one desirable output criteria (hydrogen production), and one undesirable output criteria (CO2 emission) were selected for the analysis. FAHP was used to determine the initial weights of each criterion. After obtaining the initial weights, FTOPSIS was employed to determine the ultimate weights of criteria for each alternative. Finally, slack-based environmental DEA was used to compute efficiency scores of alternatives and rank them according to their scores.
The rest of the study proceeds as follows: Section 2 provides the literature review of MCDA techniques used in the decision-making related to hydrogen production processes. Section 3 delineates the proposed methodology. Section 4 applies the proposed methodology to prioritize the most sustainable hydrogen production process in Pakistan. Section 5 presents and discusses the results of the study. The final section concludes the study.
2. MCDA for Hydrogen Selection
Since the assessment of hydrogen production processes and the decision-making related to the selection of the most viable processes involve multi-dimensional criteria, MCDA techniques have been widely used in the relevant literature. Acar et al. [17] used fuzzy hesitant AHP to conduct the sustainability analysis of various hydrogen production methods including grid electrolysis, photovoltaic (PV) electrolysis, wind electrolysis, solar thermochemical water splitting, nuclear thermochemical water splitting, and photo-electrochemical cells. The selected methods were evaluated based on five criteria, i.e., technical performance, economic performance, environmental performance, social performance, and reliability. The results of the study showed that grid electrolysis is the most sustainable hydrogen production option.
Ren and Toniolo [18] proposed a novel MCDA method to rank sustainable hydrogen production pathways by combining interval evaluation based on distance from average solution (EDAS) and improved decision making trial and evaluation laboratory (DEMATEL). They studied four hydrogen production pathways, including SMR, coal gasification, biomass gasification, and wind electrolysis. Biomass gasification was found to be the most sustainable pathway followed respectively by SMR, wind electrolysis, and coal gasification.
Ren et al. [19] applied FAHP and FTOPSIS to prioritize the role of various hydrogen production technologies for developing a hydrogen economy in China. Hydrogen production technologies assessed in the study include SMR, coal gasification with CO2 capture and storage, nuclear-based high-temperature electrolysis, biomass gasification, and hydropower electrolysis. The selected technologies were assessed based on 10 criteria under four aspects, including technical, economic, environmental, and socio-political. The results showed hydropower-based water electrolysis and coal gasification with CO2 capture and storage as the two most important hydrogen production technologies, among others for establishing a hydrogen economy in China.
Yu [20] developed a decision-making model for the selection of hydrogen production technologies in China. The model was established based on interval-valued intuitionist fuzzy set theory. The study assessed three hydrogen production technologies, including coal gasification, water electrolysis using hydropower, and nuclear based high-temperature electrolysis. The evaluation used three criteria, inducing the degree of political support, economic performance, and social performance. Nuclear based high-temperature electrolysis was considered as the best technology for hydrogen production while the remaining two technologies were found to be least satisfactory.
Ren et al. [21] proposed a novel fuzzy multi-actor MCDA model, which enabled multiple decision-making groups to use linguistic variables to assess the sustainability of four biomass-based hydrogen production processes including biomass pyrolysis, biomass fermentative hydrogen production, biomass gasification, and biomass supercritical water gasification. The authors used 15 criteria related to economic, technological, socio-political, and environmental aspects of the assessment. The results of the study reported biomass gasification as the most sustainable process and fermentative hydrogen production as the least sustainable option.
Pilavachi et al. [22] used AHP to prioritize seven hydrogen production technologies, including SMR, coal gasification, biomass gasification, partial oxidation of hydrocarbons, wind electrolysis, PV electrolysis, and hydropower electrolysis. The prioritization was done based on five criteria, including CO2 emissions, capital cost, operation and maintenance, hydrogen production cost, and feedstock cost. The assessment ranked PV electrolysis, wind electrolysis, and hydropower electrolysis higher than the conventional technologies, SMR, coal gasification, partial oxidation of hydrocarbons, and biomass gasification.
The above literature provides enough evidence regarding the extensive utilization of MCDA techniques for the assessment of hydrogen technologies. The above-reviewed studies take into account various aspects and criteria to prioritize different methods of hydrogen production. One crucial point that is missing in the past studies is the lack of proper treatment of undesirable outputs, which are byproducts in the hydrogen production processes and can influence the environmental efficiency of these processes. To tackle undesirable outputs in the analysis, this study integrates MCDA with environmental DEA to rank hydrogen production processes.
3. Methodology
The proposed methodology combines FAHP, FTOPSIS, and slack based environmental DEA to develop a framework for the selection of relatively efficient hydrogen production technologies. Figure 1 presents the flowchart of the research design. The steps involved in the proposed approach are:
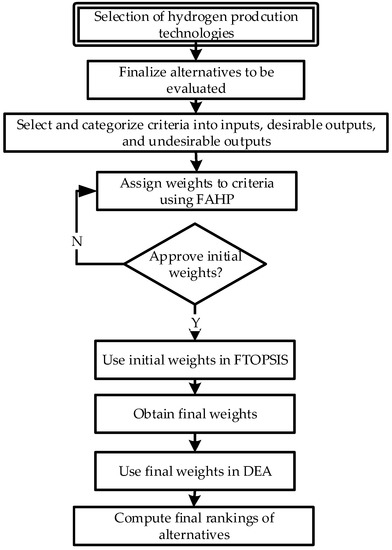
Figure 1.
Flowchart of research design.
- Finalize hydrogen production technologies (alternatives) to be evaluated.
- Select variables (criteria) and categorize them into inputs, desirable outputs, and undesirable outputs.
- Employ FAHP to compute initial weights of criteria.
- Use FAHP weights to compute the final of criteria for each alternative using FTOPSIS.
- Use final weights in slack-based environmental DEA to obtain the final ranking of alternatives.
3.1. FAHP
Saaty introduced AHP as a quantitative method of multi-criteria decision analysis [23]. The Saaty AHP has some limitations because it can only be applied where there is no uncertainty, the environment is crisp, the selection of judgement is subjective, and the judgmental scale is unbalanced. Therefore, Fuzzy approach is integrated with AHP to extend the latter’s applicability. The FAHP proficiently deals with imprecise and uncertain judgment of experts on the field by using linguistic variables [24]. Definition of fuzzy operations is as follows:
If and are representing two triangular fuzzy numbers (TFNs) then algebraic operations can be expressed as follows [25]
The FAHP is applied according to the method proposed by [26] as follows:
where is (j = 1, 2, 3, 4, 5, 6, …, m) TFNs provided in Table 1, and is the goal set (i = 1, 2, 3, 4, 5, 6, …, n).

Table 1.
Triangular fuzzy numbers linguistic scale.
FAHP involves the following steps:
- Step 1:
- Use TFNs to construct pairwise comparison matrixes of attributes.
- Step 2:
- Fuzzy synthetic extent () value of ith element can be defined as:
- Step 3:
- Comparison of the obtained values of , and compute the possibility degree . Following is the equivalent expression:where denotes highest ordinate point between and . Both and values are required to compare and .
- Step 4:
- Computation of the minimum possibility degree of for ) can be defined asIf we assume thatThen, we can define the weight vector bywhere for are the objects
- Step 5:
- Normalize weight vectors as belowW denotes a non-fuzzy number.
3.2. FTOPSIS
TOPSIS is another widely used MCDM technique to solve decision-making problems in a variety of fields. TOPSIS is a linear weighting method proposed by [27]. The method was proposed initially in its crisp version. TOPSIS chooses an alternative that has the longest distance from a negative ideal solution and the shortest distance from a positive ideal solution. This method describes an index that measures the similarity to the positive ideal solution and differences to the negative ideal solution. Finally, the method selects an alternative which has more similarity to the positive ideal solution [28]. The classical TOPSIS approach uses crisp values to assign individual preferences. However, in reality, it often becomes hard for decision-makers to assign a precise performance score. Therefore, a better technique is considering vagueness and uncertainty instead of crisp values. Fuzzy integrates uncertainty in decision making, therefore, the FTOPSIS method is more appropriate to obtain solutions of real-life problems [29]. The FTOPSIS, in this paper, is used in the following steps:
- Step 1:
- Assign a rating to linguistic variables in relation to criteria and construct fuzzy matrixes for alternatives. Table 2 lists scoring used to rate linguistic variables.
Table 2. Ratings of linguistic variables.
- Step 2:
- Construct fuzzy decision/performance matrixwhere denotes performance rating of alternative with respect to criteria evaluated by kth decision matrix, and .
- Step 3:
- Compute the normalized fuzzy decision/performance matrix. Data is normalized to obtain a comparable measure by using linear scale transformation as belowwhere (i = 1,2,3,4,5, …, m) and (j = 1,2,3,4,5, …, n),
- Step 4:
- Compute the weighted normalized matrix using the given equations:where shows the weight of criterion. Criteria weights used here are obtained from the FAHP method.
- Step 5:
- Find the fuzzy positive ideal solution (FPIS) and fuzzy negative ideal solution (FNIS) respectively as follows
- Step 6:
- Determine the distance of alternatives from FPIS and FNIS as follows
- Step 7:
- Compute closeness coefficient () as follows
- Step 8:
- Obtain final ranking of alternatives using values.
3.3. Environmental Data Envelopment Analysis (DEA)
Data envelopment analysis (DEA) is a nonparametric measure of efficiency. DEA does not need any profound information of production process of “decision-making unit” (DMU) [30]. For DEA efficiency evaluation, it is suffice to select proper inputs, outputs, and undertake some assumptions regarding the technological structure pertaining to disposability, convexity, and returns to scale [31].
The standard DEA, as described in [32], depends on the assumption that inputs need to be minimized and outputs need to be maximized. However, as mentioned in the seminal work of Koopman [33], the production process can also produce undesirable outputs (e.g., wastes or pollutants) as byproducts from an environmental perspective. The classical DEA models do not take into account asymmetry between desirable and undesirable outputs and therefore result in erroneous calculations and biased performance assessment.
Since the hydrogen production process also produces undesirable outputs (e.g., CO2 emission), we rely on directional measures [34] to incorporate undesirable outputs in classical DEA efficiency models. Directional measures treat both desirable and undesirable outputs differently.
Incorporation of desirable and undesirable output requires a redefinition of the production function. For instate, the initial vector of outputs redefined into , with desirable outputs and as undesirable. Therefore the corresponding reference technology , shows weak disposability of undesirable outputs (for more details see [35]). In such a case, the observation of directional efficiency measure along a pre-assigned direction corresponding to the vector of output , corresponds to the solution of the following model:
Subject to
Here the optimal solution corresponds to , the observation is directional efficient if , with (). Otherwise, shows inefficiency and outdoes . The model also calculates non-directional slacks, checking for excess in inputs and undesirable outputs or any shortfall in desirable outputs.
4. Case Study
The developed framework was applied to solve the decision-making problem of selecting hydrogen production technologies in Pakistan. It is very significant to consult professional and experienced experts while applying any MCDM approach. Initially, 20 experts were asked to participate in the study. The questionnaire survey was distributed to experts through webmail service. However, four experts could not participate, so the final list included 16 experts. Each of the expert were asked to weight the importance using pairwise comparison matrix of the criteria, sub- criteria and alternatives. The experts who participated belong to academia, energy department, economists, stakeholders, and research specialists. The demographic information of the experts is presented in Table 3.
Table 3.
The demographic information of experts.
The reason Pakistan was selected as a case study is that Pakistan is an energy deficient country that is struggling to adopt new approaches to address its decades-long energy crisis [36]. Being new to the concept of the hydrogen economy, Pakistan should not take the same inefficient steps, which developed countries used during their initial phase of transition to a hydrogen economy. Instead, Pakistan, following the lessons learnt by developed countries, should leapfrog the inefficient steps and adopt efficient technologies and processes for implementing a hydrogen economy. The case study is implemented according to the proposed framework as follows:
4.1. Selection of Alternatives
Hydrogen is an abundantly available element on the earth. However, it is almost always found as a component of other compounds. For instance, hydrogen is found in water (H2O), and if hydrogen is to be used as fuel, then it must be separated from oxygen [37]. Apart from water, other diverse sources that can produce hydrogen include fossil fuels, biomass, and several other domestic sources. Energy efficiency, environmental impacts, and cost of hydrogen depend on the process through which it is produced [38].
There are numerous ways to produce hydrogen. However, this study shall only consider technological processes which can be applied in the Pakistani context. These processes include thermochemical, electrolysis, direct solar water spiriting, and biological process [39]. These technologies have great scope in Pakistan after their recent breakthrough. However, the transformation from fossil fuel economy to hydrogen needs solutions of various complex technological challenges. The provision of cost-competitive hydrogen energy of adequate quality and quantity is the basis of hydrogen economy. Therefore, we analyzed available hydrogen production processes to find the best hydrogen production process in terms of environmentally clean and economically viable. Figure 2 shows 11 selected alternatives under each process. These alternatives are also briefly explained as follows.
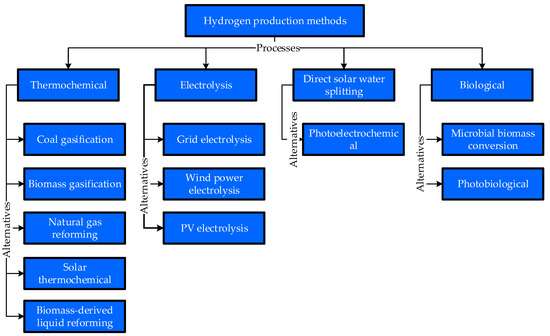
Figure 2.
Hydrogen production alternatives.
4.1.1. Thermochemical Process
Some thermochemical processes use chemical reactions and energy to release hydrogen from the molecular structure of various organic materials such as coal, biomass, and natural gas. Other processes produce hydrogen from feedstock by combining heat with closed-chemical cycles. The most common and viable thermochemical processes are coal gasification, biomass gasification, and natural gas reforming [13].
Coal Gasification
Coal is a highly variable and complex substance that can be transformed into a range of products. Coal gasification is a method that converts coal into chemicals, liquid fuels, and hydrogen. Coal is initially reacted with steam and oxygen under extreme temperature and pressure to create syngas, a mixture of hydrogen (H2) and carbon monoxide (CO) [40]. Once impurities are separated from the synthesis gas, water-gas reaction reacts CO to produce additional hydrogen and CO2. Later, the separation system removes hydrogen, and subsequently captures and stores the highly concentrated carbon stream.
Biomass Gasification
Biomass, a renewable resource, includes animal dung, agriculture crop residue, forest residue, crops grown for energy use (e.g., willow trees or switchgrass), and organic municipal solid waste. This renewable resource can produce hydrogen and other byproducts through gasification. The process of biomass gasification uses a controlled amount of oxygen, heat, and steam to convert biomass into hydrogen, CO, and CO2, without combustion. The CO then reacts with water to produce CO2 and additional hydrogen through a water-gas shift reaction. Absorbers or special membranes are used to split hydrogen from the gas stream [41].
Natural Gas Reforming
Natural gas reforming develops upon the existing infrastructure of gas delivery. It is an advanced and mature hydrogen production process. Methane (CH4) in natural gas can produce hydrogen through the thermal process. The primary thermal ways to convert CH4 into hydrogen involve reaction with either oxygen (partial oxidation), steam (steam reforming), or a sequence of both (autothermal reforming) [13]. Practically, gas mixtures containing CO, CO2, and CH4 require further processing. The reaction of carbon monoxide with steam over a catalyst generates an extra amount of hydrogen and carbon dioxide, and only after purification, high-purity hydrogen is obtained. Most often, CO2 vents into the atmosphere; however, numerous options exist to capture it for sequestration.
Solar Thermochemical
Thermochemical water splitting drives a series of chemical reactions under extreme temperature (500–2000 °C) that split water into hydrogen and oxygen. Chemicals used in this process are recycled within each chemical reaction creating closed loops that only use water to generate oxygen and hydrogen. This process produces low or no greenhouse gases and therefore is considered as a long-term technology pathway [42]. Numerous cycles of solar thermochemical water splitting have been examined for hydrogen production, each having different operation conditions, challenges, and production opportunities. In fact, the literature shows more than 300 cycles of solar thermochemical water splitting [43]. The two most common cycles include the direct (two-stem cerium oxide) and the hybrid (copper chloride cycle). Figure 2 illustrates the schematic of these cycles. Direct cycles have fewer steps and are typically less complicated; however, they require a higher temperature compared with complicated hybrid cycles.
Biomass-Derived Liquid Reforming
The liquid obtained from biomass includes bio-oils, cellulosic ethanol, and other liquid biofuels can be reformed for hydrogen production [44]. These liquids are easier to transport compared to biomass feedstock allowing hydrogen reforming at fueling stations, stationary power cites, or semi-central production facilities. The large and centralized liquid producing facilities can be established near the biomass source to exploit economies of scale and reduce transportation cost of solid biomass feedstock [45].
The process of hydrogen reforming from biomass-derived liquids is similar to natural gas reforming, and involves the following three steps:
- In the presence of a catalyst, liquids are reacted with steam at high heat to form reformate gas composed mainly of CO, CO2, and hydrogen.
- Excess amount of hydrogen and CO2 are produced by reacting CO with high-heat steam in the “water-gas shift reaction.”
- In the final step, hydrogen is parted and purified.
4.1.2. Electrolysis Process
Electrolysis uses electricity to split water into oxygen and hydrogen. Electrolysis is of interest as a promising source because it uses water to produce hydrogen, and water is abundantly available as compared to hydrocarbons. The reaction of splitting water takes place in the electrolyzer. The sizes of electrolyzer vary. Small sized electrolyzers are appropriate for small scale hydrogen production. Large sized are well-suited for centralized production facilities that could be connected directly to any form of electricity (renewable or non-renewable) production [46]. Electrolyzers, like fuel cells, have an anode and a cathode detached by an electrolyte. Functions of different electrolyzers are slightly different from each other, mainly because of being built up of different kinds of electrolyte material. Electrolysis technology is well-developed and commercially available [39].
Grid Electrolysis
The grid electrolysis uses conventional electricity to produce hydrogen. In this process, electrolysis is connected to the electricity grid. This process is a fast and cheap way of transitioning to a hydrogen economy [47]. Currently, grid electricity costs Rs. 20.79 kWh [36]. However, this option is not viable in remote areas with lack of access to reliable electricity. In addition, even though the process of electrolysis is itself clean, however, the process of grid electrolysis contributes greenhouse gas emissions because most of the grid electricity in Pakistan is produced from fossil fuels [48].
Wind Electrolysis
The process of wind electrolysis is quite similar to the grid electrolysis except for one difference: the electrolyzer in wind electrolysis is connected to the electricity produced using wind turbines. Wind electrolysis is a viable technique to produce clean hydrogen. The process enables the better use of indigenous renewable energy sources. Wind electrolysis, due to being a green method, can help to reduce greenhouse gas emissions while integrating a larger share of clean energy into the electric grid [48]. For a larger penetration of renewable energy, wind electrolysis for hydrogen production must be cost competitive. Besides low production cost, transportation and storage costs factors should also be taken into the final hydrogen production cost. These factors necessitate the investigation of wind class sites, considering the geographical distance from the end-user [49]. Currently, Europe is the leader in the field of hydrogen production via wind electrolysis. The European Union has recently implemented a successful demonstration of wind electrolysis based hydrogen production project in Spain and Greece. The project involved hydrogen storage, desalination technology, and fuel cells, and provided renewable hydrogen energy for power supply, energy storage, and supply of fresh water [50].
PV Electrolysis
The large solar energy resource potential, the advancement in its technology, and the rapidly falling cost drive the rapid growth of utility-scale solar electricity generating plants [51]. The maturity in solar electricity generation provides a viable opportunity for hydrogen generation from solar electrolysis. Solar electrolysis is the process of producing hydrogen via solar splitting water. The solar electrolysis presents a promising solution to the challenges of hydrogen storage, transportation, and generation without producing harmful byproducts [52].
4.1.3. Direct Solar Water Splitting Process
The process of direct solar water splitting produces hydrogen by splitting water with the help of light energy. Currently, this process is at the early stage of research. However, it provides great potential and a long-term sustainable option for hydrogen production with minimum impacts on the environment [13]. Below is the process of solar water splitting:
Photoelectrochemical
Photoelectrochemical water splitting produces hydrogen from splitting water using specialized semiconductors and sunlight. These specialized semiconductors are called photoelectrochemical materials, which use energy from sunlight to directly separate water molecules into oxygen and hydrogen. The process of photoelectrochemical is a long-term hydrogen production pathway with the lowest greenhouse gas emissions [53].
4.1.4. Biological Process
Microbes such as microalgae and bacteria can produce hydrogen via biological reactions by using organic material and sunlight. Biological processes, similar to direct solar water splitting processes, are also at an early stage of research. Biological processes of hydrogen production provide a sustainable and low-carbon option for hydrogen production [54]. Given below are two common biological processes. These processes are found to be less energy intensive and more environmental friendly as compared to electrochemical and thermochemical processes [55].
Microbial Biomass Conversion
The microbial process uses the ability of the microorganism to consume and digest biomass and produce hydrogen. Microbial systems can be suitable for central, semi-central, or distributed hydrogen production depending on the feedstock used [56]. There are different ways of microbial process. The fermentation-based process uses microorganisms, such as bacteria, to convert organic matter into hydrogen. The organic matter can be raw biomass sources, refined sugar, and even wastewater. This method is sometimes called the dark fermentation method due to no requirement of light in the process. The direct hydrogen fermentation process uses microbes themselves to produce hydrogen [57]. Microbes break complex molecules via various pathways. These pathways generate byproducts, and the enzymes combine these byproducts to produce hydrogen. Researchers are paying adequate attention to improve the yield (using the same amount of organic matter) and the speed of hydrogen production from fermentation [58]. In fact, the yield has been improved. There used to be a ceiling for hydrogen production (4 mol H2/mol glucose). Recently, strains have been developed showing hydrogen production can be up to 8 mol H2/mol glucose [59].
Photobiological
In the photobiological process, microorganisms, such as cyanobacteria and microalgae, use sunlight to convert water, and sometimes organic matter, into oxygen and hydrogen ions [60]. The hydrogen ions, once combined via direct and indirect ways, are released as hydrogen gas. Some photosynthetic microbes use sunlight to disintegrate organic matter to produce hydrogen. This process is called the photo-fermentative process of hydrogen production. Recently, the photobiological process has significantly progressed, and is being considered as a mature technology. Few challenges that make this process unviable at this time include low rates of hydrogen production and solar to hydrogen efficiency [50].
4.2. Compute Initial Weights of Criteria Using FAHP
Six variables were selected for the analysis. These variables include three inputs (capital cost, operation and maintenance O&M cost, and feedstock cost), one desirable output (amount of hydrogen production in kg), and one undesirable output (CO2 emission).
The first step was to compute initial weights using FAHP includes incorporating experts’ judgments into the pairwise matrix, which is given in Table 4.
Table 4.
Pairwise matrix of the fuzzy analytical hierarchy process (FAHP).
Later, the fuzzy synthetic () values of variables were calculated using Equation (8) as below:
These values were compared to calculate the possibility degree . The comparison of is presented in Table 5.
Table 5.
Results of possibility degree .
Once values of were compared; we used Equation (10) to find minimum degree possibility of each variable as below:
Subsequently, we can define weight vector as follows:
Finally, the weight vector was normalized using Equation (13) to obtain the initial weights of each criterion. Figure 3 shows the initial weights of criteria.
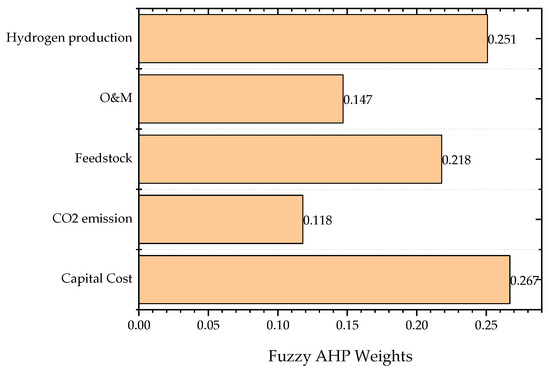
Figure 3.
Initial weights of criteria.
4.3. Determine Ultimate Weights Using FTOPSIS
After computing the initial weights of variables, the FTOPSIS was applied to determine the ultimate weights of each variable against each criterion. Firstly, the fuzzy decision matrix was constructed to transform the linguistic variables using Equation (14). Later, Equation (15) was applied to convert fuzzy decision matrix into normalized decision matrix. The normalized decision matrix was then multiplied with FAHP weights to form a weighted decision matrix using Equation (17). Table 6, Table 7 and Table 8 present fuzzy decision, normalized decision, and weighted decision matrices, respectively.
Table 6.
Fuzzy decision matrix of criteria.
Table 7.
Normalized fuzzy decision matrix.
Table 8.
Weighted fuzzy decision matrix.
After constructing the weighted fuzzy decision matrix, FPIS and FNIS were calculated using Equations (18) and (19), respectively. Equation (20) was used to determine the distance of alternatives for each variable from FPIS and FNIS. Equation (21) was applied to obtain the ultimate weights of variables for each alternative. Table A1, Table A2, Table A3, Table A4, Table A5 in Appendix A show values of distance from FPIS and FNIS, and ultimate weights of capital cost, CO2 emission, feedstock cost, O&M cost, and hydrogen production, respectively. Finally, the ultimate weights were normalized, which are given in Table 9.
Table 9.
Normalized ultimate weights.
4.4. Slack-Based Environmental DEA
Slack-based environmental DEA was applied to obtain the directional efficiency of the alternatives. Capital, feedstock, and O&M costs were used as input variables, hydrogen production as desirable output, and CO2 emission as undesirable output. The ultimate weights of these variables were used in DEA to compute the efficiency scores (given in Table 10).
Table 10.
Efficiency scores of alternatives.
The 0 efficiency score implies that the hydrogen production process is fully efficient. Any score above 0 shows inefficiencies in the process. Accordingly, the ranking of hydrogen production processes was undertaken, as shown in Table 9.
The slacks show any shortfall of desirable output, and any excess of inputs and undesirable output, as given in Table 11.
Table 11.
Slacks of inputs, desirable outputs, and undesirable outputs.
5. Results and Findings
The results of the study are divided into three parts. The first part of the results comprises initial weights, calculated using FAHP, the second presents ultimate weights, computed using FTOPSIS, while the final part presents the ranking of alternatives and analyses of inputs, desirable output, and undesirable output slacks, measured using slack-based environmental DEA.
The result of FAHP shows that the capital cost, which is an input variable, received the highest initial weight of 0.267. Hydrogen production, which is a desirable output variable, achieved the second highest weight of 0.251. Feedstock, an input variable, got the third highest weight of 0.218. CO2 emission, an undesirable output, received 0.118 while O&M, an input variable, reported achieving the lowest initial weight of 0.147.
We used these initial weights in FTOPSIS to compute the ultimate weights of criteria for each alternative. By doing so, we could also minimize the vagueness involved in the process of obtaining criteria weights. Table 1 presents the results of the ultimate weights calculated for each alternative.
Finally, the slack-based environmental DEA ranks the alternatives, i.e., hydrogen production technologies, according to their feasibility in the context of Pakistan. Table 1 shows the final ranking of alternatives. It can be seen that three technologies, i.e., PV electrolysis, wind power electrolysis, and biomass gasification, received an efficiency score of 0, which shows the level of full efficiency. Subsequently, these three technologies were ranked first. The interesting point here is that all of these three technologies produce hydrogen from renewable energy sources, which are abundant in Pakistan. Additionally, these technologies are mature and already being used to generate electricity in the country.
Grid electrolysis achieved the fourth position. However, it is still not suggested due to being an inefficient source as we can see its efficiency score is 0.573, which is quite larger than an efficient score of ‘0’. The rest of the ranking is as follows: Solar thermochemical > Photobiological > Natural gas reforming > Coal gasification > Photoelectrochemical > Biomass-derived liquid reforming > Microbial biomass conversion.
Currently, except first-ranked technologies, all the rest are not recommended in Pakistan. To meet the environmental efficiency level, set by the top-three technologies, the rest of the technologies need a massive reduction, mainly in their input variables. The slack analysis enables to find out necessary reductions in inputs, and undesirable outputs. The results of the slack analysis, given in Table 2, show that in order to achieve a fully efficient level, the grid electrolysis must reduce capital cost by 72.13%, feedstock cost by 88.45%, and CO2 emission by 37.69%.
Similarly, the photobiological technology can be efficient if capital cost is reduced by 88.75%, feedstock cost by 98.46%, and O&M cost by 91.20%. Natural gas reforming must decrease feedstock cost by 83.58%, and O&M cost by 71.17%. Coal gasification needs to reduce feedstock, O&M, and CO2 emission by 79.18%, 65.35%, and 37.47%, respectively. For photoelectrochemical to achieve an efficient level, there is a need to decrease capital, feedstock, and O&M costs by 97.60%, 99.36%, and 97.14%, respectively. Biomass-derived liquid reforming can be an efficient hydrogen production option in Pakistan if the technology reduces capital cost by 87.68%, feedstock cost by 98.66%, and O&M cost by 92%. The microbial biomass conversion technology needs 97.70% reduction in capital cost, 99.49% reduction in feedstock cost, and 97.81% reduction in O&M cost.
6. Conclusions
The paper presented a framework to evaluate the economic and environmental efficiency of hydrogen production processes for decarbonization of energy systems. Since the production processes produce undesirable outputs as well, therefore, environmental DEA was applied for assessing the sustainability of these processes. A common problem that arises from applying environmental DEA is that the DEA ignores the relative importance of variables while assigning weights to each variable. Tackling this issue, the proposed framework firstly used two widely-applied MCDA techniques, i.e., FAHP and FTOPSIS, before employing the environmental DEA to assess the efficiency of hydrogen production processes.
The proposed framework was applied to prioritize the most sustainable hydrogen production process in Pakistan. Eleven hydrogen production alternatives under four main processes, i.e., thermochemical, electrolysis, direct solar water splitting, and biological processes, were analyzed. Five alternatives under the thermochemical process include coal gasification, biomass gasification, solar thermochemical, natural gas reforming, and biomass-derived liquid reforming. The electrolysis processes included three alternatives, i.e., grid electrolysis, wind electrolysis, and PV electrolysis. The photoelectrochemical alternative was selected under the direct solar water splitting process, whereas microbial biomass conversion and photobiological alternatives were shortlisted for analysis under the biological process.
Shortlisted alternatives were evaluated based on five criteria. These criteria included three inputs (capital cost, O&M cost, and feedstock cost), one desirable output (hydrogen production), and one undesirable output (CO2 emission). The initial weights of criteria were obtained using FAHP, and then FTOPSIS was applied to compute the ultimate weights of each criterion for each alternative. Finally, the slack-based environmental DEA was employed to assess the most sustainable hydrogen production process in the Pakistan context. The results of the study showed that the wind electrolysis, PV electrolysis, and biomass gasification are the most sustainable hydrogen production processes in Pakistan. The rest of the eight alternatives were not recommended due to their poor efficiency scores. However, these may become sustainable choices in the future if deficiencies pointed out in slack analysis are appropriately improved.
Author Contributions
All the authors contributed to this work. L.X. and Y.W. supervised the work and developed the concept. S.A.A.S. prepared the original draft and structured the study. S.A.A.S., H.Z. and Y.A.S. undertook the survey and developed the model and preliminary manuscript. G.D.W. and Z.A.S. analyzed the results and finalized the manuscript.
Funding
1. National Natural Science Foundation of China (Grant No. 71873064), Research on OFDI driving low-carbon upgrading of China’s equipment manufacturing global value chain: theoretical mechanism, implementation path and performance evaluation. 2. General Projects of Humanities and Social Sciences of the Ministry of Education (Planning Projects) (Grant No. 18YJA790085), Performance evaluation of OFDI driving low-carbon upgrading of China’s equipment.
Conflicts of Interest
The authors declare no conflict of interest.
Appendix A
Table A1.
Distance from fuzzy positive ideal solution (FPIS) and fuzzy negative ideal solution (FNIS), and ultimate weights of capital cost.
Table A1.
Distance from fuzzy positive ideal solution (FPIS) and fuzzy negative ideal solution (FNIS), and ultimate weights of capital cost.
| Capital Cost | |||
|---|---|---|---|
| d+ | d− | Ultimate Weight | |
| Coal gasification | 1.0499 | 0.2008 | 0.1606 |
| Natural gas reforming | 0.9501 | 0.3006 | 0.2403 |
| Biomass gasification | 1.1496 | 0.0997 | 0.0798 |
| Solar thermochemical | 0.2493 | 1 | 0.8004 |
| Biomass-derived liquid reforming | 0.5499 | 0.7004 | 0.5602 |
| Grid electrolysis | 1.1496 | 0.0997 | 0.0798 |
| Wind power electrolysis | 0.8989 | 0.3504 | 0.2805 |
| PV electrolysis | 1.0997 | 0.1498 | 0.1199 |
| Photoelectrochemical | 0.0499 | 1.1994 | 0.9601 |
| Microbial biomass conversion | 0 | 1.2493 | 1 |
| Photobiological | 0.2493 | 1 | 0.8004 |
Table A2.
Distance from FPIS and FNIS, and ultimate weights of CO2 emission.
Table A2.
Distance from FPIS and FNIS, and ultimate weights of CO2 emission.
| CO2 Emission | |||
|---|---|---|---|
| d+ | d− | Ultimate Weight | |
| Coal gasification | 0 | 2.446 | 1 |
| Natural gas reforming | 0.5 | 1.9531 | 0.7962 |
| Biomass gasification | 0.4496 | 1.9964 | 0.8162 |
| Solar thermochemical | 2.2482 | 0.1986 | 0.0812 |
| Biomass-derived liquid reforming | 1.0971 | 1.3489 | 0.5515 |
| Grid electrolysis | 0.3489 | 2.0971 | 0.8574 |
| Wind power electrolysis | 2.3957 | 0.0504 | 0.0206 |
| PV electrolysis | 2.3957 | 0.0504 | 0.0206 |
| Photoelectrochemical | 2.2482 | 0.1986 | 0.0812 |
| Microbial biomass conversion | 1.7482 | 0.6978 | 0.2853 |
| Photobiological | 2.1475 | 0.2986 | 0.1221 |
Table A3.
Distance from FPIS and FNIS, and ultimate weights of feedstock cost.
Table A3.
Distance from FPIS and FNIS, and ultimate weights of feedstock cost.
| Feedstock Cost | |||
|---|---|---|---|
| d+ | d− | Ultimate Weight | |
| Coal gasification | 1.3498 | 0.7496 | 0.3571 |
| Natural gas reforming | 1.1007 | 1 | 0.476 |
| Biomass gasification | 0.4011 | 1.6996 | 0.8091 |
| Solar thermochemical | 1.8483 | 0.2491 | 0.1188 |
| Biomass-derived liquid reforming | 0.2504 | 1.8498 | 0.8808 |
| Grid electrolysis | 0.5 | 1.6007 | 0.762 |
| Wind power electrolysis | 2.0018 | 0.0989 | 0.0471 |
| PV electrolysis | 2.0018 | 0.0989 | 0.0471 |
| Photoelectrochemical | 0.7509 | 1.3498 | 0.6425 |
| Microbial biomass conversion | 0.4011 | 1.6996 | 0.8091 |
| Photobiological | 0 | 2.1007 | 1 |
Table A4.
Distance from FPIS and FNIS, and ultimate weights of O&M Cost.
Table A4.
Distance from FPIS and FNIS, and ultimate weights of O&M Cost.
| O&M Cost | |||
|---|---|---|---|
| d+ | d− | Ultimate Weight | |
| Coal gasification | 0.6995 | 1 | 0.5884 |
| Natural gas reforming | 0.1009 | 1.5986 | 0.9406 |
| Biomass gasification | 0.1502 | 1.5493 | 0.9116 |
| Solar thermochemical | 0.9507 | 0.7488 | 0.4406 |
| Biomass-derived liquid reforming | 0.3005 | 1.3991 | 0.8232 |
| Grid electrolysis | 1.2512 | 0.4484 | 0.2638 |
| Wind power electrolysis | 1.2512 | 0.4484 | 0.2638 |
| PV electrolysis | 1.4507 | 0.2488 | 0.1464 |
| Photoelectrochemical | 0.4005 | 1.2981 | 0.7642 |
| Microbial biomass conversion | 0 | 1.6995 | 1 |
| Photobiological | 0.0493 | 1.6502 | 0.971 |
Table A5.
Distance from FPIS and FNIS, and ultimate weights of hydrogen production.
Table A5.
Distance from FPIS and FNIS, and ultimate weights of hydrogen production.
| Hydrogen Production | |||
|---|---|---|---|
| d+ | d− | Ultimate Weight | |
| Coal gasification | 0.5494 | 0.7508 | 0.5774 |
| Natural gas reforming | 0.3495 | 0.9498 | 0.731 |
| Biomass gasification | 0.199 | 1.1003 | 0.8468 |
| Solar thermochemical | 1 | 0.301 | 0.2314 |
| Biomass-derived liquid reforming | 1.1488 | 0.1505 | 0.1158 |
| Grid electrolysis | 0 | 1.2993 | 1 |
| Wind power electrolysis | 0.1003 | 1.201 | 0.9229 |
| PV electrolysis | 0.199 | 1.1003 | 0.8468 |
| Photoelectrochemical | 1.2492 | 0.0502 | 0.0386 |
| Microbial biomass conversion | 1.2492 | 0.0502 | 0.0386 |
| Photobiological | 1.0987 | 0.2007 | 0.1545 |
References
- Parra, D.; Valverde, L.; Pino, F.J.; Patel, M.K. A Review on the Role, Cost and Value of Hydrogen Energy Systems for Deep Decarbonisation. Renew. Sustain. Energy Rev. 2019, 101, 279–294. [Google Scholar] [CrossRef]
- Staffell, I.; Scamman, D.; Abad, A.V.; Balcombe, P.; Dodds, P.E.; Ekins, P.; Shah, N.; Ward, K.R. The Role of Hydrogen and Fuel Cells in the Global Energy System. Energy Environ. Sci. 2019, 12, 463–491. [Google Scholar] [CrossRef]
- Hanley, E.S.; Deane, J.P.; Gallachóir, B.P.Ó. The Role of Hydrogen in Low Carbon Energy Futures—A Review of Existing Perspectives. Renew. Sustain. Energy Rev. 2018, 82, 3027–3045. [Google Scholar] [CrossRef]
- Grochala, W. First There Was Hydrogen. Nat. Chem. 2015, 7, 264. [Google Scholar] [CrossRef] [PubMed]
- Dincer, I.; Acar, C. A Review on Clean Energy Solutions for Better Sustainability. Int. J. Energy Res. 2015, 39, 585–606. [Google Scholar] [CrossRef]
- Cooperberg, D. Industrial Applications of Hydrogen. Hydrog. Technol. Implic. Util. Hydrog. 2018, 4. [Google Scholar]
- Melton, N.; Axsen, J.; Sperling, D. Moving beyond Alternative Fuel Hype to Decarbonize Transportation. Nat. Energy 2016, 1, 16013. [Google Scholar] [CrossRef]
- Dodds, P.E.; Staffell, I.; Hawkes, A.D.; Li, F.; Grünewald, P.; McDowall, W.; Ekins, P. Hydrogen and Fuel Cell Technologies for Heating: A Review. Int. J. Hydrog. Energy 2015, 40, 2065–2083. [Google Scholar] [CrossRef]
- Eichman, J.; Townsend, A.; Melaina, M. Economic Assessment of Hydrogen Technologies Participating in California Electricity Markets; National Renewable Energy Lab.(NREL): Golden, CO, USA, 2016. [Google Scholar]
- Pudukudy, M.; Yaakob, Z.; Mohammad, M.; Narayanan, B.; Sopian, K. Renewable Hydrogen Economy in Asia–Opportunities and Challenges: An Overview. Renew. Sustain. Energy Rev. 2014, 30, 743–757. [Google Scholar] [CrossRef]
- Midilli, A.; Dincer, I. Hydrogen as a Renewable and Sustainable Solution in Reducing Global Fossil Fuel Consumption. Int. J. Hydrog. Energy 2008, 33, 4209–4222. [Google Scholar] [CrossRef]
- Sørensen, B.; Spazzafumo, G. Hydrogen and Fuel Cells: Emerging Technologies and Applications; Academic Press: Cambridge, MA, USA, 2018. [Google Scholar]
- Nikolaidis, P.; Poullikkas, A. A Comparative Overview of Hydrogen Production Processes. Renew. Sustain. Energy Rev. 2017, 67, 597–611. [Google Scholar] [CrossRef]
- Coelli, T.J.; Rao, D.S.P.; O’Donnell, C.J.; Battese, G.E. An Introduction to Efficiency and Productivity Analysis; Springer Science & Business Media: Berlin, Germany, 2005. [Google Scholar]
- Zimmermann, H.-J. Fuzzy Set Theory—And Its Applications; Springer Science & Business Media: Berlin, Germany, 2011. [Google Scholar]
- Zhou, P.; Ang, B.W.; Poh, K.L. Slacks-Based Efficiency Measures for Modeling Environmental Performance. Ecol. Econ. 2006, 60, 111–118. [Google Scholar] [CrossRef]
- Acar, C.; Beskese, A.; Temur, G.T. Sustainability Analysis of Different Hydrogen Production Options Using Hesitant Fuzzy AHP. Int. J. Hydrog. Energy 2018, 43, 18059–18076. [Google Scholar] [CrossRef]
- Ren, J.; Toniolo, S. Life Cycle Sustainability Decision-Support Framework for Ranking of Hydrogen Production Pathways under Uncertainties: An Interval Multi-Criteria Decision Making Approach. J. Clean. Prod. 2018, 175, 222–236. [Google Scholar] [CrossRef]
- Ren, J.; Gao, S.; Tan, S.; Dong, L.; Scipioni, A.; Mazzi, A. Role Prioritization of Hydrogen Production Technologies for Promoting Hydrogen Economy in the Current State of China. Renew. Sustain. Energy Rev. 2015, 41, 1217–1229. [Google Scholar] [CrossRef]
- Yu, D. Hydrogen Production Technologies Evaluation Based on Interval-Valued Intuitionistic Fuzzy Multiattribute Decision Making Method. J. Appl. Math. 2014, 2014. [Google Scholar] [CrossRef]
- Ren, J.; Fedele, A.; Mason, M.; Manzardo, A.; Scipioni, A. Fuzzy Multi-Actor Multi-Criteria Decision Making for Sustainability Assessment of Biomass-Based Technologies for Hydrogen Production. Int. J. Hydrog. Energy 2013, 38, 9111–9120. [Google Scholar] [CrossRef]
- Pilavachi, P.A.; Chatzipanagi, A.I.; Spyropoulou, A.I. Evaluation of Hydrogen Production Methods Using the Analytic Hierarchy Process. Int. J. Hydrog. Energy 2009, 34, 5294–5303. [Google Scholar] [CrossRef]
- Saaty, T.L. Analytic Heirarchy Process. Wiley Statsref Stat. Ref. Online 2014. [Google Scholar] [CrossRef]
- Shah, S.A.A.; Solangi, Y.A.; Ikram, M. Analysis of Barriers to the Adoption of Cleaner Energy Technologies in Pakistan Using Modified Delphi and Fuzzy Analytical Hierarchy Process. J. Clean. Prod. 2019, 235, 1037–1050. [Google Scholar] [CrossRef]
- Patil, S.K.; Kant, R. A Fuzzy AHP-TOPSIS Framework for Ranking the Solutions of Knowledge Management Adoption in Supply Chain to Overcome Its Barriers. Expert Syst. Appl. 2014, 41, 679–693. [Google Scholar] [CrossRef]
- Chang, D.-Y. Applications of the Extent Analysis Method on Fuzzy AHP. Eur. J. Oper. Res. 1996, 95, 649–655. [Google Scholar] [CrossRef]
- Lai, Y.-J.; Liu, T.-Y.; Hwang, C.-L. Topsis for MODM. Eur. J. Oper. Res. 1994, 76, 486–500. [Google Scholar] [CrossRef]
- Şengül, Ü.; Eren, M.; Shiraz, S.E.; Gezder, V.; Şengül, A.B. Fuzzy TOPSIS Method for Ranking Renewable Energy Supply Systems in Turkey. Renew. Energy 2015, 75, 617–625. [Google Scholar] [CrossRef]
- Solangi, Y.; Tan, Q.; Khan, M.; Mirjat, N.; Ahmed, I. The Selection of Wind Power Project Location in the Southeastern Corridor of Pakistan: A Factor Analysis, AHP, and Fuzzy-TOPSIS Application. Energies 2018, 11, 1940. [Google Scholar] [CrossRef]
- Shah, S.A.A.; Zhou, P.; Walasai, G.D.; Mohsin, M. Energy Security and Environmental Sustainability Index of South Asian Countries: A Composite Index Approach. Ecol. Indic. 2019, 106, 105507. [Google Scholar] [CrossRef]
- Wang, Y.; Shah, S.A.A.; Zhou, P. City-Level Environmental Performance in China. Energy Ecol. Environ. 2018, 3, 149–161. [Google Scholar] [CrossRef]
- Charnes, A.; Cooper, W.W.; Rhodes, E. Measuring the Efficiency of Decision Making Units. Eur. J. Oper. Res. 1978, 2, 429–444. [Google Scholar] [CrossRef]
- Koopmans, T.C. An Analysis of Production as an Efficient Combination of Activities. Act. Anal. Prod. Alloc. 1951. [Google Scholar]
- Chung, Y.H.; Färe, R.; Grosskopf, S. Productivity and Undesirable Outputs: A Directional Distance Function Approach. J. Environ. Manag. 1997, 51, 229–240. [Google Scholar] [CrossRef]
- Cooper, W.W.; Seiford, L.M.; Tone, K. Introduction to Data Envelopment Analysis and Its Uses: With DEA-Solver Software and References; Springer Science & Business Media: Berlin, Germany, 2006. [Google Scholar]
- Shah, S.A.A.; Valasai, G.D.; Memon, A.A.; Laghari, A.N.; Jalbani, N.B.; Strait, J.L. Techno-Economic Analysis of Solar PV Electricity Supply to Rural Areas of Balochistan, Pakistan. Energies 2018, 11, 1777. [Google Scholar] [CrossRef]
- U.S. Department of Energy. Hydrogen Production and Distribution. Available online: https://afdc.energy.gov/fuels/hydrogen_production.html (accessed on 10 May 2019).
- Baykara, S.Z. Hydrogen: A Brief Overview on Its Sources, Production and Environmental Impact. Int. J. Hydrog. Energy 2018, 43, 10605–10614. [Google Scholar] [CrossRef]
- Gondal, I.A.; Masood, S.A.; Khan, R. Green Hydrogen Production Potential for Developing a Hydrogen Economy in Pakistan. Int. J. Hydrog. Energy 2018, 43, 6011–6039. [Google Scholar] [CrossRef]
- Seyitoglu, S.S.; Dincer, I.; Kilicarslan, A. Energy and Exergy Analyses of Hydrogen Production by Coal Gasification. Int. J. Hydrog. Energy 2017, 42, 2592–2600. [Google Scholar] [CrossRef]
- Shayan, E.; Zare, V.; Mirzaee, I. Hydrogen Production from Biomass Gasification; a Theoretical Comparison of Using Different Gasification Agents. Energy Convers. Manag. 2018, 159, 30–41. [Google Scholar] [CrossRef]
- Rao, C.N.R.; Dey, S. Solar Thermochemical Splitting of Water to Generate Hydrogen. Proc. Natl. Acad. Sci. USA 2017, 114, 13385–13393. [Google Scholar] [CrossRef]
- Villafán-Vidales, H.I.; Arancibia-Bulnes, C.A.; Riveros-Rosas, D.; Romero-Paredes, H.; Estrada, C.A. An Overview of the Solar Thermochemical Processes for Hydrogen and Syngas Production: Reactors, and Facilities. Renew. Sustain. Energy Rev. 2017, 75, 894–908. [Google Scholar] [CrossRef]
- Garcia, L.; French, R.; Czernik, S.; Chornet, E. Catalytic Steam Reforming of Bio-Oils for the Production of Hydrogen: Effects of Catalyst Composition. Appl. Catal. A Gen. 2000, 201, 225–239. [Google Scholar] [CrossRef]
- Schmitt, N.; Apfelbacher, A.; Jäger, N.; Daschner, R.; Stenzel, F.; Hornung, A. Thermo-chemical Conversion of Biomass and Upgrading to Biofuel: The Thermo-Catalytic Reforming Process—A Review. Biofuels Bioprod. Biorefin. 2019, 13, 822–837. [Google Scholar] [CrossRef]
- da Silva Veras, T.; Mozer, T.S.; da Silva César, A. Hydrogen: Trends, Production and Characterization of the Main Process Worldwide. Int. J. Hydrog. Energy 2017, 42, 2018–2033. [Google Scholar] [CrossRef]
- Mallouk, T.E. Water Electrolysis: Divide and Conquer. Nat. Chem. 2013, 5, 362. [Google Scholar] [CrossRef]
- Xu, L.; Wang, Y.; Solangi, Y.A.; Zameer, H.; Shah, S.A.A. Off-Grid Solar PV Power Generation System in Sindh, Pakistan: A Techno-Economic Feasibility Analysis. Processes 2019, 7, 308. [Google Scholar] [CrossRef]
- Saba, S.M.; Müller, M.; Robinius, M.; Stolten, D. The Investment Costs of Electrolysis—A Comparison of Cost Studies from the Past 30 Years. Int. J. Hydrog. Energy 2018, 43, 1209–1223. [Google Scholar] [CrossRef]
- Li, Z.; Guo, P.; Han, R.; Sun, H. Current Status and Development Trend of Wind Power Generation-Based Hydrogen Production Technology. Energy Explor. Exploit. 2019, 37, 5–25. [Google Scholar] [CrossRef]
- Chi, J.; Yu, H. Water Electrolysis Based on Renewable Energy for Hydrogen Production. Chin. J. Catal. 2018, 39, 390–394. [Google Scholar] [CrossRef]
- Badwal, S.P.S.; Giddey, S.; Munnings, C. Emerging Technologies, Markets and Commercialization of Solid-electrolytic Hydrogen Production. Wiley Interdiscip. Rev. Energy Environ. 2018, 7, e286. [Google Scholar] [CrossRef]
- Van de Krol, R.; Grätzel, M. Photoelectrochemical Hydrogen Production; Springer: New York, NY, USA, 2012; Volume 90. [Google Scholar]
- Singh, L.; Wahid, Z.A. Methods for Enhancing Bio-Hydrogen Production from Biological Process: A Review. J. Ind. Eng. Chem. 2015, 21, 70–80. [Google Scholar] [CrossRef]
- Das, D.; Veziroǧlu, T.N. Hydrogen Production by Biological Processes: A Survey of Literature. Int. J. Hydrog. Energy 2001, 26, 13–28. [Google Scholar] [CrossRef]
- Kumar, G.; Bakonyi, P.; Kobayashi, T.; Xu, K.-Q.; Sivagurunathan, P.; Kim, S.-H.; Buitrón, G.; Nemestóthy, N.; Bélafi-Bakó, K. Enhancement of Biofuel Production via Microbial Augmentation: The Case of Dark Fermentative Hydrogen. Renew. Sustain. Energy Rev. 2016, 57, 879–891. [Google Scholar] [CrossRef]
- Kumar, G.; Shobana, S.; Nagarajan, D.; Lee, D.-J.; Lee, K.-S.; Lin, C.-Y.; Chen, C.-Y.; Chang, J.-S. Biomass Based Hydrogen Production by Dark Fermentation—Recent Trends and Opportunities for Greener Processes. Curr. Opin. Biotechnol. 2018, 50, 136–145. [Google Scholar] [CrossRef]
- Cabrol, L.; Marone, A.; Tapia-Venegas, E.; Steyer, J.-P.; Ruiz-Filippi, G.; Trably, E. Microbial Ecology of Fermentative Hydrogen Producing Bioprocesses: Useful Insights for Driving the Ecosystem Function. Fems Microbiol. Rev. 2017, 41, 158–181. [Google Scholar] [CrossRef]
- Singh, R.; White, D.; Demirel, Y.; Kelly, R.; Noll, K.; Blum, P. Uncoupling Fermentative Synthesis of Molecular Hydrogen from Biomass Formation in Thermotoga Maritima. Appl. Environ. Microbiol. 2018, 84, e00998-18. [Google Scholar] [CrossRef]
- Khetkorn, W.; Rastogi, R.P.; Incharoensakdi, A.; Lindblad, P.; Madamwar, D.; Pandey, A.; Larroche, C. Microalgal Hydrogen Production—A Review. Bioresour. Technol. 2017, 243, 1194–1206. [Google Scholar] [CrossRef]
© 2019 by the authors. Licensee MDPI, Basel, Switzerland. This article is an open access article distributed under the terms and conditions of the Creative Commons Attribution (CC BY) license (http://creativecommons.org/licenses/by/4.0/).