The above examples present a variety of challenges: Datasets with low information content or ill-conditioned systems (with reactivity ratios of different orders of magnitude) can make estimation difficult. If the estimation steps are unstable, then one does not have confidence in the final estimates. Unfortunately, even with many data points, we do not always have all the required information. Therefore, the design of experiments for reactivity ratio estimation is key.
In the cases that follow, we present some case studies that highlight the advantages of analyzing terpolymerization data directly using ‘ternary’ reactivity ratio estimation. All three case studies were originally modelled using analogous binary reactivity ratios, where the terpolymerization data have been revisited and reanalyzed.
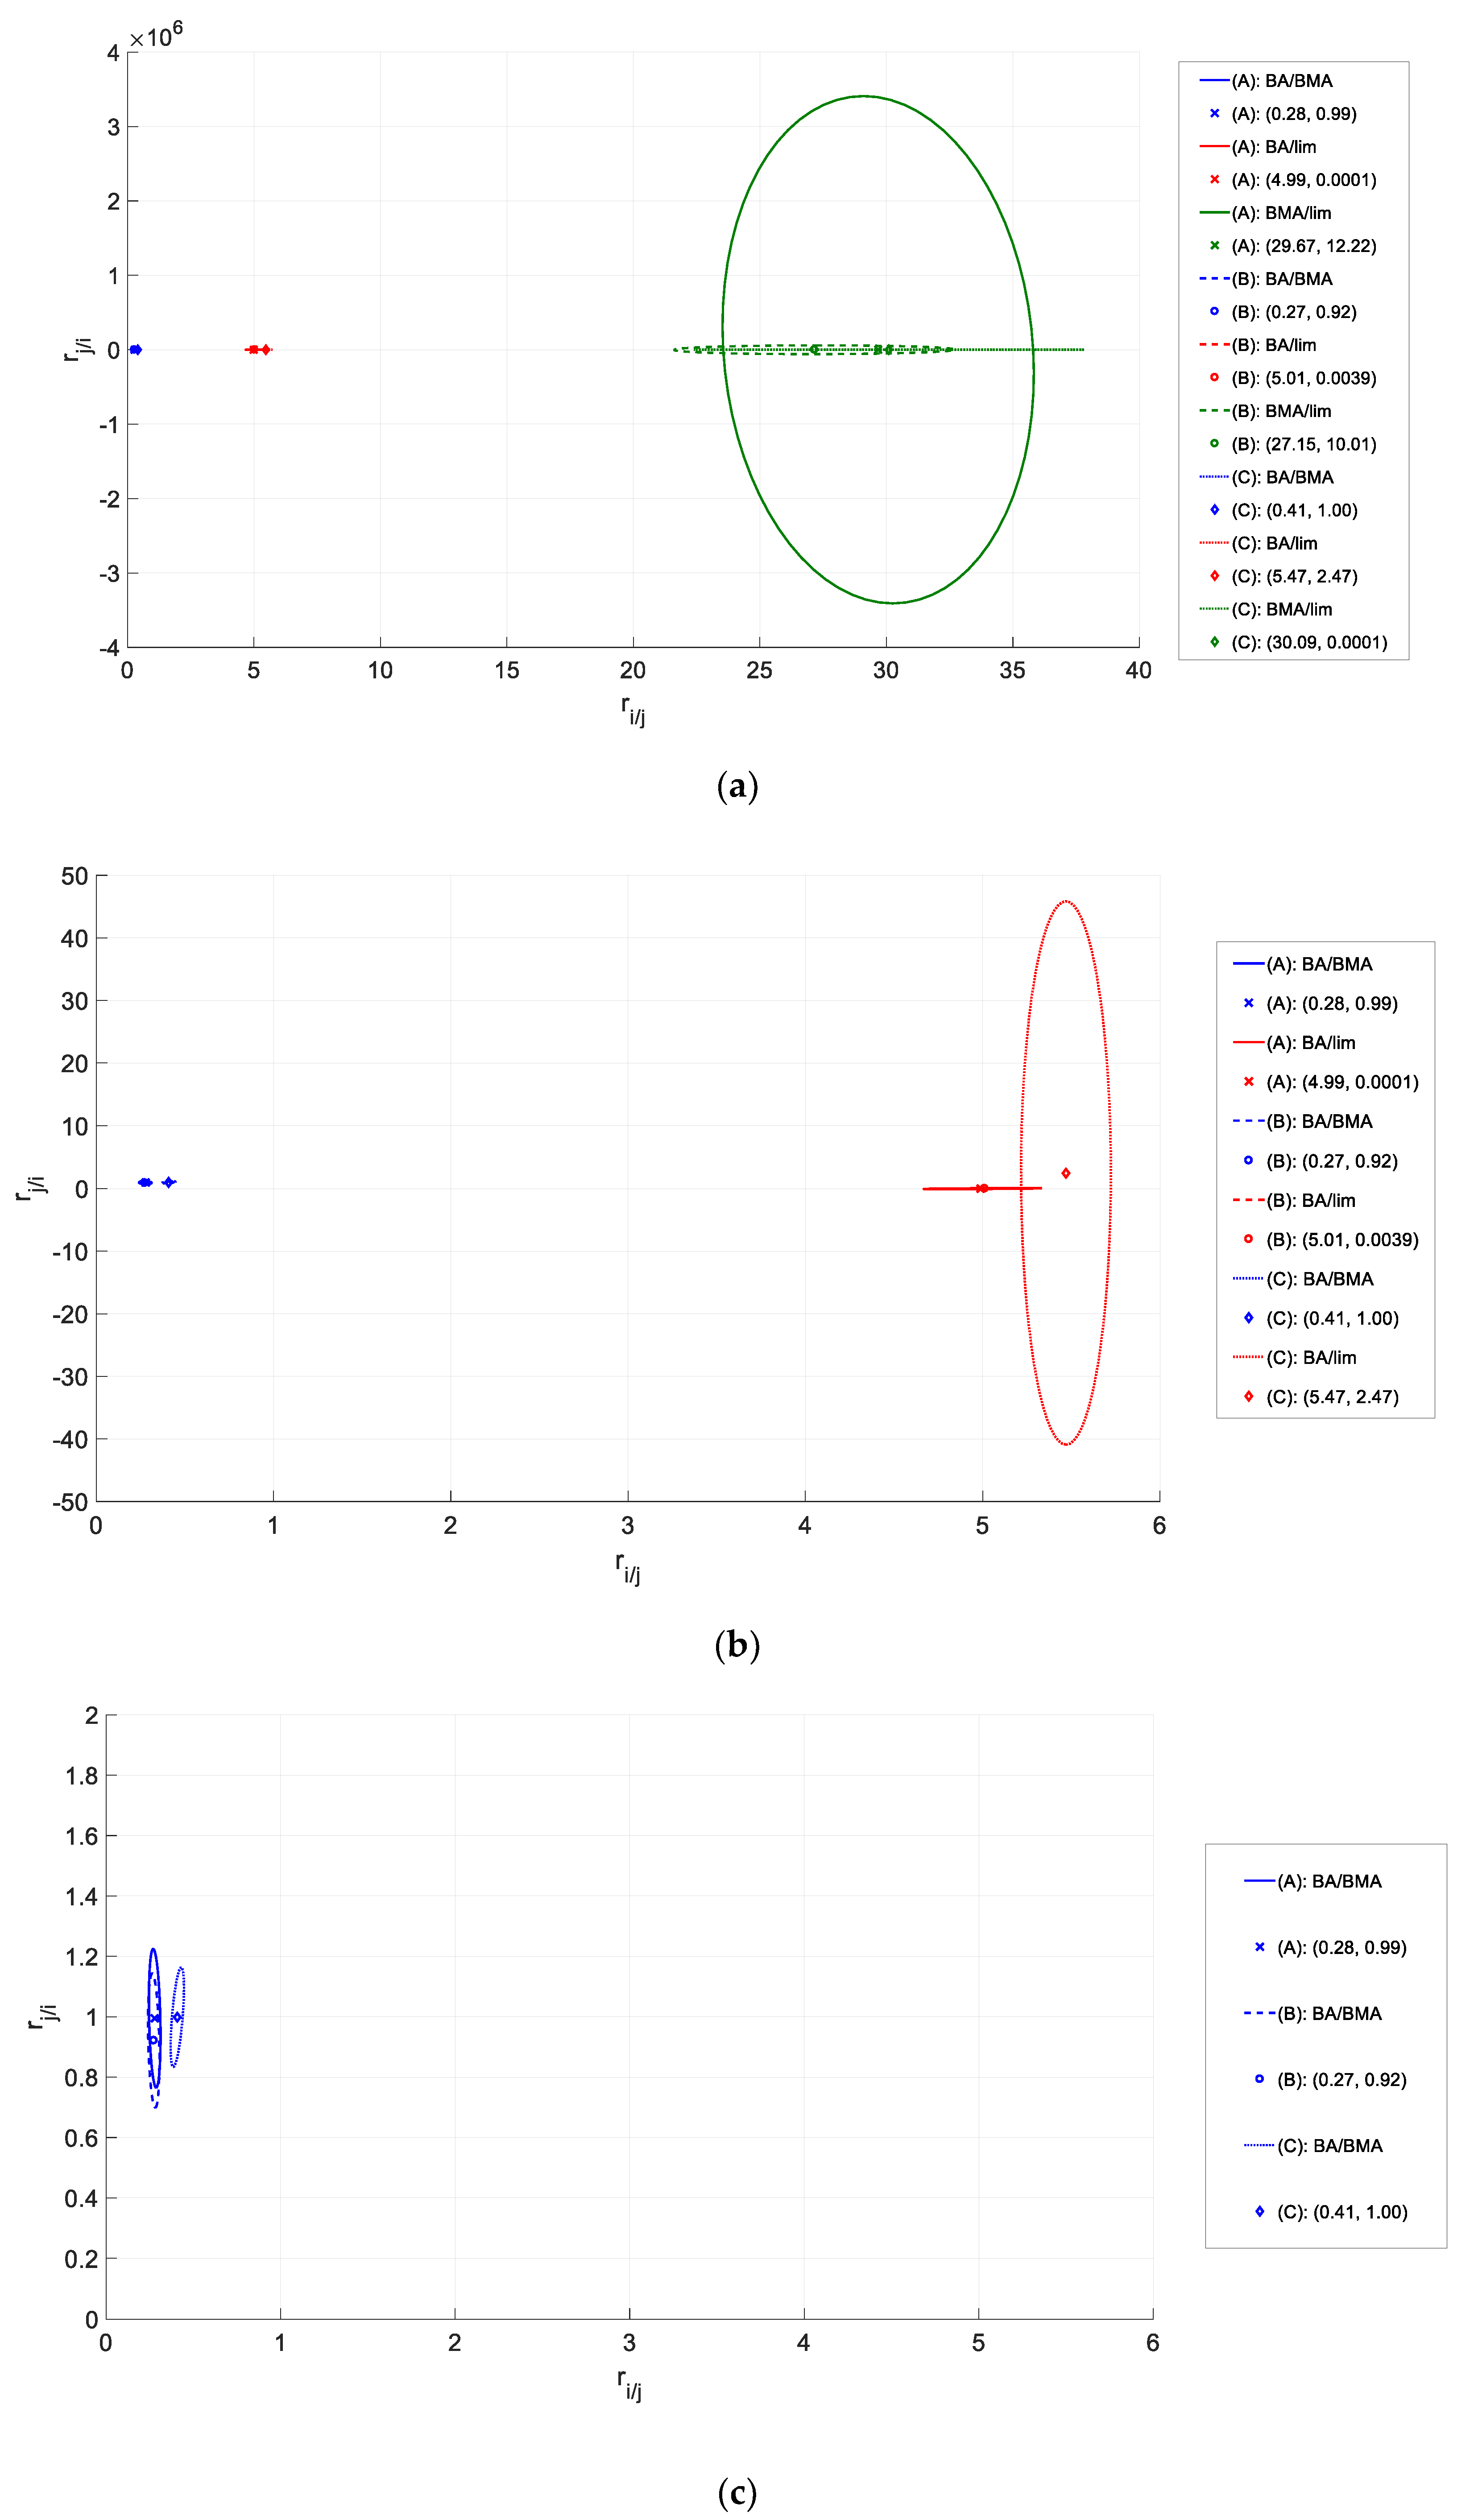
3.2.1. BA/MMA/EHA
A recent study by Gabriel and Dubé [
12] investigated the terpolymer of BA (monomer 1), methyl methacrylate (MMA; monomer 2), and 2-ethylhexyl acrylate (EHA; monomer 3), which is a material of interest for pressure sensitive adhesives. First, the authors determined the reactivity ratio pairs for two of the associated copolymers (BA/EHA and MMA/EHA), and subsequently used these binary reactivity ratios, along with literature values for the BA/MMA reactivity ratios, to predict the terpolymer composition. The terpolymer model prediction (using binary reactivity ratios) showed good agreement with the collected data, as described in the original work [
12].
In spite of the good results achieved using binary reactivity ratios, ‘ternary’ reactivity ratio estimation directly from terpolymerization data presents some additional advantages. First, we can consider the experimental load: Rather than nine experimental runs, as described by Gabriel and Dubé [
12] (and additional prior work for estimating the BA/MMA reactivity ratios [
33]), only three different feed compositions are required. Since Gabriel and Dubé [
12] selected ternary feed compositions according to the EVM ‘rule-of-thumb’ for ‘ternary’ reactivity ratio estimation [
21], we can use their data to re-estimate reactivity ratios directly from the terpolymerization data.
First, only the low conversion data were used for an instantaneous analysis. Now, because these data points were collected for model validation (not necessarily parameter estimation), only 7 data points are available below 20% conversion. These data (shown in
Table A2 of the
Appendix A) were used for ‘ternary’ reactivity ratio estimation using the recast Alfrey–Goldfinger equation (recall Equations (1)–(3) and the EVM (Equations (10)–(12)). There are two observations of note here: (1) The estimation is stable, much more so than the case studies presented in
Section 3.1, and (2) the estimation is symmetrical. That is, regardless of which monomer is defined as monomer 1, monomer 2, or monomer 3, the estimated parameters are the same. As an example, two variations are shown below and compared to the original (binary) estimation. Here, reactivity ratios are labelled according to the monomer name (rather than monomer number) for further clarity. Also, the colors shown in
Table 4 are associated with the colors of the JCRs in
Figure 6.
In general, the ‘ternary’ reactivity ratios follow the same trends as the original (binary) reactivity ratio estimates (that is, if rij > rji for the binary case, the same relationship holds for the ternary case). However, rMMA/EHA falls below 1.00 when estimated directly from the terpolymerization data. This suggests that kMMA/MMA > kMMA/EHA in the binary case (homopropagation of MMA is preferable to the crosspropagation of MMA and EHA), but that kMMA/MMA < kMMA/EHA in the ternary case (homopropagation becomes dominated by the crosspropagation of MMA/EHA).
Another notable difference is the significant error present in the BA/EHA system. This is shown in both plots (of
Figure 6), as the JCR for BA/EHA is much larger than the other JCRs. This may be related to the absolute value of the parameter estimates. As shown in a recent study [
31], uncertainty becomes much greater for larger parameter values. Since r
EHA/BA is larger than the other reactivity ratio estimates (by as much as 20 times, in some cases), the same relative error (assumed to be 5% for this system) will have a much larger absolute value in r
EHA/BA compared to the other parameter estimates. This behavior has been described for the copolymer case [
31], but the difference in parameter estimates was observed within a single JCR (that is, the elliptical JCR was stretched in the direction of the larger parameter estimate). In this, a terpolymer case, the JCR associated with the comonomer pair containing larger parameter estimates is greater in both directions. The absolute value of the error seems magnified, likely because most other reactivity ratio estimates for the system are around or below 1.00. Another item of note is that both reactivity ratios for the BA/EHA pair are again >1. This may be for the same reasons discussed earlier for the BA/BMA/lim system. An additional reason may be related to the fact that the copolymerization of BA and EHA may lead to branched molecule formation and even microgel formation, which would complicate analysis further.
Next, we can look at the full conversion dataset, where ‘ternary’ reactivity ratios can be estimated using the EVM and the cumulative terpolymerization model. All terpolymerization data from the original study [
12] were used herein, and the results are shown in
Table 5 (and
Figure 7). Again, the estimation is stable and symmetrical, which can be attributed to carefully designed data. As an aside, the estimation program also converged much more quickly, where parameters were estimated in under an hour (on an Intel(R) Core™ i7-860 processor) compared to (on average) 50 h of computation for the ill-conditioned system described earlier.
The values estimated using all terpolymerization data (full conversion) are similar to the results of the instantaneous parameter estimation (compare
Table 4 to
Table 5). Also, in comparing
Figure 6 to
Figure 7, the JCR areas are reduced when the full conversion dataset is used for analysis (note that the scales are the same for the easy comparison of
Figure 6a to
Figure 7a and of
Figure 6b to
Figure 7b). This is in agreement with previous studies within our group [
18,
22] and makes sense physically. Since more experimental data are available for analysis (18 data points over all conversion levels instead of 7 low conversion data points), the uncertainty associated with the parameter estimates is reduced. Also, since the instantaneous analysis used low conversion data up to 20%, the requisite assumption that no composition drift occurs may not be valid for all of the data [
22]. Interestingly, a direct comparison of
Figure 6 and
Figure 7 shows little or no JCR overlap (between the instantaneous and cumulative analysis), in spite of the fact that the trends remain consistent. Additional replication or sequential design of experiments could be used to further supplement this dataset, as has been described for the previous case studies (recall
Section 3.1).
As for the instantaneous case, the most error associated with the cumulative analysis is present in the BA/EHA comonomer pair, and both reactivity ratios are greater than 1 (which is physically unlikely for any given comonomer pair). Again, this is likely due to the large values of the parameter estimates, which translate to a higher absolute value of the error (since we assume the same relative error for all experimental data and resulting parameter estimates). Also, as mentioned in the evaluation of the instantaneous results, other copolymerization mechanisms (branching, etc.) may be active specifically for the BA/EHA comonomer pair. However, without further analysis, no specific conclusions can be drawn about this system.
Finally, we can look at the prediction performance of these reactivity ratios (compared to the original binary reactivity ratio estimates). Since some of the more substantial differences in reactivity ratios were related to the EHA monomer (especially r
EHA/BA and r
MMA/EHA), we can look at the model prediction for the EHA-rich terpolymer. The model predictions (using both ‘binary’ and ‘ternary’ reactivity ratios) and a comparison to the experimental data from Gabriel and Dubé [
12] are shown in
Figure 8. Only the prediction performance of the cumulative analysis (for ‘ternary’ reactivity ratio estimation) is provided in
Figure 8, where, despite slight differences between the instantaneous and cumulative analysis results, the model prediction performance was very similar for both sets of reactivity ratio estimates.
A direct comparison reveals that while the binary predictions are acceptable, the ‘ternary’ reactivity ratios further improve the prediction performance of the cumulative terpolymer composition model. In fact, a statistical comparison of the EHA-rich data (experimental data versus the two model predictions) shows that using the ‘ternary’ reactivity ratio estimates in the model leads to an 85% reduction in prediction error (total sum of square errors). Similar results were observed for the other terpolymer formulations but are not shown herein for the sake of brevity. These differences in prediction performance may further be accentuated if the estimated reactivity ratios are used in the sequence length part of the model.
This case study has shown that when experiments are well-designed, ‘ternary’ reactivity ratio estimates can be obtained from small datasets. This allows for more resources to be directed towards careful replication and supplemental data collection. The results also suggest that binary and ‘ternary’ reactivity ratio estimates may be similar when the comonomers have similar structures and the polymerization is not affected by the solution properties. However, binary reactivity ratios are not always applicable to terpolymer systems (as has been shown recently [
18,
20]). In this case, the binary reactivity ratios gave reasonable prediction performance, but the ‘ternary’ reactivity ratios showed even better prediction performance based on fewer experimental data (and, hence, less effort overall).
3.2.2. Sty/MMA/MA
A study by Schoonbrood [
34] looked at the terpolymerization kinetics for the styrene (Sty)/MMA/methyl acrylate (MA) (monomer 1/monomer 2/monomer 3 = Sty/MMA/MA) terpolymer. Again, according to standard practice, binary reactivity ratios (obtained from copolymerizations in the literature) were used to predict terpolymerization behavior. During this study, only low conversion data were reported. At the time (1994), this was ‘best practice’, where low conversion (instantaneous) data were typically used for parameter estimation. Parameter estimation from cumulative composition data was not part of typical practice, especially with the more complex system of equations representing terpolymerization kinetics. Low conversion data allow for a computationally simpler parameter estimation process but require some assumptions about a lack of composition drift in the system [
22].
The experimentally determined (assumed as instantaneous) terpolymer compositions were compared to the model prediction. As reported in the original work, good agreement was observed between the predicted and measured values [
34]. Given the available terpolymerization data, we can use the recast Alfrey–Goldfinger model (with the EVM) to re-estimate the terpolymer reactivity ratios directly from the terpolymerization data. The estimation is stable and symmetrical. A comparison of reactivity ratio estimates is presented in
Table 6 and the prediction performance is evaluated in
Table 7.
Although the prediction performance looks similar, the current (EVM) prediction shows a decrease in the sum of square errors for all three comonomer compositions, especially
and
. In evaluating the total sum of square errors, the current work provides a 32% decrease in prediction error over the original analysis. To supplement this result, we can also examine the residuals for both the original and current predictions. As shown in
Figure 9, the spread (that is, the vertical distance from 0) is reduced for the current predictions, where the residuals are smaller overall.
Given these results (and those discussed previously), there is clearly an advantage for estimating ‘ternary’ reactivity ratios directly from terpolymerization data. If medium to high conversion data were available, they could have been used to supplement the dataset or to reduce the number of experiments required. However, even with this low conversion dataset, estimating ‘ternary’ reactivity ratios directly from terpolymerization data is feasible and preferable to using binary data.
3.2.3. AN/Sty/MMA
The terpolymerization of acrylonitrile (AN; monomer 1), Sty (monomer 2), and MMA (monomer 3) studied by Brar and Hekmatyar [
35] provides us with some interesting experimental data. In addition to reporting the terpolymer composition data, they also reported microstructural (triad fraction) information. Thus, there is potential to re-estimate the ‘ternary’ reactivity ratios for AN/Sty/MMA and evaluate their ability to predict composition and sequence length distribution.
The original investigation used six experiments (no replication is mentioned) and the feed compositions selected provide a good amount of experimental information. As shown in the triangular diagram of
Figure 10, there are three ‘outer’ formulations further along the outside of the triangle (designated with circles in
Figure 10). Although (to the best of our knowledge) these were not statistically designed experiments, the fact that there is one formulation rich in each comonomer provides useful data for reactivity ratio estimation [
21]. In fact, when the reactivity ratios are estimated using only these three trials, the parameter estimation results are as expected.
Ideally, additional replication would be performed for all six formulations (perhaps even to higher conversion levels), but these results certainly represent carefully measured experimental (process) data (hence, good information content/lower experimental error), leading to a numerically stable estimation situation, thus ensuring that reactivity ratios can be successfully estimated even from a limited dataset.
Figure 11 shows a comparison of estimation results from these three (more optimal) points to the estimation results from the full (six) trial set. Clearly, the three ‘internal’ data points supplement the composition data, but do not significantly alter the reactivity ratio estimation results. Also, the ‘ternary’ reactivity ratio estimates are in good agreement with the previously reported binary reactivity ratios for the associated copolymers.
For all three comonomer pairs, the binary reactivity ratios are within the JCRs for the ternary estimates. Thus, the prediction performance (for both terpolymer composition and microstructure) will be similar, regardless of which parameters are used. For the purposes of demonstration, analysis of the composition and microstructure of one terpolymer sample (experimentally determined by Brar and Hekmatyar [
35]) is summarized in
Table 8. Note that triad fractions are defined only by the first letter of the monomer name, for example, triad fraction ASM represents the AN-Sty-MMA triad sequence.


