1. Introduction
Conventional sources of energy production are depleting, and their adverse effects on the environment, such as climate change and global warming, are well known. Therefore, the utilization of renewable energy for energy production is increasing in interest worldwide because of sustainable development and environmental concerns [
1,
2]. Renewable energy is a source of energy that can be naturally replenished and whose emissions are significantly lower than conventional energy sources [
3]. Renewable energy sources (RES) are inexhaustible and widely spread on the earth’s surface [
4,
5]. There has been a considerable increase in the utilization of RES in the last decade. It is reported that RES supplied 23.7% of the world’s global electricity in 2015 [
6].
RES include hydro, wind, biomass, geothermal, solar energy, and other sources. However, solar energy is the principal source of renewable energy because of its abundant availability. It is also more environmentally friendly compared to other RES [
3,
7]. A tremendous amount of energy, nearly 4000 trillion kWh per day, is provided by the sun, which is much higher than the current energy supplied by tidal, nuclear, and fossil fuels [
4,
8]. The Direct Normal Insolation (DNI)is variable according to the geographic area, due to its stochastic character [
9,
10]. Two leading technologies for harvesting solar energy are solar photovoltaic (SPV) technology and concentrated solar power (CSP). SPVexploits solar energy to directly convert it into electricity, whereas CSP concentrates the sunlight onto a specific area to heat a working fluid for a process. The SPV is an advanced technology, and the capital and Levelized Cost of Energy (LCOE) is lower, which makes SPV a preferred option. However, energy storage is a critical issue in SPV [
11]. Conversely, the share of CSP is growing for many reasons, which include (i) a relatively inexpensive thermal energy storage (TES) system; (ii) relatively higher efficiency; and (iii) relatively higher capacity factor [
11].
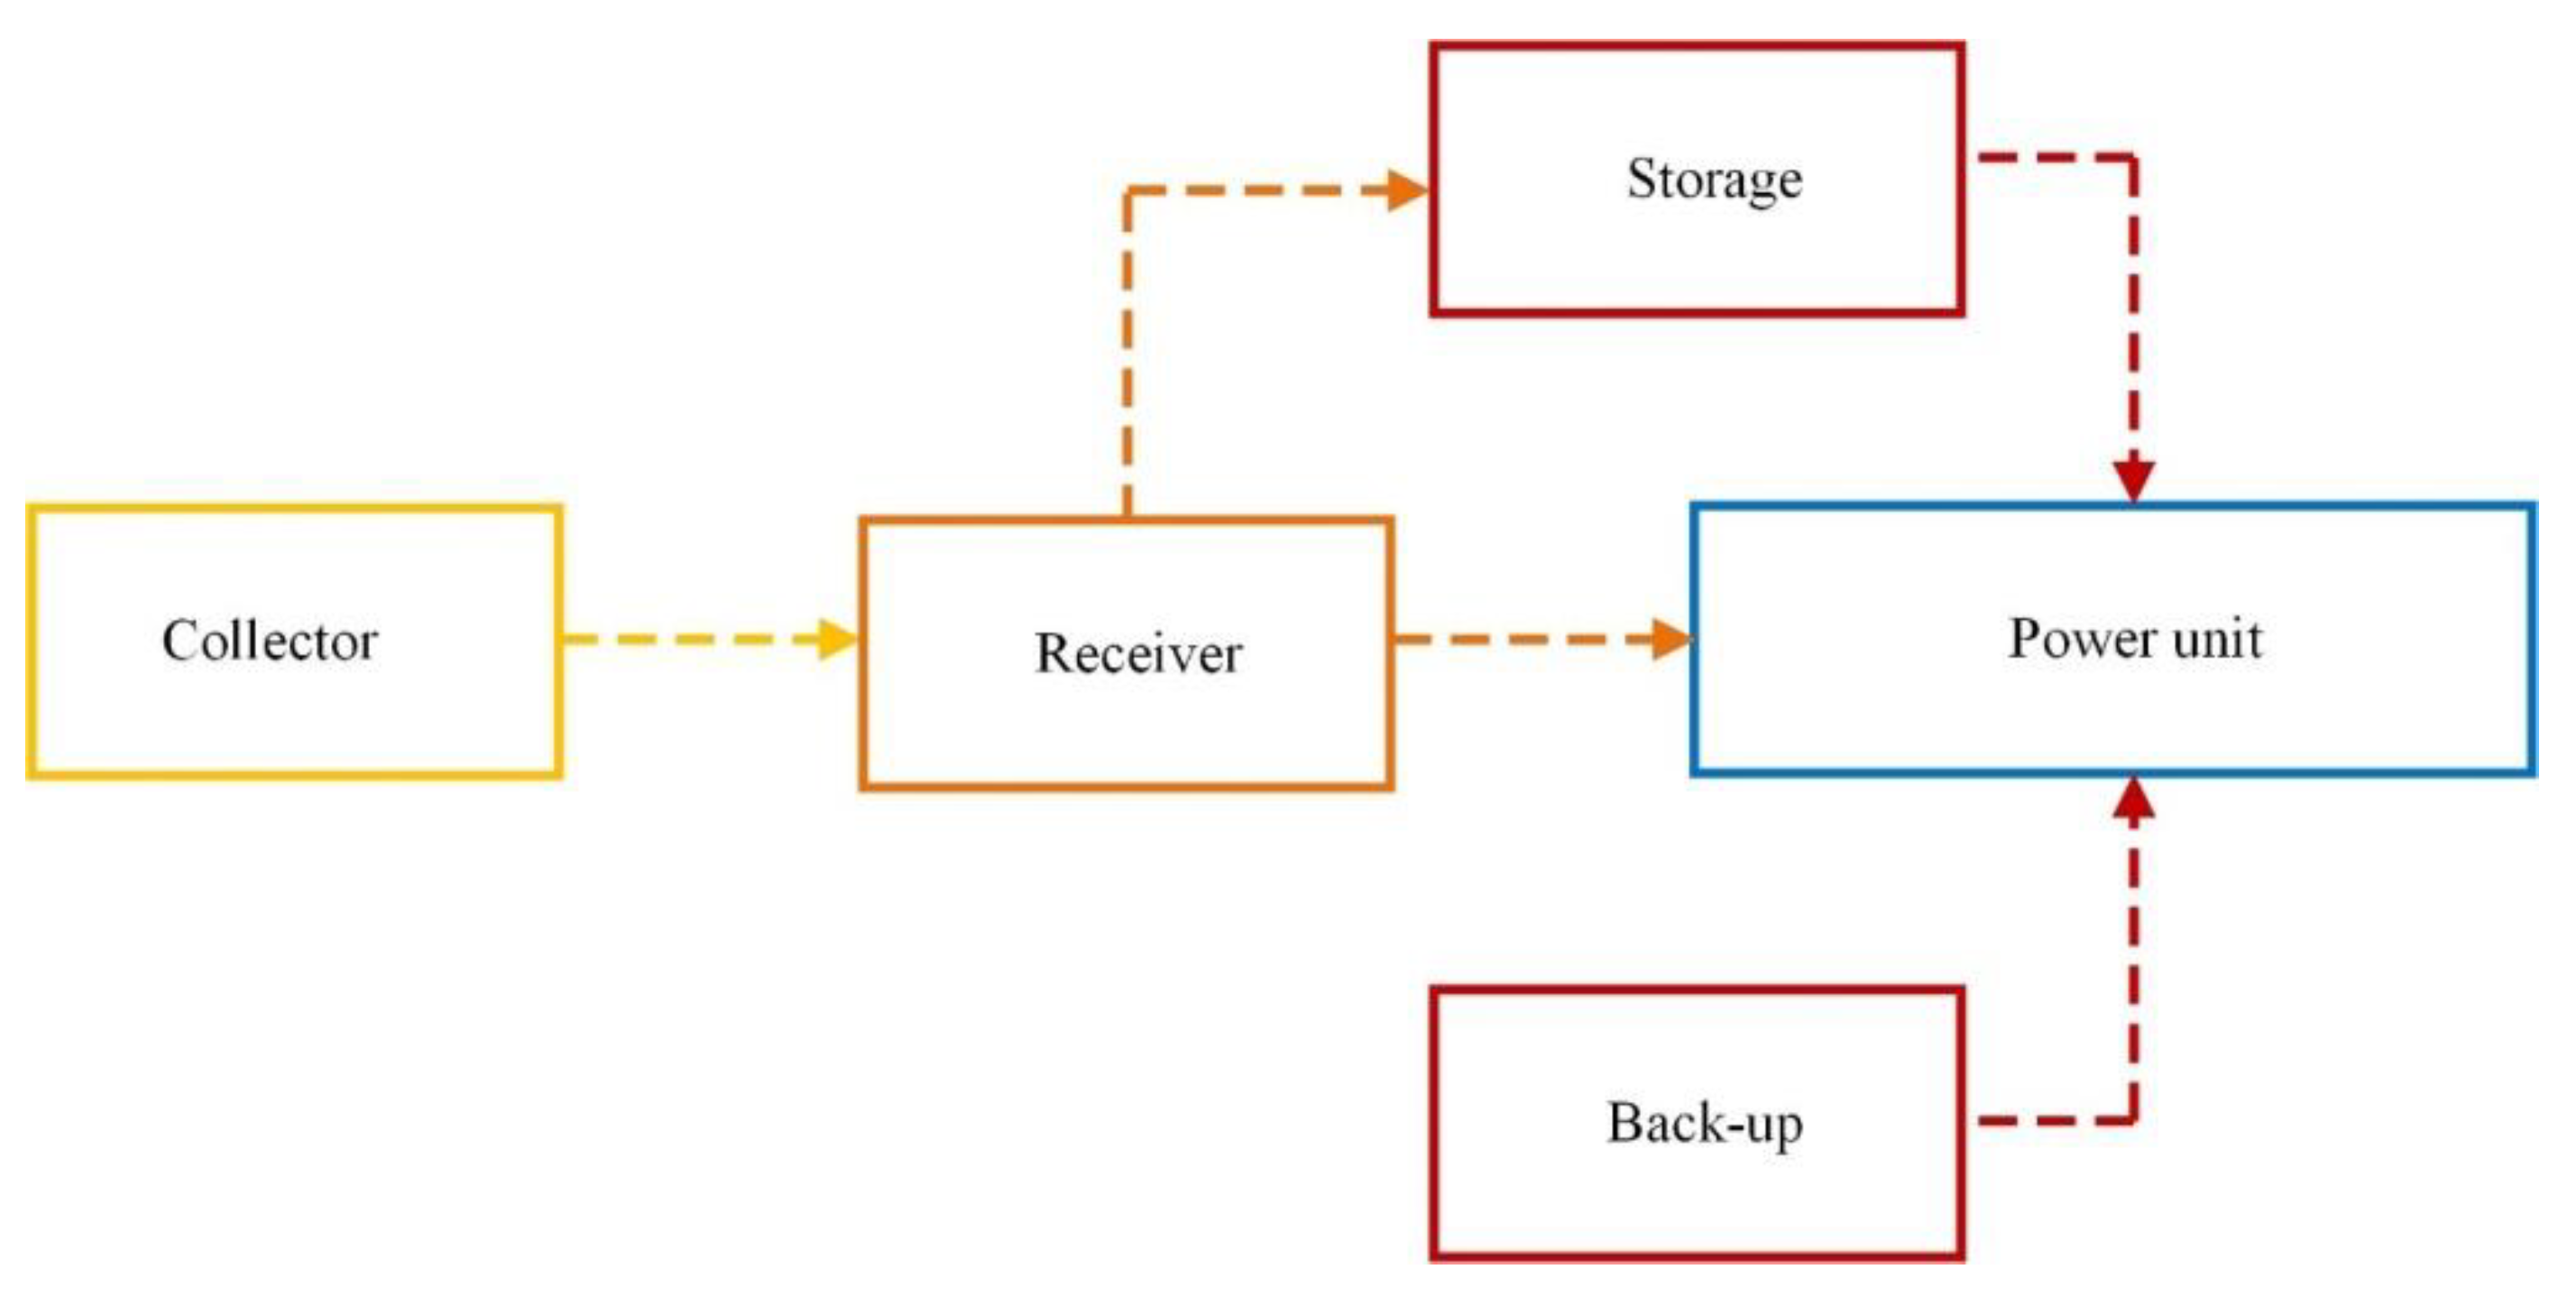
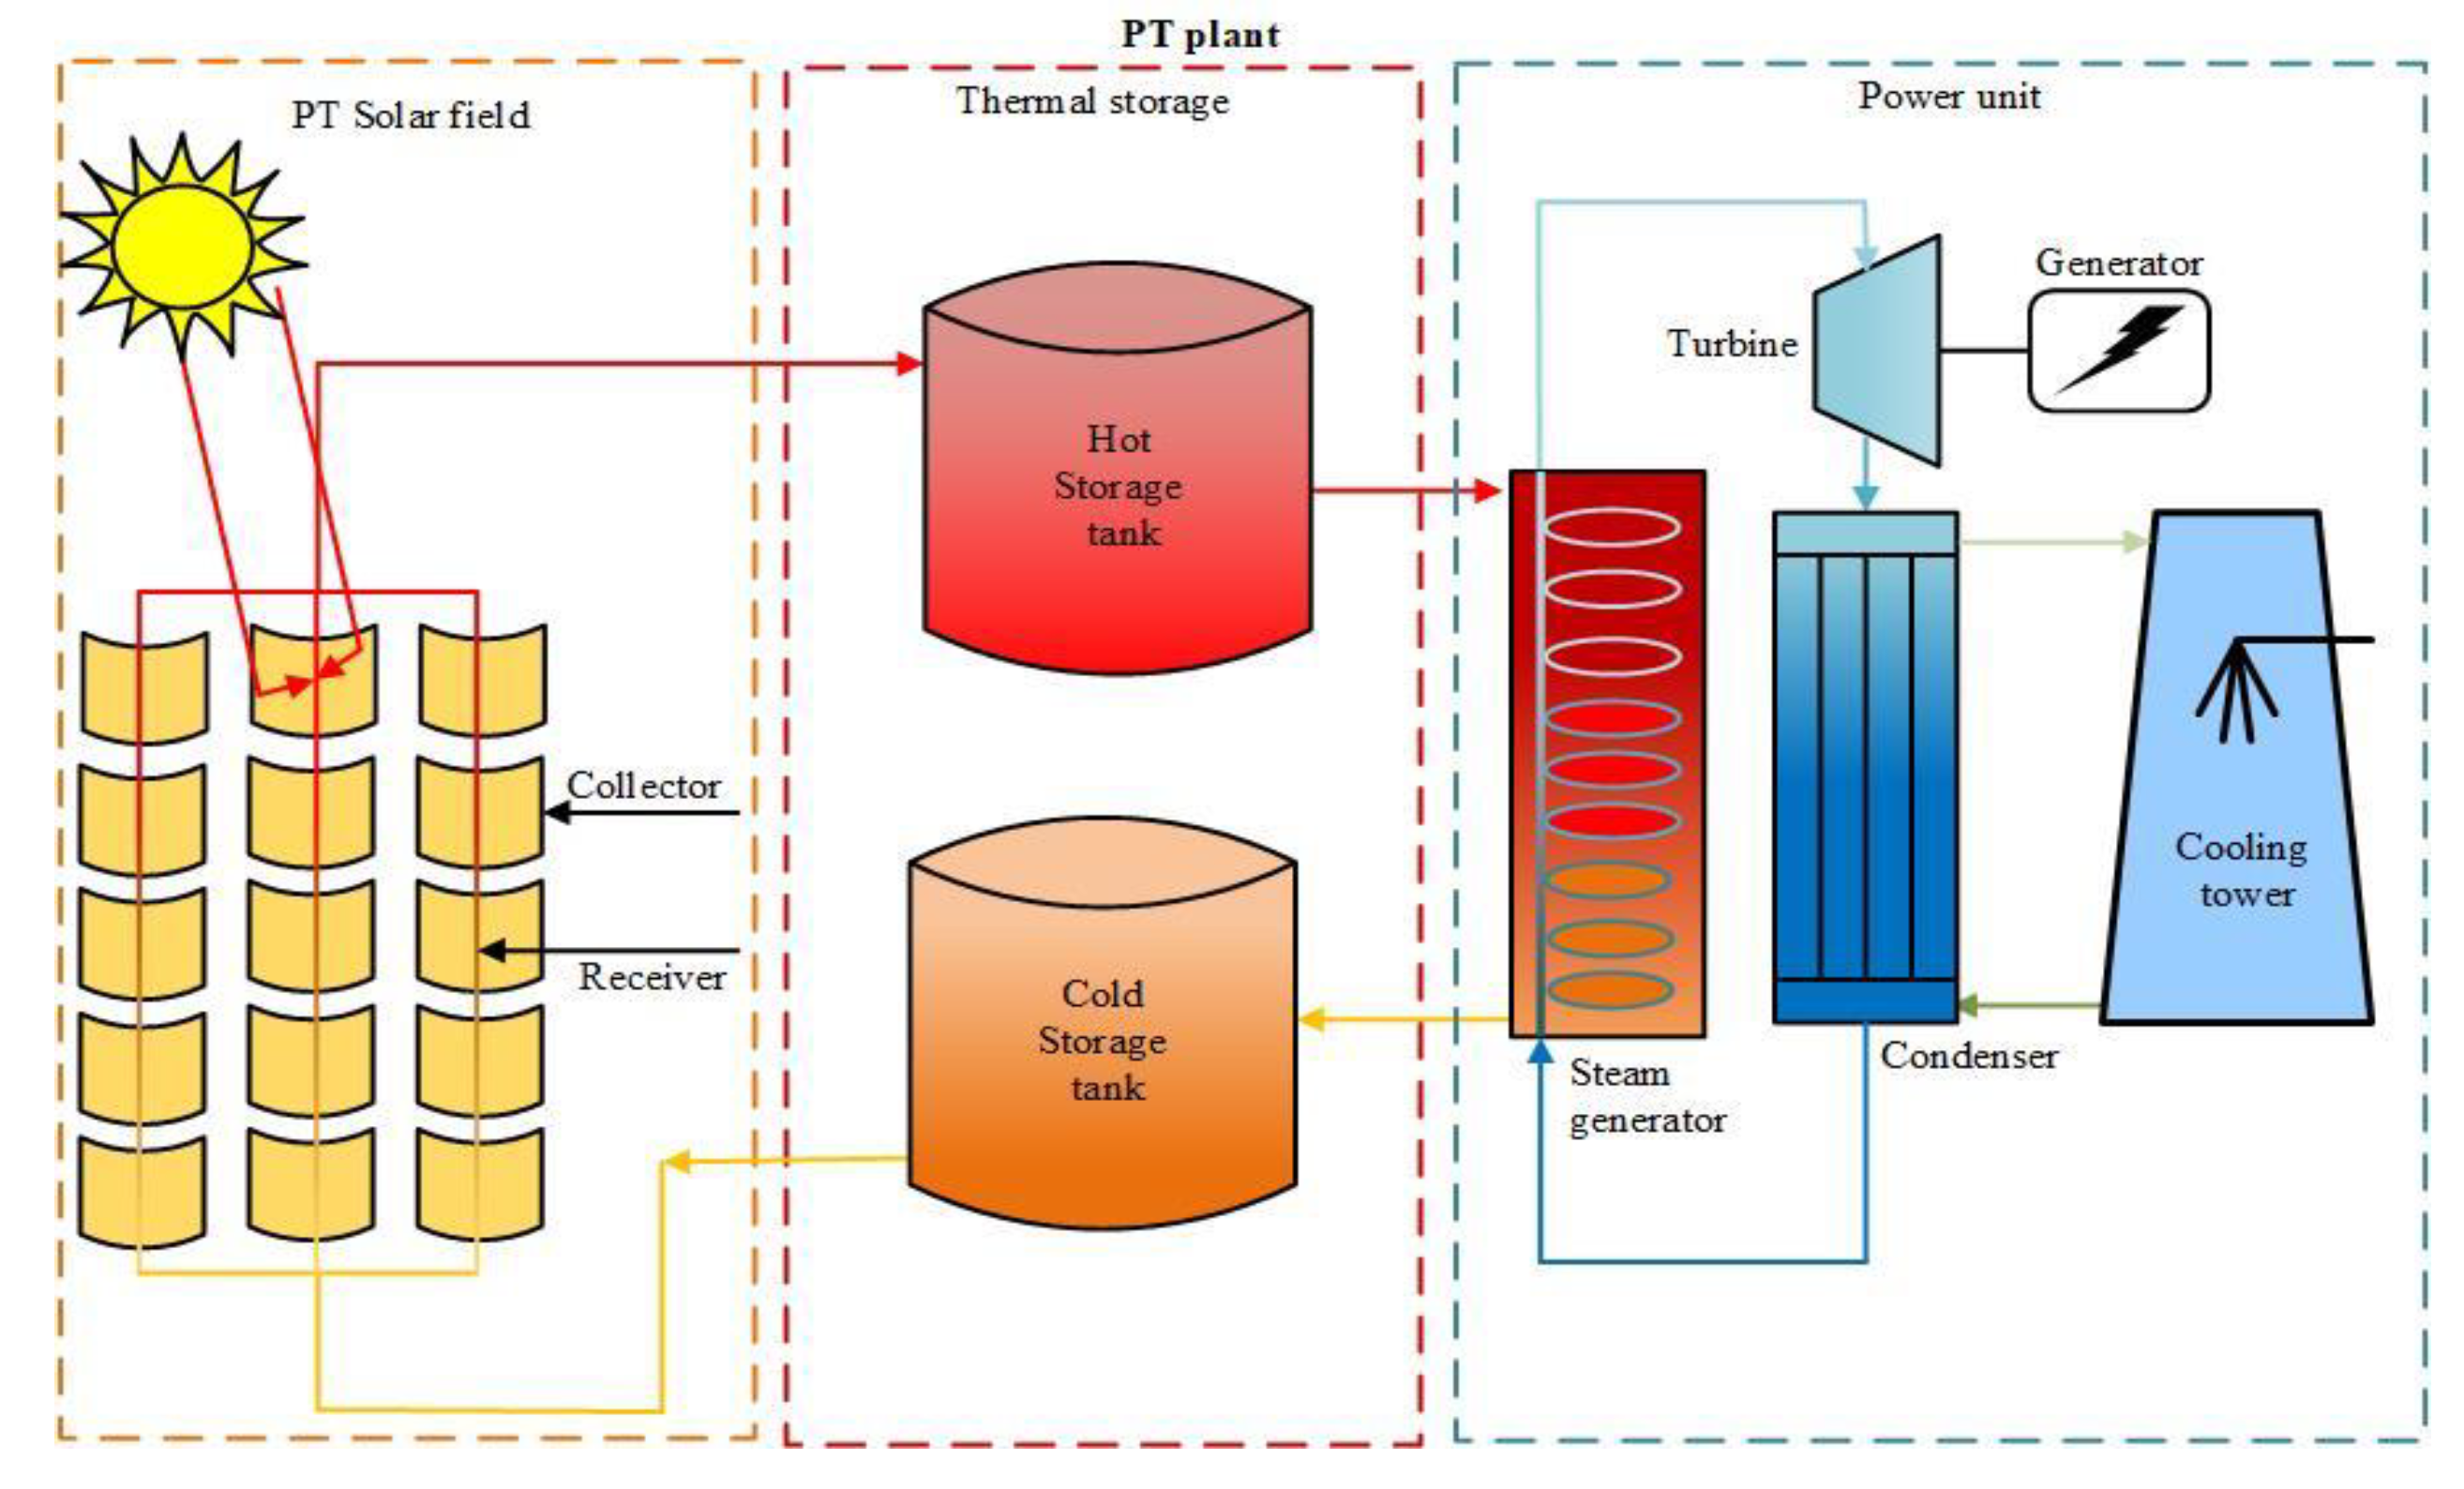
CSP is one of theleading energy production technology. It utilize concentrators/reflectors to concentrate sunlight to heat a working fluid. The heated working fluid can be used in a process industry/to convert water into steam for a Rankine cycle. The most commonly used application of CSP is electricity generation. However, CSP can be also be used for other heat applications [
12]. A schematic diagram for the principle operation of the CSP plant, for electricity production, is presented in
Figure 1. For sustainability, a TES system is used to store additional thermal energy, which can be utilized in the unavailability of sunlight. Four widely recognized CSP technologies include parabolic trough collectors (PTCs), linear Fresnel reflectors (LFRs), solar power towers (SPTs), and parabolic dish collectors (PDCs), as shown in
Figure 2 [
6,
13]. Further, the PTCs and LFRs are categorized as line focused, whereas the SPTs and PDCs are categorized as point focused [
14]. It is important to note that the PTC is the most mature and widely used CSP technology [
14]. For a technology overview, a comparison of different CSP technologies is summarized in
Table 1. The commercialization of CSP has increased progressively due to its advantages, such as higher efficiency, low operational cost, and being carbon-free. Renewable Energy Policy Network (REN21) reported that the total installed capacity of CSP increased up to 4.7 GW in 2015 [
6]. The major stakeholders in installed CSP capacity were Spain and the United States, with 2.3 GW and 1.73 GW, respectively, as shown in
Figure 3 [
6]. The performance and energy cost of a CSP plant are critically affected by several components, such as collectors, receivers, heat transfer fluids (HTF), and the TES system. Therefore, to make CSP more competitive with other technologies, researchers focus on different efficiency improvements and cost reduction methods. These methods include a selection of appropriate technologies/components, technological breakouts/innovations, and the local manufacturing of components to be used in a CSP plant [
15].
Several studies [
18,
19,
20,
21] have reported that the performance of CSP technology can be increased, and, consequently, the cost of energy can be reduced. The measures that contribute towards these goals include technological advancements and the appropriate selection of concentrators, absorbers, heat transfer fluids, and backup systems. Kearney et al. [
18] assessed utilizing molten salt (solar salt and Hitec XL) instead of synthetic oil as an HTF for performance improvement and cost reduction. The results revealed that the performance could be considerably increased and the levelized cost of energy (LCOE) could be reduced simultaneously by using molten salts as HTF. Giostri et al. [
19] presented a performance comparison and annual energy production of parabolic trough (PT) plants based on synthetic oil and solar salt as HTFs. The results revealed that efficiency improved up to 6% when solar salt was used as an HTF instead of synthetic oil. Wagner et al. [
20] presented performance and cost analysis of a 110 MW PT CSP plant with a TES system, a natural gas-fired system, both with and without backup systems. Kassem et al. [
21] presented a techno-economic analysis of a few CSP technologies, including PT, SPT, and LFR for Riyadh, Kingdom of Saudi Arabia (KSA). The authors considered six power plant scenarios with different conditions, which include CSP plants without storage, with storage (3 h–12 h), and dry cooling. The simulations were carried out using the System Advisor Model (SAM) Software (National Renewable Energy Labortary, 901 D. Street, S.W. Suite 930 Washington, D.C. 20024-2157, USA).
In this study, an attempt has been made to investigate the effects of different solar multiples, collectors, receivers, HTFs, cooling systems, TES systems, and fossil fuel backup systems for the performance improvement and cost reduction of a CSP system. Finally, performance and LCOE based on the best suitable case/condition were evaluated. A 50 MWe PT plant based on the Rankine cycle has been considered for the evaluation. The weather conditions of Abu Dhabi, United Arab Emirates (UAE) were incorporated for the analysis. The simulations for all cases were carried out using the SAM software. The performance results were reported in terms of annual energy production, gross-to-net conversion factor, and capacity factor, whereas economic evaluation has been reported in LCOE. The environmental and economic benefits of CSP plants in terms of the Clean Development Mechanism (CDM) under the Kyoto Protocol (KP) have also been analyzed to elaborate the environmental and financial feasibility of CSP plants.
The remainder of this paper is comprised of the methodology presented in
Section 2, the results and discussion in
Section 3. The conclusions drawn from this study are summarized in
Section 4.
3. Results
The performance and cost assessment of a PT plant using different cases will be discussed in this section.
3.1. Case 1. A 50 MWe PT Plant with Different Values of the Solar Multiple
In the first case, the performance and cost assessment of the 50 MWe PT plant were carried out with different values of the solar multiple. The solar multiple represents the solar field aperture area as a multiple of the power cycle capacity. In designing of a CSP plant, determination of optimum solar field aperture area for a specified location is essential. Generally, an increase in the solar field areas increases the plant’s electricity production and simultaneously reduces the LCOE. However, too large a solar field area will generate more thermal energy than the capacity of the TES system and power unit.
Moreover, an increase in the solar field areas increases the installation, operating, and maintenance cost. In general, a solar multiple of one (SM = 1) generates the thermal energy required to drive the power unit at its rated capacity without storage. However, a solar multiple greater than one (SM > 1) produces enough thermal energy to drive the power unit for more hours. Therefore, in the present study, to investigate the effect of the solar multiple on the performance and LCOE, the solar multiple varied from 1 to 5. The technical components/parameters that were used for the simulations are presented in
Table 3. For this case, Euro Tough ET150 was selected as a collector because of its low cost, easy installation, and high optical efficiency [
29]. Euro Tough ET150 is used in many CSP plants worldwide [
21].
On the other hand, SchottPTR70 was selected as the receiver because it is the most commonly used in CSP plants [
30], whereas Therminol VP-1 was selected as HTF for the simulations because it is also widely used in PT plants [
30]. The results of the simulations for the present case are summarized in
Table 4. It can be observed that with an increase in solar multiple from 1 to 4, the annual energy production, gross to net conversion factor, and capacity factor increased. However, LCOE reduced with an increase in the solar multiple from 1 to 4, although the capital cost of the PT plant increased with an increase in the solar multiple, but higher energy production leads to a reduction of the LCOE.
Moreover, it can be observed that a further increase in the solar multiple, from 4 to 5, reduced the gross-to-net conversion factor and the capacity factor and considerably increased the LCOE. This result is attributed to the fact that a much higher solar multiple increased the thermal energy beyond the limits of both the TES system and the power block. Subsequently, a higher capital cost leads to an increased LCOE. Therefore, the optimum value (SM = 4) is obtained for the present case, and this value will be considered in further simulations.
3.2. Case 2. A 50 MWe PT Plant with Different Collectors/SCA
In the second case, the performance and cost assessment of the 50 MWe PT plant were carried out using different collectors/SCAs. The list of different commercially available collectors with specifications, which were used for the simulations, are presented in
Appendix A. For this case, the technical components/parameters for the simulations are presented in
Table 3, whereas the results of simulations are summarized in
Table 5. It can be seen that considerable variations are found in the results. However, it can also be observed that the performance of the Luz LS-3 is higher in terms of its annual energy production (277.974 GWh) and capacity factor (70.5%). This result is attributed to the higher efficiency of the collector.
Moreover, the cost assessment revealed that the lowest LCOE is also obtained for Luz LS-3. The reason behind the lowest LCOE is higher energy production, which tends to reduce the LCOE. The simulations showed higher performance and the lowest LCOE for the Luz LS-3. Therefore, Luz LS-3 will be considered in further simulations in the present study.
3.3. Case 3. A 50 MWe PT Plant with Different Receivers/HCE
In the third case, the performance and cost assessment of a 50 MWe PT plant were carried out using different receivers/HCEs. The list of different commercially available receivers with specifications, which were used for the simulations, are presented in
Appendix B. For this case, the technical components/parameters for the simulations are presented in
Table 3. Luz LS-3 was selected as the SCA because of its higher performance and low LCOE (as discussed in case 2). The simulation results are summarized in
Table 6. For the present case, it can be observed that the differences in the results are minimal. Therefore, a strong preference is not justifiable. It is worth noting that the results obtained from case 3 are in good agreement with the simulation results available in the literature [
29]. However, generally, SchottPTR70 2008 is preferable because it is widely employed in CSP plants [
30]. Therefore, SchottPTR70 2008 will be considered in further simulations in the present study.
3.4. Case 4. A 50 MWe PT Plant with Different HTF
In the fourth case, the performance and cost assessment of the 50 MWe PT plant were carried out using different HTF. The list of different commercially available HTFs with specifications, which were used for the simulations, are presented in
Appendix C. The technical components/parameters for the simulations for the current case are listed in
Table 3. The Luz LS-3 was selected as the SCA because of its higher performance and low LCOE (Case 2), whereas the Schott PTR70 2008 was selected based on the Case 3 results. The results of the simulations are summarized in
Table 7. In the present case, it can be observed that the performance of Therminol VP-1 is the highest in terms of annual energy production (288.502 GWh), the gross-to-net conversion factor (94.8%), and capacity factor (73.2%). This result is attributed to its higher storage exergetic efficiency.
Moreover, cost assessment revealed that the lowest LCOE
(n) (3.48 ¢/kWh) and LCOE
(r) (2.73 ¢/kWh) was also obtained for Therminol VP-1. The reason behind this low LCOE is higher energy production, which tends to reduce the LCOE. This could be the reason that the Therminol VP-1 has been widely deployed in PT plants worldwide [
30]. Since the simulations revealed higher performance and the lowest LCOE with Therminol VP-1, it will be considered as the HTF in further simulations in the present study.
3.5. Case 5. A 50 MWe PT Plant with Different TES System (4 h–12 h)
In the fifth case, the performance and cost assessment of the 50 MWe PT plant were carried out using different TES systems, which varied from 4 h–12h. General observations show that the increase in the TES system increases the annual energy production and capacity factor up to a specific limit. For this case, the technical components/parameters for the simulations are presented in
Table 3. The results of the simulations are summarized in
Table 8.
It can be observed in
Table 8 that an increase in TES from 4 h to 12 h increased energy production and capacity factor. For cost assessment, it can be observed that LCOE reduced with an increase in the TES system. This result is attributed to the fact that a higher TES increased thermal energy and, consequently, energy production, which leads to a decrease in the LCOE. It is important to note that the results obtained in the present case are in agreement with the observations available in the literature [
21]. Hence, the TES system 12 h will be considered in the present study for further simulations.
3.6. Case 6. A 50 MWe PT Plant with Different Types of Cooling Systems
In the sixth case, the performance and cost assessment of a 50 MWe PT plant were carried out using different types of cooling systems, including evaporative cooling and air cooling. The evaporative cooling (also known as wet cooling) is cheaper than the air cooling, and its efficiency is also higher. The water consumption in evaporative cooling is high (approximately 2100 L/MWh–3000 L/MWh), which requires a water source [
21]. Unfortunately, there is a water resource scarcity in arid regions like the Middle East and North Africa (MENA) region, which discourages the use of evaporative cooling. However, the trend of using seawater as a cooling medium in evaporative cooling is increasing in the MENA region. This seawater can be used in a closed cycle and an open cycle. In an open cycle, the seawater leaving the condenser could be used for other processes, such as heating and desalination, whereas in a closed cycle, water is cooled down and recirculated. Conversely, air cooling (also known as dry cooling) is expensive and less efficient.
For this case, the technical components/parameters used for the simulations are presented in
Table 3. The simulation results showed that the cooling water requirements of the proposed plant with evaporative and air cooling are 957,815 m
3/year and 62,629 m
3/year, respectively. Other simulation results are shown in
Figure 8. It can be observed that evaporative cooling produced a higher amount of energy, a higher gross-to-net conversion, and a capacity factor with a lower LCOE. It is concluded that evaporative cooling is preferred for higher performance and lower LCOE.
3.7. Case 7. A 50 MWe PT Plant with Different Fossil Dispatch Mode
In the fossil dispatch mode, the PT plant is operated with a minimum backup level defined by the user. In this mode, the fossil fill fraction defines the fossil backup as a function of the thermal energy of the solar system (and storage, where applicable) at the given time and the total output of the designed turbine. When the fossil fill fraction is greater than zero during the dispatch period in a minimum fossil backup level mode, the PT plant system is considered to contain a fossil burner, which heats the HTF before it is supplied to the power unit. For instance, if the fossil fill fraction is 1.0 for an hour, it means that if the solar energy delivered to the power cycle during that hour is less than the energy required to run the power unit at its gross output, the fossil fuel backup heater will supply the required energy to fulfill the demand. Similarly, if the fossil fill fraction is 0.25 for an hour, then the fossil fuel backup heaters would only supply the energy to the system when gross output drops below 25%.
For this case, the technical components/parameters for the simulations are presented in
Table 3. Natural gas has been used as a backup fossil fuel because it is frequently used due to its low cost, low CO
2 emissions, and rapid response [
31]. The results of the simulations are summarized in
Table 9. In this case, it can be observed that with an increase in fossil fraction from 0.25 to 1.0, the performance of the PT plant increases in terms of annual energy, gross-to-net conversion, and capacity factor, while LCOE decreases. The highest annual energy (415.404 GWh), gross-to-net conversion (95.7%), and capacity factor (105.4%) are obtained with a fossil fill fraction of 1.0. Moreover, the lowest
LCOE(n) (2.41 ¢/kWh) and
LCOE(r) (1.9 ¢/kWh) are also obtained with fossil fill fraction 1.0. Therefore, it is concluded that a higher fossil fill fraction is preferred for higher performance and lower LCOE.
3.8. Case 8. A 50 MWe PT Plant with Suitable Parameter/Component
For the present case, the PT plant is operated with a suitable parameter/component obtained from the results of Cases 1–7, for performance improvement and cost reduction. Firstly, the effect of DNI on energy production has been investigated. The technical components/parameters for the simulations are presented in
Table 3. The performance of a CSP plant is primarily dependent on the DNI. An increase or decrease in hourly DNI for the proposed location (as shown in
Figure 6) leads to variation in the hourly power incident in the solar field and field thermal power produced, as demonstrated in
Figure 9. It can be observed that with an increase or decrease in DNI (
Figure 6), the power incident in the solar field and field thermal power produced increased or decreased. For instance, the lowest DNI was observed in December (
Figure 6), which lead to the lowest power incident on the solar field (257.313 MWt) and the lowest field thermal power produced (107.74 MWt), while the highest DNI was observed in September (
Figure 6), which lead to the highest power incident in the solar field (332.842 MWt) and the highest field thermal power produced (215.902 MWt). Further, the lowest monthly power incident in the solar field (1991.818 MWt) and the lowest monthly field thermal power (747.491 MWt) were observed in December, as depicted in
Figure 10, whereas the highest monthly power incident on the solar field (2861.665 MWt) and highest monthly field thermal power (1887.211 MWt) were observed in June, as shown in
Figure 10.
Moreover, the monthly electricity production of the proposed PT plant is presented in
Figure 11. As seen, the minimum and maximum monthly electricity production are obtained in February and December, respectively. Although the highest monthly power incident is observed in September, high electricity production is observed in July. Similarly, the lowest monthly power incident is observed in December, but the lowest electricity production is observed in February. The reason behind the phenomenon is the ambient temperature and the “cosine” effect.
Other results obtained from the simulations are summarized in
Table 10. In this case, it can be observed that the performance of the PT plant considerably increased in terms of annual energy, gross-to-net conversion, and capacity factor, whereas the LCOE dropped significantly. For instance, comparing case 8 with case1 (SM = 4), the energy production increased up to 52.69%, the gross-to-net conversion increased up to 2.93%, and the capacity factor increased up to 52.753%. On the other hand,
LCOE(n) dropped up to 35%. It can be observed that the proper selection of parameters/components considerably improved the performance of the proposed PT plant and simultaneously reduced the energy cost. Therefore, the present study provides opportunities for decision-makers to choose the parameters and components for a CSP plant to enhance performance and reduce LCOE. It is worth noting that although the LCOE is low for the proposed study, it can be further reduced by considering the environmental and economic benefits of a CSP plant.
The CDM provides an opportunity for developed countries to invest in emission reduction projects for developing countries. This mechanism allows developed countries to acquire Certified Emissions Reductions (CER), which could help them achieve their emission reduction targets, set by the KP, and provide economic benefits to the owner [
32]. Since solar energy is environmentally friendly and its emissions of greenhouse gases (GHG) are negligible, solar energy projects, especially CSP plants, have received great attention for their use as aCDM [
32]. Therefore, in this study, assessment of LCOE with CDMswas carried out. The baseline of the CSP project is kilowatt hours (kWh), produced by the CSP plant and multiplied by the emission coefficient (measured in kg CO
2e/kWh). It is assumed that the CSP plant has replaced a coal-fired power plant whose emissions are expected to be 980 g/kWh [
20]. At present, the CER price is
$1/ton [
33]. Based on the CDM, LCOE without and with CDM is presented in
Figure 12. As expected, the internationalization of CO
2 emission reductions further reduces the nominal and real LCOE by the PT Plant. Moreover, the CSP plant without a fossil fill fraction reduced CO
2 emissions by up to 78,811,110 kg/year compared to the power plant operating with coal.
The low LCOE revealed that CSP plants are economically viable. Therefore, it is concluded that the utilization of solar energy for CSP plants with a proper selection of technology can help reduce energy crises, eradicate environmental pollution, improve system performance, and reduce energy costs.
4. Conclusions
This paper presents the performance improvement and energy cost reduction of a 50MWePT plant for Abu Dhabi, UAE in the Middle-East region using the SAM software. The performance of a PT plant is greatly affected by the proper selection of technologies and components. A variety of technologies are commercially available and could be used in PT plants. In the present study, different technologies were incorporated for performance improvement and energy cost reduction. A total of eight cases were considered for the simulation of the proposed PT plant, including solar multiples, collectors, receivers, HTFs, cooling systems, TES systems, and fossil dispatch modes. Finally, simulations were carried out considering the best technologies/parameters. The key findings of the study are summarized as follows:
An increase in solar multiple increased energy production, the gross to net conversion factor, and the capacity factor but reduced the LCOE. The obtained optimum value for the solar multiple was 4. Further, an increase in the solar multiple slightly reduced the gross-to-net conversion factor, and the capacity factor while the LCOE increased.
For the collector/SCA, Luz LS-3 showed higher performance in terms of annual energy production and capacity factor, with the lowest LCOE. With different types of collectors/HCEs, differences in the results were minimal. Therefore, the SchottPTR70 2008 was selected because it is widely employed in PT plants worldwide.
In the case of simulations with different HTFs, the Therminol VP-1 achieved a higher annual energy production, gross-to-net conversion factor, and capacity factor. Conversely, the lowest LCOE also corresponded to Therminol VP-1. The TESsystem varied from 4 h to 12 h to investigate the effects on the PT plant. An increase in TES increased the energy production and capacity factor and simultaneously reduced the LCOE. However, optimum TES was achieved at 12 h (TES = 12 h).
For analysis with different cooling systems (which include evaporative cooling and air-cooling), the results show that that the performance of a PT plant with evaporative cooling was higher compared to a PT plant with air cooling. Since water scarcity is a significant issue in the MENA region, it was suggested to incorporate seawater as a cooling medium in the condenser instead of freshwater.
The performance of PT plants improved with the addition of a fossil fill dispatch from 0.25 to 1.0. Moreover, fossil fill fraction of 1.0 achieved the highest performance and lowest LCOE.
For the eighth case, which was found to be the best-case scenario in the study, simulations were carried out considering the most suitable results from the preceding seven cases.The effect of DNI on thermal power and electrical energy production were investigated. The proposed system produced 415.404 GWh with LCOE(n) 2.41 ¢/kWh. For the proposed case, the performance of the PT plant considerably increased in terms of annual energy, gross-to-net conversion, and capacity factor, whereas the LCOE dropped significantly. For instance, comparing case 8 with case 1 (SM = 4), the energy production increased up to 52.69%, the gross-to-net conversion increased up to 2.93%, and the capacity factor increased up to 52.753%. On the other hand, LCOE(n) dropped up to 35%. Moreover, when the economic benefit of a PT plant was considered, as per directions of the CDM of the KP, the nominal LCOE further reduced to 2.35 ¢/kWh.
Finally, it is concluded that utilizing solar energy for CSP plants, with a proper selection of technology, can help reduce energy crises, eradicate environmental pollution, improve system performance, and reduce energy costs. As such, this study provides some insight into CSP technologies that will help decision-makers to choose parameters and components for CSP plants to enhance performance and reduce the LCOE. The performance improvement and energy cost analysis of other CSP technologies, such as SPT and LFR, will be presented in our future works.

 ,
, 