1. Introduction
The scenario of power loss from the grid, whether for short or long periods, places a unique operational constraint on the electric network of a campus [
1]. Typically, this mode of operation is governed by a hybrid PV–diesel generator system, that allows ample room for optimization of its main resource metric, namely fossil fuel [
2]. Campus curtailment and demand side management programs could benefit from this scheme, especially when energy managers engage in campus disconnect from utility. The choice of hybrid Photo Voltaic (PV)–diesel generator system for optimization in this paper is based on local utilization trends and that diesel generators are considered an underutilized asset. The optimization framework of modern hybrid systems is fed by several elements that culminate in the field of digital resource management, such as energy Internet (EI) [
3], energy Internet of Things (EIoT), energy forecasting techniques (EFT) [
4], intelligent electrical control systems [
5], the ability to digitally manage the consumer’s energy purchasing strategy [
5] and coherent energy data formats generated by both loads and generators. However, few high-resolution digital energy management strategies exist that make use of energy forecasting (with forecasting uncertainties) to optimize fuel usage, while simultaneously increasing PV penetration of the electrified campus grid on a small time-step basis.
Hybrid generation systems on campuses mimic the setup of micro-grids, in islanded operational mode (loss of utility power), where loads and generators interact in an intelligent mode to generate savings and possibly other avenues of revenue for campuses [
6], without feeding back into the powerless grid (for situations where feedback is not allowed). As part of such a campus micro grid of the future, it is assumed that the hypothetical campus presented in this paper, is interwoven with IoT sensors (multi-faceted) and equally capable communication networks [
7]. The EIoT infrastructure on campus injects unique data streams into the energy management (EM) local/cloud server that could be leveraged for the purposes of enhancement of decision-making structures regarding energy usage, dispatch and forecasting on campus. For example, the EIoT network could feed departmental energy managers with information about campus dynamics that would, in turn, influence their scheduling of lecture halls (or partial use) and the utilization of research lab equipment. The same argument holds for Heating, Ventilation and Air-conditioning (HVAC) scheduling of lecture halls based on the local weather. The campus EIoT network therefore would be able to supply rich layers of information that could feed decision support systems used by departmental energy managers (DEMs) and lead campus energy managers (LCEMs). An EIoT network on campus also feeds the concept of the energy Internet, whereby all consumers and generators are connected by some efficient communication network (such as Zigbee) and allows for full control, high resolution data acquisition, energy data analysis, energy management and departmental energy policy monitoring (all while communicating in an energy efficient manner) [
7].
Real-time and optimized energy management of smart campuses relies on the full control of the campus energy system, real-time energy data acquisition and demand/generation horizon forecasting. This type of energy generation/demand forecasting is driven by several state-of-the-art machine learning techniques that leverage the EI [
8]. The forecasting techniques rely on historical data with different training set lengths (depending on the forecasting method) in order to forecast energy usage/generation with uncertainty based on a plethora of different training metrics and unique data streams. A typical example of such a forecasting strategy is that of solar irradiance based on the underlying metrics of humidity, temperature and cloud cover as can be found in Reference [
9]. Complex connections exist between different metrics that can only be recovered using machine learning techniques that learn from experience, given a typical large energy dataset. As a state-of-the-art example, consider the scenario where LCEMs strategize a particular renewable dispatch strategy based on historic data and half-hourly newly acquired data. The LCEMs train models on historic data and uses the newly acquired data to firm up on the energy dispatch system. It remains inefficient to retrain the entire model on the historic data and newly added data, thus the LCEMs use online forecasting methods (such as online Gaussian Process (GP) forecasting methods that are based on multi in–multi out systems) to retrain only on the new acquired data. In this manner, LCEMs can firm up their energy dispatch system, whilst remaining computationally efficient with quick response strategies [
10].
The nervous system of a smart campus will typically by governed by an electrical control system (Building Automated/Management System), to ensure that a high resolution of control is achieved when imposing energy management strategies and critical control. This nervous system interconnects the largest consumers such as HVAC, hot water supply (part of HVAC) and research labs [
11]. High-resolution low-level departmental control becomes more expensive due to either non-existing control circuits or mandatory control retrofits, thus in many cases a control retrofit is needed [
12]. However, building automated systems (BASs) will be able to perform macro control of the largest energy consumers.
A critical concept in digital resource management of smart campuses is that of coherent energy data structures and exchange formats. As an example, the campus building control systems typically generate data that aids decision support systems in shifting or eliminating certain electrical loads during critical periods. Separate from the building control systems, the PV generation data is shared on a separate platform and so is the distributed diesel generators (both control and electrical output). However, when dealing with such large energy ecosystems such as campuses, the energy management strategies become largely data driven and depend on coherent multi-faceted data streams culminated on a single platform. The energy data analysis backend is hosted on the same platform, allowing for easy debugging and amendment [
13].
Smart trading of resources feature in several markets and will be equally beneficial as part of the smart campus scenario (one smart campus selling to a neighboring smart campus). A smart campus with the necessary digital infrastructure (EIoT, EI, EM etc.) will easily overcome the requirements to manage its own resources and interact with other receiving clients [
5]. In order to trade resources in real-time, a campus needs to be able to control and forecast resource usage and generation with certainty. Added to this requirement, the LCEMs need to utilize the EIoT data influx in a real-time manner that adapts to market responses and predictions [
14].
This paper proposes an umbrella scheme/concept that utilizes smart campus elements in order to optimize fossil fuel usage associated with PV–diesel generator hybrid systems, from the perspective of energy forecasting techniques, energy campus IoT and the necessary control systems. Special focus was given towards the critical role-players and data flow within the proposed scheme. The emphasis of this paper is therefore on the formulation and discussion of the umbrella optimization scheme (not to determine the equation of energy utilization) and attempt to include all the possible elements that are considered role-players within the final optimization. Future work will include the process of finding the function of energy utilization based on real campus data that will be conditioned to feed the hypothetical scheme. The mathematical framework (or data driven methodology) will follow future testing of the scheme on real campus data.
2. Holistic Optimization Framework
The opportunity generated by emergency utility curtailment for a scheduled period realizes in the interplay of the two main non-utility contributing sources of energy on campus, namely that of PV generation and fossil fuel generators, or PV–diesel hybrid systems. Battery storage is omitted from this proposed framework, due to non-favorable economic feasibility when considering large PV plants. Assuming that the diesel generators are of high enough quality to allow synchronicity with that of the renewable generator, and that the fossil fuel generators are distributed in such a manner to allow connection to any load collection on campus; typically, a characteristic of future smart campuses from the perspective of resources. Campus electrical networks can be classified as centralized PV with decentralized diesel generators islands or centralized PV with centralized diesel generators, however, the technical influence of the configuration on the proposed optimization framework is not part of the scope of the paper. The following scenario is proposed for the optimization of fuel usage, the reader is referred to
Figure 1,
Figure 2 and
Figure 3 for a visual summary of each step of the global optimization scheme.
The entire network (generation and load) is optimized in discrete time-steps (that could become real-time in future) based on an influx of data from the PV plant, diesel generators, load banks and the campus EIoT in which the elements are embedded. The main aims of the optimization scheme will be to determine the fixed critical load bank and fixed serving diesel generator bank, after which the remaining variable banks (both load and generator) could be optimized based on a list of critical metrics harvested from the PV plant and campus IoT network. The main energy savings metric in this proposed scenario is driven by the savings of fuel (diesel) and possibly the energy saved by comparing to “normal operations” if the utility curtailment event did not occur. The optimization scheme of the load/generation banks is driven from the viewpoint of the diesel generators with the added benefit of critical heat/electric generation from hydrogen plants on campus.
The optimization of the load banks is done on an energy manager server that utilizes building automated systems (BAS), building control systems (BCS), EIoT data influx (departmental and campus wide), renewable power generation and departmental energy policies, all of which are embedded on a local or cloud framework that holds enough resources and memory capacity to perform the optimization process (typically a server located on campus or cloud driven services). The local EM server (if this is the case) will also be restricted to a campus EM policy to perform computations during the appropriate tariff times (as not to be power intrusive itself). It is assumed that the PV plant is connected to the direct current (DC) bus and both the loads and diesel generators are connected to the alternating current (AC) bus. Converters reside between the AC and DC bus. Furthermore, it is assumed that generator-load pairs are not islanded and that every component in the network is linked.
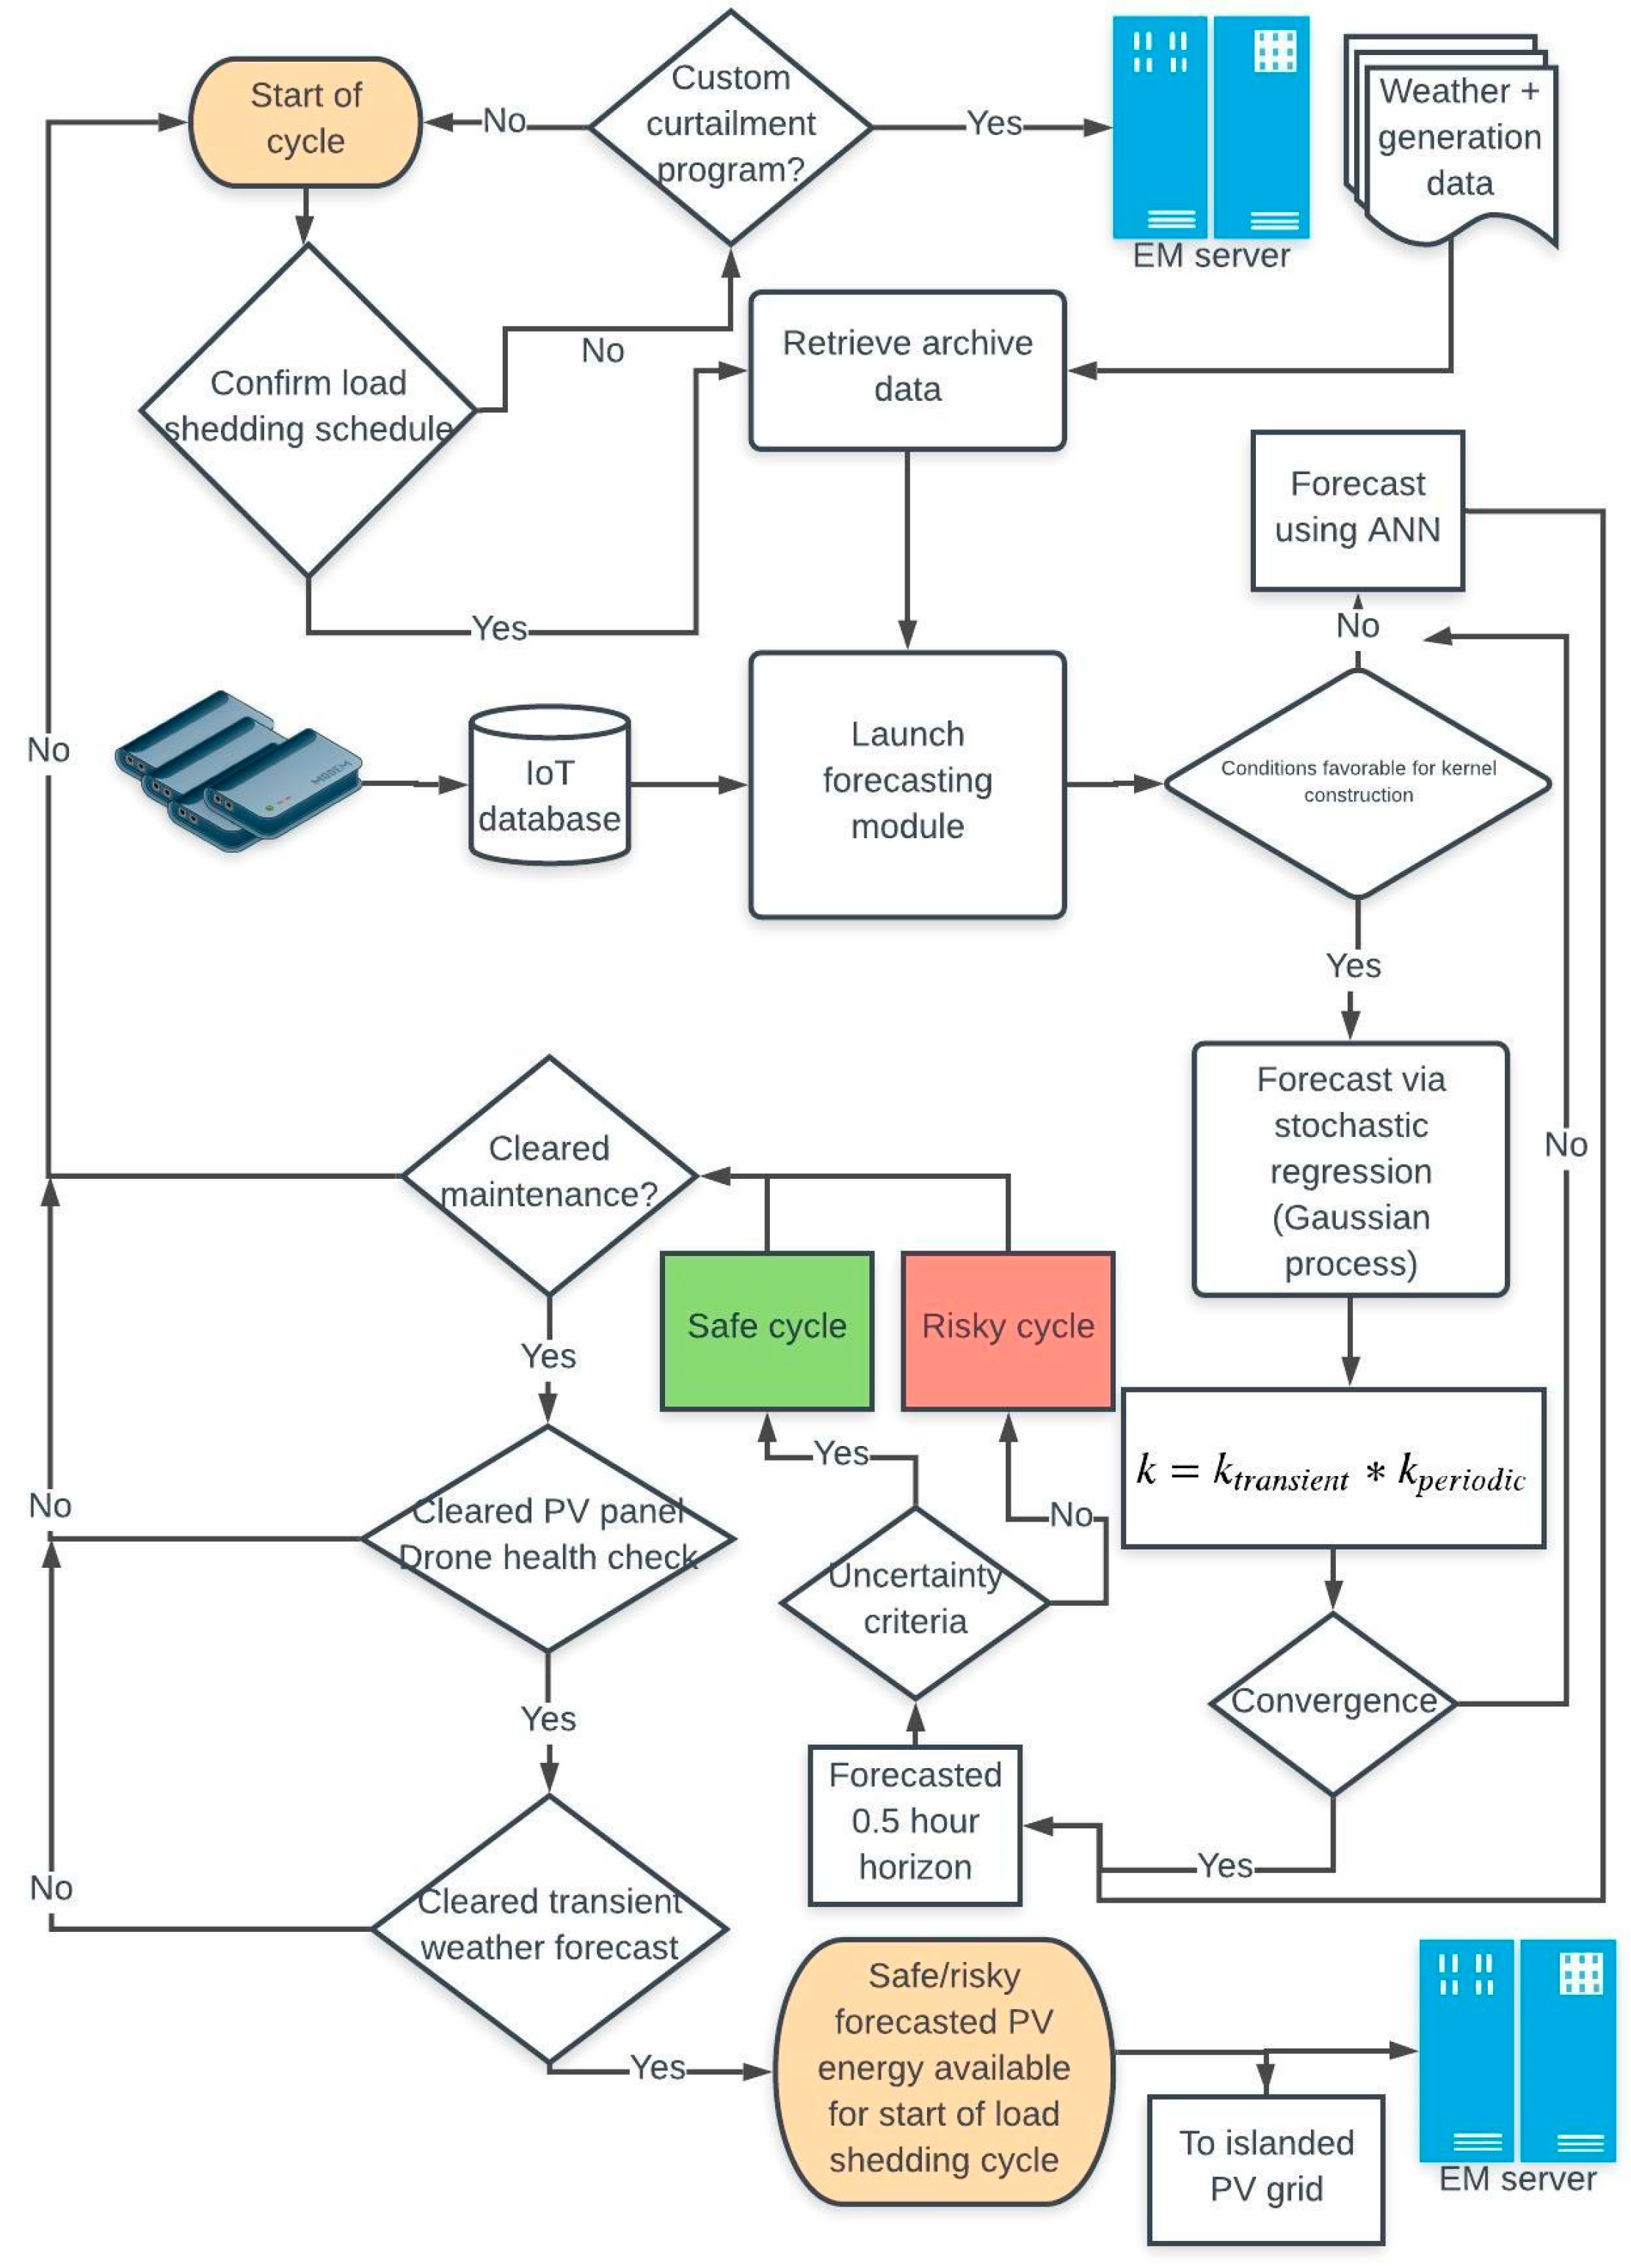
The PV optimization scheme (see
Figure 1) uses actual environmental data together with generation forecasting to produce an estimated available PV energy over a 0.5 h horizon. The estimated available energy is complimented with a known uncertainty and will classify the possible PV output as either a risky cycle or a safe cycle (depending on the chosen critical uncertainty). The PV optimization scheme uses several streams of unique data, including historic weather and generation data, IoT sensor network data associated with the PV plant, facilities management software (maintenance programs) and weather forecasts spanning the prediction horizon. The PV optimization scheme must be the first step to be completed as part of the holistic optimization scheme, since the chosen dispatch strategy primarily manages the remaining demand.
Prior to the utility curtailment event, all curtailment schedules and priorities are checked and the necessary data is gathered in order to initialize the forecasting module. The forecasting module is based on either a hybrid scheme that initializes neural nets (if no kernel can be constructed) or a Gaussian process when data conditions are favorable for kernel construction. The forecasting module is trained to achieve a 0.5 h horizon with forecasting uncertainty. Depending on the length of the training data set and regression resolution, forecasting algorithms can become computationally expensive and should be included as part of a dedicated EM server with enough computational capacity for quick response times on forecasting requirements. The output of the forecasted module will be the total renewable energy that can be dispatched to the campus electrical network with associated uncertainty (based on the classification of safe or risky cycle). The PV module (see
Figure 1) acts as the first step to initialize the energy dispatch strategy within the horizon of 0.5 h. The optimization scheme will critically act on maintenance conditions that are flagged and if the utility curtailment process seized. Transient weather events will increase the uncertainty of the cycle and could lead to the determination of the optimization cycle.
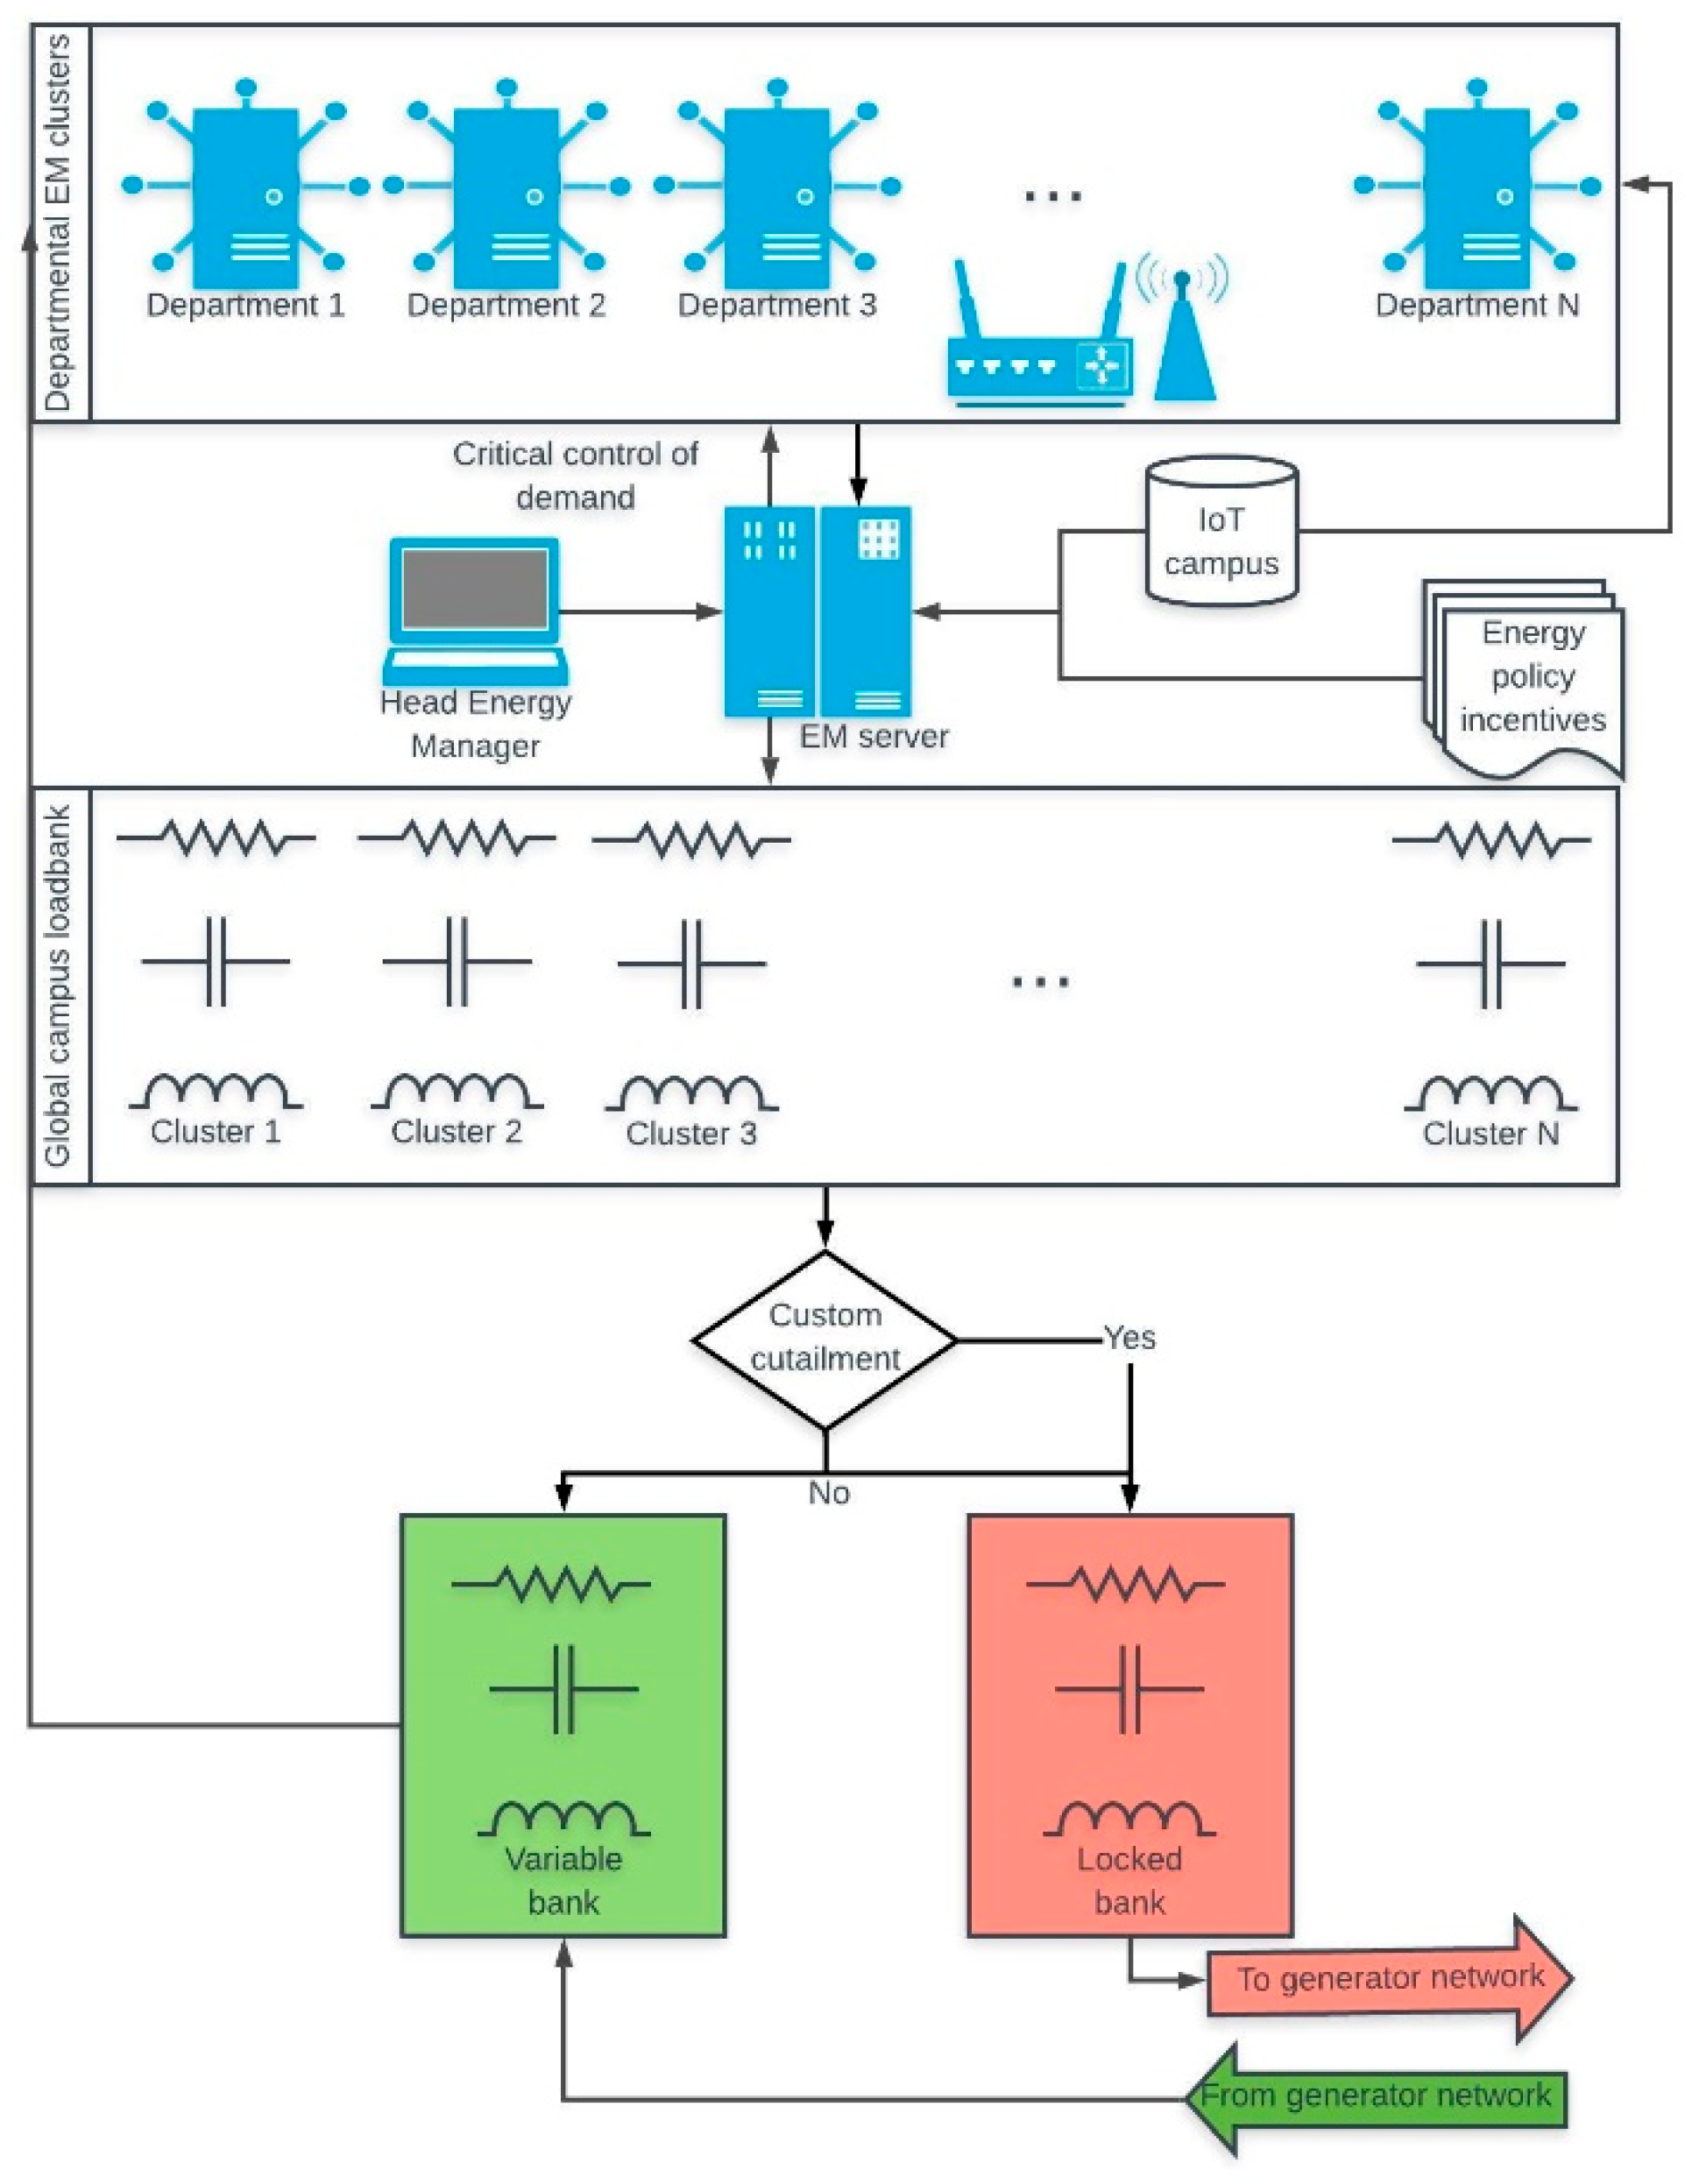
The load bank optimizer (see
Figure 2) initiates at departmental level by checking the current state of each department’s digital EM strategy. Departmental EM strategies are typically schedule driven (lecture halls, research labs and offices), thus each departmental EM strategy could deliver a load bank comprising of variable and locked banks as preconditioned by the departmental EM champion or framework. A typical response from the departmental EM framework can be seen in
Table 1 and
Table 2 (color coding corresponds to safe or risky cycle in optimization schemes).
The lead EM framework accounts for all departmental locked/variable load banks, as well as the relative sizes of the loads. It is assumed that the departmental EM framework can account for the size, type of load, power factor and associated schedules of each load in the department (elements that future smart campuses will have). The final load bank that will partake in the 0.5 h cycle of energy optimization is finalized into a compatible data structure that awaits input from the fossil fuel generator optimization scheme (see
Figure 3).
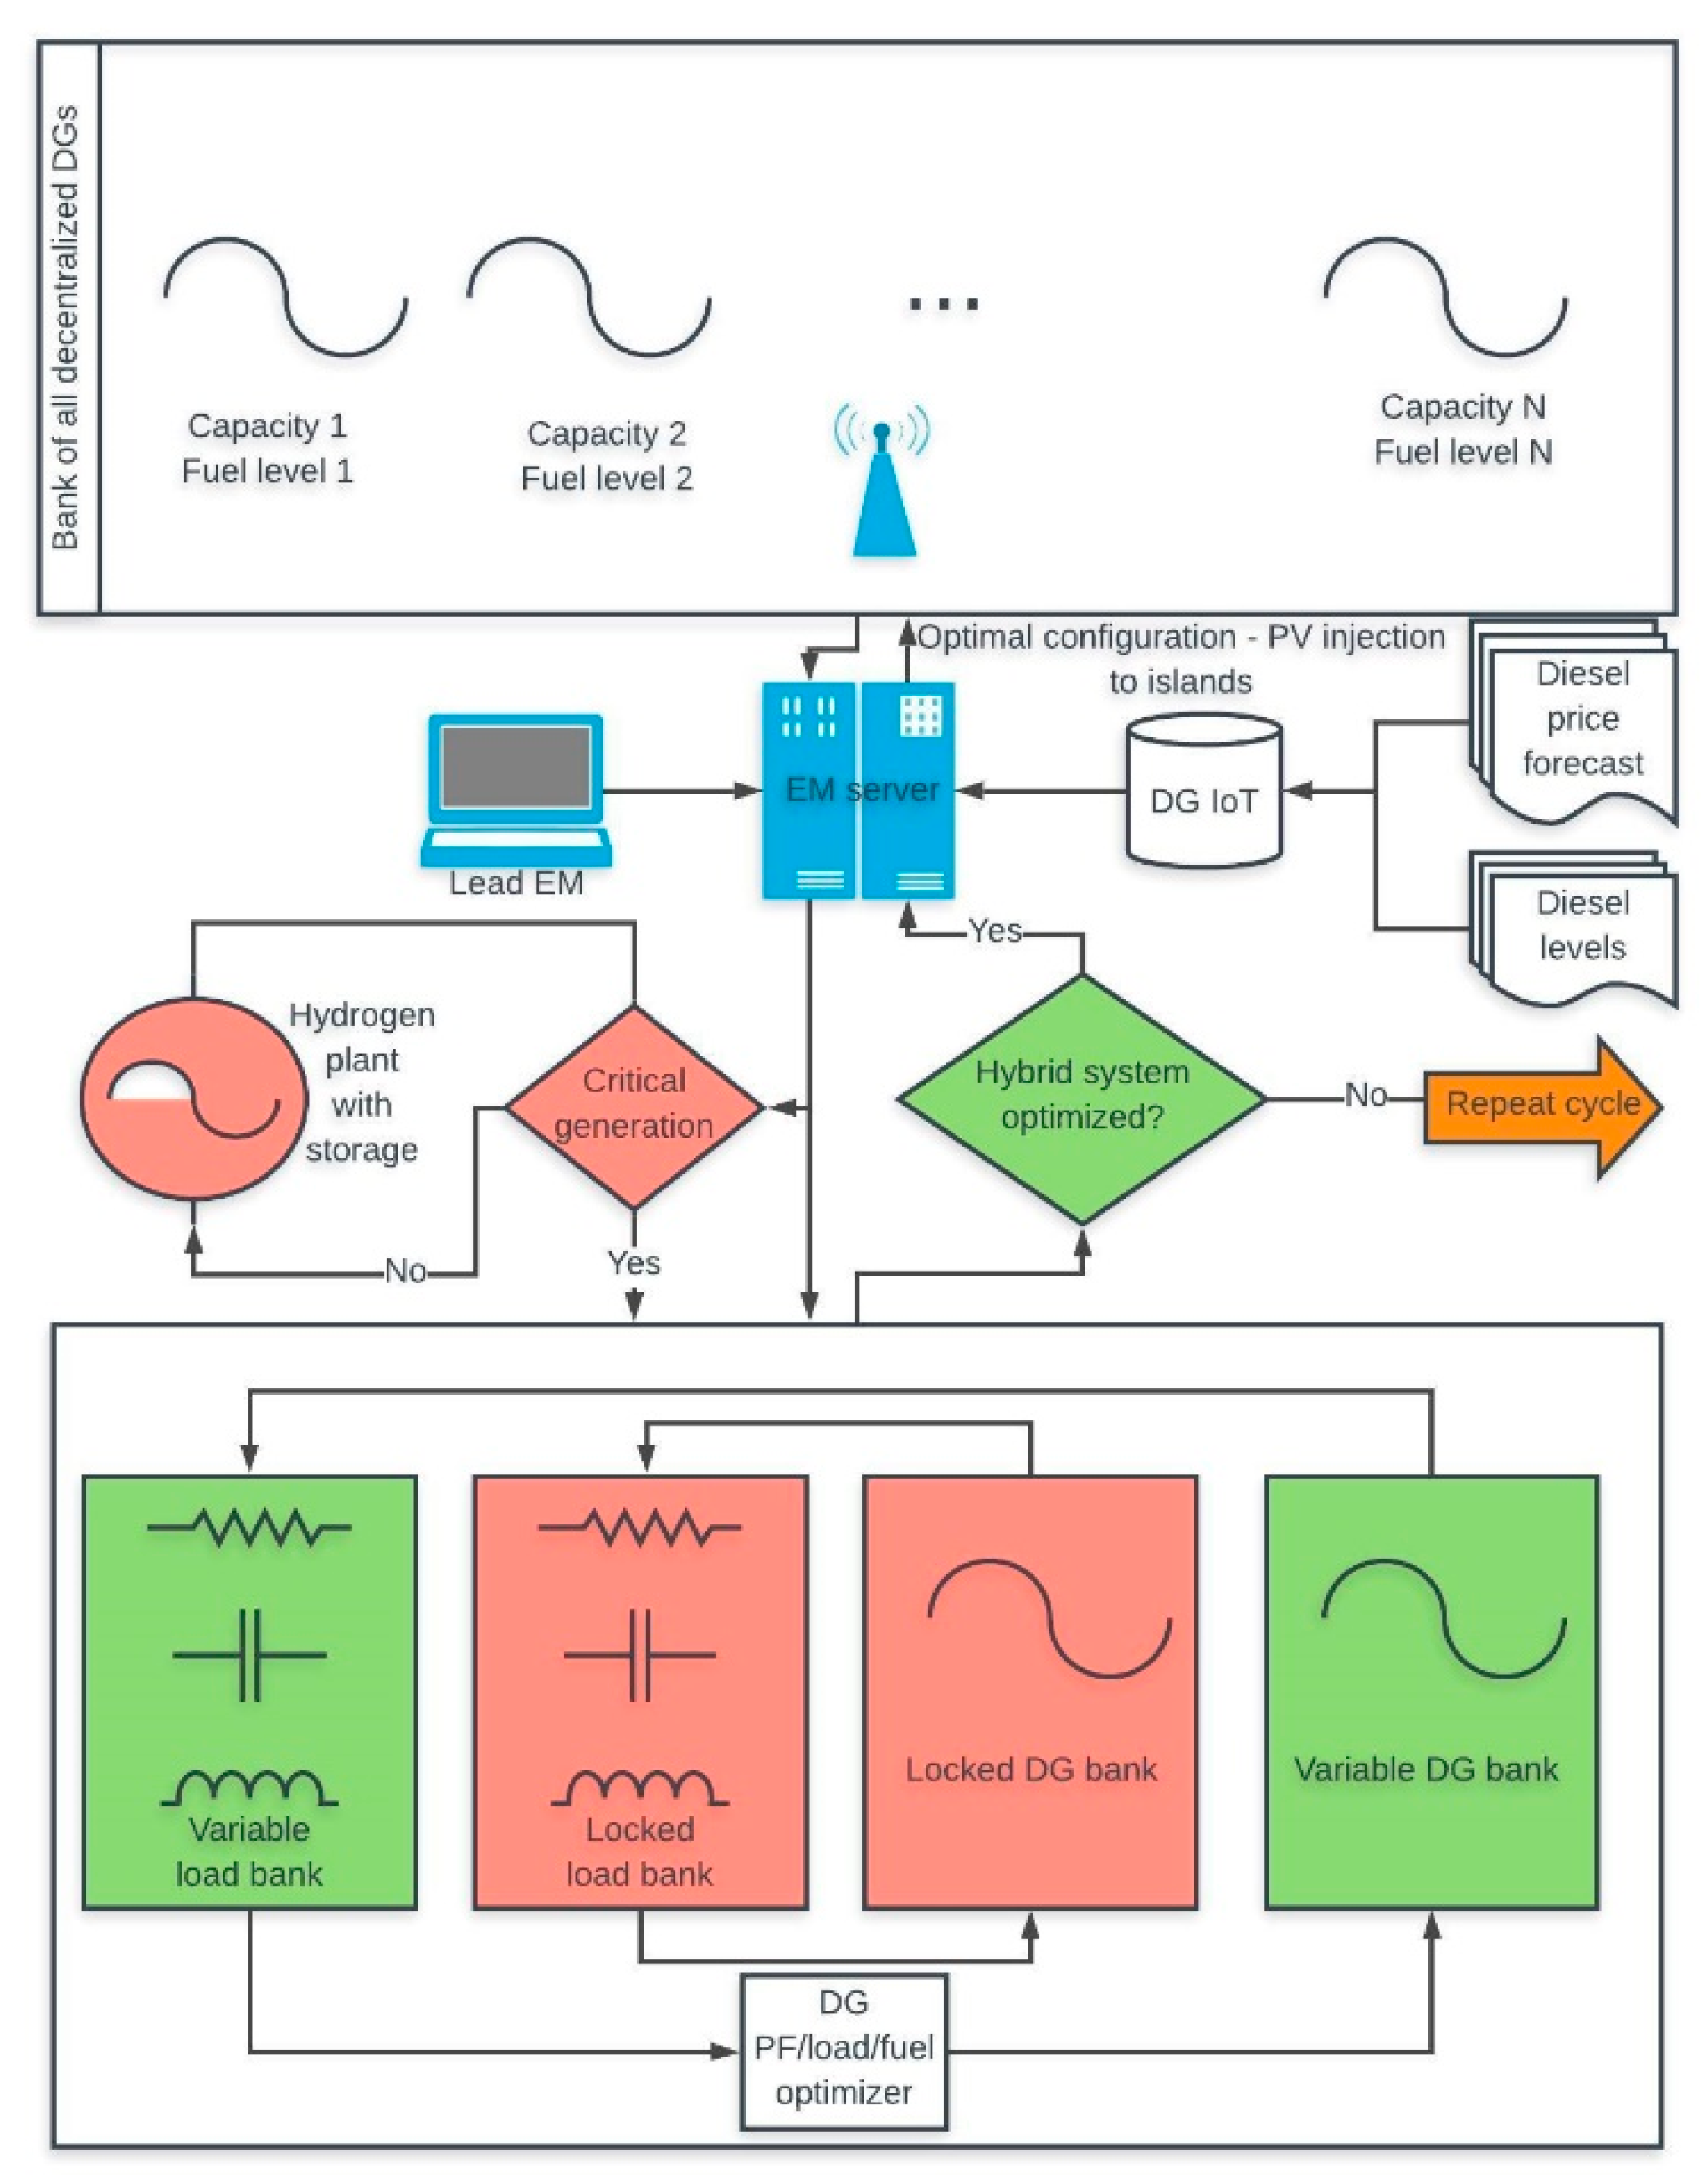
The fossil fuel optimization scheme is based on the assumption that all fossil fuel generators are equipped with two-way communication and control. Furthermore, any load could be connected to any generator on campus (dismissing any practical considerations). The fossil fuel IoT network of sensors captures data associated with the generators such as fuel levels, operating conditions and location. The lead EM server supplies additional information such as maintenance and refueling schedules to the global optimizer based on fuel price forecasting and diesel levels.
At this point global energy accounting can be performed (matching supply with load) and critical energy generation via hydrogen plants could be initiated to supply critical loads. A bank of variable/locked fossil fuel generators can now be generated and passed on to the final optimization phase. The optimizer then proceeds to match the locked/variable loads with the fossil fuel generators based on power factor and load size. Once the locked loads are matched with the locked fossil fuel generators, the algorithm proceeds to match the variable banks over the horizon of 0.5 h. This process repeats every 0.5 h with the aim of reducing fuel consumption for the span of the utility power loss.
3. Extremities of Optimization Framework
The following two scenarios are presented: (1) the remaining load (after PV quenching) is distributed among generators irrespectively of fuel levels, load type or fuel forecasts, (2) optimizer algorithm (see
Figure 2 and
Figure 3) suggests two types of generators linked with two types of load collections (from either the locked or variable banks), calculated every 0.5 h over a 3 h horizon.
Two extreme poles/classes of option (2) are a generator with a low fuel level that is scheduled for refueling and a generator with high fuel levels. If the optimizer algorithm predicts favorable fuel, it will suggest that the low fuel level generator to be utilized at 50% and the high fuel level generator at the difference between maximum capacity and the spinning reserve. The aim here is to maximize fuel savings at the end of the three-hour utility curtailment cycle. Due to the efficiency curves of both typical generators described as extremities, fixed parameter loads are required to be served by both generators (having different fuel levels). The 50% utilized generator can serve loads from the variable bank (non-stringent constraints on power factor and load size requirements) and the fully utilized generator can serve loads from the locked bank (due to stringent power factor and load type requirements). The locked load bank can be assigned with certainty and all load sizes, types and Power Factor (PFs) are known.
Total savings generated by the optimization scheme is decomposed into the savings generated by refueling at a better tariff rate and actual fuel savings due to more efficient generator utilizations. Over the three-hour utility power loss event, the optimizer performs six optimization steps (0.5 h apart). The PV plant energy output could change over this horizon, thus changing the dynamics of the optimization. The spinning reserve of each generator is dependent on the uncertainty of the PV power output (risky or safe cycles, see
Figure 1) divided among all the available generators. As an example, if the available PV power output contains large uncertainty, the spinning reserve for each generator will increase and vice versa. The spinning reserve of each generator is re-calculated after every cycle and determines the maximum utilization of the generators.
It is further assumed that the collection of generators are of variable type (constant frequency, but variable kW input). The typical variable generator is specified by a rating (e.g., 250 kVA, 0.8 PF, 200 kW and 150 kVAR) and will be connected to a collection of loads specified by type, size and PF. Specified by the generator’s efficiency/PF curve, as the utilization of the generator increases, both the efficiency and PF requirements increases. Generators with a high forced utilization factor (determined by the optimization algorithm, see
Figure 1,
Figure 2 and
Figure 3), must be connected to cleaner collection of loads (from the perspective of PF) to safeguard possible breaching of the generator’s kVAR rating. Thus, low fuel level generators could be utilized at e.g., 50% and will serve load collections with low power factors safely (vice versa for high fuel generators).
4. Conclusions
The holistic optimization framework exhibits potential of typical campus hybrid PV–fossil fuel generator systems generating fuel savings under powerless utility scenarios when optimized in discrete time steps using campus IoT, EM and generation/consumption forecasting techniques, e.g., forecasting of renewable power output (PV, wind and hydrogen) and campus load characteristics. This is an improved savings scheme as opposed to running the generators at fixed speed without any type of data/optimization feedback. The novelty of the scheme lies in the PV power output estimation with uncertainty. The known uncertainty associated with the available PV energy could classify the output as risky or safe. This will allow improved load distribution to generators that are sensitive to fuel price forecasts and refueling maintenance, as well as improved predictive maintenance schedules associated with the generators. The main aim of the optimization scheme is to maximize fuel savings during the utility power loss. Technical recommendations for a full-scale scenario, consisting of an EM server platform hosting all the forecasting algorithms, campus IoT and policy data will be discussed and commissioned in future.
The full-scale scenario will initially be commissioned using a campus department that utilizes decentralized renewable resources, together with fossil fuel generation and energy policies. The EM server that hosts all the tiers of the optimization scheme will be located in the department itself. Following the initial commissioning test, the platform will be rolled out to the entire campus network. This full-scale scenario will require full integration of controls, metering installation/retrofit, IoT campus integration, SCADA system implementation, energy policy reviews, energy policy integration and decentralization/centralization of required generators. All of the last-mentioned elements will have to be interwoven on an EM server that contains the optimization scheme in algorithmic form, as well as the necessary maintenance and energy policy framework. Since all the discrete optimization steps will have associated uncertainty, the final savings will be able to be verified with ease. The optimization scheme presented in this paper is an example of generating savings in the absence of grid power.
Future work will be based on data produced by actual smart campus elements, sensors, generators and loads. From there a study and framework will be formulated regarding the system time dependencies. However, emphasis must be placed on the practicality in the hypothetical scheme, especially since the sampling time, signal changes and signal delays found in the forecasting techniques, campus IoT network and internal data transport play a critical role in the success of this proposed global scheme. The process of illustrating the improvement of the campus power supply will be based on a PV penetration metric, that needs to be evaluated in conjunction with the scheme.


