1. Introduction
Energy plays a vital role in human life and acts as a fundamental factor for national economic development [
1]. The high consumption of fossil fuels leads to severe environmental problems, for example increasing greenhouse gas emissions, which has led to climate change and global warming [
2]. The global population has grown by a factor of 2.5 during the last 60 years, and the global consumption of primary energy has increased by a factor of 4.5 [
3]. Furthermore, over the next 30 years the worldwide demand for energy is expected to increase and the extensive consumption of fossil fuels portends negative global consequences, for instance a reduction of fossil energy resources, environmental pollution and climate change [
4]. South Asia is a more vulnerable region as environmental scientists conclude that changes in climate lead to these disasters, and more disasters of the extreme level would hit South Asia. According to a recent climate vulnerability report, the region of South Asia is at the verge of climate effects and the rising sea level would submerge 17% of Bangladesh, leaving 18 million people displaced over the next forty years. Similarly, a 1.7-millimeter erosion of topsoil caused by monsoons will grossly affect the ability of crop growing in Nepal.
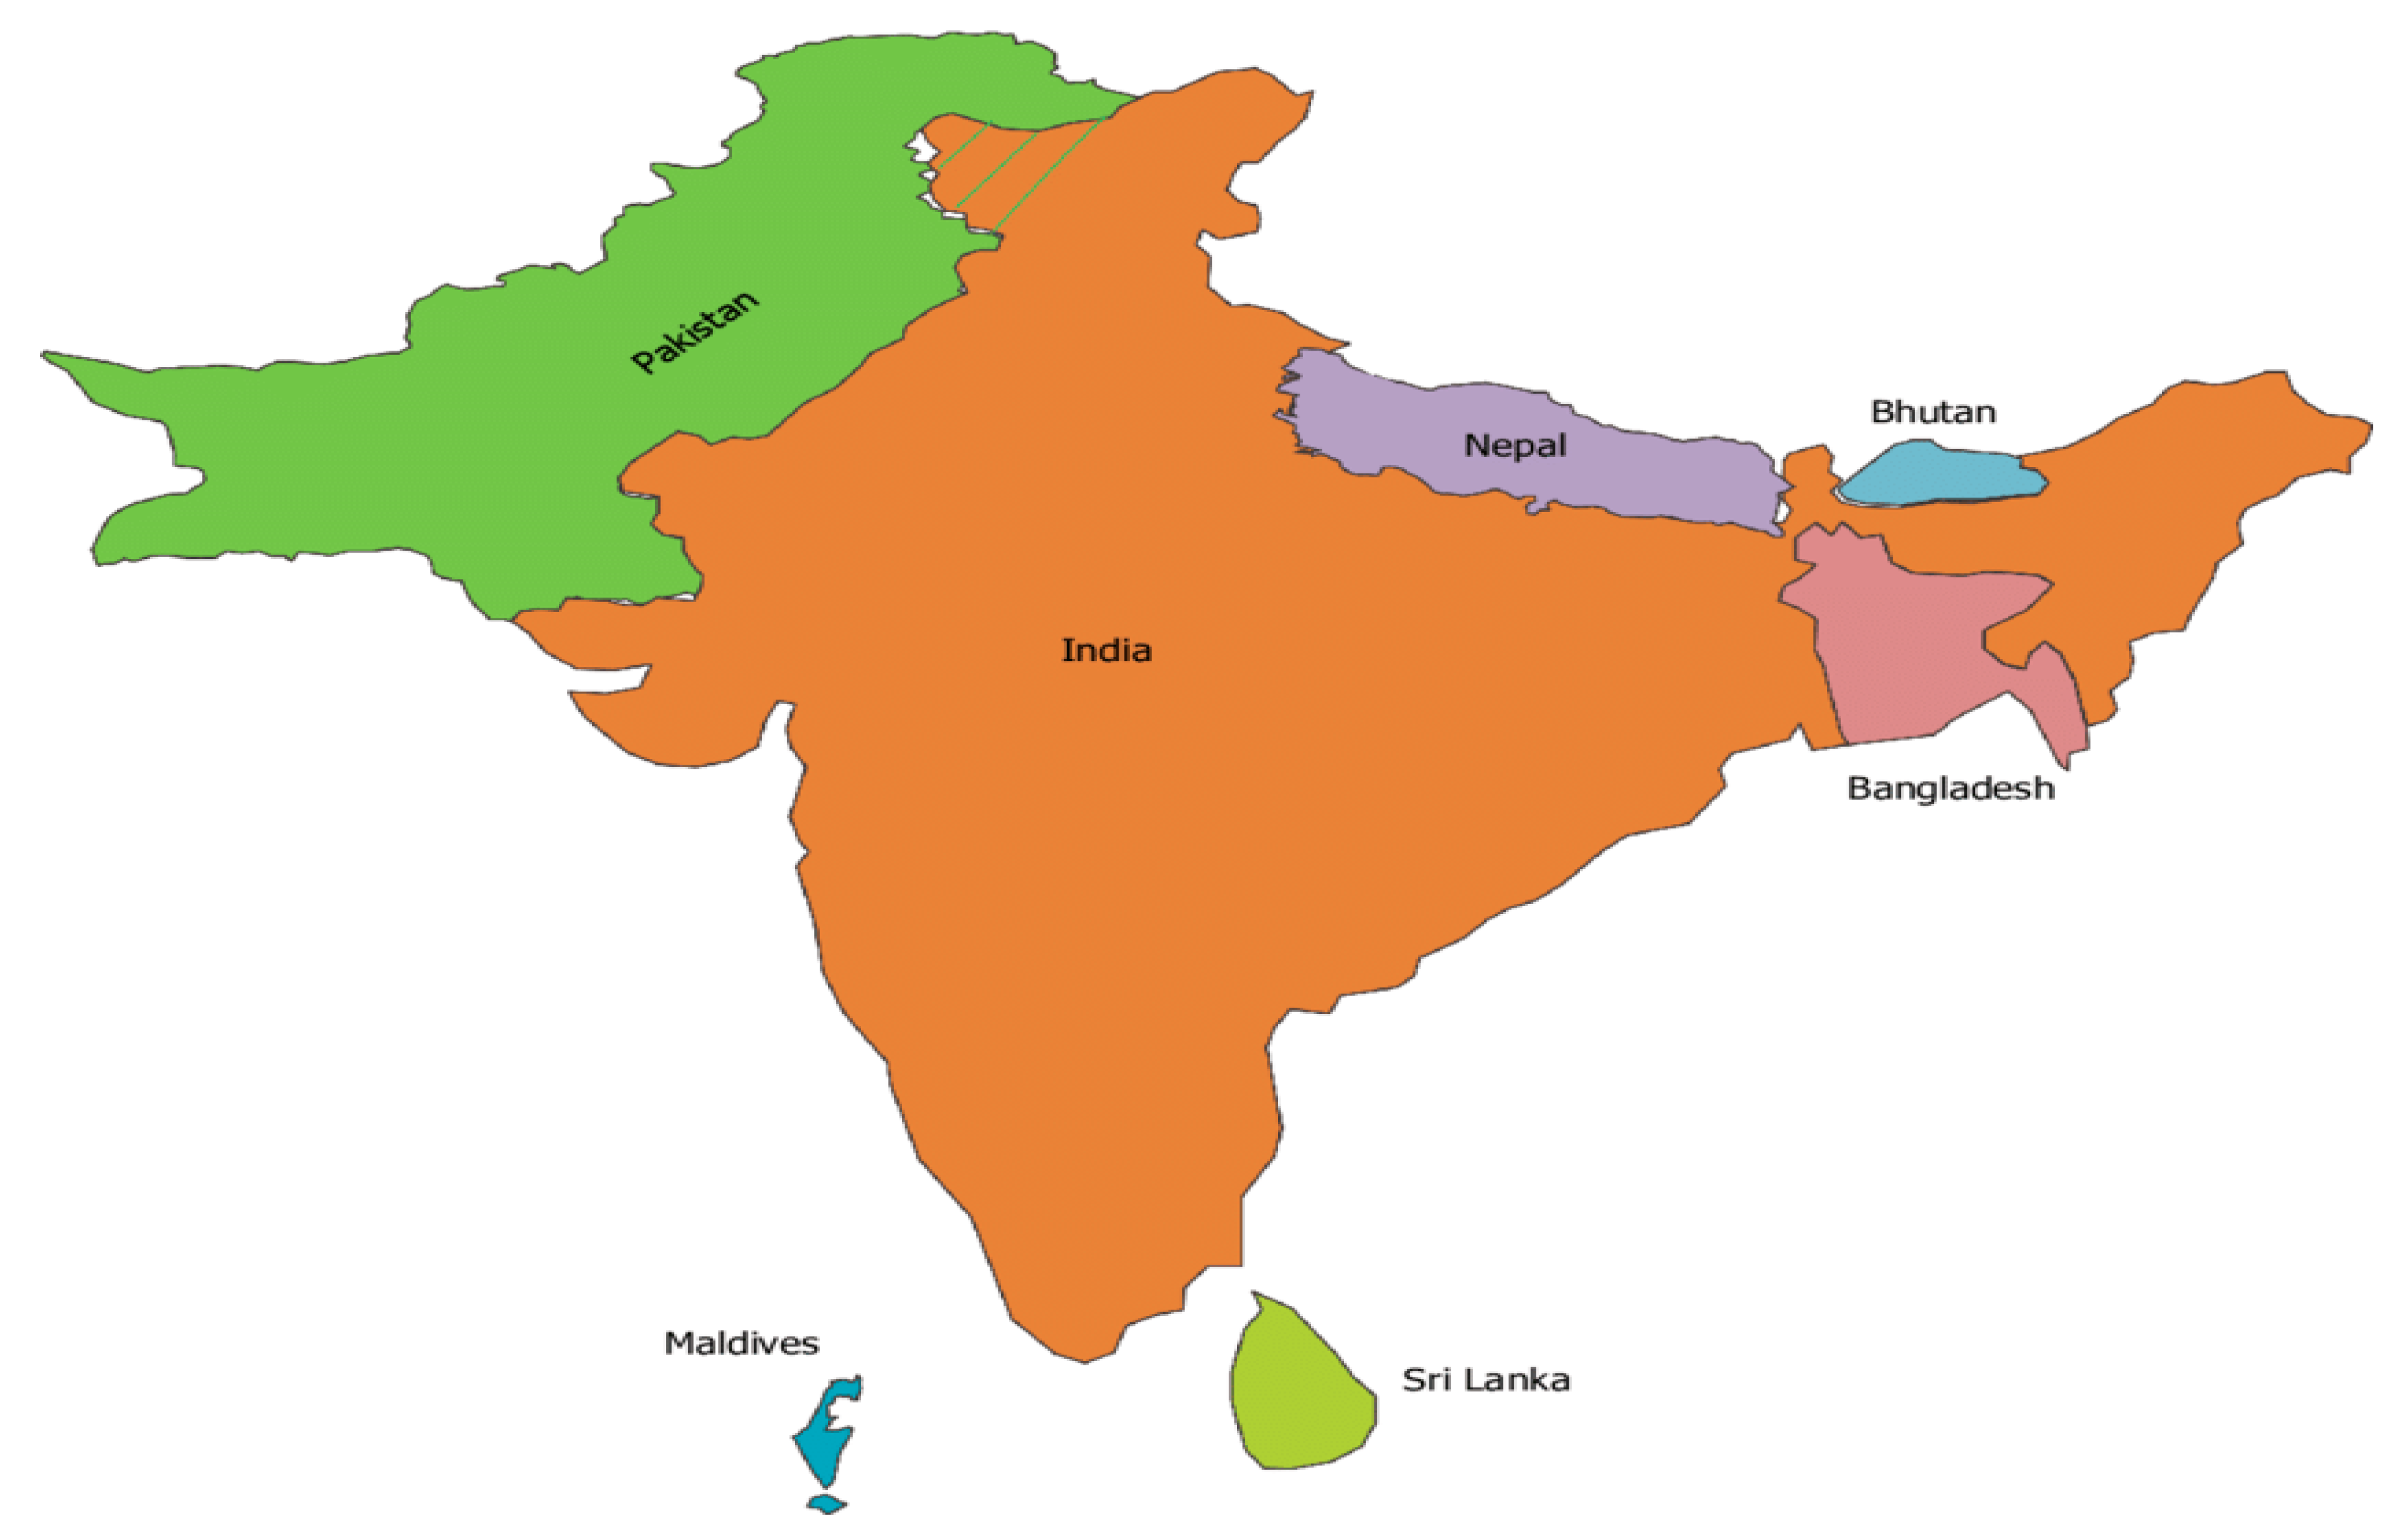
The South Asia region includes transition economies, namely Pakistan, India, Nepal, Sri Lanka, Bhutan, Bangladesh and Afghanistan (
Figure 1). This region is at the center of global dramatic trends, for instance climate change, the energy crisis, resource exploitation and water security. The reasons for choosing South Asian countries in this study include their climate vulnerability and the regional energy sector’s focus on three significant issues. First, the countries of this region face enormous challenges in ensuring energy supply to sustain economic growth. Second, most of the population of this region does not have access to clean energy, especially in rural areas where people mainly rely on biomass for cooking and heating due to the lack of electricity. Third, due to the lack of limited domestic energy resources, South Asian economies are heavily dependent on the import of gas and crude oil. There are a number of studies involved with the methods employed for evaluating energy efficiency. For instance, the author examined energy efficiency from the viewpoint of accessibility, availability, acceptability, and affordability by using the DEMATEL(Decision making trial and evaluation laboratory) method [
5]. Mardani et al. [
6] used the data envelopment analysis (DEA) approach to study the current situation of energy efficiency and remaining energy opportunities. Kevin [
7] also qualitatively investigated the reasons why the energy efficiency of China has not improved during a period of economic reform. The authors focused mainly on the relationship between energy efficiency and the energy policy of the country. Büyüközkan and Karabulut [
8] assess ‘energy efficiency’ by applying an analytic hierarchy process concerning low-carbon energy. Henriques and Catarino [
9] evaluate oil diversification and energy efficiency using the Herfindahl–Hirschman index (HHI). Wang et al. [
10] measured the energy efficiency, trends in the oil diversification and natural gas supplies of OECD (organization for economic co-operation and development) countries by using imported oil diversification. Meanwhile, Karabulut and Büyüközkan [
11] proposed a hierarchical structure for the measurement of the sustainable performance of the energy indices of developing countries.
Numerous studies have measured the environmental performance and energy efficiency index using a quantitative indicator system, e.g., Afgan et al. [
12] used sustainability indicators to evaluate energy system assessment. Furthermore, Reuter et al. [
13] used the ex post index decomposition method to measure the energy efficiency policies of European Union countries. Several studies concerned with methodological index development, such as the assessment index (AI), are proposed by [
14]. while Singh et al. [
15] proposed policy indicators and energy sustainability country index (SCI) consisting of 22 indicators. Ang and Zhang [
16] conducted a study which applied the decomposition of index analysis techniques in order to measure energy demand and gas emissions.
There are also many studies on environmental performance in case of the South Asia region, e.g., Danish et al. [
17] evaluated the energy efficiency of Pakistan using the long-range energy alternative planning system under renewable energy and non-renewable energy policy scenarios to find that the renewable energy scenario was the most appropriate option for the country. Rafique [
18] assessed the future energy scenario of Pakistan using three-dimensional indicators and combined 11 indicators in total with a simulation model under scenarios wherein energy imports were reduced from 2005 to 2050. Islam et al. [
19] concluded the availability, strategies, current status, policies, perspectives, significant achievements, and future potential of energy options, in terms of the energy efficiency of Bangladesh. In another study of Bangladesh, Zaman and Brudermann [
20] assessed energy services security in terms of the energy governance context and also investigated how current energy efficiency policies conflicted with climate change mitigation targets. Different authors conducted studies in India, for instance Sahoo et al. [
21] who investigated the energy efficiency for India in the case of challenges, achievements and legality using a computable general equilibrium (CGE) model. Further, Pode [
22] examined the future India energy efficiency in terms of diversification of energy sources and the energy mix in the country. Narula et al. [
23] investigated the sustainable energy efficiency for India between 2002 and 2012 by using 16 metrics, including the perspectives of energy supply, demand, conversion, and distribution.
South Asian economies are incredibly reliant on fossil fuel importation making them among the most vulnerable regions with respect to ‘energy efficiency’ as most of the countries with affected energy supplies in this region face a persistent shortage of fossil fuel. The countries of this region are facing a high energy shortage due to their high dependence on external fossil fuel supplies. South Asian countries often suffer from multiple oil shocks, which is not a good signal for a healthy energy supply’ in any country. Traditionally, energy efficiency and environmental performance have been examined separately, and recently the relationship between them has been recognized and discussed seriously. None of the preceding studies combined a relevant, comprehensive set of indicators, nor did they use DEA like the mathematical composite indicator method to measure energy efficiency and environmental performance.
This research focuses on the accurate estimation of energy efficiency and environmental performance index of South Asia. This paper also focuses on environmental issues with respect to the consumption of fossil fuel, focusing for example on which country’s fossil fuel consumption is greater than their infrastructure or demonstrates a higher share of ‘renewable energy’ in their total energy mix. Therefore, to address this problem, we have constructed a comprehensive set of indicators and employed a mathematical composite index that combines numerous aspects of an indicator systematically and transparently. The composite index provides a pre-requisite understanding of energy efficiency challenges, energy supply profile and systematic assessment of international rankings. The study contained an empirical estimation of energy efficiency and environmental sustainability. The research objectives include (i) a critical assessment of the level of energy efficiency; (ii) an assessment of environmental vulnerability and (iii) an assessment of economic viability and renewable energy metrics have been included to measure economic aspects.
The rest of the paper is organized as follows.
Section 2 describe the background of South Asia,
Section 3 explains the indicators for evaluating energy efficiency and environmental performance,
Section 4 presents the methodology.
Section 5 explains the results, and lastly
Section 6 concludes the paper and proposes a policy.
2. Background
South Asian countries are not in a position to meet their national energy requirements entirely from domestic energy resources. India has considerable coal reserves; Bangladesh has gas reserves while Nepal and Bhutan have significant opportunities to use embryonic hydropower as presented in
Table 1. The World Bank recommends that reasonable and coherent public policy choices can bring a win-win energy situation to all participants in the region [
24]. The International Energy Agency [
25] reports that the energy demand in South Asia will increase to double the global average demand in the next few decades. Only India’s energy is predicted to increase more than 140% as compared to 55% of the world demand as a whole. The growing rate of fossil fuel consumption is expected to increase by around 6% in South Asia [
26]. India leads with 5.7 billion barrels of crude oil reserves in the region. Bangladesh and Pakistan have only 28 million and 341 million barrels respectively, but the worst threat is an exhaustion of these crude oil reserves in the coming 30 years [
27].
The natural gas reserves also show an unfavorable situation in South Asian countries. For example, India has 1.88 trillion cubic meters natural gas reserves while Bangladesh has 0.39 trillion cubic meters and Pakistan has 0.44 trillion cubic meters of natural gas reserves [
28]. This depicts a very alarming situation with respect to energy and it directly impacts energy efficiency. Further, the electricity consumption varies from 19 units per year in Afghanistan to 540 units per year in India and Pakistan respectively. The growing demand for electricity is 7% per year in South Asian countries except for Bhutan, Afghanistan where the growth rates are expected over 13% first decade in order to meet rural electrification requirements [
29].
The growing countries of South Asia demonstrate an increasing trend with respect to energy intensity and represent an unmatched development in the demand and supply of energy sources. Thus, the energy insecurity of South Asia mainly originates from the lack of resources and rising imbalance of the demand and supply of energy sources. South Asian countries need to meet the increasing energy desire secure and reasonably priced energy sources [
30]. South Asia has a potential imbalance between energy demand and supply from national energy sources which yields a resulting increasing import dependence on energy sources. Energy bequests and legacies vary among South Asian countries but access to significant energy supplies remains scarce in neighboring countries. This negatively affects energy efficiency and increases the cost of energy supply among individual countries, and in the region overall. Further, a mechanism of energy trading is lacking in the region which is another barrier for efficient energy connectivity. A mechanism of energy trade in the region is a better way to deal with the insecure energy situation and could increase energy efficiency [
31].
Therefore, this study contains the methodological and practical implications such as the energy and environmental performance index (EEEPI) for applying various energy and environmental related indicators (CIs) by using DEA-Like indicators and multi-criteria decision analysis (MCDA) that could be helpful for decision makers and analysts in dealing with complex energy and environmental related issues. Various researchers have used similar studies to generate meaningful indicees such as Huang et al. [
32] who reviewed the applications of decision analysis (DA) in energy and environment (E & E) studies, which was further updated by Zhou et al. [
33]. Greening and Bernow discuss the potential of MCDA in developing coordinated energy and environmental policies [
34]. Also, CI can be used to compare different organizations in the same industry, thus providing investors with input on their efficiency and environmental performance. It can also be used to compare carbon emissions performance and energy efficiency in different economies to inform decision-makers in international negotiations. The following are four notable examples of composite indicators (CIs) associated with energy, the environment and sustainable development: (1) Environmental Performance or Sustainability Index; (2) Air Quality Index; (3) Human Development Index, and (4) Living Planet Index. These Cis have been commonly accepted as useful tools for understanding complex energy and environmental issues, such as energy and environment policy analysis, where energy and environment-related CIs are typically built for policy or decision makers.
4. Methodology
Data envelopment analysis (DEA) sporadically called frontier analysis was introduced by Charnes, Cooper and Rhodes in 1978. DEA researchers have suggested rules of thumb for the relationship between the number of firms and the number of inputs and outputs to reduce the dimensionality. The dimensionality problem usually arises in the DEA methodology. Data envelopment analysis (DEA) is mathematical programming approach to measure various types of efficiency by using different inputs and outputs, whereas composite indicators (CI) is an aggregation of various indicators through different mathematical models. We used DEA-like composite indicator rather than DEA. Thus, DEA-Like composite indicators is geometric aggregation characterized by weighted product (WP) method which evades the subjective weight allocation. As we argued that the dimensionality problem arises in DEA based efficiency measurement, we have conducted an aggregation of various indicators using a DEA-like composite indicator approach. Thus, there is no dimensionality problem in DEA-like composite indicator. Generally, the application of DEA in CI construction can be classified into two groups. Technically, Composite indicators have no common units of measurement. It is a mathematical set of individual indicators that evaluate multidimensional concepts and has its pros and cons [
40].
The conventional DEA first identify the inputs and outputs and then generated an aggregated index, while the second category used the same type of indicators or variables and then used weighting criteria, normalization and then aggregated those normalized indicators by using DEA-like models. Energy efficiency assessments for individual indicators are not sufficient to assess the increasing energy efficiency of any country. However, it is essential to calculate the CI in energy efficiency. The widely used methods for aggregation of CI and weight allocation are multiple criteria decision analysis (MCDA) and data envelopment analysis (DEA). Therefore, for the purpose of aggregation, we used the methodology which is closely similar to [
41]. The DEA like a model for aggregation purpose is written as:
Model (9) is maximizing multiplier DEA model. The model (9) calculates aggregated performance scores for entity
i based on all underlying sub-indicators. Model (9) can choose the best set of weights for each entity under the characteristics of DEA. The extended form of the model (9) is as follows:
In contrast to model (9), model (10) looks for a ‘worst’ set of weights for each entity to aggregate the sub-indicators into performance scores. Externally, Model (10) is like an input minimizing multiplier DEA model with constant outputs and multiple inputs, but, in the model (10), all sub-indicators are benefit types, and it is not suitable to treat them as inputs. It is reasonable and logical to combine them into a single index [
42]. Therefore, to construct a CI we combined the two indices in the following way:
where;
,
And
is an adjusting parameter [
41].
In model (11), we use linear scaling in min and max range by adjusting the parameter
that makes the two indices comparable in the range of [0,1] [
37,
38,
39,
40].
After the selection of sub-indicators, the next procedure is to weight and aggregate the sub-indicators in order to transform them into a composite index. The literature shows that DEA and MCDA are two main techniques used for weighting and aggregation [
43]. Whereas, the conventional techniques used by MCDA for aggregation purpose are simple additive weighting (SAW) [
44], ideal distance weighting method (WDI) [
45] and weighted product (WP) [
46]. Numerous researcher has used these aggregation techniques to see [
47,
48,
49]. Zhou and Ang [
50,
51] indicate that the WP method is more suitable for aggregation than other MCDA techniques because it can reduce information loss [
43]. Weight restriction is a common practice in constructing composite index therefore
and
are considered as the lower and higher weight whereas the values can be derived from expert consensus. It is more practical and easier to determine weights through expert consensus see [
52]. According to the consensus of our team members. We specify
, that means k-th sub-indicator can only contribute between 5% and 20% in constructing a composite index score.
In essence, the rules of thumb for input/output selection suggested by DEA researchers are used in efficiency measurement, whereas DEA-like composite indicators are simply normalization and aggregation of various indicators. As for weight selection, the developed DEA-Like composite indicator model assigns a weight to each indicator while determining the efficient units via solving the model and there is no need to assign the weights exogenously.
Data Sources
We obtained data for the selected sub-indicators from World Development Indicators (World Bank) [
53], International Energy Agency, BP Statistical Review and US Energy Information Administration for the period of 2001 to 2015 [
54]. Further, some websites are accessed to collect data for the selected sub-indicators. For instance, data related to Pakistan is obtained from the Bureau of Statistics, NTDC and Ministry of Planning, Development and Reforms; Bhutan data is obtained from the Ministry of Economic Affairs; data for India is accessed from the Ministry of Statistics and Program Implementation and India Energy; while data for Afghanistan is collected from the Ministry of Economy and Energy and Water. Similarly, for Sri Lanka and Bangladesh, data was obtained from the Department of Statistics and Bureau of Statistics, respectively.
5. Results and Discussion
Through each sub-indicator measurement of the aggregated composite index has been done. The analysis performed to date is based on the aggregate CI. However, to understand the relative positions of countries, it is essential to analyze the selected indicators in the overall CI.
Figure 2 presents the energy self-sufficiency score. It can be seen that energy self-sufficiency score varies from 12.90 to 100.6. Afghanistan has the lowest score of 12.90 and Bhutan contains the highest score of 100.6, while Pakistan, India, and Bangladesh have the score above 0.50. This indicates a relatively better energy supply from domestic energy sources. The energy self-sufficiency score shows how much energy is self-supplied by domestic energy sources. An increased self-sufficiency score helps to reduce energy costs and carbon emissions. Bhutan has the highest energy self-sufficiency due to less consumption and excess domestic electricity production.
Energy efficiency measures can help to reduce carbon emissions, which causes the solution to global warming and improving energy self-sufficiency status.
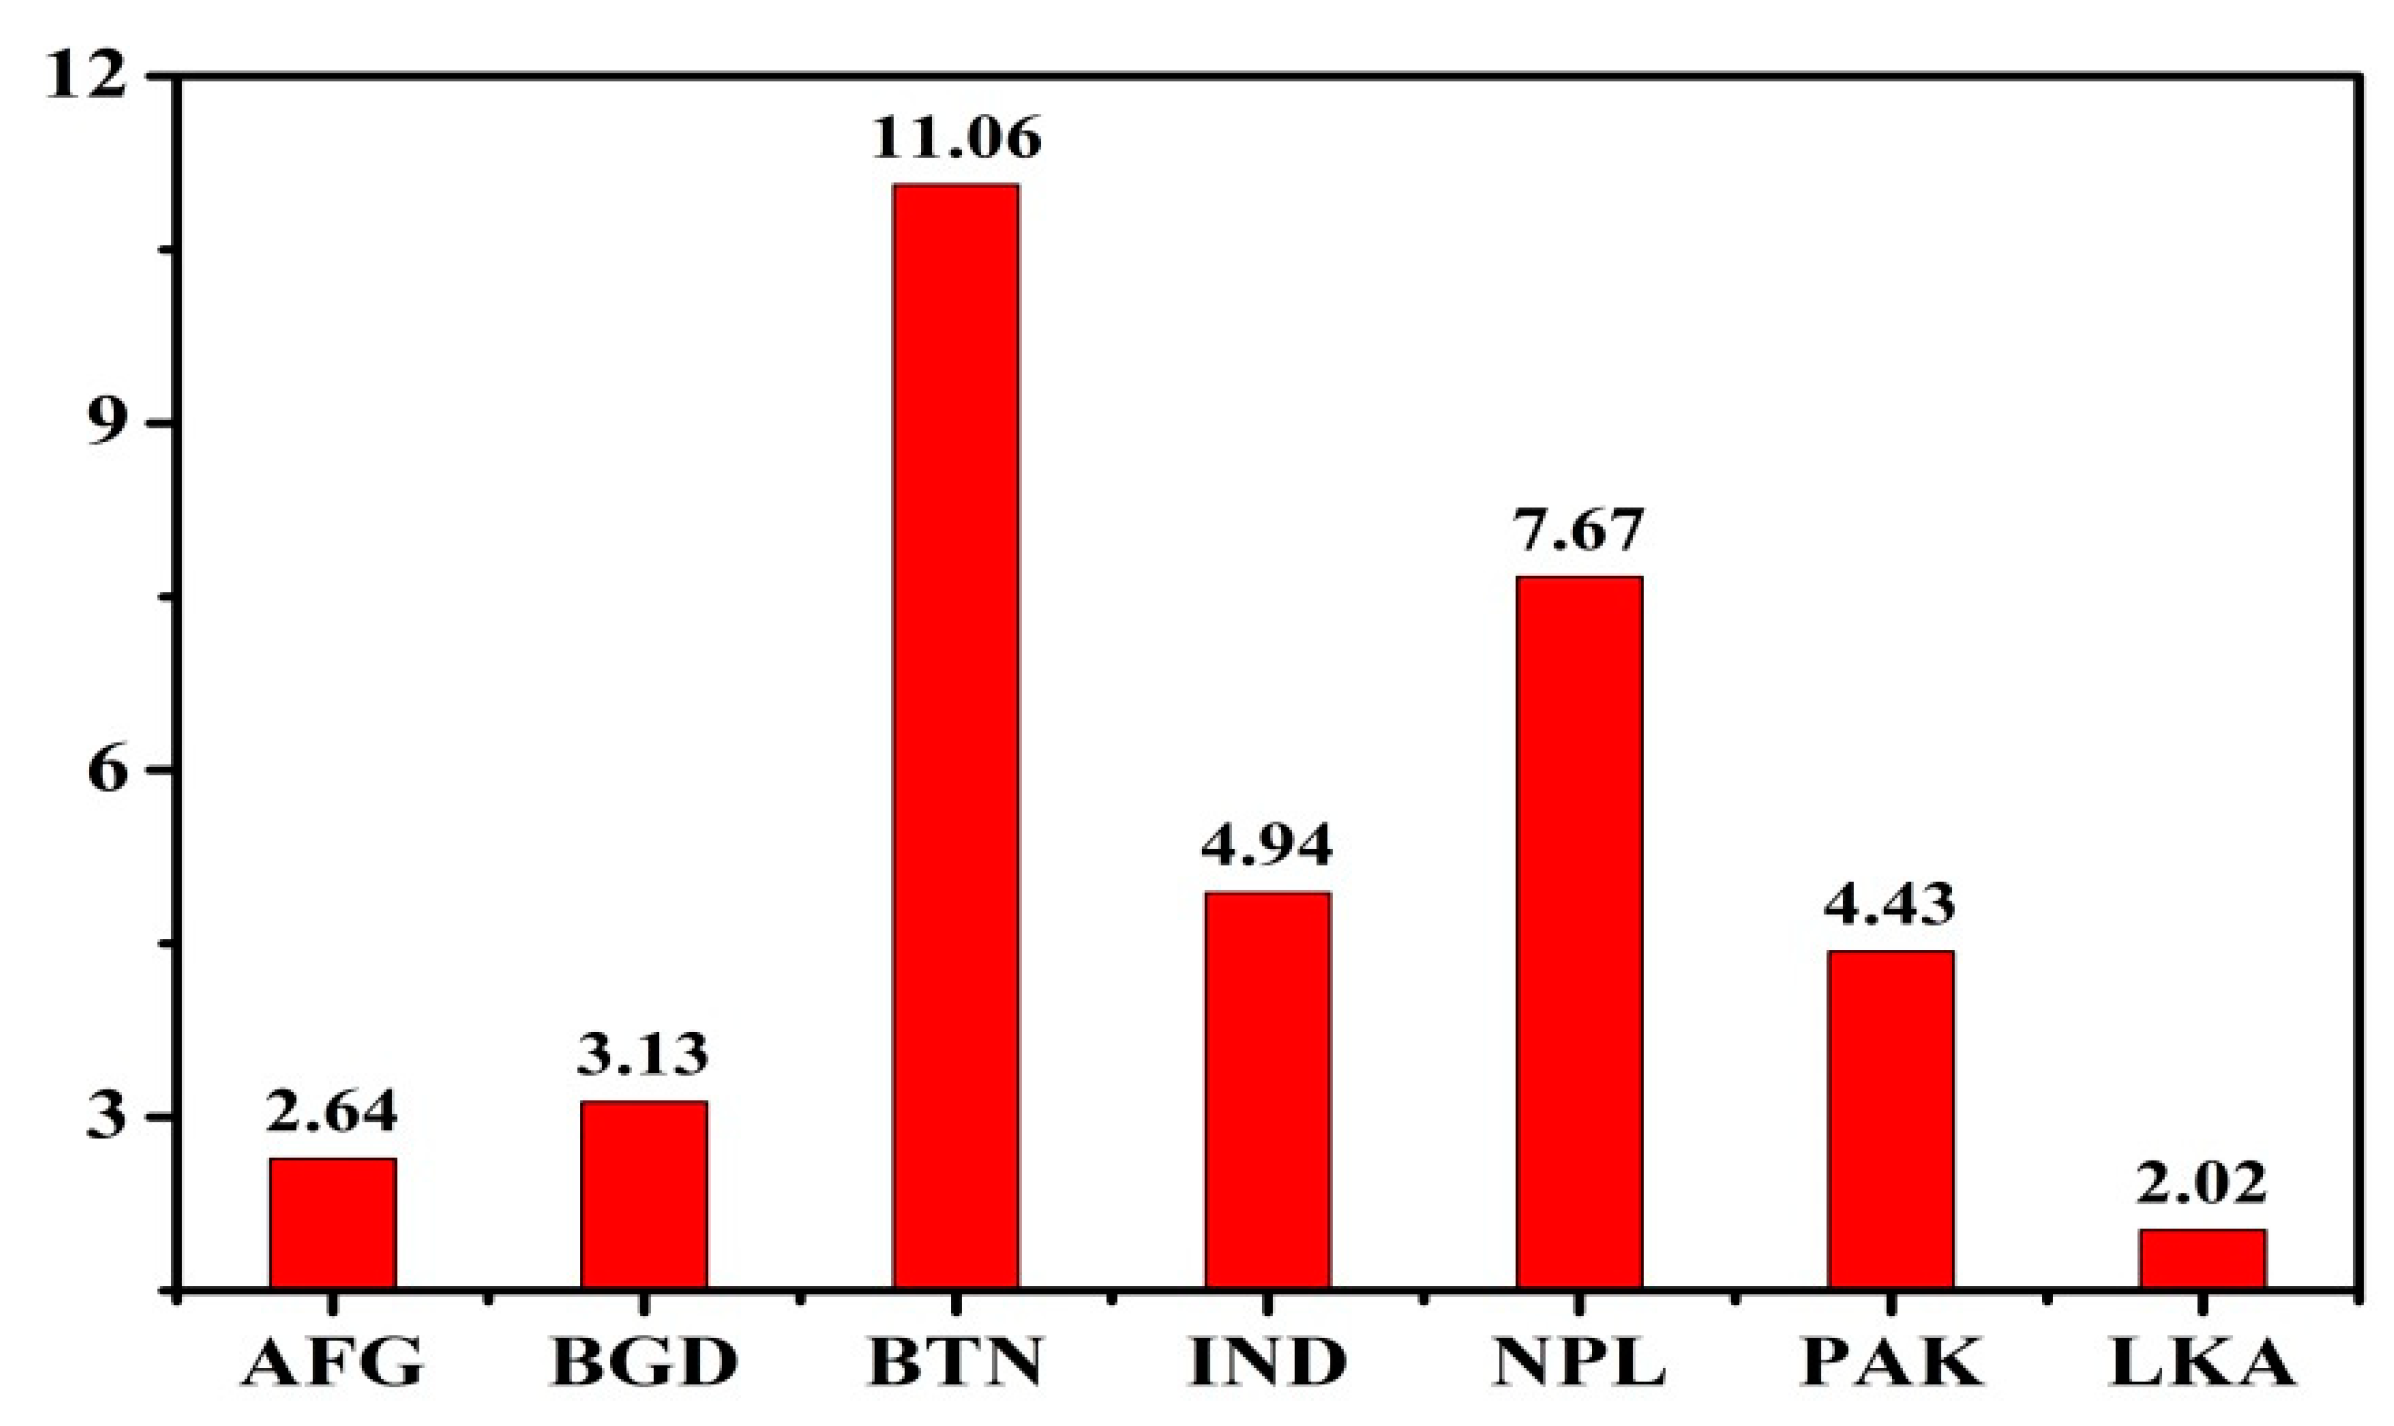
Figure 3 presents the energy intensity scores of all selected countries. Bhutan has the highest energy intensity score with an average score of 11.06 among seven countries, while Sri Lanka has the lowest score of 2.02. After Bhutan, Nepal and India contain energy intensity scores of 7.67 and 4.94 respectively. Energy intensity indicates the energy inefficiency of an economy and is measured as energy use per unit of GDP. Low energy intensity score shows lower price or energy converting cost into GDP. It is mutually agreed that an increase in renewable energy production will result in a reduction in CO
2 emission level.
The renewable energy scores for selected countries are presented in
Figure 4. It can be seen that Bhutan and Nepal have the highest score of 86.66 and 84.37 respectively, while Afghanistan has the lowest score of 16.74. Although, other countries like Sri Lanka and Pakistan also show an improved situation with respect to renewable energy with scores of 57.58 and 42.21 respectively. The above-mentioned renewable energy score includes hydropower which is also considered as a conventional power source in the region. India relies mainly on a fossil fuel economy and is facing energy efficiency pressure due to its high energy consumption rate.
Figure 5 presents the carbon emission index per unit of energy consumption (COCON), carbon emission index (COIND) and per capita carbon emission (COCAP) score of all selected countries. It can be seen that India has the highest carbon emission index per unit of energy consumption score with 2.71 and Nepal shows the lowest score of 0.69 among all the selected countries. Also, it is fascinating that these countries rely on external suppliers with increased carbon emissions trends, which is opposite to the primary energy self-sufficiency score.
Interestingly, the carbon emission index per unit of energy consumption in Afghanistan is as low as 0.88. We also consider carbon emissions indices and carbon emissions per unit of GDP, as the main disadvantage of assessing carbon emissions is that it does not consider CO2 emissions per unit of energy consumption. For instance, India is a large CO2 emitter country in the south Asia region, and at the same time, India is the most populous country among all countries. Therefore, for a fair assessment, we compare the carbon emissions per unit of energy consumption. It can be seen which resources should be used to reduce CO2 emissions, energy imports, and to increase energy self-sufficiency. However, the decline in carbon intensity is not sufficient to offset the increase in carbon emissions associated with energy consumption and fossil fuel production. The reduction in carbon intensity is due to the shift from fossil fuels to renewable energy.
Larger carbon dioxide emitter economies not only damage the current situation but also cause environmental problems because carbon dioxide accumulates in the atmosphere depending on the residence time. Residence time is defined as the time required to separate the emitted carbon from the atmosphere due to the natural processes of the Earth’s carbon cycle. Due to the rapid cycle process it is sometimes necessary to remove carbon dioxide in less than five years, but sometimes it takes hundreds to thousands of years. For example, even with land vegetation, soil and circulation into the deep sea, if we stop the formation of carbon dioxide emissions today, it would still take many hundred years to disappear from the atmosphere.
Figure 5 also shows that India has higher per capita carbon emission with a score of 1.73, while Afghanistan has the lowest score containing 0.30. In the case of carbon emission index, India has a higher score with 1.05, while Afghanistan has the lowest score of 0.15, which is also due to higher energy consumption per capita which India holds 637.43 while Afghanistan has this core 230.00 which is the lowest score among all countries as presented in
Figure 6. The energy imports show the dependency on external suppliers of energy in order to fulfill the national energy demand. Higher scores indicate a higher reliance on external suppliers, while lower scores indicate lower dependence on external suppliers. Similarly, low levels of energy self-sufficiency score lead to higher dependence on external energy sources. Our study result indicates that the energy imports and energy self-sufficiency scores are inversely proportional to each other. Our approach is close to [
55] because they used almost similar indicators to evaluate climate change protection and energy efficiency, but they used same weights for each indicator, whereas we used DEA like a composite index to combine the proposed indicators.
South Asia is facing significant challenges related to energy efficiency, climate change and environmental performance. In the past two decades per capita CO
2 emissions in South Asia have more than tripled which makes the region cities as a world’s most polluted. Unfortunately, most of these energy sources of South Asia include imported fossil fuels. They are heavily dependent on imported oil, and it is necessary to develop policies to mitigate the effects of carbon emissions in the region. Therefore, the adoption of renewable energy has become a higher priority for achieving energy efficiency and environmental performance goals. Finally, South Asia must also address energy efficiency and environmental performance related issues. The World Energy Outlook [
56] report forecasts that global energy production will promote CO
2 emissions, which will increase by 35.6 billion metric tons by 2020 and further increase by 7.5% to 43.3 MMT (billion metric tons) by 2040. Further, OECD and non-OECD countries will emit 13.8 MMT and 29.4 MMT respectively in 2040.
It is mutually agreed that energy consumption, production, transmission and distribution put pressure on the environment at the regional, national and international levels. These environmental impacts depend on how and by which means energy is being generated and how much energy is consumed by the country. Different scholars use different environmental indicators, such as ordinary air pollution and the ecological impacts of climate change [
56].
A comprehensive composite index is evaluated by each sub-indicator. The analysis carried out until now is based on the aggregate CI. However, to understand the relative positions of countries it is crucial to analyze the selected indicators in the overall CI. The Values of individual indicators (in
Table 2) has been measured by using the set of indicators discussed in
Section 3 and then all these indicators have been combined by using measurable composite indicators, as in Equation (11), to build a final score (
Table 3) for each country. The energy efficiency and environmental performance index (EEEPI) scores obtained by each country from 2001 to 2015 are shown in
Table 3. The trend reveals interesting results for each country. It can be seen that Nepal retains highest EEEPI score in the region. The EEEPI score of Nepal increased from 0.59 in 2001 to 0.78 in 2015 and remained stable most of the time. While EEEPI score of India gradually decreased from 0.52 in 2001 to 0.36 in 2015 with consistent variations. Bhutan shows increasing trend from 0.48 in 2001 to 0.74 in 2015. Sri Lanka’s score grew tremendously from 0.49 in 2001 to 0.71 in 2008 than gradually decreased. In the cases of Pakistan, Bangladesh and Afghanistan, we find mix trends.
Table 4 presents countries ranking according to the overall composite Index score. It can be seen that Bhutan is ranked No. 1 with an average score of 0.65 among all selected countries. The maximum and minimum composite index score of Bhutan during the period of question is 0.79 and 0.49 respectively. Whereas, India is ranked No. 7 with an average composite index score of 0.39. Nepal holds the second position while Afghanistan is ranked No. 3 among these countries because Nepal and Afghanistan have lower carbon emissions and lower energy consumption. Also, Nepal and Afghanistan populations are much smaller than India, which makes these countries a better performer than India in terms of carbon emission. India has planned to reduce emissions intensity of GDP by 33–35% by 2030 and a 40% reduction in power installed capacity from non-fossil fuel sources. They have the plan to install 175 GW of renewable energy before 2022 [
57].
Bangladesh is ranked No. 4 with an average composite Index score of 0.48, its maximum and minimum score is 0.72 and 0.29 respectively. Due to the high carbon emission rate, this indicates that the environmental performance index score is not good. After that Sri Lanka is ranked at No.5 in this group with an average score of 0.52 and its maximum score 0.71 while its minimum score is 0.36. Pakistan is at second last number in the environmental performance index score and ranked No.6 among all countries in terms of energy efficiency and environmental performance. Pakistan import a significant portion of their crude oil from Saudi Arabia, which has become unstable due to the politically vulnerable situation in the region.
Saudi Arabia is a fossil-fuel economy that is facing energy efficiency pressures due to its high rate of energy consumption. Saudi Arabia is undergoing energy reforms to appropriately address its energy efficiency threats. Saudi Arabia announced its first round of energy reforms in December 2015, including raising gasoline prices with the goal of reducing subsidy costs and improving energy efficiency. Fossil fuel subsidies are about
$62 billion, of which 75% are for oil. It is expected that after energy reforms, reducing subsidies will reduce energy costs by 12%. Renewable energy reduces the climate vulnerability and environmental deterioration [
58,
59].
Policymakers should consider the emphasis on improving their resilience to the energy situation, to respond to the natural disasters and weather events, which in turn will improve energy equity. None of the countries demonstrate energy efficiency or an energy equity situation, and further, they do not play a leading role with regard to environmental performance, which also seems to be weak. However, Bhutan is ranked first amongst all cluster of economies. Thus, there is a need to ensure independent energy demand and supply, stable energy prices, subsidies to replace renewable energy and to establish a mechanism to restrict markets competition. These countries face major problems ensuring energy supply after the steady decline of domestic fossil fuels. Even though India has a balanced energy efficiency score, but it has a lower score in environmental performance.
Table 5 shows the correlation coefficients in order to provide the justification of the inclusion of the individual indicators into composite indicator. Also, energy efficiency and environmental performance with a particular focus on low carbon emissions can improve energy efficiency and environmental performance. The increase in consumption has also led to a 4% increase in emissions [
60]. Our approach is similar in the case of indicator selection but differs in terms of the aggregation method. For instance, they combined different indicators into different groups and then evaluated the performance of those groups, whereas we used a mathematical composite indicator for aggregation and ranking purpose. Hertzberg results support our view because we claim that climate change is more vulnerable to greenhouse gas emissions and therefore requires the transformation of existing energy structures into non-fossil fuels [
61].
6. Conclusions and Policy Implication
We have constructed the framework of an indicator system and developed a composite index of energy efficiency and environmental performance which combines various aspects of an indicator (energy, economic and environment) transparently and systematically by using a DEA-like mathematical composite indicator. Results reveal that energy self-sufficiency scores vary from 12.90 to 100.6. Afghanistan has the lowest score of 12.90 and Bhutan has the highest score of 100.6. Pakistan, India, and Bangladesh demonstrate energy self-sufficiency scores above 0.50 and show a comparatively better situation with respect to their energy supply from domestic energy sources. Furthermore, Bhutan has the highest energy intensity with an average score of 11.06 while Sri Lanka has a lower energy intensity score of 2.02. After Bhutan, Nepal and India achieve energy intensity scores of 7.67 and 4.94, respectively. Interestingly, India has a higher carbon emission index with 1.05 while Afghanistan has the lowest score of 0.15 which is also due to a higher energy consumption per capita, in which India scores 637.43 while Afghanistan scores 230.00, which is the lowest score among all selected countries. The general findings of the study show that the relative performance of the countries can be compared with each other on the basis of the score generated from the composite index. Based on the overall ranking of energy efficiency and environmental performance index score, Bhutan ranked first with an average score of 0.65, followed by Nepal with an average score of 0.62 while India has a higher emission trend because India is a higher carbon emitter country in the region. The energy efficiency and an environmental performance scores of Sri Lanka and Bangladesh demonstrate a smooth change, whereas, India has a mixed trend of increasing and decreasing within the given time frame.
There are considerable differences in the performance of the economies. For instance, it is better for countries to compare emission rates with energy consumption instead of energy production.
Finally, we propose a policy to improve energy efficiency and environmental performance as follows.
Currently, several organizations and institutions are working to encourage regional cooperation concerning energy efficiency in order to strength socio-economic development in South Asia. These institutions and organizations fall under classes of academic, non-government, private organizations, associations, groupings of countries including legislative bodies and representatives of governments. These organizations, institutions and academic associations are working for the general economic development of these countries by mutual consensus, but they have nominal resources, and they should focus on the issues of clean and green energy, especially when they meet at international and regional forums with multiple agenda. Even though these forums are useful for inspiring the common interest of regional countries in order to ensure energy efficiency in the region, unfortunately such meetings and agendas lack the proper discussion with respect to energy efficiency.
The members of the South Asian Association for Regional Cooperation (SAARC) countries should take necessary actions for the official approval of energy efficiency and be required to construct a regional energy efficiency plan in the context of the demand situation, growth situation and available energy resources. SAARC and SAFIR (South Asia Forum for Infrastructure Regulation) are facilitating discussions and debates on energy efficiency in the region. Regional countries are using the platform of SAARC to discuss current issues, at least regarding energy infrastructure. It opens and invites the political will and offering great chances of opportunity to develop a common strategy for increasing energy efficiency. However, the real progress or plans of these organizations remain not enough to address the energy efficiency problem and these plans are not well equipped to ensure reliable energy efficiency in the region. This constructed regional energy efficiency plan should focus on the mechanism of joint development with the aim of investment in an energy efficiency plan, resource expansion, and other energy infrastructure.
Even though there is a high demand and supply gap in the current energy scenario in this region there remains an excellent potential for a power exchange mechanism due to changing seasonal factors, varying load factors and different peak hours in the regional countries. These types of planning and steps would result in reduced transmission line losses, less demand for investment, better reserve margins and an increased reliability of supply.
Historically, due to the vast number of economic activities in oil producing countries, global oil prices have experienced volatile fluctuations. On the other hand, global energy resources mainly depend upon crude oil from this region. Countries which consume large amounts of oil should develop a renewable corridor and call for foreign direct investment in the renewable sector from developed countries. Further, developing countries should ensure law and order to safeguard foreign investment in order to increase energy efficiency and environmental performance, which directly affects energy efficiency. The regional economic community can improve peace, regional integration, economic growth and energy efficiency, factors which would contribute significantly to enhancing energy efficiency in the region. Similar and identical green tax reforms should develop in the region to enhance economic injection in order to increase energy efficiency. Economic policy cooperation should reduce environmental challenges in the region.
The case study of South Asia is based on some shared data sets at the macro level. Further, future research can be conducted by applying the proposed models to more industry-based and lower level energy and environmental issues, such as the comparison of the environmental performance of different organizations in the same industry.
The DEA is a linear programming tool which measures the relations between multiple outputs and multiple inputs associated to the DMUs under consideration. The DEA-like composite is a geometric aggregation characterized by the weighted product (WP) method which evades the subjective weight allocation to aggregate the underlying indicators. Its limitation includes a misleading policy recommendation if its CIs have been poorly constructed. This kind of research required significant efforts to be made for data collection, but it may produce useful and impressive results. The applicability of this method should be measured against the constituencies affected by the composite index.

 ,
, 


