1. Introduction
The introduction and application of risk theory in power systems has always been a pertinent research topic [
1,
2,
3], which is an important part of risk theory in risk rating. In the traditional Risk Rating Model (RRM) of the power system, which gives the product of probability and severity, the rating criteria are generally based on the size of the risk value. However, the traditional risk rating methods has the following problems:
- (1)
In the actual risk maintenance of the power grid, in addition to paying attention to the risk of failure with high risk values, this method is concerned about the risk of failure from the low risk of “High Loss Severity (HLS) with low probability” and the low risk of “High Failure Probability (HFP) with low loss severity”. The latter two kinds of fault risks are classified as low risk in the traditional risk rating method, resulting in the development of the “Hidden Phenomenon (HP)”, which is then ignored.
- (2)
As a result of the risk rating of the power system, the power grid needs to arrange the risk maintenance resources to address areas with a high level of fault risk. The traditional risk rating method does not consider the risk maintenance resources, that is, the reserved risk maintenance resources are considered unlimited. However, in the actual power grid, the risk maintenance resources are limited, so the risk rating method of the power system needs to consider the risk maintenance resource constraints. So, the traditional RRM does not represent the actual risk maintenance resources of the power grid.
Some scholars and experts have conducted research in this area, such as the development of risk assessment models and calculation methods [
4,
5], the construction and improvement of risk assessment index systems [
6,
7,
8,
9], risk-based control decision-making [
10,
11,
12,
13], and risk control system construction and engineering applications [
14,
15,
16,
17,
18]. Studies in the literature [
19] have used feature analysis and data clustering methods to realize data prediction in operational risk assessment on the basis of transmission absorption road running data and large data mining. Previous studies [
20,
21] have also made risk assessment decisions based on prior statistics of the automatic service dimension risk assessment of transmission lines. Another study [
22] summarized research results related to the network operation risk and pointed out the characteristics and requirements of risk rating in engineering practice. With the development of engineering applications, some defects in the risk rating system have gradually been revealed, and these have mainly manifested in the non-recognition of high severity, low risk events and high probability, low risk events. Previous studies [
23,
24,
25] have established a risk rating system for transmission lines. However, due to the fact that the costs of risk maintenance resources are not considered in the actual application, these results are not mature enough for the application of the system.
In response to the above problems, this paper proposes “The Risk Rating Method for Considering the Severity and Probability and Risk Value of the Node Disconnection of the Power system”. This article makes the following contributions:
- (1)
This paper proposes the Risk Maintenance Resource Cost Model (RMRCM). The RMRCM is an integral part of the Risk Rating Model (RRM).
- (2)
The Risk Rating Model (RRM) presented in this paper can identify fault risks with high risk values, fault risks with high loss severity, and fault risks with high fault probability. It can also realize the network’s concern about the type of failure risk.
- (3)
A Risk Rating Model (RRM) for power systems that considers the constraints of reserved risk maintenance resources is proposed. The RRM makes full use of limited reserved risk maintenance resources and combines the severity probability and risk value ranking. The risk rating results produced with this model are thus more meaningful.
The rest of this paper is organized as follows: in
Section 2, we introduce the Risk Maintenance Resource Cost Model (RMRCM). In
Section 3, we discuss the risk rating method which considers the severity probability and risk value ranking (SPRV). In
Section 4, we discuss the risk rating method which considers the constraints of reserved risk maintenance resources (RMRC) and SPRV. In
Section 5, we detail the risk rating assessment process. In
Section 6, we introduce the case study results. Finally, in
Section 7, we present our conclusions and future work.
2. Risk Maintenance Resource Cost Method
In this area, we propose the RMRCM. The RMRCM is an integral part of the RRM. The research object of this paper is the disconnection of nodes from the system due to a fault in the transmission line. Other situations are beyond the scope of this paper, such as generator and bus failures, load and bus failures, and bus failures.
The power system node connection diagram is shown in
Figure 1. The node diagram shows that a node-oriented risk maintenance cost model can be established as follows: the risk maintenance resource costs
CRMRC,i of the disconnection of node
i in the power system include the sum of the
ith nodal connection transmission line equipment risk maintenance resource costs,
CERMRC,I and the cost of the
ith node disconnection risk maintenance resulting in power outage,
CRMPOC,i. The specific model is as follows:
where
pj is the probability of failure in the
jth transmission line;
cj is the risk maintenance resource cost per km of the
jth transmission line;
lj is the length of the
jth transmission line;
Cj is the transmission capacity of the
jth transmission line;
Tj is the breakdown time of the
jth transmission line;
e0 is the electricity unit price;
Wi is the
ith node disconnection power outage of the power system impact weight,
PGi is the
ith node’s access generator capacity,
PLi is the
ith node’s load capacity;
n is the number of the transmission line connections to the
ith node; and
m is the number of the power system.
3. Node Disconnection Risk Rating Method (NDRRM) Considering the Severity Probability Risk Value (SPRV)
3.1. Node Disconnection Severity (NDS)
In this paper, the load loss after node disconnection is used to characterize the node disconnection severity (NDS). Since this paper does not consider the failure of the generator access node, the node disconnection severity adopts the generalized load, that is, the generalized load is equal to the difference between the node access generator capacity and the node access load capacity. The specific model is as follows:
where
SNDS,i is the disconnection severity of the
ith node;
PGi is the access generator capacity of the
ith node; and
PLi is the access load capacity of the
ith node.
The node disconnection severity matrix is:
3.2. Node Disconnection Probability (NDP)
The node disconnection probability (NDP) is related to the connections between transmission lines and bus nodes in the power system. The node disconnection probability (NDP) is characterized by association matrix A and device fault probability R. The specific model is expressed as follows:
The association matrix
A is:
where
where
m is the matrix line number and also the number of nodes;
n is the matrix column number and also the number of branches.
The device fault probability
P is:
where
ri is the
ith transmission line device fault probability.
The probability of node disconnection is:
The node disconnection probability matrix is:
3.3. Node Disconnection Risk Valuation (NDRV)
Node disconnection risk valuation (NDRV) uses the traditional risk assessment model. The traditional model is as follows:
where
RNDRV,i is the disconnection risk valuation of the
ith node;
PrNDP,i is the disconnection probability of the
ith node; and
SNDS,i is the disconnection severity of the
ith node.
The node disconnection risk valuation matrix is:
3.4. NDRRM Consideration of the Severity Probability Risk Value (SPRV)
In order to reflect the high risk value events in addition to the low risk value events, it is also necessary to reflect the high severity low risk events and high probability low risk events. This paper proposes a “Node Disconnection Risk Rating Method that comprehensively considers the severity probability risk value”. The NDRRM which considers SPRV can identify fault risks with high risk values, fault risks with high loss severity, and fault risks with high fault probability. It can also determine the network’s concern about the type of failure risk. The specific evolution process is described below.
To determine the node disconnection risk rating based on the severity of node disconnection, the elements in the Node Disconnection Severity matrix are sorted from large to small.
To determine the node disconnection risk rating based on the probability of a node disconnecting, the elements in the Node Disconnection Probability matrix are sorted from large to small.
To determine the node disconnection risk rating based on the node risk valuation of disconnection, the elements in the Node Disconnection Risk Valuation matrix are sorted from large to small.
The risk rating method of this paper is obtained by combining the above three ranking criteria. The NDRRM is as follows:
where
LevelNDRRM,i is the
ith level of the node disconnection risk rating method and also an element of the NDRRM. The
ith level of node disconnection risk rating method includes three nodes. One node
j is selected according to severity, one node
k is selected according to probability, and one node
t is selected according to risk valuation.
The node disconnection risk rating criterion is:
that is,
In order to prevent a node from having a repeated risk rating and causing a waste of risk maintenance resources, the following constraints are added to the node disconnect risk rating criterion:
4. Node Disconnection Risk Rating Method (NDRRM) Consideration of SPRV and RMRC
The Node Disconnection Risk Rating Model (NDRRM) that considers SPRV and the reserved risk maintenance resources (RMRC) is proposed in this area. The model makes full use of limited reserved risk maintenance resources and combines severity probability and risk value rankings. The Risk Rating results have greater guiding value. The specific evolution process is described below.
Suppose the power system reserves
nL levels of reserved risk maintenance resources, as shown in
Table 1 below:
As shown in Formula (25), the objective function is the maximum sum of the risk maintenance resource costs of the corresponding nodes of the
ith level risk rating. The corresponding nodes include the node that represents severity, the node that represents probability, and the node that represents risk valuation. Formula (26) in the objection is the output of the risk rating result. The equation constraint is the risk maintenance resource costs (RMRC) of node disconnection, which come from the RMRCM presented in
Section 2, including Formulas (27)–(29). Formula (27) is the RMRC of node
j which represents the severity; if Formula (27) is equal to 0, then Formula (26) does not contain node
j. Formula (28) is the RMRC of node
k which represents probability; if Formula (28) is equal to 0, then Formula (26) does not contain node
k. Formula (29) is the RMRC of node
t which represents risk valuation; if Formula (29) is equal to 0, then Formula (26) does not contain the node that represents risk valuation. The inequality constraint generally comprises the constraint of reserved risk maintenance resources (RRMR) and the upper and lower constraints of node disconnection risk rating (NDRM), as shown in Formulas (30)–(32). Formula (30) is the RRMR constraint, that is, the RMRC of the
ith level NDRRM must be less than or equal to the RRMR of the
ith level NDRRM. Formula (31) and Formula (32) are the upper and lower constraints of NDRM; the values of lower level severity, probability, and risk must be less than or equal to the upper levels.
The inequality constraint also includes inequality constraint formula, which are equivalent to Formulas (22)–(24).
5. The Process of Risk Rating
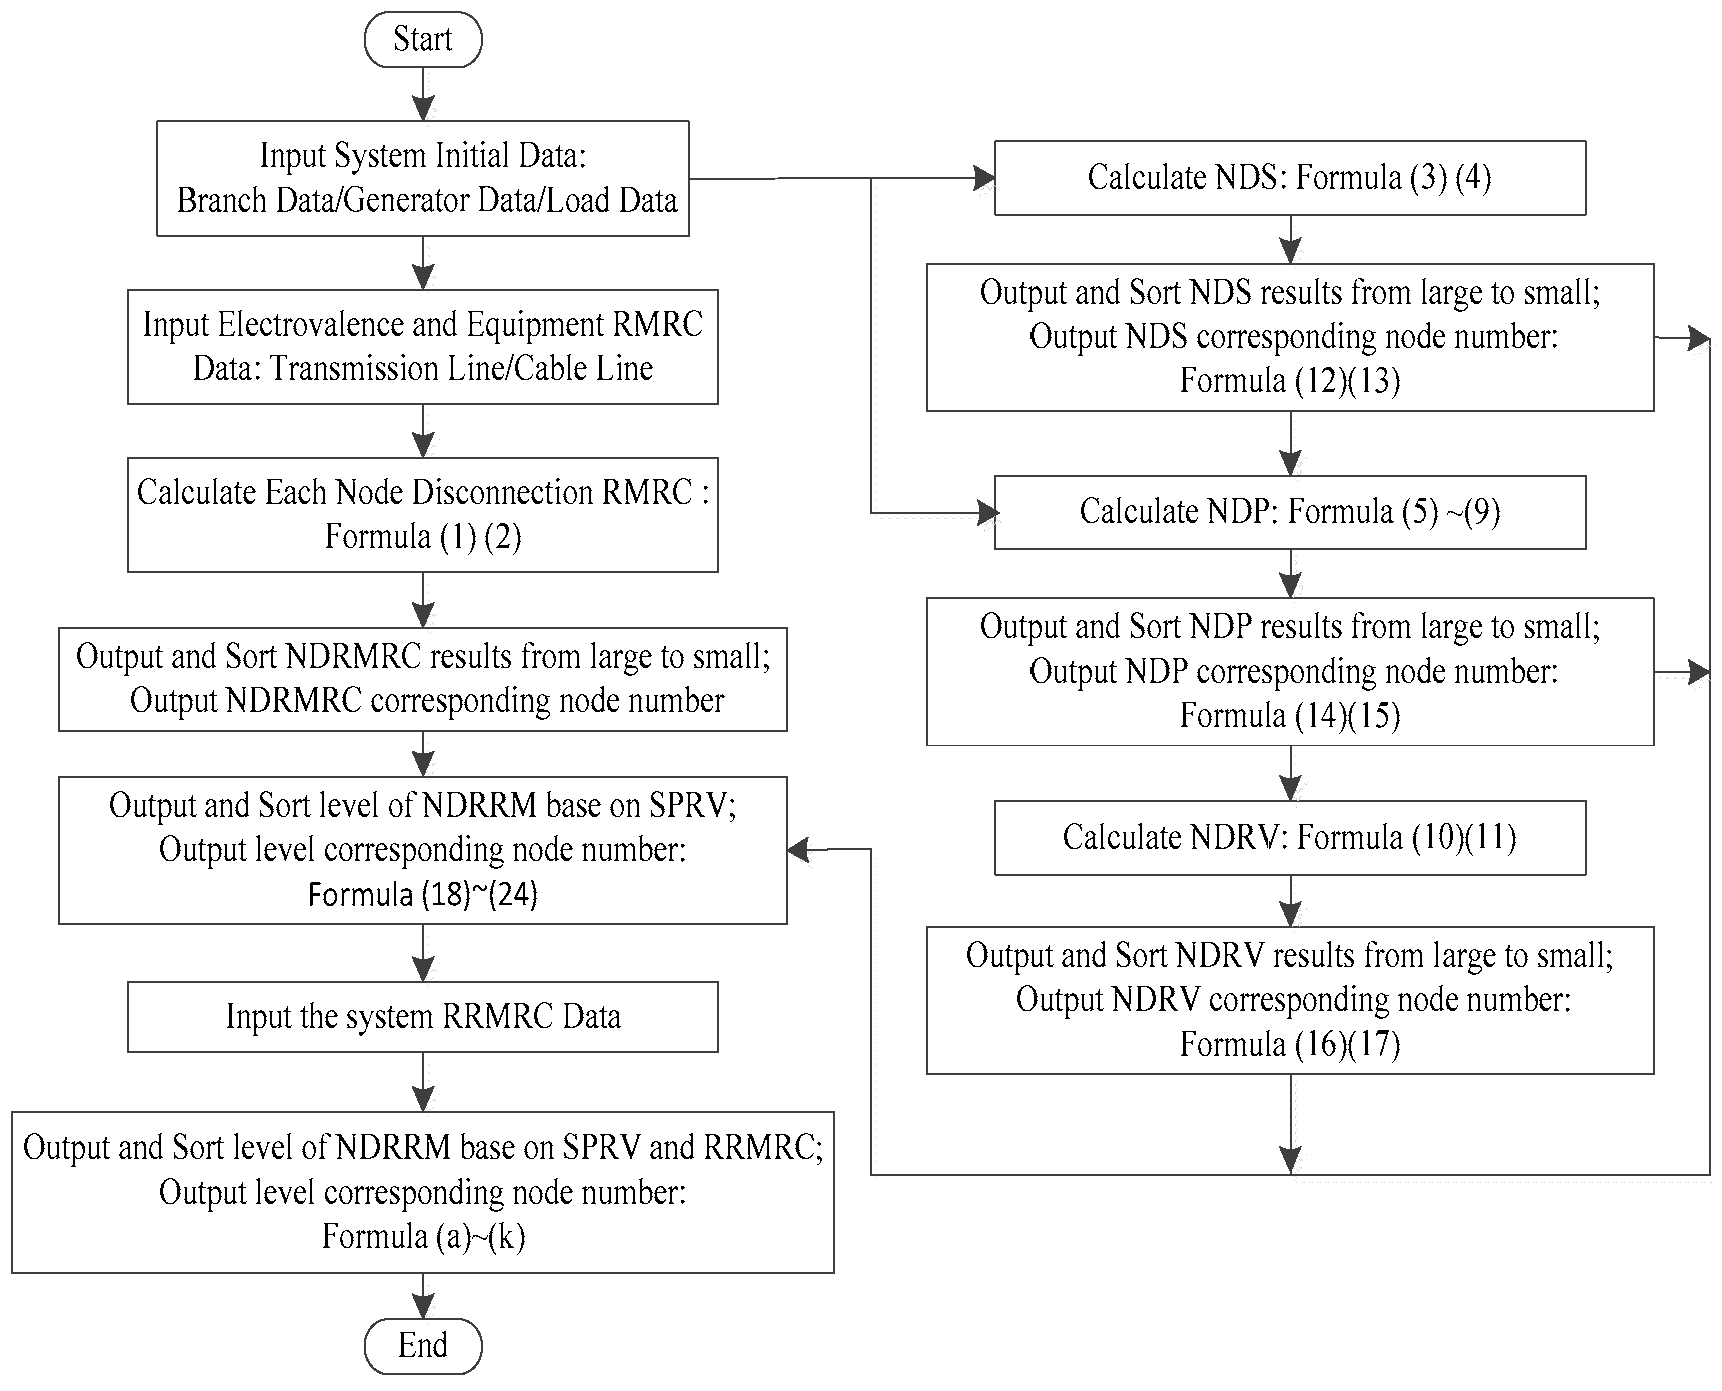
According to the node disconnection risk rating method (NDRRM) presented in this paper, the process of the node disconnection risk rating method diagram is shown in
Figure 2. The following flow chart can be used to obtain the node disconnection risk rating results.
Step 1: Input initial system data, such as branch data, generator data, load data, etc.
Step 2: Input electrovalence and equipment RMRC data, such as transmission lines and cable lines.
Step 3: Calculate the RMRC valuation of each node disconnection according to Formulas (1) and (2).
Step 4: Output the NDRMRC valuation and the corresponding node numbers from large to small.
Step 5: Using the data from Step 1, calculate the NDS according Formulas (3) and (4), calculate the NDP according to Formulas (5) through (9), and calculate the NDRV according to Formulas (10) and (11). Then separately output the NDS/NDP/NDRV results and corresponding node numbers from large to small according to Formulas (12) through (17). Lastly, output the NDRRM based on the SPRV result and the corresponding node numbers from large to small according to Formulas (18) through (24).
Step 6: Input the reserved risk maintenance resources data of the system.
Step 7: Output NDRRM based on the SPRV and RRMRC results and the corresponding node numbers from large to small according to Formulas (25)–(32).
6. Case Study
The IEEE RTS-79 standard system was used to verify the correctness and applicability of the proposed model. For this reason, three case studies were designed in this study. First, the basic situation of IEEE RTS-79 standard system is introduced. The system includes 24 bus nodes, 38 branches, 10 generator access nodes, and 17 load access nodes.
6.1. Case I: Validation of the RMRC
Reference is made to the transmission line and cable line risk maintenance resource costs (RMRC) of the “Standard for Electricity Power Grid and Operation Maintenance and Operation Management Costs in a Provincial Power Company”. The transmission line of the RMRC is shown in
Table 2. The cable line of the RMRC is shown in
Table 3. The electrovalence (e0) is 5.25 ¥/MWh.
The cost of risk maintenance resources for the node disconnection of the RTS-79 system is calculated based on the RMRC model presented in Formula (1) and Formula (2). The calculation results are shown in
Figure 3.
From
Figure 3, it can be seen that in the power system, the cost of risk maintenance resources is different for the 24 nodes, of which the RMRC value of node 23 is the largest and the RMRC value of node 7 is the smallest. The trend of the RMRC value in
Figure 3 decreases from left to right. Compared with the system structure diagram, the connection modes of the corresponding nodes, from left to right, go from complex to simple, but the connection complexity is not a one-to-one correspondence. The generalized load of the corresponding node on the left is relatively large, the influence of the node on the system is relatively large, and the generalized load of the corresponding node on the right is relatively small, but the generalized load of the node is not a one-to-one correspondence.
Therefore, the cost of risk maintenance resources is not only related to the system network connection structure, but is also related to the node generalized load size. The cost of risk maintenance resources is a comprehensive reflection of the node connection relationship and the connected generalized load volume, which is consistent with the actual risk maintenance.
In summary, the RMRC model represents the network topology of the node and the node risk maintenance cost value. The rationality of the RMRC model is verified. The RMRC value is very meaningful as an indicator of the risk rating, and it is reasonable to include the RMRC model as part of the risk classification model.
6.2. Case II: Validation of the NDRRM Considering SPRV
The risk rating of the 24 nodes of the RTS-79 system is determined based on the criterion of the node disconnection severity (NDS). The risk rating results are shown in
Figure 4.
Figure 4 shows that the node disconnection severity (NDS) value decreases from left to right, the corresponding node is disconnected, and the generalized load loss of the system goes from large to small. In this power system, the node at the first risk rating level based on NDS is node 23, which has the largest NDS value. The NDS values of node 11, node 12, node 17 and node 24 are equal to 0 because these nodes have no access to the generator or load.
The risk ratings of the 24 nodes of the RTS-79 system are based on the criterion of the node disconnection probability (NDP). The risk rating results are shown in
Figure 5.
From
Figure 5, it can be seen that the node disconnection probability (NDP) value decreases from left to right; the higher the NDP is, the greater the probability that the corresponding node will be disconnected from the system. In this power system, the node at the first risk rating level based on NDP is node 7, which has the largest NDP value.
The risk ratings of the 24 nodes of the RTS-79 system are based on the criterion of the node disconnection risk valuation (NDRV). The risk rating results are shown in
Figure 6.
Figure 6 shows that, using traditional risk model to calculate the results, the node disconnection risk valuation (NDRV), decreases from left to right. In this power system, the node at the first risk rating level based on NDRV is node 22, which has the largest NDRV value. The risk valuation is also the standard used for risk rating in the traditional model.
The risk ratings of the 24 nodes of the RTS-79 system are based on three factors, severity probability risk valuation (SPRV) of node disconnection. The risk rating results are shown in
Figure 7.
In
Figure 7, the dotted red line boxes indicate the node disconnection risk rating level, the blue columns indicate the node disconnection severity (NDS) value, the red columns indicate the node disconnection probability (NDP) value, and the green column indicates the node disconnection risk valuation (NDRV).
In
Figure 7, from left to right, the risk rating goes from a high level to a low level. Each level of node rating based on SPRV includes three types of node, for example, the first level includes severity node 23, probability node 7, and risk valuation node 22. Compared with the upper and lower levels of risk rating, such as the comparison of the first and second levels of the risk rating, the severity value of node 23 in the first level is larger than that of node 21 in the second level, the probability value of node 7 in the first level is larger than that of node 6 in the second level, and the risk valuation of node 22 in the first level is larger than that of node 14 in the second level. The first level risk rating is the highest risk rating level of the RTS-79 system, and the first level node 23 is the node with the highest severity value in the system. Node 7 has the highest probability value in the system and node 22 has the largest risk evaluation in the system. This shows that the higher the risk rating level is, the higher the severity value, probability value, and risk valuation of the corresponding nodes are. Furthermore, the risk rating method proposed in this paper can identify the nodes with high severity, high probability, and high risk valuation.
In summary, according to the experimental results, node 23 has “High Loss Severity (HLS) with low probability” and, node 7 has “High Failure Probability (HFP) with low loss severity”. Using the traditional risk rating method based on the risk value as the only indicator, only node 22 with high risk value can be identified, and node 23 with “High Loss Severity (HLS) with low probability” is ignored. At the same time, node 7 with “High Failure Probability (HFP) with low loss severity” is also easy to ignore. Thus, there is a “Hidden Phenomenon (HP)”. By using the risk rating model presented in this paper, we can identify node 22 with a high risk value, node 23 with high severity, and node 7 with high probability, and thus, we can suppress the “Hidden Phenomenon (HP)” to a certain extent. The NDRRM based on SPRV has thus been proven to be reasonable and effective.
6.3. Case III: Validation of the NDRRM Considering SPRV and RMRC
On the basis of Case I, the correctness and rationality of the risk maintenance resource cost (RMRC) model, and Case II, the correctness and rationality of the risk rating model (RRM) that comprehensively considers the node disconnection severity probability and risk valuation (SPRV), and then introduces the factors that the system to reserve risk maintenance resource costs (RRMRC), the model presented in this paper is verified in Case III.
Assume that this power system requires the classification of
nL risk rating levels and the reserve risk maintenance resource costs (RRMRC) corresponding to risk rating levels. See
Table 4 below for details.
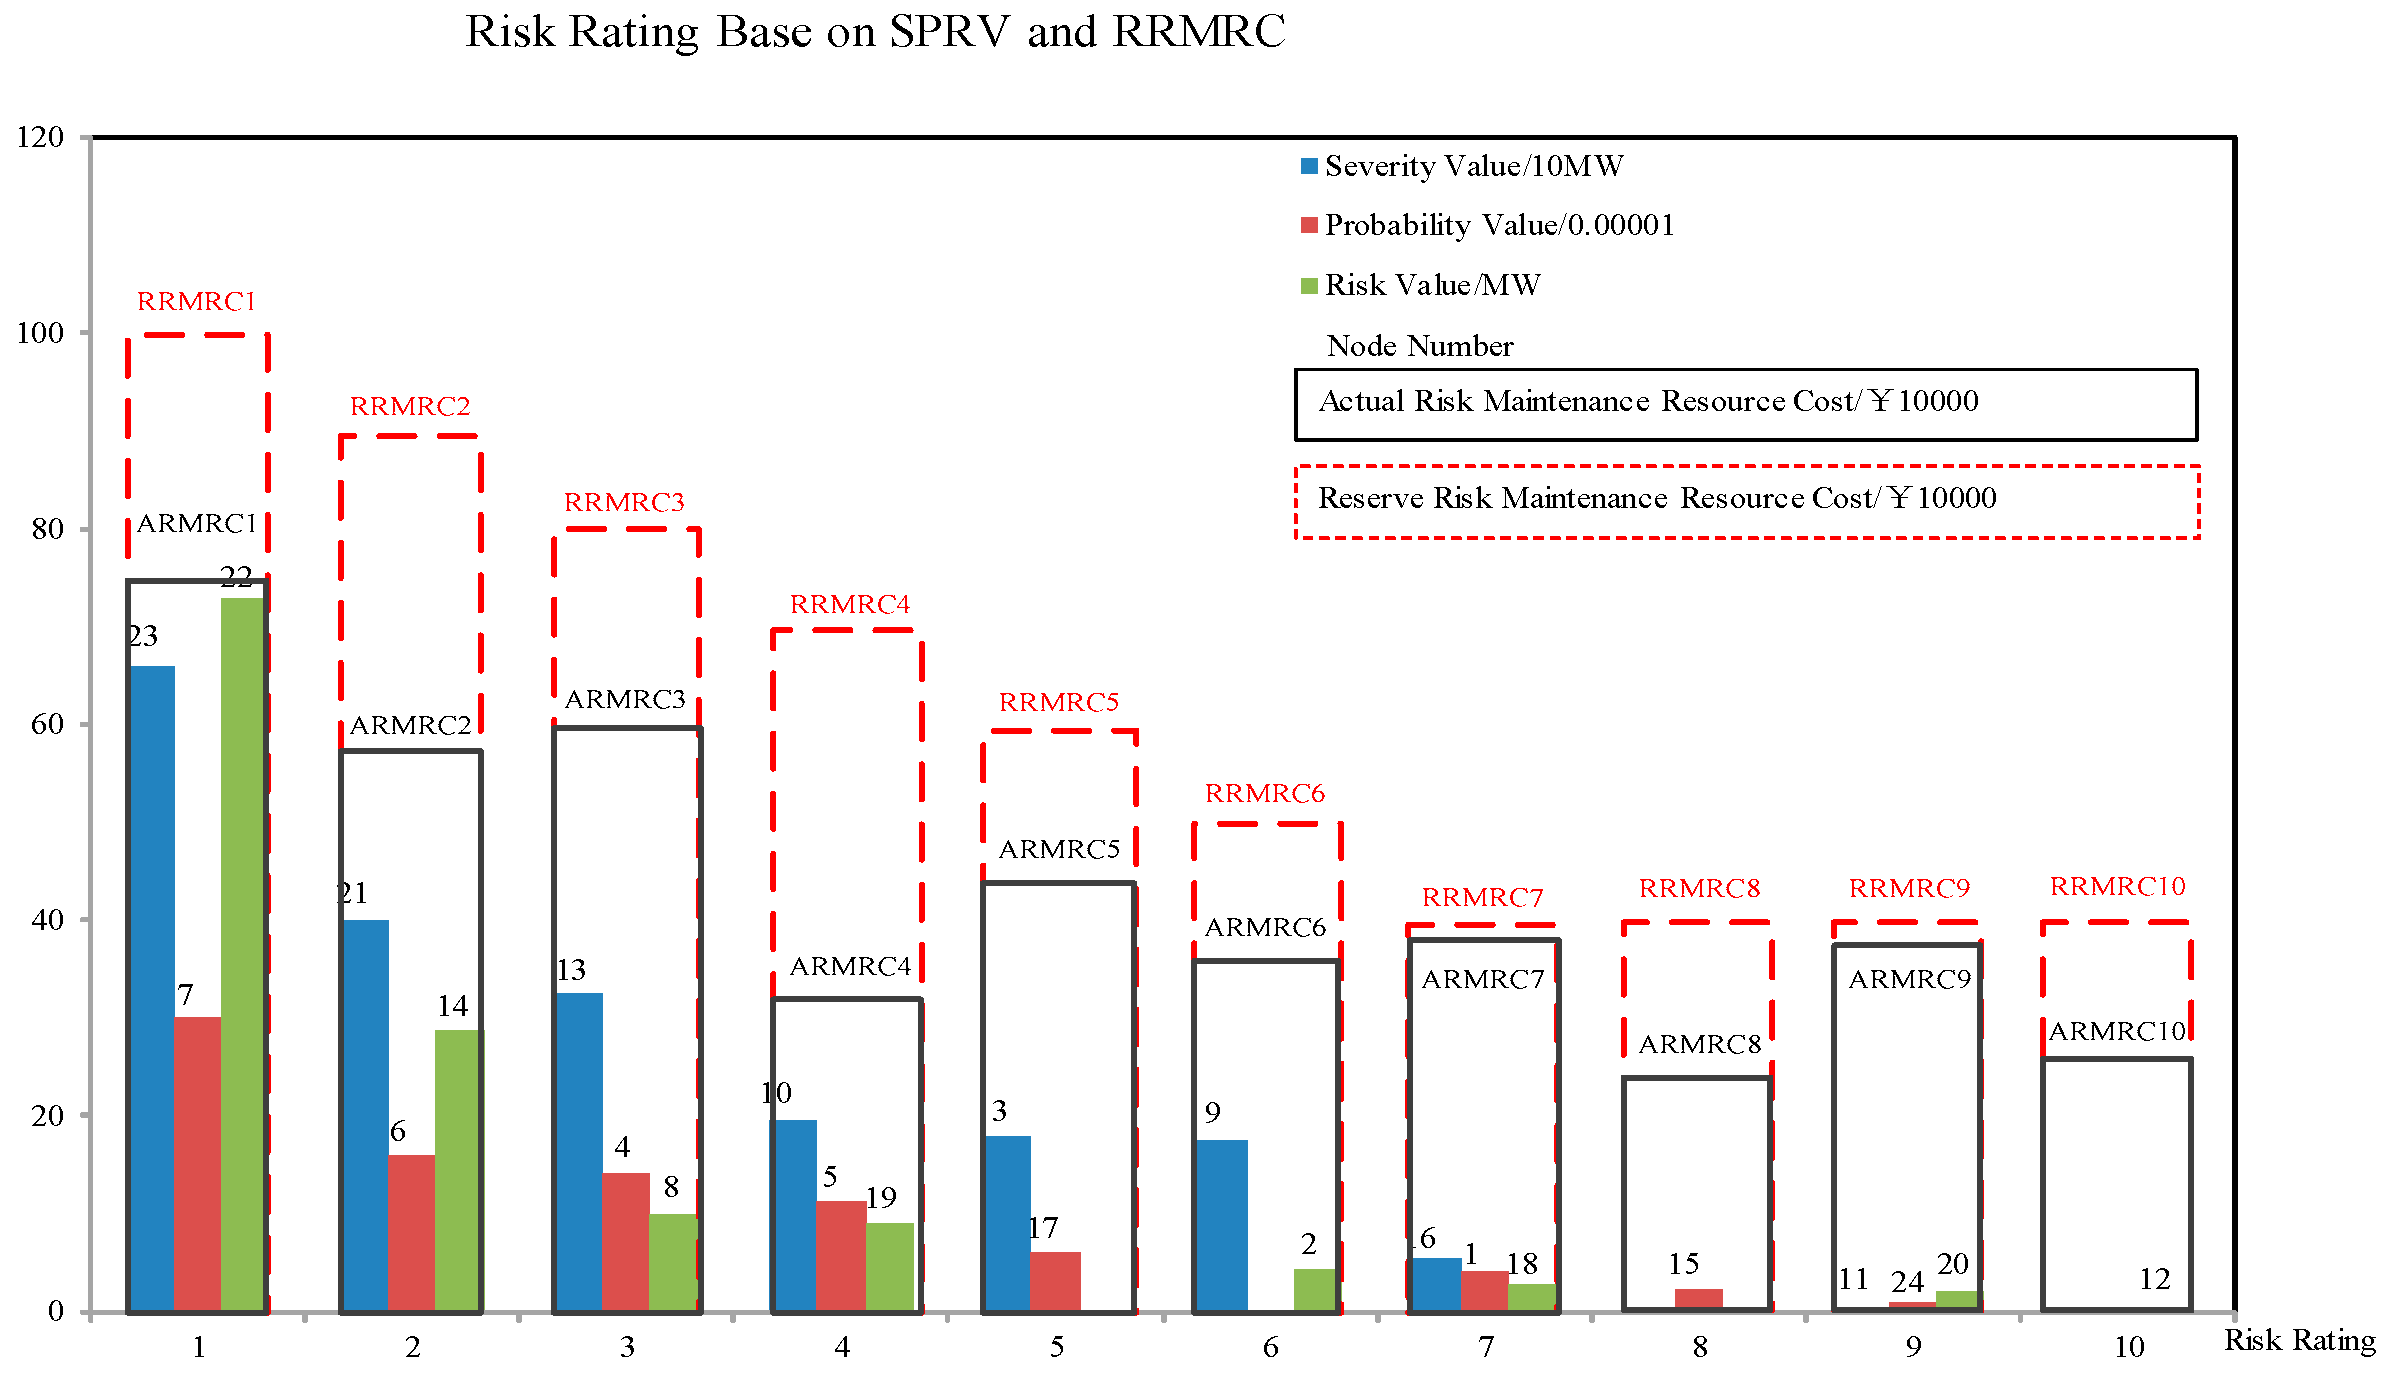
The results of the node disconnection risk rating combined with the RRMRC constraint are shown in
Figure 8.
Figure 8, the red dotted frame indicates the reserve risk maintenance resource cost (RRMRC) value in the system for each level of risk rating. The black wireframe indicates the actual risk maintenance resource cost (ARMRC) value of each risk rating level. The nodes included in the black wireframe are the nodes with a risk rating level. The actual risk maintenance resource cost value is equal to the sum of the risk maintenance resource costs of all nodes included in the risk rating level. The blue column indicates the node disconnection severity (NDS) value, the red column indicates the node disconnection probability (NDP) value, and the green column indicates the node disconnection risk valuation (NDRV).
As can be seen from the figure, in each level of risk rating, the ARMRC value is less than or equal to the RRMRC value, and the type and number of nodes included in each level is not the same. For example, levels 1–4, 7, and 9 all include three nodes. The node, include the severity nodes, the probability nodes, and the risk valuation nodes. Levels 5 and 6 include two nodes each, of which level 5 includes a representative severity node and a representative probability node, and level 6 includes a representative severity node and a representative risk valuation node. Levels 8 and 10 include one node each, where level 8 includes a probability node and level 10 includes a risk valuation node. This is due to the RRMRC constraint of each risk rating level of the system.
Compared with the traditional risk rating model, the risk rating model proposed in this section can simultaneously identify the nodes with high risk values and high severity probability, and can suppress the “Hidden Phenomenon (HP)” to a certain extent. Compared with the NDRRM considering SPRV, the NDRRM considering SPRV and RRMRC proposed in this section, which is more reasonable than the actual risk maintenance cost. At the same time, the results of this model give more guidance for risk maintenance.
In the figure, from left to right, the risk rating goes from a high level to a low level. Setting aside the constraints of risk maintenance resource costs, it is still possible to ensure that the severity, probability, and risk valuation of the senior level are greater than or equal to the lower level risk rating level. As shown in the figure, from left to right, the severity, probability, and risk valuation of the corresponding node are reduced, and the corresponding risk rating level of the nodes is not included. The NDRRM based on SPRV and RRMRC has thus been proven to be reasonable and effective.
7. Conclusions
In this paper, a node disconnection risk rating method (NDRRM) is proposed that considers the severity probability risk valuation (SPRV) and reserve risk maintenance resource costs (RRMRC). The risk maintenance resource cost model includes the costs of the nodal connection transmission line equipment risk maintenance resources and the node disconnection risk maintenance resulting in power outage, which reflects the cost of each disconnected node. The risk rating method based on SPRV developed from the traditional risk valuation method can simultaneously identify the node with the highest severity value, the node with the highest probability of failure, and the node with the largest risk valuation. On the basis of the above model, we considered the cost constraints of the reserve risk maintenance resource costs, and put forward a risk rating method based on SPRV and RRMRC. The risk rating results of this model is more suitable for guiding risk maintenance in practice. Simulations were carried out on the modified IEEE RTS-79 system to illustrate the effectiveness of the proposed models, and the simulation results showed that the model is reasonable and effective.
The risk rating method proposed in this paper can make the risk rating level more consistent with the actual risk maintenance requirements, and it can identify the nodes that are connected to the severity value and probability risk. However, the algorithm to solve the model requires further study.
Author Contributions
Formal analysis, S.T.; Investigation, Q.G.; Methodology, S.T.; Resources, Q.G.; Supervision, Q.G.; Writing-original draft, S.T.; Writing-review & editing, S.T. All authors read and approved the final version of the manuscript.
Funding
This research was funded by the Nation Key R&D Program of China (Technology and application of wind power/photovoltaic power prediction for promoting renewable energy consumption, 2018YFB0904200) and eponymous Complement S&T Program of State Grid Corporation of China (SGLNDKOOKJJS1800266).
Acknowledgments
This work is supported by National Grid Technology Project of China (No. 522722160020).
Conflicts of Interest
The authors declare no conflict of interest.
References
- Chen, J.J.; Zhao, Y.L.; Qi, B.X.; Liu, W. Assessment Model of Risk Aversion for Power System Considering Wind Power Forecasing Error. Autom. Electr. Power Syst. 2019, 43, 163–168. [Google Scholar]
- Sun, H.; Liu, X.; Ben, C. Multi-objective risk scheduling model of power system containing power station with integrated wind power and energy storage. Autom. Electr. Power Syst. 2018, 42, 94–101. [Google Scholar]
- Li, X.; Zhang, X.; Wu, L.; Lu, P.; Zhang, S. Transmission Line Overload Risk Assessment for Power Systems with Wind and Load-Power Generation Correlation. IEEE Trans. Smart Grid 2015, 6, 1233–1242. [Google Scholar] [CrossRef]
- McCalley, J.D.; Fouad, A.A.; Vittal, V.; Irizarry-Rivera, A.A.; Agrawal, B.L.; Farmer, R.G. A risk-based security index for determining operating limits in stability limited electric power systems. IEEE Trans. Power Syst. 1997, 12, 1210–1219. [Google Scholar] [CrossRef]
- Li, W. Risk Assessment of Electric Power Systems Models, Methods, and Applications [M]; IEEE Press and Wiley & Sons: Piscataway, NJ, USA, 2005. [Google Scholar]
- Ni, M.; McCalley, J.D.; Vittal, V.; Tayyib, T. Online risk basedd security assessment. IEEE Trans. Power Syst. 2003, 18, 258–265. [Google Scholar]
- Shi, H.J.; Ge, F.; Ding, M.; Zhang, R.L.; Huang, D.S.; Xu, T.; Lin, H. Research on on-line assessment of transmission network operation risk. Power Syst. Technol. 2005, 2943–2948. [Google Scholar]
- Chen, W.H.; Jiang, Q.Y.; Cao, Y.J.; Han, Z.X. Risk assessment of voltage collapse in power system. Power Syst. Technol. 2005, 29, 6–11. [Google Scholar]
- Guo, L.; Guo, C.; Cao, Y.; Jiang, X.; Sheng, K. Power transmission risk assessment considering breaker online status. Autom. Electr. Power Syst. 2012, 36, 20–24. [Google Scholar]
- Qiu, W.; Zhang, J.; Liu, N.; Zhu, X.; Liu, L. Multi-objective optimal generation dispatch with consideration risk. Proc. CSEE 2012, 32, 64–72. [Google Scholar]
- Chen, W.H. Static Security Analysis and Prevention Control of Power System Based on Risk [D]; Zhejiang University: Hangzhou, China, 2007. [Google Scholar]
- Jiang, Y.; McCalley, J.D.; Van Voorhis, T. Risk-basedd resource optimization for transmission system maintenance. IEEE Trans. Power Syst. 2006, 21, 1191–1200. [Google Scholar] [CrossRef]
- Yu, Y.; Wang, D. Dynamic security risk assessment and optimization of transmission systems. Sci. China Ser. E Technol. Sci. 2009, 39, 286–292. [Google Scholar] [CrossRef]
- Huang, Z.L.; Cao, L.; Li, J.H. Study and construction of east china grid risk prevention and control system. East China Electr. Power 2010, 38, 11–16. [Google Scholar]
- Feng, Y.Q.; WU, W.C.; Zhang, B.M.; Sun, H.B.; He, Y.N.; Ye, Y.Q. Power system operation risk assessment based on credibility theory: Part three engineering application. Autom. Electr. Power Syst. 2006, 30, 11–16. [Google Scholar]
- Zhang, Y.X.; Zheng, C.Y.; Guo, R.P.; Li, F.W.; Gong, X.Y. Risk analysis and decision-support system of Ningbo power grid. Power Syst. Prot. Control. 2011, 39, 90–94. [Google Scholar]
- Wen, Y.; Cui, J.; Zhang, J.; Guo, C.; Huang, L.; Sheng, K. Design of a security risk management system for power system dispatching and operation: Part one concepts and design of architecture and function. Autom. Electr. Power Syst. 2013, 37, 66–73. [Google Scholar]
- Cui, J.; Wen, Y.; Guo, C.; Wang, Y.; Sheng, K.; Huang, L. Design of a security risk management system for power system dispatching and operation: Part two risk index, assessment methodologies and application strategies. Autom. Electr. Power Syst. 2013, 37, 92–97. [Google Scholar]
- Huang, W.; Pang, L.; Cao, B.; Hua, L.L. Distributed Parallel Calculation of Distribution Network State Estimation Based on Partition Decoupling. Power Syst. Prot. Control. 2014, 42, 45–51. [Google Scholar]
- Jianhua, Z.; Bo, Z.; Yuying, Z.; Dachuan, L.; Xu, Y. Key Issues and Research Prospects of Active Distribution Network Planning. J. Electr. Technol. 2014, 29, 13–23. [Google Scholar]
- Lin, T.Y.; Santoso, H.A.; Wu, K.R. Global sensor deployment and local coverage-aware recovery schemes for smart environments. IEEE Trans. Mob. Comput. 2015, 14, 1382–1396. [Google Scholar] [CrossRef]
- Li, B.; Fang, Y.; Xu, T. Review on online operational security risk assessment of power systems. Autom. Electr. Power Syst. 2012, 36, 171–177. [Google Scholar]
- Xiong, X.F.; Wang, W.J.; Yu, Y.; Shen, Z.J.; Cheng, R.L.; Dai, Z.Y. Risk analysis method for transmission line combining of various meteorological factors. Proc. CSU-EPSA 2011, 23, 11–15. [Google Scholar]
- Sun, Y.; Wang, X.; Wang, J.; Wang, X. Overhead transmission line icing flashover trip characteristic analysis and risk model. Proc. CSEE 2011, 31, 149–158. [Google Scholar]
- Sun, Y.; Wang, X.; Wang, J.; Wang, X.; Wu, X.; Xie, S. Vulnerability curve of ice flashover trips in regional grid and its application. Proc. CSEE 2012, 32, 55–63. [Google Scholar]
© 2019 by the authors. Licensee MDPI, Basel, Switzerland. This article is an open access article distributed under the terms and conditions of the Creative Commons Attribution (CC BY) license (http://creativecommons.org/licenses/by/4.0/).


