Article

Thermodynamic vs. Kinetic Basis for Polymorph Selection

Synthesis and Solid State Pharmaceutical Centre, Department of Chemical Sciences, Bernal Institute, University of Limerick, Limerick, V94 T9PX, Ireland
*
Author to whom correspondence should be addressed.
Processes 2019, 7(5), 272; https://doi.org/10.3390/pr7050272
Submission received: 28 March 2019 / Revised: 24 April 2019 / Accepted: 2 May 2019 / Published: 9 May 2019
(This article belongs to the Special Issue Modeling and Control of Crystallization)

Abstract

:
Ratios of equilibrium solubilities rarely exceed two-fold for polymorph pairs. A model has been developed based on two intrinsic properties of polymorph pairs, namely the ratio of equilibrium solubilities of the individual pairs (C*me/C*st) and the ratio of interfacial energies (γst/γme) and one applied experimental condition, namely the supersaturation identifies which one of a pair of polymorphs nucleates first. A domain diagram has been developed, which identifies the point where the critical free energy of nucleation for the polymorph pair are identical. Essentially, for a system supersaturated with respect to both polymorphs, the model identifies that low supersaturation with respect to the stable polymorph (Sst) leads to an extremely small supersaturation with respect to the metastable polymorph (Sme), radically driving up the critical free energy with respect to the metastable polymorph. Generally, high supersaturations sometimes much higher than the upper limit of the metastable zone, are required to kinetically favour the metastable polymorph.

1. Introduction

This work follows the report of Abramov that, with some exceptions, the ratio of equilibrium solubilities is less than 2.0 for 95% of polymorph pairs, based on a selection of 153 polymorph pairs [1]. Exceptionally, in the case of Ritonavir the reported solubility difference was 4–5 fold [2]. Although well-documented and generally agreed upon, this phenomenon has not been addressed apart from a previous publication from our group [3], which should be read as a companion paper.
Nyman and Day and separately Cruz-Cabeza, Reutzel-Edens and Bernstein have reported that the lattice energy difference for over 700 polymorph pairs rarely exceeds 5–6 kJ mol−1 with the difference for conformational polymorphs extending to 9–10 kJ mol−1 [4,5].
One further factor is the limited amount of energy available in solution crystallisations (RTlnS) [6,7] which rarely exceeds 4–6 kJ mol−1 when typical supersaturation is employed.
Considering the energies involved and the sheer number of polymorph pairs in the studies cited above we conclude that the measured equilibrium solubility ratio limit (2-fold) and the calculated lattice and free energy limits (5–10 kJ mol−1) for polymorph pairs are different manifestations of the same phenomenon.
The classical nucleation theory (CNT) describes nucleation rates as:
J = A   e x p   (   Δ G c * / R T )
The CNT expresses critical nucleation free energy ( Δ G c *   ) as follows:
Δ G c *   =   16 π N a γ 3 v m 2 3 k 2 T 2 l n 2 S
where γ is the interfacial energy, k is the Boltzmann constant, Na is Avogadro’s number, S is the supersaturation, vm is the molar volume and T is the temperature (in Kelvin).
Both the exponential and pre-exponential factors in Equation (1) have been considered by in assessing nucleation rates [8,9,10,11]. For example, Bernstein et al. [9] assessed a range of possible nucleation rates for pair of polymorphs at supersaturations where the rate of formation of the metastable polymorph can be identical to that of the stable polymorph, during concomitant polymorph occurrences. This approach was further analysed by Teychene and Biscans for two polymorphs of Eflucimibe [12].
Other approaches to the question of polymorph selection include that of Black et al. [13], who modelled the nucleation and growth rates with application to dimorphic p-aminobenzoic acid. The model predicts that the polymorph with higher nucleation or growth will predominate.
A different approach by Stranski and Totomanow predicts that the formation of the metastable polymorphs is driven by its lower critical free energy in comparison to the corresponding stable polymorph [14,15]. Monomorphic compounds are those where the stable form has the lowest critical free energy of nucleation [3].
Recent work by Horst et al. [16,17] have developed the theory of polymorph selection control through a single nucleation event. They presented nucleation of pure form (metastable or stable) of isonicotinamide upon crystallisation in small volumes from ethyl acetate solution. The single nucleus then acted as a seed and the corresponding polymorph proliferated in the solution via a secondary nucleation mechanism. Seed directed selection of polymorphic form was presented by Maher et al. [18] on the industrial scale for piroxicam.
Secondary nucleation or crystal breeding theory has also been developed by other workers. This theory is a two-step mechanism, where firstly, a liquid like structure formed in solution forms a weakly bound crystallite on coming into contact with a seed crystal. Secondly, this crystallite detached form the seed surface and itself acts a seed crystal [19,20]. Most recently Steendam et al. [21] have proved experimentally that the single nucleation mechanism in combination with secondary nucleation is also observed in large crystallisers.
This contribution will focus on the term ΔG*c in Equation (2) for pairs of polymorphs and explores the relationship between supersaturation and two inherent characteristics of polymorph pairs, namely the interfacial energies ratio (γstme) and the equilibrium solubilities ratio (C*me/C*st). These factors together with molecular volume (which we assume is equal for pairs of polymorphs) determine the relative sizes of ΔG*c for the pairs of polymorphs. This theory is justified on the basis of secondary nucleation hypothesis [22] combined with the single nucleation event theory [17]. Implicit in this approach is that once the first nucleus is formed, it acts as a seed for the rapid formation of numerous other nuclei of the same polymorph corresponding to most of the crystallisable mass in the crystalliser. Justification for this approach is the often report observation from the multi-vial approach to assessing nucleation rates that the transformation from clear to cloud point is almost instantaneous with the immediate formation of most of the crystallisable mass inside the vial. In particular, this approach will be used to explore reasons why the experimentally observed equilibrium solubility ratios of pairs of polymorphs rarely exceed 2. This approach is useful in determining which one of a pair of polymorphs will appear first but it cannot predict the rate at which a metastable polymorph will transform into a stable form.
Below we fully recognise the limitations of the CNT. In particular, the interfacial energy term therein and the manner in which it is commonly measured refers to a mature large crystal face. It does not take into account changes in interfacial energy as the crystal matures from a pre-critical size through a transition state energy maximum and into a mature crystal. It does not take into account the changes to interfacial energy as the shape or the exposed facets of the crystal change as the nucleus grows. Clearly, these may be important factors in determining the critical free energy of nucleation and in particular the differing facets offered by different polymorphs must be reflected in the measured interfacial energies cited below. This work takes as its starting point the reported experimental interfacial energies for a number of polymorph pairs and seeks to establish a reasonable range of interfacial energy ratios of the stable and metastable polymorphs as a basis for the establishment of the relative sizes of the critical free energies of nucleation of polymorph pairs.

2. Materials and Methods

Interfacial energies for organic compounds in a range of solvents vary in the range 0.3 to 10 mJ m−2, but values as high as 40 mJ m−2 have been reported [23,24,25,26]. A limited range of interfacial energies are available for polymorph pairs. Teychene et al. have reported values of γme and γst for Eflucimibe in Ethanol/heptane as 4.2 and 5.2 mJ m−2 respectively, giving a γstme ratio of 1.2 at 308 K [27]. Su et al. reported values of γme and γst for d-Mannitol in water 1.8 and 3.2 mJ m−2 respectively, giving a γstme ratio of 1.8 [28]. The solubility ratio at 293 K was reported as 1.40. For Glycine, Renuka Devi et al. have reported interfacial energies in the range 5.7 to 8.4 mJ m−2 for the metastable beta polymorph and in the range 11.5 to 22.2 mJ m−2 for the more stable alpha polymorph [29]. The solubility ratio at 298 K was reported as 1.45. These reported values are useful in setting the range, especially of interfacial energy ratios for our modelling below.
For convenience below pairs of polymorphs will be referred to as metastable and stable and the corresponding subscripts to C and γ are me and st, respectively. Choice of metastable and stable are based on the conventional practice that the metastable polymorphs exhibits the higher solubility for a given set of conditions and the stable polymorph exhibits the lower solubility.
Below supersaturation (Sst) will be defined with respect to the stable form, namely C/C*st. Sme can be readily calculated as
S me =   S st / ( C me * / C st * )
The values of ΔG*c are expressed as kJ (mol clusters)−1 for the metastable (ΔG*c me) and stable polymorphs (ΔG*c st). In developing the model, it will be assumed that γme is lower than γst consistent with the literature data presented above. A feature of this work is that the polymorph pairs are monotropic for the conditions explored and that C/C*me < C/C*st.

3. Results and Discussion

Figure 1 presents a composition of calculations of critical free energies of nucleation for pairs of polymorphs covering a wide range of equilibrium solubility ratios (C*me/C*st), interfacial energies (γstme) and applied supersaturations (calculated with respect to the stable polymorph (Sst). Figure 1A clearly shows that when the solubility ratio is close to unity the critical free energy of nucleation is always lower for the metastable polymorph, so we would expect that the metastable polymorph would appear first for all applied supersaturations. Of course, it may transform rapidly or otherwise into the stable polymorph. As we move towards higher solubility ratios (C*me/C*st = 2.22 in Figure 1B) we can identify the lower applied supersaturations where the critical free energy of nucleation is lower for the stable polymorph than the metastable. Figure 1C illustrates the influence of the ratio of solid–liquid interfacial energies (γstme) on the critical free energies of nucleation of polymorph pairs. At low interfacial energy ratios, the stable polymorph is favoured, whereas at high ratios the metastable polymorph is favoured. The point of intersection in Figure 1C moves sharply to lower γstme values as the supersaturation is increased. In general, higher supersaturation favour first appearance of the metastable polymorph.
More generally, we can readily identify combinations of the solubility and interfacial energy ratios where the critical free energy of the stable polymorph becomes lower than the corresponding value for the metastable polymorph. Both of these factors are inherent properties of individual polymorph pairs. Control of the relative size of the critical free energies of nucleation for the pairs comes about through selection of an appropriate supersaturation, with higher values generally favouring the metastable polymorph. Figure 2 shows a schematic of how the values of Sme change as Sst increases from nominal values of 3 to 7. When Sst is equal to 3 the corresponding value for Sme is 1.5 and this drives the value of ΔG*c for the metastable polymorph above that of the stable polymorph (Equation (2)), rendering it less favoured kinetically. When Sst is equal to 7 the critical free energy of nucleation is less for the metastable polymorph favouring it kinetically. For the set of conditions specified in the legend to Figure 2, most notable for the purposes of this paper C*me/C*st = 2, we predict the formation of the stable polymorph first at Sst equal to 3 and the formation of the metastable polymorph first at Sst equal to 7.
All of these factors are gathered in Figure 3. Each of the plots in this figure is the line where the nucleation free energy of the metastable and stable polymorphs are equal. Four lines are presented each corresponding to a different ratio of interfacial energies. It identifies the supersaturations where we can expect to see the initial appearance of metastable polymorphs, namely at supersaturations above the appropriate line and where we can expect to see the initial appearance of stable polymorphs, namely, below the appropriate line.
Based on Equation (2);
Δ G Cme * Δ G Cst * = ( γ me γ st ) 3 l n 2 S st l n 2 S me
Substituting Equation (3) yields;
Δ G Cme * Δ G Cst * = ( γ me γ st ) 3 l n 2 S st [ l n S st ln ( C me * C st * ) ] 2
For Δ G Cme * Δ G Cst * = 1 , one obtains
( γ st γ me ) 3 = l n 2 S st [ l n S st ln ( C me * C st * ) ] 2
The domain diagram in Figure 3 is plotted according to the Equation (6).
Three separate factor which arise from the applied experimental conditions (Supersaturation), the inherent properties of the polymorphism, namely the solubility ratio of the polymorph pairs (C*me/C*st) and the ratio of solid–liquid interfacial energies (γstme) are covered in the domain diagram. This diagram identifies which one of a polymorph pair, the metastable or the stable, will appear first for a given set of experimental conditions based on the assumption that the polymorph with the lower free energy of nucleation will appear first. In its present state the domain diagram cannot be used to predict how rapidly the metastable to stable transformation will occur. Equally the diagram cannot be used to predict in any way the rate of crystallisation.
The first feature of the diagram is that the domain space for the first appearance of the metastable polymorph depends strongly on the ratio of solid–liquid interfacial energies. As this ratio increases, caused by an increase in the solid–liquid interfacial energy for the stable polymorph or a decrease in the corresponding value for the metastable polymorph then the domain space in which the metastable polymorph is predicted to crystallise first, expands greatly. This is entirely understandable in terms of the CNT which predicts that the critical free energy of nucleation and nucleation rate varies as the exponential of third power of the solid–liquid interfacial energy term (Equation (2)). Clearly, as the ratio γstme increased the rate of nucleation of the metastable polymorph is favoured over that of the stable polymorph widening the domain in question.
Combining this observation with the fact that we find less than 5% of polymorph pairs reviewed by Abramov exhibit equilibrium solubility ratios in excess of 2 we must conclude that for the most part the ratio of interfacial energies (γstme) should not exceed 1.5, if the metastable polymorph is to form first at a reasonably attainable supersaturation.
Assuming that the ratios of interfacial energies and equilibrium solubilities are constant for a given pair of polymorphs, the factor which determined which polymorph will appear first will be the supersaturation. So, for circumstances where γstme is equal to 1.25 and the where C*me/C*st is equal to 1.5 the domain diagram predicts that the critical free energy of nucleation is equal for both polymorphs when the value of Sst is equal to 4.0. At this point the value of Sme is equal to 2.66 and the values of the critical free energies of nucleation are equal. At higher values of Sst, for example 5.0, the corresponding value for Sme would be equal to 3.33 and this higher Sme value would drive the critical free energy for the formation of the metastable form to a lower value than for the stable form. Correspondingly, at a value of Sst = 3.0 the value for Sme would be 2.0 at which point the supersaturation term in the denominator in Equation (2) for the metastable form (10 × 102 Sme) would drive the critical free energy term to a higher value than for the stable polymorph. Interestingly, the minimum Sme required to generate the metastable form (in the example cited above) is greater than 2.66 and in normal circumstances that value would be higher than the metastable zone limit for either polymorph.
For a polymorph pair where the ratio of interfacial energies (γstme) is 1.25 and the ratio of solubilities C*me/C*st is 1.1 the minimum Sst required to observe the metastable polymorph first is above 1.4 (see Figure 3 red trace); for a polymorph pair where the ratio of interfacial energies (γstme) is 1.25 and the ratio of solubilities C*me/C*st is 1.5 the minimum Sst required to observe the metastable polymorph first is above 4; for a polymorph pair where the ratio of interfacial energies (γstme) is 1.25 and the ratio of solubilities C*me/C*st is 1.8 the minimum Sst required to observe the metastable polymorph first is above 8. Accordingly, the domain diagram can be used to calculate the minimum supersaturation at which we can expect to see the metastable polymorph selected kinetically through appropriate application of interfacial energy ratios (γstme) and the ratio of solubilities C*me/C*st.
Taking a polymorph pair characterised by the point where C*me/C*st is equal to 2.0, the domain diagram predicts that when γstme is equal to 1.25, then the value of Sst needs to be above 20 for the metastable polymorph to appear first. For the same equilibrium concentration ratio but where the value of γstme is equal to 1.5 then Sst needs to be above 4.5 for the metastable polymorph to appear first. Clearly, the domain diagram illustrates that for the metastable polymorphs to appear first when the equilibrium concentration ratio is 2.0 and above, pairs need to be characterised by very high ratios of solid liquid interfacial energies (γstme) or unattainably high supersaturations need to be employed.
A regular experimental finding for polymorph pairs of organic compounds is that high supersaturations seem to favour the initial formation and in some circumstances the persistence of the metastable form. Polymorphs pairs Eflucimibe [12], d-Mannitol [28] and Famotidine [30], o-Aminobenzoic acid, Stavudine [31], L-Histidine [32], BPT Propyl Ester [33], Florfenicol [34] and L-Glutamic acid [35] each of which show a preference for the stable polymorph at low supersaturations and a preference for the metastable polymorph at higher supersaturations. Shiau used a competitive kinetic model that predicted this behaviour for eflucimibe based on the model derived association and dissociation rate constant for the two polymorphs [36]. More specifically, metastable Form II of o-aminobenzoic acid was the first observed crystalline form when the supersaturation was 2 and above; the stable Form I was the first to crystallise for supersaturations less than 1.5. The solubility ratios were 1.2 and lower for all solvents investigated and the solutions were supersaturated with respect to both polymorphs in all experimental conditions explored [37]. The stable Form 1 of Stavudine crystallises at supersaturation ratios less than 2; the metastable Form 2 crystallises at ratios above 2 [31]. Metastable Form B of L-Histidine is favoured at supersaturation ratios above 2; mixtures of the stable (Form A) and the metastable polymorph (Form B) were reported when the supersaturation ratio was less than 2. In this case, the supersaturation ratios were generated by suitable choice of ethanol/water ratio and were always less than 1.5. These workers never reported a situation where the pure stable form appeared at the lowest supersaturations employed (Sst = 1.5) but a contributing factor may have been the very high interfacial energy values reported for the stable Form A, which were in the range 30–39 mJ m−2 [32]. Kitamura et al. [33] followed solubility changes during the crystallisation of BPT Propyl Ester. The solubility ratio in ethanol was close to 1.5. For supersaturation above 2.2 in ethanol the metastable polymorphs crystallise initially and the suspension exhibits the equilibrium solubility of the metastable form. Thereafter, the metastable form transforms into the stable form via a solution mediated mechanism. When the same crystallisation was performed at supersaturation ratios below 2.2 only the stable form appeared. It appears that the minimum supersaturation with respect to the metastable stable polymorph required for its formation is 1.5. Values of interfacial energies were not reported. Su et al. [38] reported that the metastable delta form of d-Mannitol forms at supersaturations above 2.4 whereas the stable beta form was observed below 1.9, in this case the ratio of solubilities in water was 1.4.
A further question that needs to be addressed here is the relationship with the metastable zone width (MSZW) in kinetic selection of polymorphs. Is the MSZW a manifestation of the high supersaturation required to form the metastable polymorph? Generally, MSZW’s are not often reported for metastable polymorphs. Generally MSZW’s are strongly dependant on the experimental conditions utilised in their measurement, stirring and cooling rates, but typical literature values for stable polymorphs of organic compounds expressed as Cmszw/C*st are 1.5 for isonicotinimide [39], less than 1.1 for glycine [29], 1.5 for paracetamol [40], 2.5 for Eflucimibe [41], 1.3 for Ketoprofen [42] and 1.5 for p-Aminobenzoic acid [43]. Similar values applied to the metastable polymorphs and expressed as a supersaturation based on its solubility at the metastable limit Cmszw,me divided by the C*st allows us to directly compare the predicted values with the minimum supersaturations (Sst) predicted by the domain diagram for the kinetic selection of the metastable polymorph. Assuming that the MSZW for the metastable polymorph is 1.5 times its solubility Table 1 compares typical Cmszw,me/C*st values with the minimum supersaturation to achieve kinetic selection of the metastable polymorph.
The data in the Table 1 clearly shows that at low values of C*me/C*st the MSZW limit is similar to the minimum supersaturation predicted for the kinetic selection of the metastable polymorph. In such circumstances the model simply predicts that the upper limit of solubility of the metastable polymorph defined by the MSZW needs to be attained before the metastable polymorph can be kinetically selected. However, as C*me/C*st increases for all values of γstme the divergence between the two increases such that the minimum Sst needed to form the metastable polymorph greatly exceeds any reasonable esteem of the upper limit of supersaturation achieved for the metastable polymorph at its MSZW limit.
In terms of continuous crystallisers a number of designs have been applied, most notable mixed suspension, mixed product removal crystallisers (MSMPR), impinging jet reactors usually operated in association with MSMPR crystallisers, a variety of tubular crystallisers with and without baffles and mixers, and hot melt extrusion (HME). For the most part each of these types of reactor is capable of operating with or without seeding in cooling, anti-solvent and reactive modes; additional features such as ultrasound, static mixing or flow oscillations can and have been applied [44,45,46,47,48,49,50,51,52]. One feature pertinent to this study relates to supersaturation. In circumstances where nucleation is relatively slow, we can expect that the MSMPR crystallisers will operate in conditions of constant supersaturation, perhaps close to the equilibrium solubility. In one study supersaturation of L-Glutamic acid in a MSMPR supersaturation was allowed to vary over a wide range (Sst varied from 2 to 6 approx.). In these circumstances, the metastable alpha polymorph was formed exclusively at high supersaturations and the stable beta polymorph was formed low supersaturations. Interestingly the metastable polymorph became established even in circumstances where a large seed dose of the beta polymorph had been employed at the start of the continuous run. During a transient increase in supersaturation a small amount of the metastable alpha polymorph crystallised and thereafter persisted as the dominant solid phase present [53]. These results are entirely in keeping with the domain diagram developed here (Figure 3).

4. Conclusions

The critical nucleation free energy term (ΔG*c) in the CNT correctly predicts that polymorph pairs rarely exist with equilibrium solubility ratios in excess of 2. When this value is exceeded the ΔG*c term for the stable polymorph becomes less than the corresponding value for the metastable polymorph, even for relatively high values of the applied supersaturation. The relative sizes of the ΔG*c are critical in determining which one of a pair of polymorphs crystallises first. The approach taken here also explains the often experimentally observed phenomenon where the solutions are supersaturated with respect to both polymorphs, high supersaturation favour the metastable polymorph, intermediate values favour concomitant polymorphism and low values favour the formation of the stable polymorph. The very high supersaturations required to generate metastable polymorphs, especially when the ratio interfacial energies (γstme) is less than 1.5, are well in excess of any reasonable estimate of the metastable zone width for the metastable polymorph.

Author Contributions

Both authors contributed equally in Conceptualisation; Methodology; Validation; Formal Analysis; Investigation; Resources; Data Curation; Writing—Original Draft Preparation; Writing—Review and Editing. Visualisation; Supervision; Project Administration; Funding Acquisition was done by B.K.H.

Funding

This work was funded by Science Foundation Ireland under Grant 12/RC/2275. This work was conducted under the framework of the Irish Government’s Programme for Research in Third Level Institutions Cycle 5, with the assistance of the European Regional Development Fund.

Conflicts of Interest

The authors declare no conflict of interest.

References

  1. Abramov, Y.A.; Pencheva, K. Thermodynamics and relative solubility prediction of polymorphic systems. In Chemical Engineering in the Pharmaceutical Industry; Ende, D.J.A., Ed.; Wiley: Hoboken, NJ, USA, 2010; pp. 477–490. [Google Scholar]
  2. Bauer, J.; Spanton, S.; Henry, R.; Quick, J.; Dziki, W.; Porter, W.; Morris, J. Ritonavir: An Extraordinary Example of Conformational Polymorphism. Pharm. Res. 2001, 18, 859–866. [Google Scholar] [CrossRef] [PubMed]
  3. Verma, V.; Hodnett, B.K. A Basis for the Kinetic Selection of Polymorphs during Solution Crystallization of Organic Compounds. CrystEngComm 2018, 20, 5551–5561. [Google Scholar] [CrossRef]
  4. Nyman, J.; Day, G.M. Static and lattice vibrational energy differences between polymorphs. CrystEngComm 2015, 17, 5154–5165. [Google Scholar] [CrossRef] [Green Version]
  5. Cruz-Cabeza, A.J.; Reutzel-Edens, S.M.; Bernstein, J. Facts and fictions about polymorphism. Chem. Soc. Rev. 2015, 44, 8619–8635. [Google Scholar] [CrossRef]
  6. Mealey, D.; Croker, D.M.; Rasmuson, A.C. Crystal nucleation of salicylic acid in organic solvents. CrystEngComm 2015, 17, 3961–3973. [Google Scholar] [CrossRef]
  7. Khamar, D.; Zeglinski, J.; Mealey, D.; Rasmuson, Å.C. Investigating the Role of Solvent–Solute Interaction in Crystal Nucleation of Salicylic Acid from Organic Solvents. J. Am. Chem. Soc. 2014, 136, 11664–11673. [Google Scholar] [CrossRef]
  8. Volmer, M. Kinetics of Phase Formation (Kinetik der Phasenbildung). In Die Chemische Reaktion; Bonhoeffer, K.F., Ed.; Central Air Documents; Wright-Patterson AFB: Dayton, OH, USA, 1939; Volume IV. [Google Scholar]
  9. Bernstein, J.; Davey Roger, J.; Henck, J.-O. Concomitant Polymorphs. Angew. Chem. Int. Ed. 1999, 38, 3440–3461. [Google Scholar] [CrossRef]
  10. Parsons, R.; Robinson, K.M.; Twomey, T.A.; Leiserowitz, L.; Roberts, K.J.; Chernov, A.A.; van der Eerden, J.P.; Bennema, P.; Frenken, J.W.M.; Sherwood, J.N.; et al. General discussion. Faraday Discuss. 1993, 95, 145–171. [Google Scholar] [CrossRef]
  11. Keller, A.; Goldbeck-Wood, G.; Hikosaka, M. Polymer crystallization: survey and new trends with wider implications for phase transformations. Faraday Discuss. 1993, 95, 109–128. [Google Scholar] [CrossRef]
  12. Teychené, S.; Biscans, B. Nucleation Kinetics of Polymorphs: Induction Period and Interfacial Energy Measurements. Cryst. Growth Des. 2008, 8, 1133–1139. [Google Scholar] [CrossRef]
  13. Black, J.F.B.; Cardew, P.T.; Cruz-Cabeza, A.J.; Davey, R.J.; Gilks, S.E.; Sullivan, R.A. Crystal nucleation and growth in a polymorphic system: Ostwald’s rule, p-aminobenzoic acid and nucleation transition states. CrystEngComm 2018, 20, 768–776. [Google Scholar] [CrossRef]
  14. Stranski, I.; Totomanow, D. Keimbildungsgeschwindigkeit und Ostwaldsche Stufenregel. Z. Phys. Chem. 1933, 163, 399–408. [Google Scholar] [CrossRef]
  15. Croker, D.; Hodnett, B.K. Mechanistic Features of Polymorphic Transformations: The Role of Surfaces. Cryst. Growth Des. 2010, 10, 2806–2816. [Google Scholar] [CrossRef]
  16. Kadam, S.S.; Kramer, H.J.M.; ter Horst, J.H. Combination of a Single Primary Nucleation Event and Secondary Nucleation in Crystallization Processes. Cryst. Growth Des. 2011, 11, 1271–1277. [Google Scholar] [CrossRef]
  17. Kulkarni, S.A.; Meekes, H.; ter Horst, J.H. Polymorphism Control through a Single Nucleation Event. Cryst. Growth Des. 2014, 14, 1493–1499. [Google Scholar] [CrossRef]
  18. Maher, A.; Hodnett, B.K.; Coughlan, N.; O’Brien, M.; Croker, D.M. Application of New Technology to a Mature Piroxicam Crystallization Process To Gain Process Understanding and Control, via Industrial–Academic Collaboration. Org. Process Res. Dev. 2018, 22, 306–311. [Google Scholar] [CrossRef]
  19. Verdurand, E.; Bebon, C.; Colson, D.; Klein, J.P.; Blandin, A.F.; Bossoutrot, J.M. Secondary nucleation and growth of organic crystals in industrial crystallization. J. Cryst. Growth 2005, 275, e1363–e1367. [Google Scholar] [CrossRef]
  20. De Souza, B.; Cogoni, G.; Tyrrell, R.; Frawley, P.J. Evidence of Crystal Nuclei Breeding in Laboratory Scale Seeded Batch Isothermal Crystallization Experiments. Cryst. Growth Des. 2016, 16, 3443–3453. [Google Scholar] [CrossRef]
  21. Steendam, R.R.E.; Keshavarz, L.; Blijlevens, M.A.R.; de Souza, B.; Croker, D.M.; Frawley, P.J. Effects of Scale-Up on the Mechanism and Kinetics of Crystal Nucleation. Cryst. Growth Des. 2018. [Google Scholar] [CrossRef]
  22. Anwar, J.; Khan, S.; Lindfors, L. Secondary Crystal Nucleation: Nuclei Breeding Factory Uncovered. Angew. Chem. Int. Ed. 2015, 54, 14681–14684. [Google Scholar] [CrossRef]
  23. Granberg, R.A.; Ducreux, C.; Gracin, S.; Rasmuson, Å.C. Primary nucleation of paracetamol in acetone–water mixtures. Chem. Eng. Sci. 2001, 56, 2305–2313. [Google Scholar] [CrossRef]
  24. Jiang, S.; ter Horst, J.H. Crystal Nucleation Rates from Probability Distributions of Induction Times. Cryst. Growth Des. 2011, 11, 256–261. [Google Scholar] [CrossRef]
  25. Mealey, D.; Zeglinski, J.; Khamar, D.; Rasmuson, A.C. Influence of solvent on crystal nucleation of risperidone. Faraday Discuss. 2015, 179, 309–328. [Google Scholar] [CrossRef] [PubMed] [Green Version]
  26. Cruz-Cabeza, A.J.; Davey, R.J.; Sachithananthan, S.S.; Smith, R.; Tang, S.K.; Vetter, T.; Xiao, Y. Aromatic stacking - a key step in nucleation. Chem. Commun. 2017, 53, 7905–7908. [Google Scholar] [CrossRef]
  27. Teychene, S.; Autret, J.M.; Biscans, B. Determination of solubility profiles of eflucimibe polymorphs: Experimental and modeling. J. Pharm. Sci. 2006, 95, 871–882. [Google Scholar] [CrossRef]
  28. Su, W.; Hao, H.; Glennon, B.; Barrett, M. Spontaneous Polymorphic Nucleation of d-Mannitol in Aqueous Solution Monitored with Raman Spectroscopy and FBRM. Cryst. Growth Des. 2013, 13, 5179–5187. [Google Scholar] [CrossRef]
  29. Renuka Devi, K.; Gnanakamatchi, V.; Srinivasan, K. Attainment of unstable β nucleation of glycine through novel swift cooling crystallization process. J. Cryst. Growth 2014, 400, 34–42. [Google Scholar] [CrossRef]
  30. Lu, J.; Wang, X.-J.; Yang, X.; Ching, C.-B. Polymorphism and Crystallization of Famotidine. Cryst. Growth Des. 2007, 7, 1590–1598. [Google Scholar] [CrossRef] [Green Version]
  31. Mirmehrabi, M.; Rohani, S.; Murthy, K.S.K.; Radatus, B. Polymorphic Behavior and Crystal Habit of an Anti-Viral/HIV Drug: Stavudine. Cryst. Growth Des. 2006, 6, 141–149. [Google Scholar] [CrossRef]
  32. Roelands, C.P.M.; Jiang, S.; Kitamura, M.; ter Horst, J.H.; Kramer, H.J.M.; Jansens, P.J. Antisolvent Crystallization of the Polymorphs of l-Histidine as a Function of Supersaturation Ratio and of Solvent Composition. Cryst. Growth Des. 2006, 6, 955–963. [Google Scholar] [CrossRef]
  33. Kitamura, M.; Hara, T.; Takimoto-Kamimura, M. Solvent Effect on Polymorphism in Crystallization of BPT Propyl Ester. Cryst. Growth Des. 2006, 6, 1945–1950. [Google Scholar] [CrossRef]
  34. Sun, Z.; Hao, H.; Xie, C.; Xu, Z.; Yin, Q.; Bao, Y.; Hou, B.; Wang, Y. Thermodynamic Properties of Form A and Form B of Florfenicol. Ind. Eng. Chem. Res. 2014, 53, 13506–13512. [Google Scholar] [CrossRef]
  35. Roelands, C.P.M.; ter Horst, J.H.; Kramer, H.J.M.; Jansens, P.J. The unexpected formation of the stable beta phase of l-glutamic acid during pH-shift precipitation. J. Cryst. Growth 2005, 275, e1389–e1395. [Google Scholar] [CrossRef]
  36. Shiau, L.-D. Modelling of the Polymorph Nucleation Based on Classical Nucleation Theory. Crystals 2019, 9, 69. [Google Scholar] [CrossRef]
  37. Jiang, S.; ter Horst, J.H.; Jansens, P.J. Concomitant Polymorphism of o-Aminobenzoic Acid in Antisolvent Crystallization. Cryst. Growth Des. 2008, 8, 37–43. [Google Scholar] [CrossRef]
  38. Su, W.; Hao, H.; Barrett, M.; Glennon, B. The Impact of Operating Parameters on the Polymorphic Transformation of d-Mannitol Characterized in Situ with Raman Spectroscopy, FBRM, and PVM. Org. Process Res. Dev. 2010, 14, 1432–1437. [Google Scholar] [CrossRef]
  39. Caridi, A.; Kulkarni, S.A.; di Profio, G.; Curcio, E.; ter Horst, J.H. Template-Induced Nucleation of Isonicotinamide Polymorphs. Cryst. Growth Des. 2014, 14, 1135–1141. [Google Scholar] [CrossRef]
  40. Arribas Bueno, R.; Crowley, C.M.; Hodnett, B.K.; Hudson, S.; Davern, P. Influence of Process Parameters on the Heterogeneous Nucleation of Active Pharmaceutical Ingredients onto Excipients. Org. Process Res. Dev. 2017, 21, 559–570. [Google Scholar] [CrossRef]
  41. Teychené, S.; Autret, J.M.; Biscans, B. Crystallization of Eflucimibe Drug in a Solvent Mixture: Effects of Process Conditions on Polymorphism. Cryst. Growth Des. 2004, 4, 971–977. [Google Scholar] [CrossRef]
  42. Espitalier, F.; Biscans, B.; Laguérie, C. Particle design Part A: Nucleation kinetics of ketoprofen. Chem. Eng. J. 1997, 68, 95–102. [Google Scholar] [CrossRef]
  43. Gracin, S.; Uusi-Penttilä, M.; Rasmuson, Å.C. Influence of Ultrasound on the Nucleation of Polymorphs of p-Aminobenzoic Acid. Cryst. Growth Des. 2005, 5, 1787–1794. [Google Scholar] [CrossRef]
  44. Eder, R.J.P.; Radl, S.; Schmitt, E.; Innerhofer, S.; Maier, M.; Gruber-Woelfler, H.; Khinast, J.G. Continuously Seeded, Continuously Operated Tubular Crystallizer for the Production of Active Pharmaceutical Ingredients. Cryst. Growth Des. 2010, 10, 2247–2257. [Google Scholar] [CrossRef]
  45. Lawton, S.; Steele, G.; Shering, P.; Zhao, L.H.; Laird, I.; Ni, X.W. Continuous Crystallization of Pharmaceuticals Using a Continuous Oscillatory Baffled Crystallizer. Org. Process Res. Dev. 2009, 13, 1357–1363. [Google Scholar] [CrossRef]
  46. Alvarez, A.J.; Singh, A.; Myerson, A.S. Crystallization of Cyclosporine in a Multistage Continuous MSMPR Crystallizer. Cryst. Growth Des. 2011, 11, 4392–4400. [Google Scholar] [CrossRef]
  47. Wong, S.Y.; Tatusko, A.P.; Trout, B.L.; Myerson, A.S. Development of Continuous Crystallization Processes Using a Single-Stage Mixed-Suspension, Mixed-Product Removal Crystallizer with Recycle. Cryst. Growth Des. 2012, 12, 5701–5707. [Google Scholar] [CrossRef]
  48. Alvarez, A.J.; Myerson, A.S. Continuous Plug Flow Crystallization of Pharmaceutical Compounds. Cryst. Growth Des. 2010, 10, 2219–2228. [Google Scholar] [CrossRef]
  49. Sultana, M.; Jensen, K.F. Microfluidic Continuous Seeded Crystallization: Extraction of Growth Kinetics and Impact of Impurity on Morphology. Cryst. Growth Des. 2012, 12, 6260–6266. [Google Scholar] [CrossRef]
  50. Wierzbowska, B.; Hutnik, N.; Piotrowski, K.; Matynia, A. Continuous Mass Crystallization of Vitamin C in l(+)-Ascorbic Acid−Ethanol−Water System: Size-Independent Growth Kinetic Model Approach. Cryst. Growth Des. 2011, 11, 1557–1565. [Google Scholar] [CrossRef]
  51. Ferguson, S.; Morris, G.; Hao, H.X.; Barrett, M.; Glennon, B. Characterization of the anti-solvent batch, plug flow and MSMPR crystallization of benzoic acid. Chem. Eng. Sci. 2013, 104, 44–54. [Google Scholar] [CrossRef]
  52. Quon, J.L.; Zhang, H.; Alvarez, A.; Evans, J.; Myerson, A.S.; Trout, B.L. Continuous Crystallization of Aliskiren Hemifumarate. Cryst. Growth Des. 2012, 12, 3036–3044. [Google Scholar] [CrossRef]
  53. Lai, T.-T.C.; Ferguson, S.; Palmer, L.; Trout, B.L.; Myerson, A.S. Continuous Crystallization and Polymorph Dynamics in the l-Glutamic Acid System. Org. Process Res. Dev. 2014, 18, 1382–1390. [Google Scholar] [CrossRef]
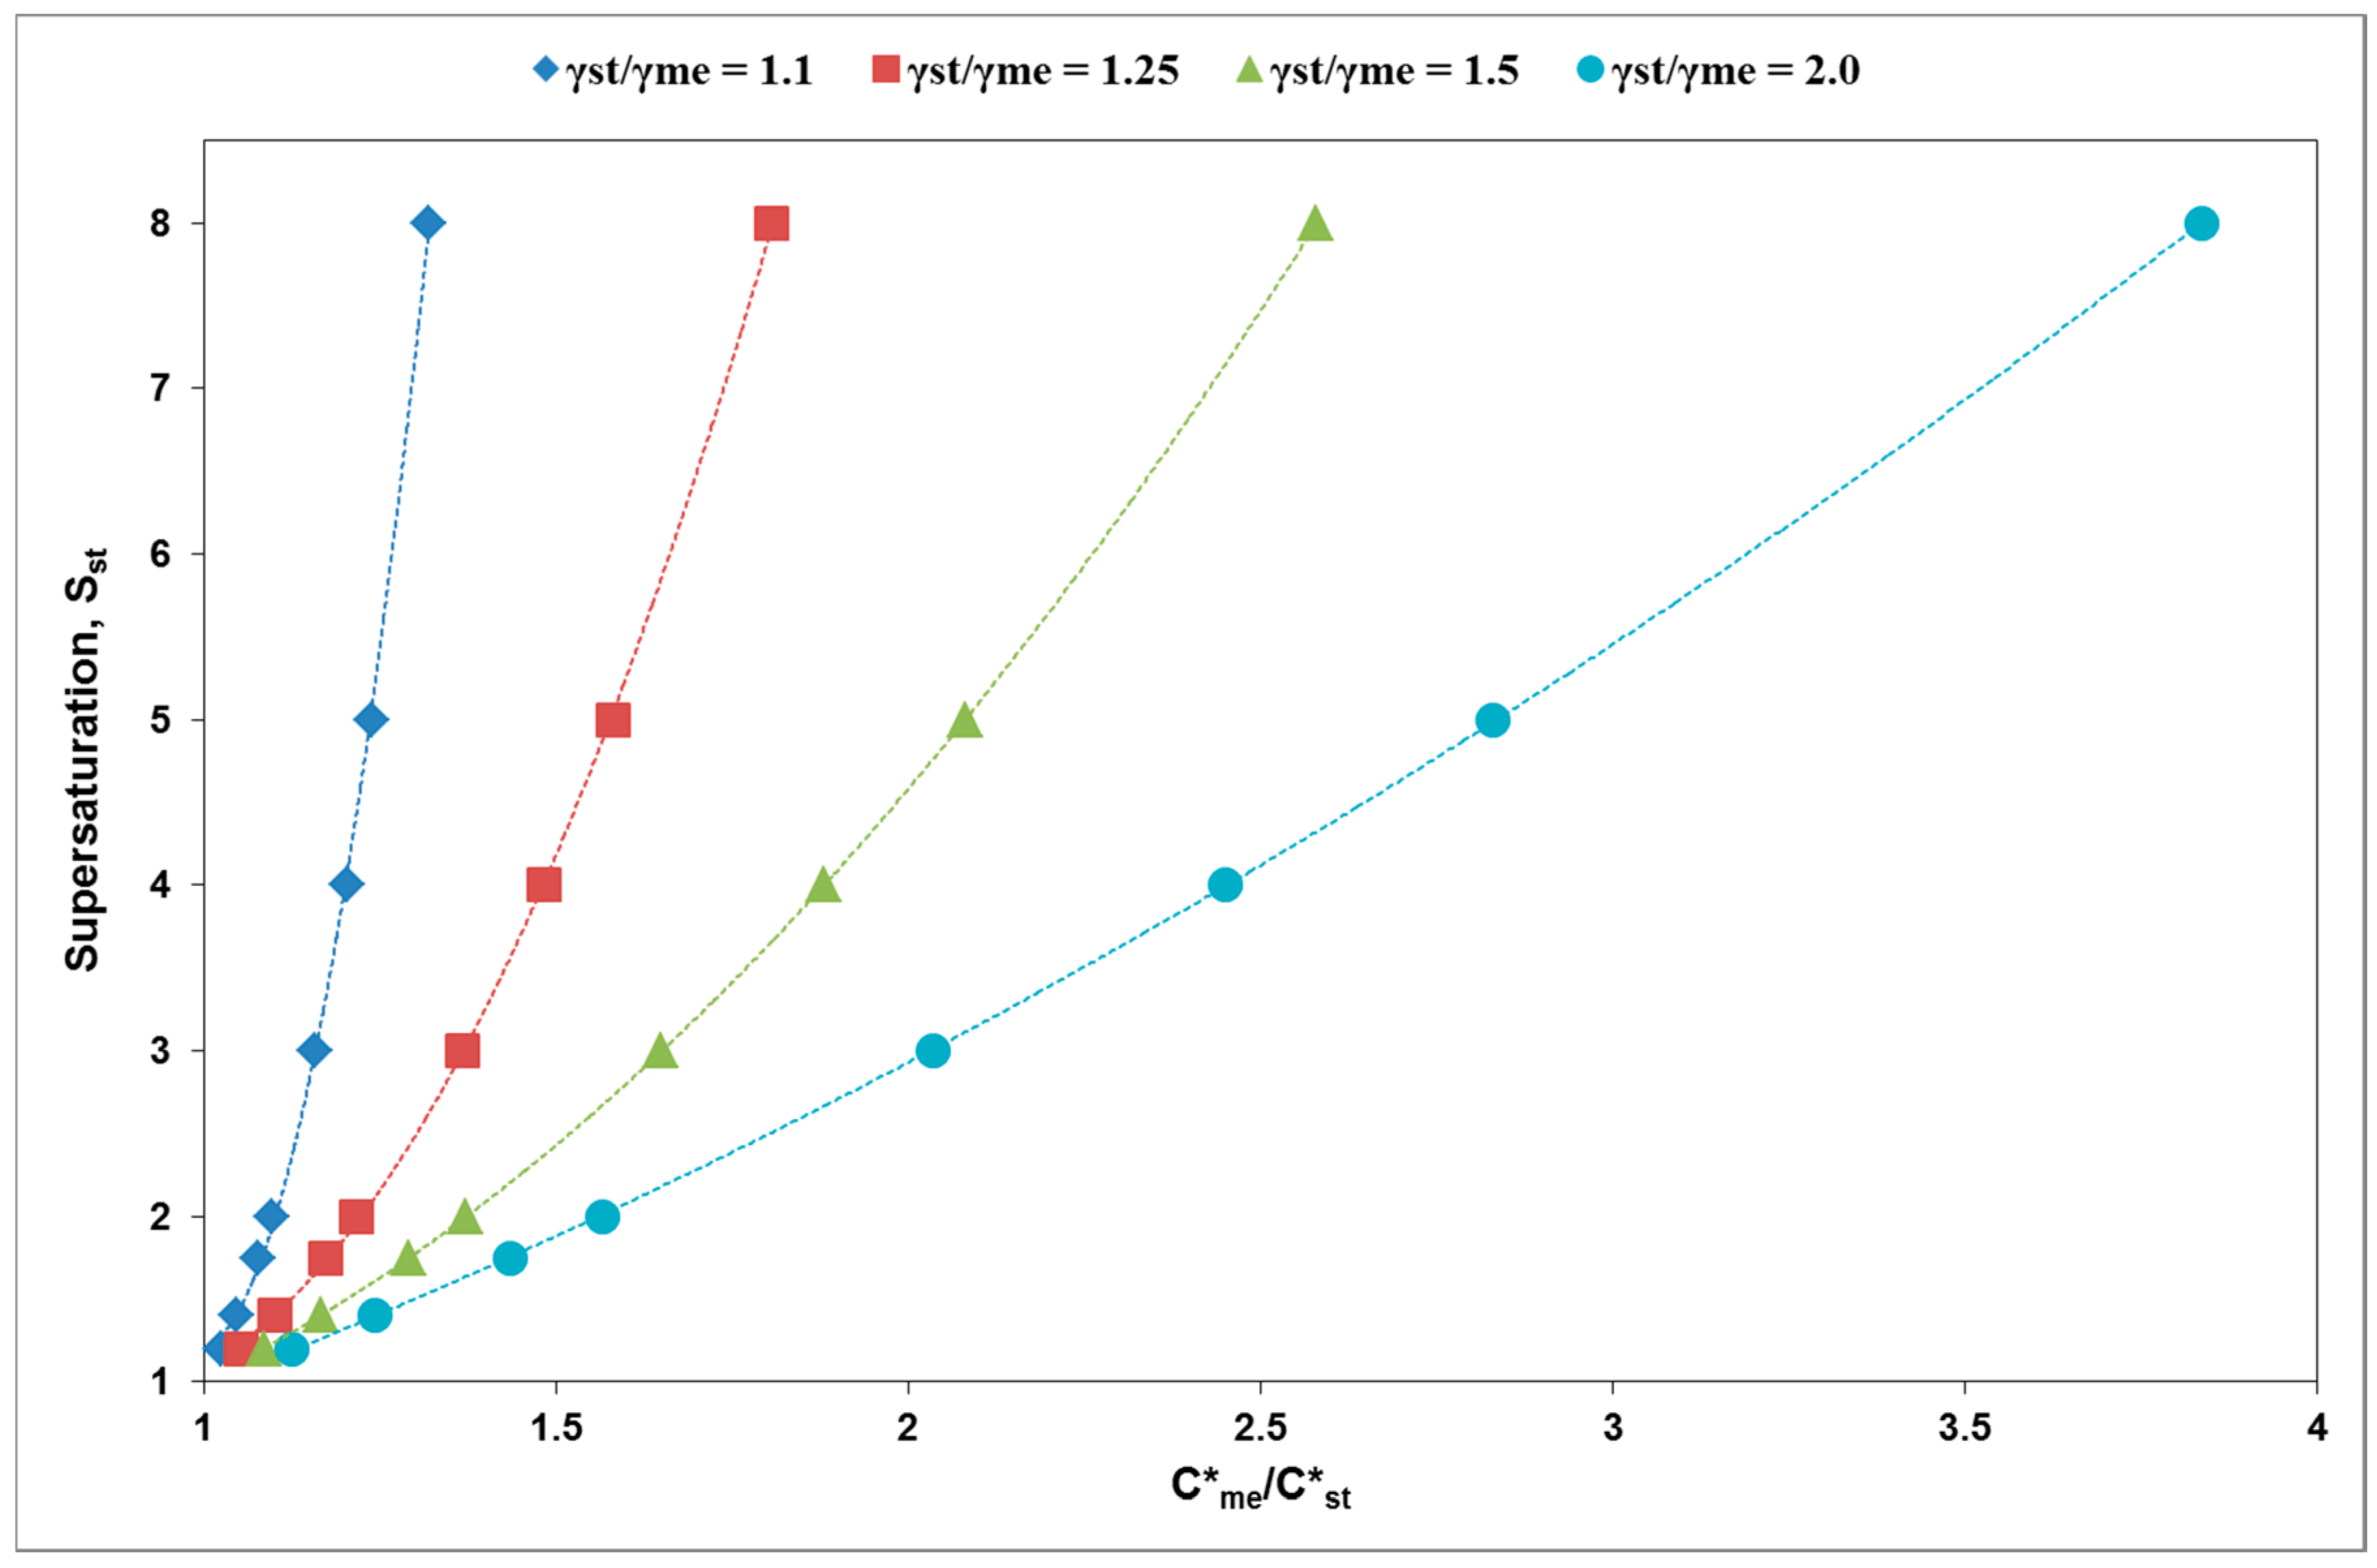
Figure 1. (A,B): Influence of Supersaturation with respect to the Stable Polymorph (Sst) on the Critical Nucleation Free Energies (ΔG*c) for C*me/C*st =1.05 (A), C*me/C*st =2.22 (B), Temperature 293 K; γme =4 mJ m−2; γst = 5.5 mJ m−2; γstme = 1.375; Vm =3.5 × 10⁻²⁸ m3 molec−1, (C) Influence of Interfacial Energy Ratio (γstme) on the Critical Nucleation Free Energies (ΔG*c) for the Stable and Metastable Polymorphs. γme = 4 mJ/m2; C*me/C*st = 2.0; Temperature 293 K; Sst = 3.0; Vm =3.5 × 10⁻²⁸ m3 molec−1 [3].
Processes 07 00272 g001
Figure 2. Crystallisation pathway for a polymorph pair at the supersaturations indicated. (C*me/C*st = 2; γstme = 1.45; Vm = 3.5 × 10⁻²⁸ m3 molec−1).
Processes 07 00272 g002
Figure 3. Domain diagram. For each characteristic ratios of equilibrium solubilities (C*me/C*st) and interfacial energies (γstme), the plot presents the supersaturation with respect to the stable polymorph (Sst) at which the ΔG*c values are equal. If the value for an equilibrium solubility ratio fall below its interfacial energy ratio line then ΔG*c,st < ΔG*c,me and the stable polymorph is predicted. Conversely, where this point falls above any interfacial energy ratio line then ΔG*c,me < ΔG*c,st and the metastable polymorph is predicted.
Processes 07 00272 g003
Table 1. Comparison of Estimated Metastable Zone Width for the Metastable Polymorph and the Predicted Minimum Supersaturation (Sst min) required for the Kinetic Selection of the Metastable Polymorph.
γst/γmeC*me/C*stSst min (C/C*st)Cmszw,me/C*st
1.11.091.81.63
1.153.71.7
1.338.02.0
1.251.221.8
1.542.3
1.882.7
1.51.21.51.9
1.52.52.25
253
2.57.53.8
* Each entry corresponds to a separate polymorph pair characterised by its ratio of interfacial energies (γstme) and ratio of equilibrium solubilities (C *me/C*st); C me * C st * and S st , min for each γ st γ me in Table 1 are obtained from Figure 3.

