Static Light Scattering Monitoring and Kinetic Modeling of Polyacrylamide Hydrogel Synthesis


1
LSRE and Centro de Investigação de Montanha (CIMO), Instituto Politécnico de Bragança, Campus de Santa Apolónia, 5300-253 Bragança, Portugal
2
LSRE-Faculdade de Engenharia da Universidade do Porto, Rua Roberto Frias s/n, 4200-465 Porto, Portugal
*
Author to whom correspondence should be addressed.
Processes 2019, 7(4), 237; https://doi.org/10.3390/pr7040237
Submission received: 15 March 2019
/
Revised: 16 April 2019
/
Accepted: 17 April 2019
/
Published: 24 April 2019
(This article belongs to the Special Issue Modeling, Simulation and Control of Chemical Processes)
Abstract
:A kinetic model describing aqueous acrylamide homopolymerization and copolymerization of acrylamide with methylene bisacrylamide, leading to hydrogel formation, is presented and applied in the simulation of these reaction processes. This modeling approach is based on population balances of generating functions and, besides the crosslinking mechanisms inherent to network formation, other specific kinetic steps important in acrylamide polymerization (e.g., branching due to backbiting) are considered in the simulation tool developed. The synthesis of acrylamide polymers and hydrogels was performed at 26 °C and at 40 °C using two different initiation systems. The formation of such materials was monitored using in-line static light scattering (SLS), and the spatial inhomogeneity of the final hydrogels was also measured using this experimental technique. It is shown that the simulations are helpful in describing information provided by SLS in-line monitoring, namely in the early stages of polymerization with the transition from dilute to semi-dilute regime. Indeed, it finds a plausible match between the critical overlap polymer concentration and gelation, this later leading to the observed spatial heterogeneity of the hydrogels. Usefulness of the kinetic model for defining operation conditions (initial composition, semi-batch feed policies, chain transfer, etc.) in making the shift from gelation to the semi-dilute regime is discussed, and the extension of this approach to processes enabling a higher control of gelation (e.g., controlled radical polymerization) is also prospected.
1. Introduction
Synthetic, water-soluble polymers find many important applications in diverse technological fields. Thickening, emulsification, stabilization, rheology modification, and gelation are operations carried out with aqueous solutions by using water-soluble polymers. Thus, among other applications, these materials are used as flocculants and coagulants in water treatment, film-formers, binders and thickeners (e.g., in pulp and paper industry), and also as special devices in biomedical, pharmaceutical, or cosmetic industries [1].
In particular, polyacrylamide homopolymers and copolymers of high molecular weight (>106 Da) are commonly used in mining, textile, and oil industries (e.g., flocculants, as these materials have the capacity to bind charged particles) [2]. Additionally, polyacrylamide hydrogels (often synthesized with methylene bisacrylamide as crosslinker) are especially important in biomedical and pharmaceutical applications. DNA and protein electrophoresis are probably the most well-known applications of polyacrylamide hydrogels. Also, the use of these materials as controlled release vehicles is being considered in the scientific community.
Structure and properties of polymers are mainly defined during their synthesis process (being an important example of “products-by-process”), and, therefore, polymer reaction engineering plays an important role in tailoring such kinds of products [3]. Indeed, the connection between fundamental kinetic mechanisms that intervene in synthesis and the resulting polymer microstructure can be explored to design production conditions leading to optimized materials. In the present work, these issues are addressed in the framework of polyacrylamide homopolymer and polyacrylamide hydrogel synthesis. A kinetic model, including complex kinetic steps involved in acrylamide homopolymerization (e.g., backbiting) and also the crosslinking mechanisms inherent to hydrogel formation, is developed and tested considering different operation conditions (e.g., with ammonium persulfate/tetramethylethylenediamine initiation at room temperature or with an azo initiator at 40 °C). Additionally, static light scattering (SLS) is used to perform in-line monitoring of polyacrylamide homopolymers and hydrogel synthesis at room temperature, namely at the onset of polymer formation. It is shown that comparison of the observed SLS data with the predictions of the developed kinetic model provides important insights on some polymer formation mechanisms. Moreover, SLS is also used to investigate spatial inhomogeneity of the polyacrylamide hydrogels (produced at room temperature or 40 °C). Spatial inhomogeneity is an important issue with hydrogels because this phenomenon has deleterious effects on the mechanical strength of crosslinked materials and their optical properties [4]. Thus, the tools here described can be helpful to monitor and control the structure of these classes of polymers and gels, namely through the definition of initial recipes, temperature and/or semi-batch monomer feed policies with impact on the crosslinking process, and the concomitant increase of spatial homogeneity of the networks. The ideas here explored can also be extended to investigate the possibility for improvement of gel homogeneity through the use of controlled radical polymerization techniques (e.g., NMRP, ATRP or RAFT polymerization), which is an issue being currently considered in the scientific community.
2. Materials and Methods
2.1. Reagents
Acrylamide (AAm), methylene bisacrylamide (MBAm), ammonium persulfate (APS), tetramethylethylenediamine (TEMED), and thioglycolic acid (TA) were supplied by Sigma-Aldrich (St. Louis, MO, USA). The azo initiator 2,2’-azobis[2-(2-imidazolin-2-yl)propane] dihydrochloride (VA-044) was purchased from Wako Chemicals (Richmond, VA, USA). Millipore water (Milli-Q quality) was used in all the experiments unless otherwise mentioned.
2.2. Static Light Scattering (SLS) Instrument
Static light scattering (SLS) measurements were performed using a DAWN8 + HELEOS λ = 658 nm MALLS detector equipped with a 50 mW linearly polarized GaAs (gallium arsenide) laser. This multiangle laser light scattering instrument allows recording scattered light intensities from eight different angles θ = 32°, 44°, 57°, 72°, 90°, 108°, 126°, and 141°. Considering the refractive index of water for the scattering medium the correspondent scattering vector is Å−1. Through a flow-to-batch conversion kit, this MALLS instrument was used to perform in-line measurements of scattered light intensity during polyacrylamide homopolymer or hydrogel formation, as below described. The same instrument was used to measure scattered light intensity of the final polyacrylamide products prepared in different reaction conditions, namely with VA-044 initiation at T = 40 °C.
2.3. Polymerization with Ammonium Persulfate/Tetramethylethylenediamine (APS/TEMED) and In-Line SLS Monitoring
The following experimental procedure was used with polyacrylamide homopolymer and hydrogel synthesis and simultaneous in-line SLS monitoring: a solution of water, acrylamide, and methylene bisacrylamide at the desired concentrations was degassed with a flow of dry argon for 30 min, and then a required amount was filtered (through a 0.45 µm filter) to a scintillation vial. Afterwards, a prescribed small amount of an aqueous solution containing APS/TEMED was added to the scintillation vial. It was closed, and then it was immediately placed in the batch cell of the MALLS detector for in-line SLS monitoring. Polymerization was allowed to proceed in these conditions, typically for 2 h. During this period, the temperature of the batch cell of the MALLS detector was recorded, and an average value T = 26 °C was most often observed. The scintillation vial was then removed, and the polymerization completed at room conditions up to 24 h. Then, new SLS measurements for the final products were performed and, at this stage, the SLS signals were recorded at different positions (at least three) through the rotation of the scintillation vials between successive measurements. Averaging of the measurements performed at different positions was considered, as below discussed, for comparison with theoretical models.
2.4. Polymerization with VA-044 at T = 40 °C
Polymerizations performed with VA-044 at T = 40 °C followed a similar procedure to that of the above described, up to the formation of the required degassed and filtered aqueous solution containing acrylamide, methylene bisacrylamide, and initiator in the scintillation vial. Then, the vial was placed in a thermostatic oil batch preset to 40 °C. Polymerization was allowed to proceed for 24 h. Afterwards, the vial was equilibrated at room temperature before measuring the SLS signals, and, as above described, different recording positions were considered through the rotation of the scintillation vials between successive measurements.
2.5. Polymerization Conditions Used in the Experimental Runs
The polymerization conditions used in the different experimental runs performed in this work are described in Table 1.
3. Theoretical Background
3.1. Kinetic Modeling of Hydrogel Synthesis through Population Balances of Generating Functions
A general kinetic approach based on population balances of generating functions, previously developed by this research group [5,6,7,8,9,10,11,12,13,14], was here used to describe the synthesis of polyacrylamide homopolymers and hydrogels. In the framework of this method, predictions before and after gelation are possible without the consideration of usual simplifications, namely, pseudo-steady state for radical concentration, closure conditions for the moments, and absence of multiple radicals or multiple pendant double bonds in the same polymer molecule [5,6,7,8,9,10,11,12,13,14]. Besides the prediction of the molecular weight distribution (and the correspondent averages) or of the weight fractions of sol and gel, sequence lengths [11,13] and the average radius of gyration [12,13] can also be computed for non-linear polymers using this kinetic modeling technique. In order to keep this presentation within a manageable size, and taking into consideration the experimental information provided by SLS (as below discussed), only predictions before gelation are provided here. Examples for the analysis of the post-gelation period with this method considering similar hydrogel systems can be found elsewhere [15,16,17].
In Table 2 and Table 3 are presented the sets of chemical groups and chemical reactions here considered for the kinetic modeling of acrylamide (AAm) with methylene bisacrylamide (MBAm). Homopolymerization of acrylamide is a particular case of this scheme obtained by setting the amount of MBAm to zero. Recent studies [2,18] showed that the formation of mid-chain polymer radicals (MCR) due to backbiting plays an important role in the aqueous polymerization of acrylamide. So, besides the usual secondary propagation polymer radicals (SPRs), the less active MCR were also considered in this analysis. Thus, this scheme accounts for the simultaneous formation of nonlinear polymer structures due to crosslinking of MBAm (through pendant double bond polymerization) and branching as consequence of backbiting. Note, however, that in this kind of systems, crosslinking is dominant, compared to branching, even when a relatively small amount of crosslinker is used (see e.g., [19] where crosslinking and branching densities are compared in the framework of acrylate polymerization). The set of chemical groups presented in Table 2 includes also, as usually, the initiator, primary radicals, a chain transfer agent, and an inhibitor/retarder that was considered in order to describe the experimentally observed induction time, as below discussed. Generically, the chemical groups were distinguished by their presence in polymer (, and otherwise) or their activity in chemical reactions (, and otherwise). The set of chemical reactions presented in Table 3 encompasses the different kinetic steps that intervene in the polymerization mechanism, namely, initiator decomposition, initiations, propagations, backbiting, transfer to monomer, transfer to agent, inhibition of radicals, termination by combination, and termination by disproportionation. These steps were discriminated for the different species involved because of their different reactivities, as discussed below, in the framework of the numerical values considered for the involved kinetic parameters. Our kinetic approach [5,6,7,8,9,10,11,12,13,14] is based on the use of generating functions for the number of groups in polymer molecules, which in this case is a six-dimensional distribution, as described by Equation (1). Each dimension corresponds to a chemical group A1 to A6, as described in Table 2. Specifically, is the count of SPR, is the count of pendant double bonds, of MCR, and of polymerized AAm and MBAm units, respectively, and of branching points due to backbiting. Considering the kinetic scheme presented in Table 3, the population balance equation for polymer molecules in the generating function domain is described by Equation (2). This equation can be numerically solved using the method of the characteristics [5,6,7,8,9,10,11,12,13,14]. If predictions of moments before gelation are only sought (as below discussed), an initial value problem would result. However, after gelation, a multidimensional boundary value problem (BVP) should be solved [5,6,7,8,9,10,11,12,13,14]. Note that prediction of chain length distributions (not tackled here) always requires a BVP solution in either situation (before or after gelation) [14].
3.2. Analysis of Gels and Gel Formation Processes by SLS
3.2.1. SLS with Diluted Polymer Solutions
Static light scattering is a standard technique used for the characterization of polymer solutions. Indeed, the structure, size, and shape of polymer molecules can be obtained by measuring the scattering intensity of a diluted polymer solution as a function of the scattering vector. Following the theory of light scattering for solutions at infinitely high dilution and monodisperse scatters of size much smaller than light wavelength (size << ), the following relation can be derived (see e.g., [20,21,22]):
In this equation, represents the Rayleigh ratio (units of length−1), with standing for the intensity of the incident beam, the scattered light intensity at the scattering angle , the volume of the scattering medium, and the distance between the scattering volume and the detector. On the other hand, represents the molecular weight of the scatter (monodisperse polymer molecules) and the respective concentration. When writing Equation (3) in the general form above presented, it is important to note that the parameter depends on the polarization of incident light. For instance, with vertically polarized light , whereas for unpolarized incident light (see e.g., [20,21,22]). Here, is Avogadro’s number, the refractive index increment with respect to , the refractive index of the solvent, and the wavelength of incident light.
However, in practice, one needs to deal with polydisperse mixtures of molecules, the size of which can be higher than and that are present in solutions at finite concentrations. In this case, Equation (3) should be replaced by an equivalent form, taking into account corrections for the concentration effect (solute concentration fluctuations) and dissymmetry resulting from the large size of molecules interfering in light scattering. Equations (4) and (5) below are often used in these conditions:
In these equations, represents the weight-average molecular weight of the polymer, the second virial coefficient, the form factor of the scatter, the z-average radius of gyration for the polymer, and the scattering vector. Note that different form factors can be considered for the scatters in Equation (4), with the Gaussian coil model (with and ), the rigid rod model, and the hard sphere model as the most common functions considered in this context (see e.g., [21]). Equation (5) is the base for the famous Zimm plot [23] that requires extrapolation to and in order to estimate polymer properties. Note that the use of the function corresponding to the Gaussian coil model in Equation (4), considering a power series expansion in , leads to Equation (5) [23].
3.2.2. SLS with Semi-Diluted Polymer Solutions and Gels
In spite of the high relevance of the previous equations in polymer characterization, they cannot be used to describe in-line static light scattering monitoring of soluble polymers or hydrogel formation processes, and they cannot be directly applied to offline analysis of the final products. The question arises because the above described SLS relations are only valid in the diluted regime (with extrapolation to infinite dilution), and much higher polymer concentrations are observed in the common synthesis processes. For instance, with hydrogel formation, the overlap concentration is inevitably surpassed during synthesis in order to allow the formation of a cluster with “infinite” dimensions, leading to total spatial connectivity. Infinite dilution is, thus, impossible with these systems [24]. The polymer concentration in usual processes resulting in the formation of soluble materials is also much higher than , and therefore, the interference between different chains hides their individual molecular features (e.g., and ). In this case, post-dilution of the polymers is needed before SLS analysis [24].
However, in the semi-dilute regime (), the analysis of polymer solutions by SLS reveals the phenomenon usually known as “blob scattering” [25]. This information is being used in the scientific community to describe gel spatial inhomogeneity (also called crosslinking inhomogeneity). Comparison of SLS for a polymer gel and for the analogous polymer solution is often considered within this purpose. Note, however, that several different kinds of inhomogeneities are possible in polymer gels, and some examples are illustrated in Figure 1 (see e.g., refs [24,26,27] for a comprehensive discussion on these issues). Concentration fluctuations are observed both in polymer solutions and in gels. Nevertheless, with polymer solutions, only thermal concentration fluctuations are possible, while in polymer gels, thermal fluctuations and frozen fluctuations (due to crosslinking) take place [24,26,27].
Spatial inhomogeneities in polymer gels, depicted in Figure 1a, are due to spatial variations in crosslinking density, and they generate abnormal light scattering, namely in comparison with a similar polymer solution. Topological inhomogeneities (Figure 1b—representing defects in the network), connectivity inhomogeneities (Figure 1c—dependent on the molecular architecture of the chains), and mobility inhomogeneities (describing the local mobility in the chains [24]) are other kinds of inhomogeneities possible for polymer gels. It is often accepted that SLS can be used to measure spatial inhomogeneity and spatial correlation (mobility inhomogeneity introduced by crosslinks), while topological and connectivity inhomogeneities (dynamic and connectivity correlations, respectively) can only be accessed through dynamic light scattering (DLS) [24,26,27,28,29].
As a consequence of the above described inhomogeneities, different correlation functions were developed to describe the anomalous scattering observed for polymer gels in comparison with the analogous polymer solutions [30,31,32]. Indeed, with polymer gels, light scattering intensities [33] (or the related Rayleigh ratios), small-angle X-ray scattering (SAXS) intensities [34], or small-angle neutron scattering (SANS) [35,36,37] intensities are often described through the sum of the scattered intensity from an analogue polymer solution, , and an excess scattering, :
In swollen gels, polymer concentration is often in the semidilute region, thus, is usually described through a Lorentz function, also named as Ornstein−Zernike function:
with representing the correlation length (blob size) for the polymer in solution. On the other hand, different functions have been considered to describe excess scattering observed with gels , namely another Lorentz function Equation (8), a stretched exponential function Equation (9), or the Debye-Bueche function Equation (10):
In these equations, represents a characteristic length scale of the gel. Functions described by Equations (8)–(10) were introduced to take into account additional fluctuations of the gel and spatial inhomogeneities associated with the solid-like behavior of the gel material, as above discussed. Note that the function in Equation (9) is an extension of the Guinier equation with parameter changing among different kinds of gels (e.g., and are different values reported in the literature). The Debye-Bueche model Equation (10) assumes a two-phase structure of the gel with a sharp boundary, and a second correlation length in the gel is simply considered with the Ornstein−Zernike function Equation (8).
Comparison of experimental SLS data with models described by Equations (6)–(10) was considered in the present work to assess the spatial inhomogeneity of AAm/MBAm hydrogels synthesized in different conditions. Note that this kind of analysis is being also considered in the scientific community to investigate the eventual advantages of reversible deactivated radical polymerization (RDRP) mechanisms (e.g., RAFT, NMRP or ATRP), compared to free radical polymerization (FRP), for the production of more homogeneous gels. Actually, by using scattering techniques [34] or swelling techniques [38], different recent works indicated that RDRP allowed the synthesis of gels with improved spatial homogeneity.
A depiction of such effects is presented in Figure 2, where possible spatial structures of polymer networks, resulting from RDRP and FRP, are compared (see [34]). In Figure 2, two different correlation lengths were considered, and , with representing the size of polymer clusters (regions with high crosslinking density) and the distance between clusters [34]. These parameters are the same involved in Equations (7)–(10) because also represents the correlation length associated with a semidilute polymer solution. It should be stressed that only a few angstroms are expected for the correlation length (e.g., on the order of 10 Å) and, therefore, only SAXS [34] or small-angle neutron scattering (SANS) [35,36,37] reveal such dimensions.
3.2.3. In-Line SLS Monitoring of Polymers and Polymer Gel Formation
In-line SLS monitoring provids some important insights concerning polymer and polymer gel formation, mainly at the very early stages of the reaction processes when the diluted and semi-diluted regimes are observed. The interpretation for the time-change of the SLS signal observed in such polymerization processes was studied in previous works, and a gelation model was proposed [24,39,40]. In Figure 3, possible depictions of different time-stages for linear polymerization are presented as well as for the gel formation process and its impact on SLS intensity (see also [24,39,40]). At the first stage, no change in SLS intensity is observed because there is an induction period without reaction in the monomer solution. Suddenly, polymerization starts and the size of individual molecules or network clusters become large enough to be detected by SLS (as a result of increases in polymer concentration and molecular weight—see Equation (3)). If the overlap polymer concentration () is surpassed [24,39,40], a peak in the scattering signal is observed as consequence of the volume filling with such kinds of individual structures. Thermal concentration fluctuations dominated during this stage. After volume filling with overlapping, the formation of a permanent network or the entanglement of linear chains takes place, and scattering is dominated by local concentration fluctuations. Note that important changes are revealed by light scattering when the overlap concentration is attained and surpassed (see e.g., [21,24,25,39,40,41]). Actually, the characteristic mesh sizes of the permanent gel or of the entangled chains are the correlation dimensions showed by scattering analysis of semi-diluted solutions above (the trace of the individual chains disappears [21,24,25,39,40,41]). In fact, the interchain repulsive effect associated with overlap causes the decreasing of the ‘blob’ size (see Figure 3). Thus, at this stage, a drop in scattering intensity is observed because the correlation dimensions of the permanent arrangements are much smaller than those corresponding to individual structures [21,24,39,40] (due to interchain repulsive effects). However, polymerization proceeded, and fluctuations in scattering intensity could be observed as a consequence of the rearrangement in chain conformations. A plateau is observed after the end of the reaction, and a comparison between scattering for the gels and for the analogous polymer solutions (, as above discussed) allows the estimation of their frozen inhomogeneities [24,39,40]. Important developments concerning the in situ characterization of polymer reactions, namely involving the homopolymerization of acrylamide, were also reported in references [42,43,44]. Indeed, these works showed that time-dependent static light scattering (TDSLS) signatures could be used to describe, experimentally and theoretically, the growing of a polymer population for AAm free radical homopolymerization.
All the issues just discussed are very important for analysis of the dynamics of scattering intensity observed during gel formation, as will be explored in the framework of the in-line SLS monitoring of AAm/MBAm hydrogel synthesis.
4. Results and Discussion
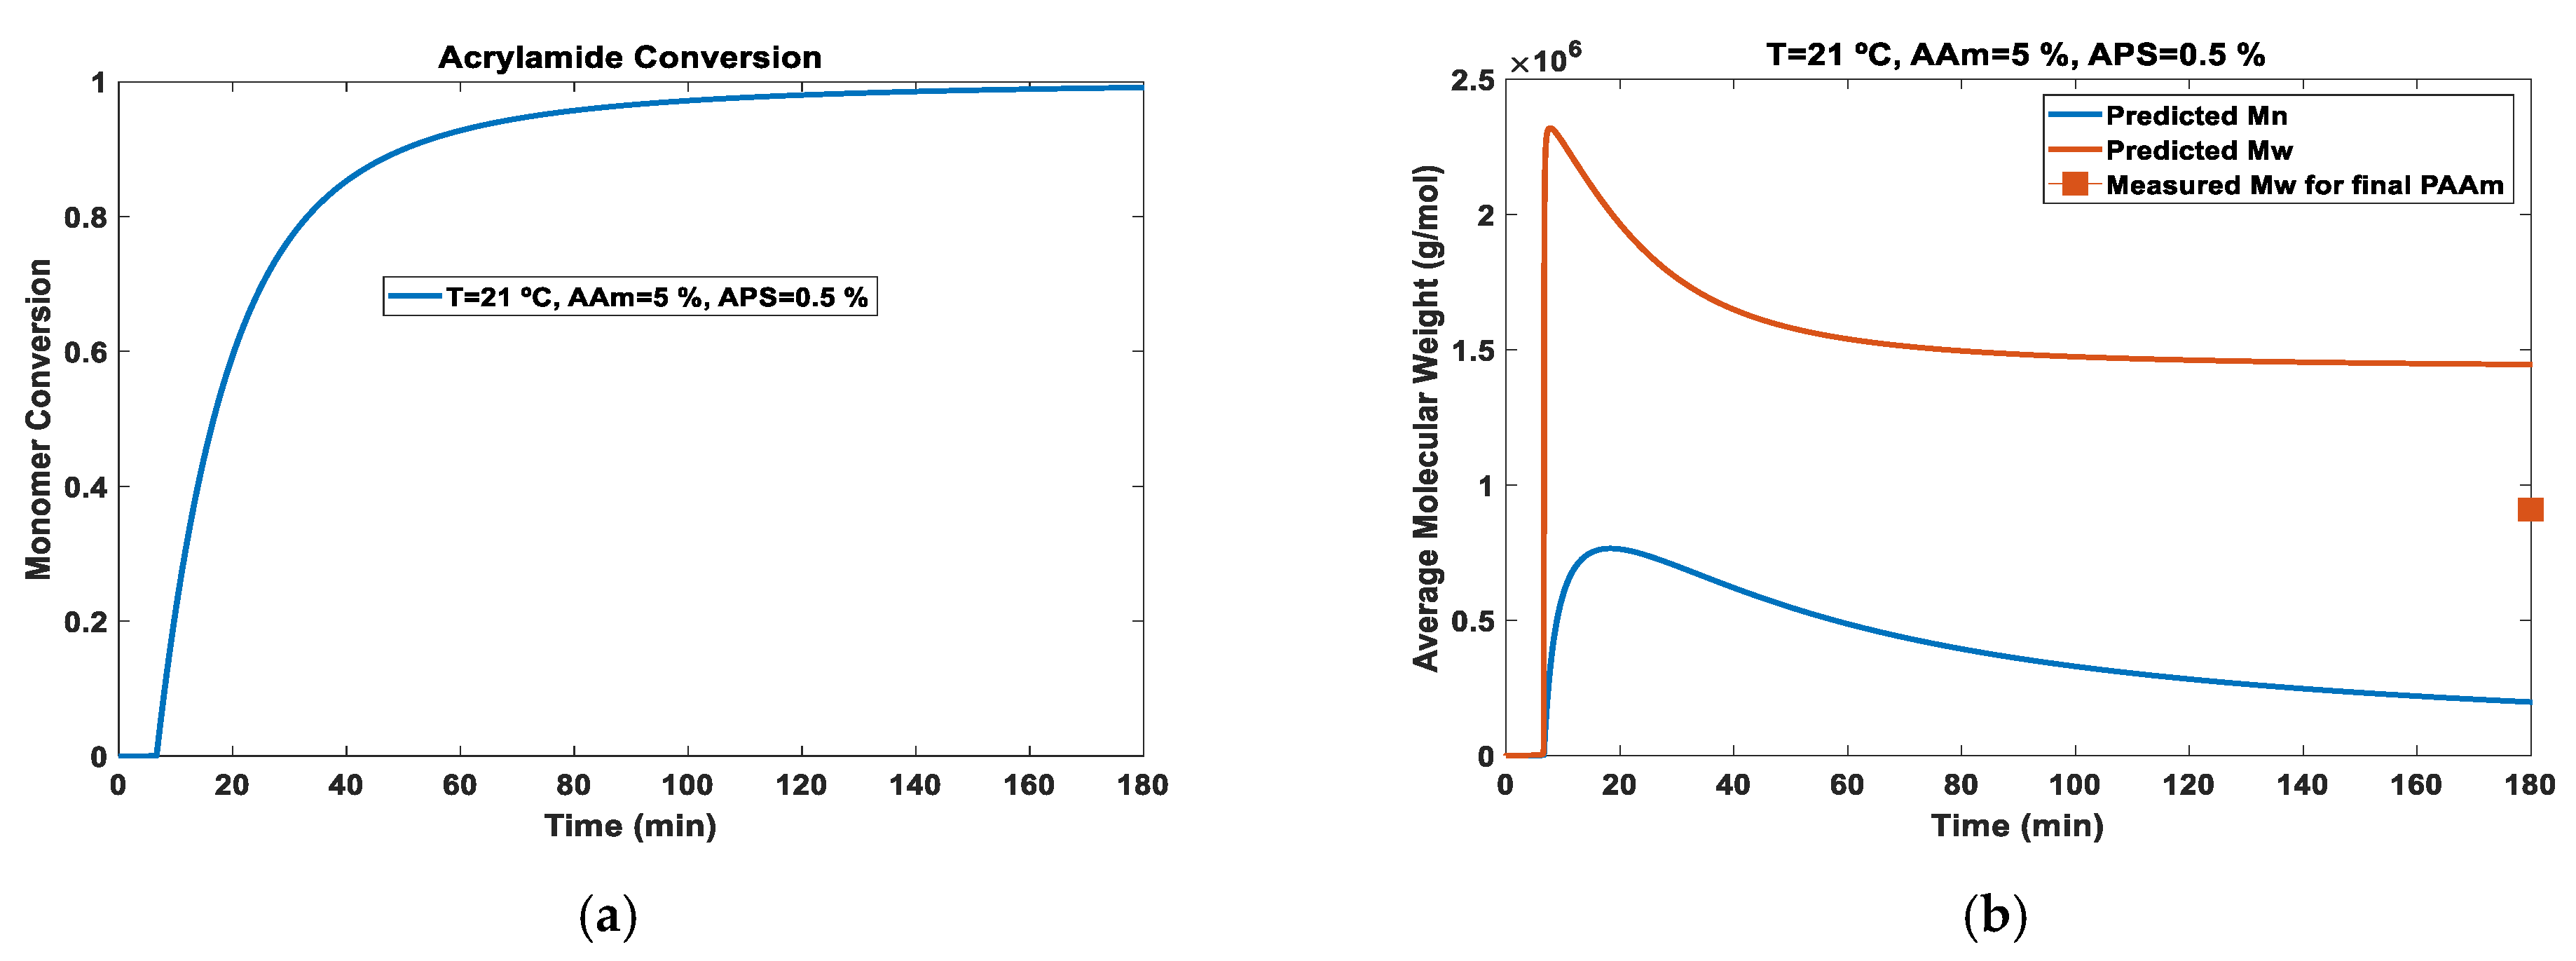
At the first stage, the predictive capabilities of the kinetic model presented for AAm/MBAm copolymerization were assessed, considering the simpler case corresponding to AAm homopolymerization. The experimental conditions reported in [45] (C, 5%, and 0.5%) were used within this purpose, and the measured value for the molecular weight of the final PAAm was also considered for prediction/experimental comparisons ( g/mol was measured in water using light scattering [45]).
Besides the synthesis conditions, and in order to obtain the prediction for the dynamics of polymer properties, the involved rate coefficients must be known (see Table 3). In Table 4 is presented a reference set of kinetic parameters considered along this work in the simulations performed. Critical information concerning the kinetics of aqueous AAm homopolymerization was obtained from previous studies based on the use of the PLP-SEC technique (see references [2,18]). Indeed, rate parameters for the kinetic steps concerning AAm chain propagation, transfer to monomer, several kinds of termination (SPR-SPR, MCR-MCR, and SPR-MCR), backbiting, and addition to MCR (see Table 4) were estimated by these authors [2,18]. Moreover, the changes of these parameters with temperature and with the weight fraction of AAm in water () were determined in these works [2,18], which allowed simulation of the polymerization system in a diverse range of operation conditions.
In Table 4, information concerning the rate parameters needed for the two different initiation systems used in this work (APS/TEMED and VA0-44) is also presented. The kinetics of decomposition for VA0-44 was obtained from the supplier [46]. With APS/TEMED, in the absence of specific data, namely concerning the measurement of catalytic effect of TEMED, the kinetics of decomposition for potassium persulfate in 0.1 M NaOH aqueous solution was taken as reference [47]. Considering experimental information for the induction period and the dynamics of monomer conversion observed in AAm homopolymerization (see [45]), a multiplication factor of 2000 on the reported for potassium persulfate (due to TEMED catalysis) was estimated for operation conditions similar to those considered in the present work, namely at room temperature range.
Note that clear induction periods were experimentally observed in different AAm polymerization experiments, and this effect was here simulated through consideration of the presence of a retarder/inhibitor in the system (, as described in Table 3). The addition rate constants associated with these species are often very high (see chapter 5 in [47] for a comprehensive discussion on these issues), and a value in the range L·mol−1·s−1 was estimated for the systems considered in this work, as discussed below. Chain transfer with thiols was here used as reference (thioglycolic acid was considered as CTA), and near to ideal chain transfer constants () were reported for these compounds with acrylic monomers. These transfer reactions are accelerated in polar solvents, namely in water (see [47], chapter 6).
Considering the absence of polymer at the start of polymerization, Equation (2) is solved with the following initial condition:
If the polymer properties before gelation are only sought (as here explored), Equation (2) is transformed to a set of ordinary differential equations (ODEs) through the method of the characteristics, and an initial value problem (IVP) should be solved [5,6,7,8,9,10,11,12,13,14]. In this work, the function ode15s of MATLAB® was used to solve the systems of ODEs involved in the simulations.
In Figure 4, predictions for the dynamics of monomer conversion and average molecular weights during aqueous polymerization of AAm at C, with 5% and 0.5% (experimental conditions used in ref [45]), are presented. As described above, the main kinetic parameters used in the simulations were those reported in references [2,18] (see Table 4). The rate for APS/TEMED decomposition was estimated (using K2S2O8 data as reference) in order to reproduce the experimental time evolution for monomer conversion reported in [45]. The experimentally observed induction time (around 5 min) was reproduced considering L·mol−1·s−1 and a small concentration of inhibitor/retarder M.
In Figure 4b, besides the predictions for and , the experimentally measured value for the final of the PAAm homopolymer was also plotted [45]. A slight discrepancy was observed between the predicted and measured value, likely resulting from uncertain parameters used in the simulations (note that the parameters proposed in [2,18] were directly used without refitting) or from experimental error associated with the measurement. Indeed, a similar mismatch was also reported in reference [2] when comparing simulations and experimental data from different authors. The use of different experimental conditions for measurement of was pointed out as a possible explanation for these differences [2]. However, the comparison presented in Figure 4b is in a similar deviation range between theory/experiment of the study presented in [2], when the own experimental data of these authors [2,18] were considered. Thus, we decided to use as reference set the kinetic parameters presented in Table 4.
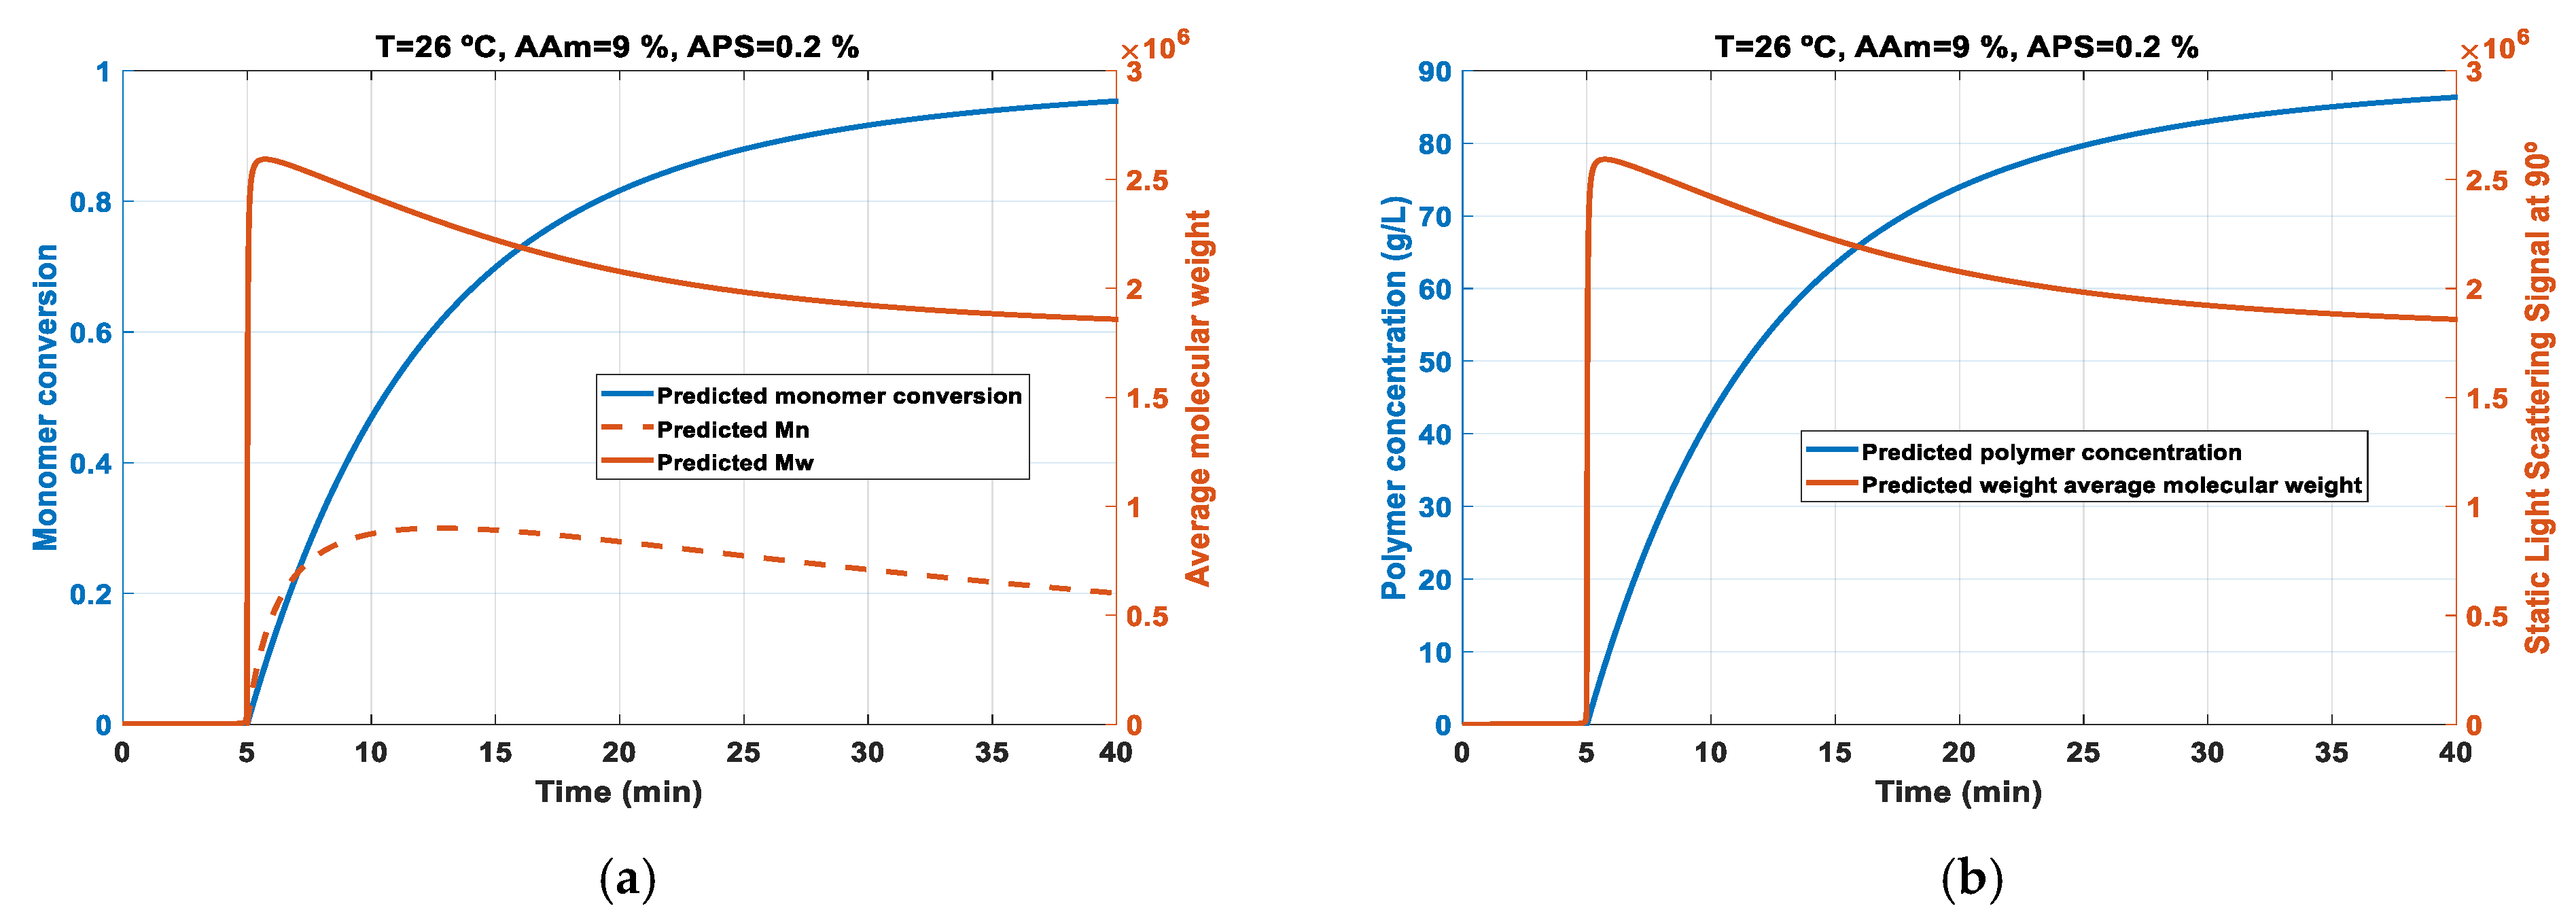
Having demonstrated with independent experimental data that the modeling tools here developed were able to capture the main features of AAm homopolymerization, these principles were applied with experimental systems addressed in this work. In Figure 5, simulations for AAm homopolymerization at C, with 9% and 0.2% (experimental conditions corresponding to L2 in Table 1), are presented. Dynamics for monomer conversion, average molecular weights ( and ), and polymer concentration (expressed in g/L) are presented in these plots. An experimentally observed induction time of around 5 min was reproduced considering in the simulation a concentration of inhibitor/retarder M. Note that the induction time for each experiment performed in this work at room temperature was obtained from light scattering data, recorded with in-line monitoring of polymerizations, as presented in Figure 6 for runs L1 to L4 (see also Table 1).
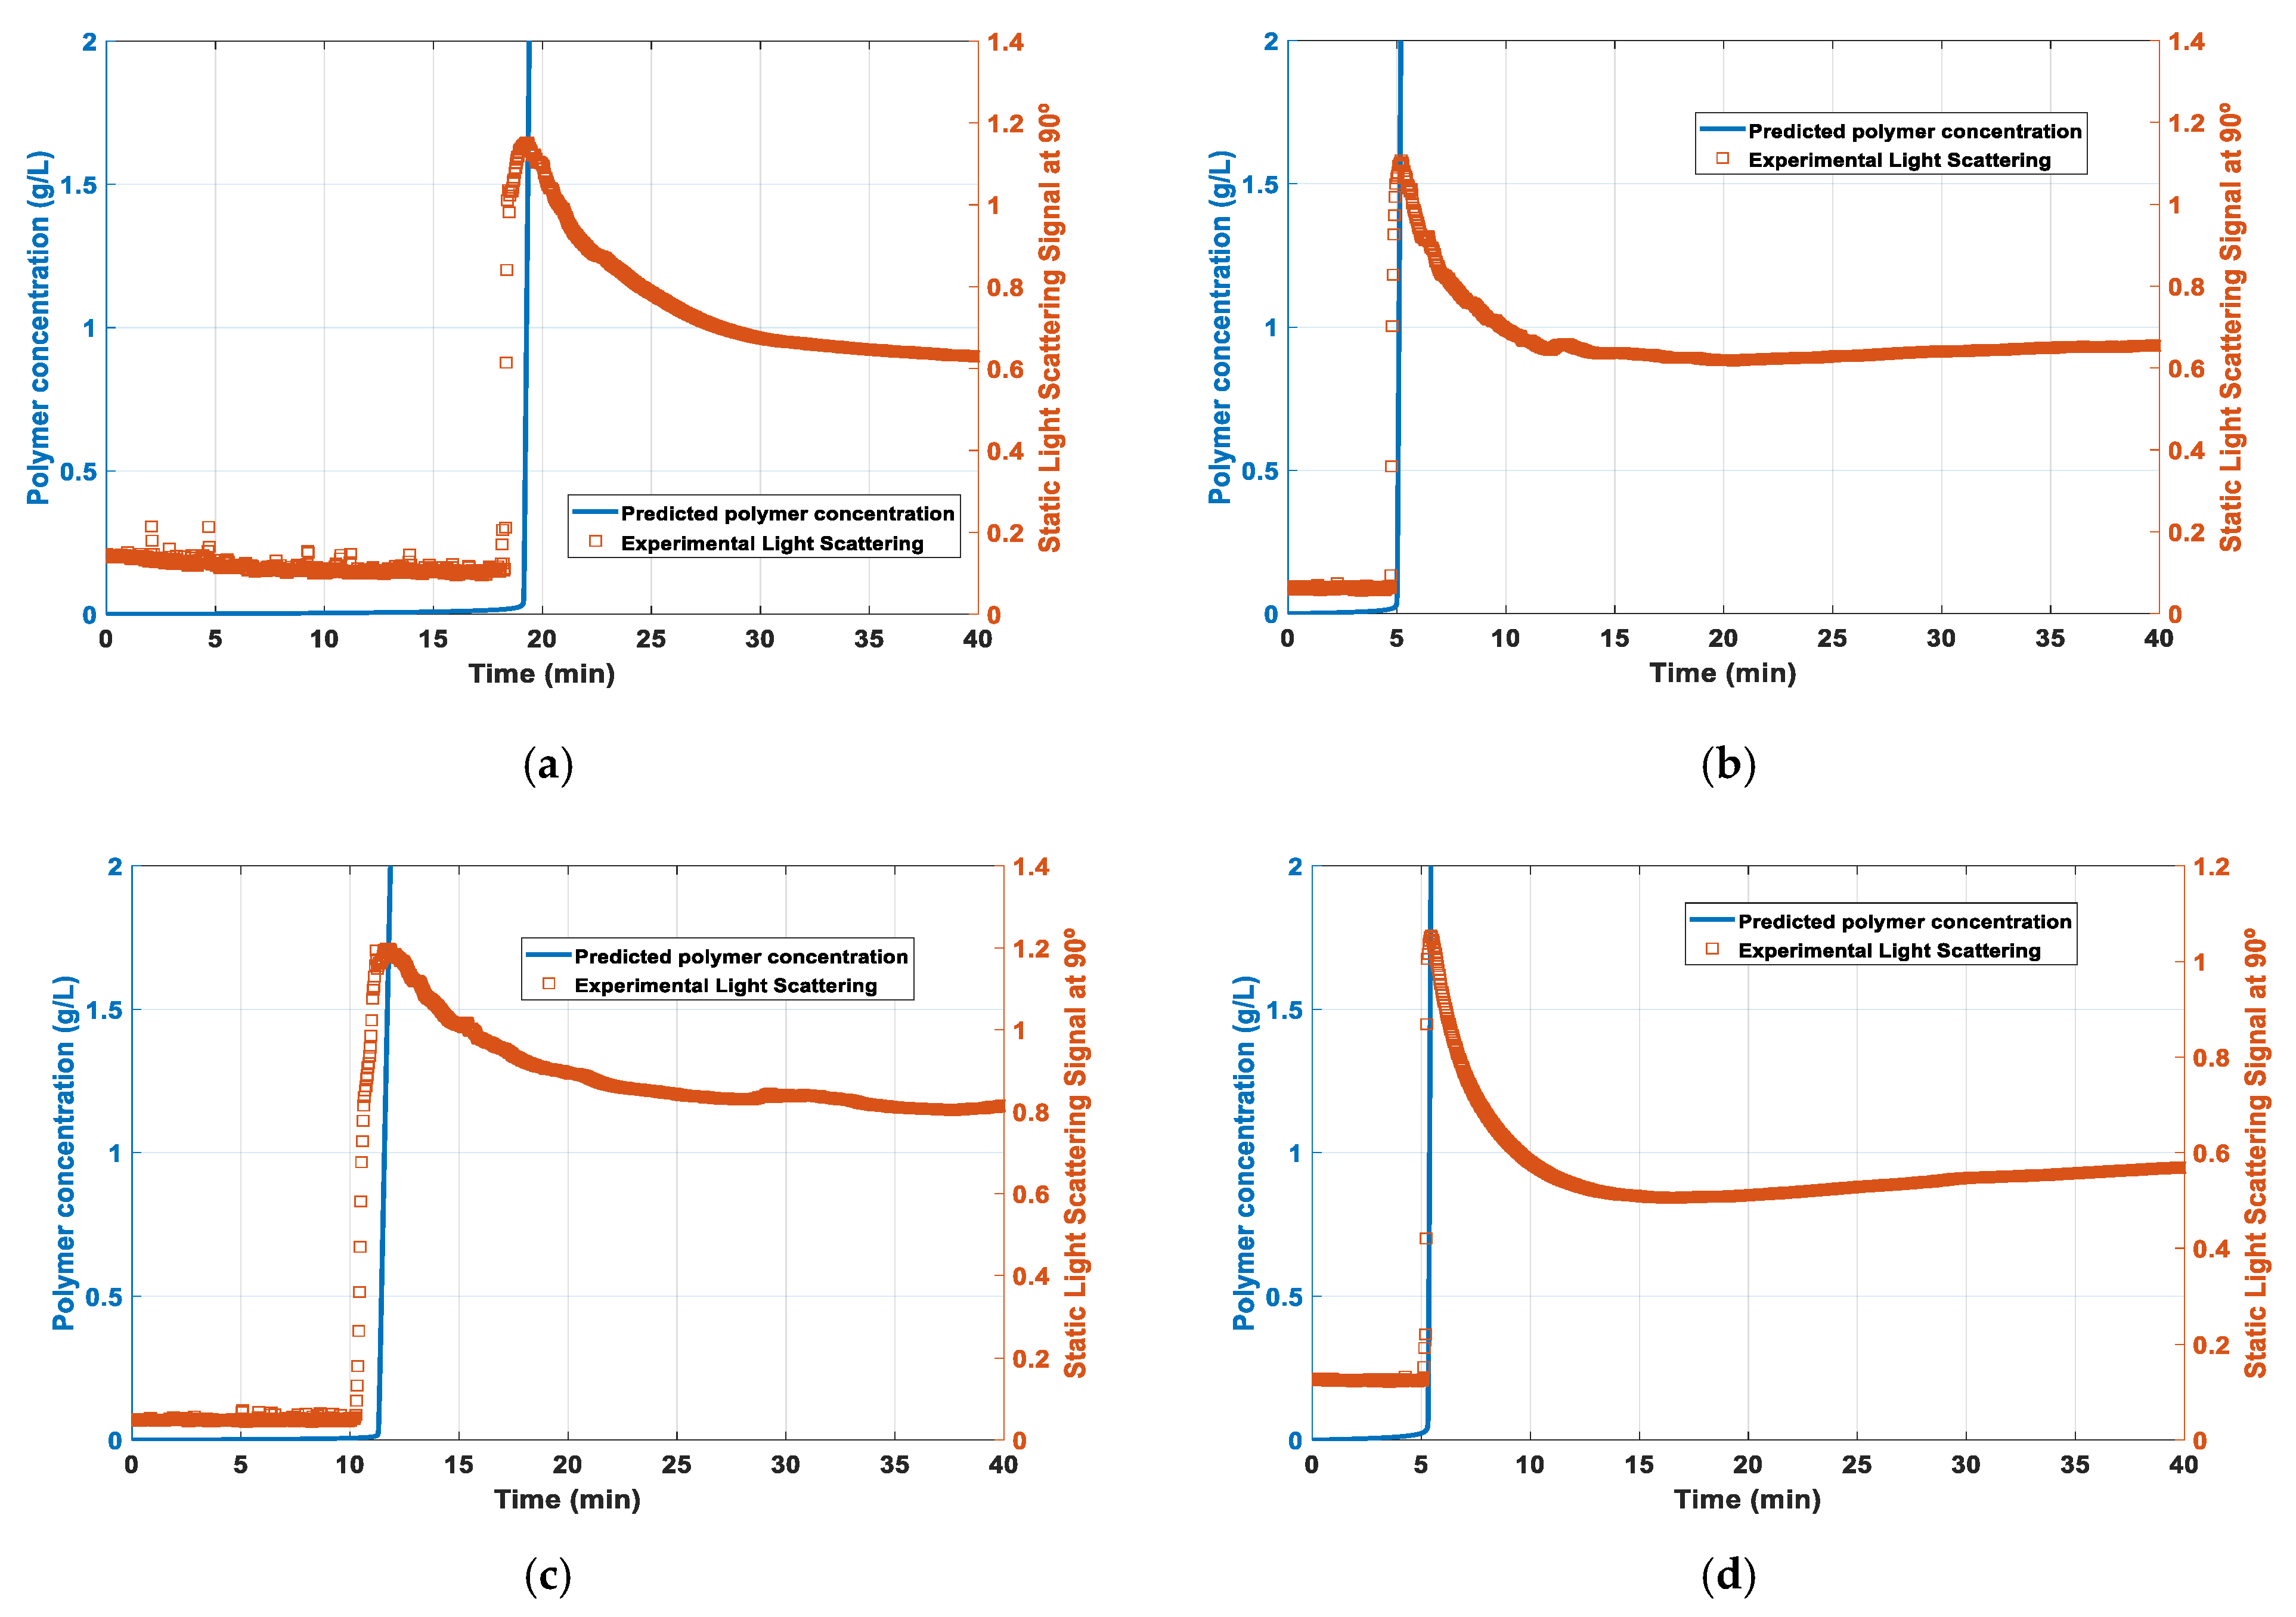
Besides static light scattering data obtained with in-line monitoring of different AAm polymerization runs (the SLS signal of the 90° detector was here selected), in Figure 6, prediction for the time-evolution of the polymer concentration in these experiments is also presented. Knowledge of the polymer concentration helps in interpreting the SLS signal observed during in-line monitoring. Indeed, as discussed in Section 3.2.3, the maximum observed in the scattering curves should correspond to the point at which the polymer concentration in the reaction system equaled the overlap concentration of the system (see also e.g., [45]). These features are highlighted in Figure 6, where, after adjusting the induction time for each run, a very fast rise in the polymer concentration was predicted, and a critical value on the order of 1.7 g/L matched the maximum experimental SLS curves obtained with different experiments. Thus, this value should be close to the critical overlap concentration for PAAm in water, which can be estimated from the relation:
Actually, values for in the range 1.3 to 3.7 g/L were estimated in previous works for the critical overlap concentration of PAAm in water using experimental and values (see [45,48,49]). The comparisons between simulations and the observed SLS peaks, as presented in Figure 6, are consistent with this estimation range.
Having demonstrated the usefulness of the kinetic modeling technique used to deal with homopolymerization of acrylamide when particular branching steps were included, namely backbiting, a more complex system corresponding to simultaneous branching and crosslinking will now be addressed. This was the prevalent case when AAm/MBAm hydrogels were synthesized. Additionally, as performed above with AAm polymerization, comparison between the in-line observed SLS signal and model predictions will be explored to get insights on the crosslinking process.
The key kinetic parameter in a crosslinking process is the reactivity of the pendant double bonds (PDBs) in the associated propagation step. Additionally, propagation of the crosslinker and the initiation of PDBs, or the initiation of the crosslinker (see Table 3), also play important roles in this context. In the most simple case, the reactivity of the PDBs could be assumed to be the same as the monovinyl monomer (thus ), and the similar rules could be used for the remaining parameters (e.g., in the propagation of an “ideal” bifunctional crosslinker). However, different reactivities of the diverse radicals, and carbon–carbon double bonds that participate in the crosslinking process, are often found, namely when compared with the monovinyl monomer. This possibility will also be considered here through the use of a single reactivity ratio:
Thus, describes a constant ratio for the comparison of the reactivity of the MBAm and AAm carbon–carbon double bonds when the same kind of radical is involved, namely SPR, MCR, or primary radicals (see Table 3). In the “ideal” case, .
In Figure 7, results concerning the predicted time-evolution of polymer concentration and average molecular weights, up to gelation, for a typical run performed in this work with AAm/MBAm polymerization are presented. The values C, 9%, 0.5%, and 0.1%, which were the conditions of experiment H1 in Table 1, were here used for illustration purposes. The gelation point was predicted through divergence of the second order or higher moments ( was here selected to show this behavior). A value smaller than 1 shifted the gelation towards a higher polymerization time, but it had a residual effect on the polymer concentration and only changed the location of the sol-gel transition for (see Figure 7a,b). Moreover, the time-evolution for the polymer concentration and monomer conversion in systems with a very low amount of crosslinker (like the hydrogels here addressed) was very similar for the homopolymerization case (AAm polymerization) and the corresponding crosslinking system (AAm/MBAm copolymerization).
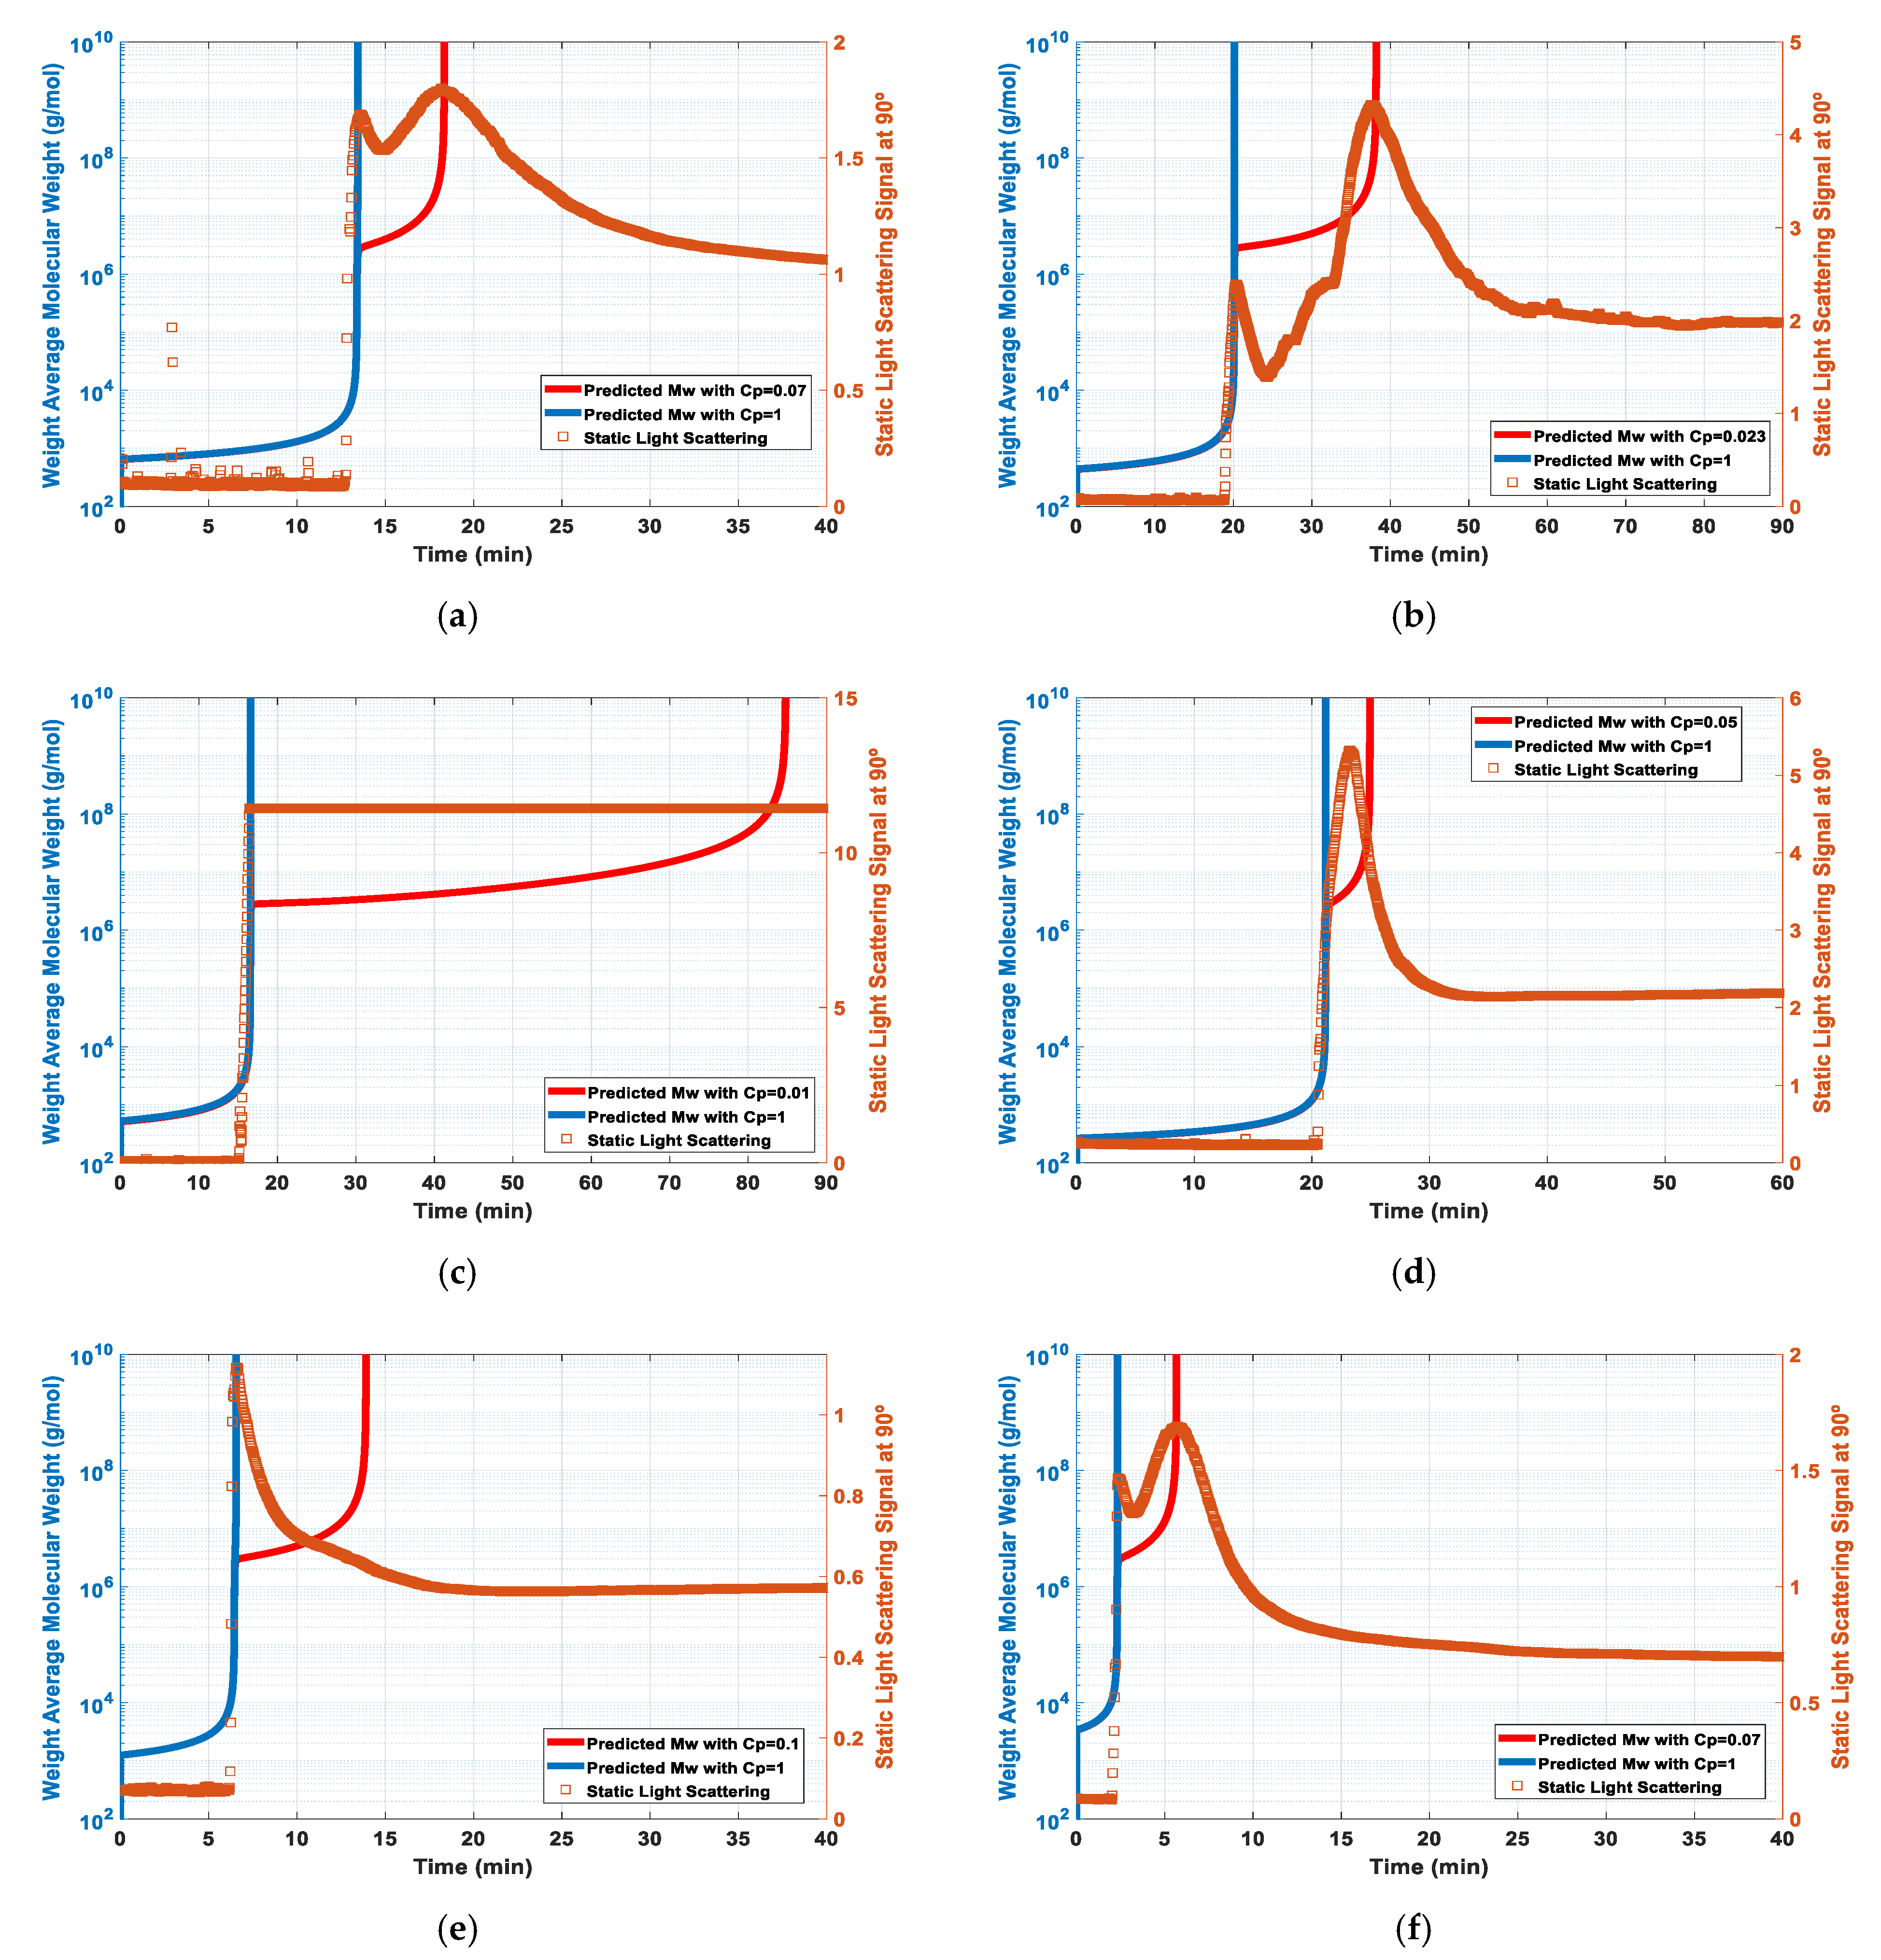
Predictive features (illustrated above) for AAm/MBAm copolymerization were explored with interpretation of the SLS signal experimentally observed during the in-line monitoring of hydrogel formation. Such analysis is illustrated in Figure 8, where the SLS signals measured in the synthesis of different kinds of AAm/MBAm products (runs H1 to H6 in Table 1) were plotted with the predicted dynamics for . To highlight the effect of the reactivity of the pendant double bonds (and associated functional species) on the gel point location, two predictions with different values are presented in these figures (equal reactivity, corresponding to , and systems presenting lower crosslinking reactivity with ). Indeed, it was suggested in previous works that the shift of the gel point comparatively to the critical overlap concentration improves the homogeneity of the gels. [45,48,49,50]. A kind of random crosslinking, in the semi-diluted regime, of pre-formed primary chains should prevail in such circumstances, avoiding the spatial inhomogeneity associated with simultaneous cluster formation and chain overlap (see depiction in Figure 3).
Actually, for AAm/MBAm copolymerization, it was shown that gelation occurred at, or slightly beyond, the maximum point of scattering curves corresponding to the critical overlap concentration () [45,49]. SLS signal and gel point were independently measured in these works. Interestingly, it was shown that the form of the SLS curve and the relation between chain overlap and gelation changed when different synthesis conditions were used. Notably, with the DMA/MBAm system, no significant intensity rise was observed during crosslinking polymerization, and the delay in gelation was proved [45]. The shift of gelation to the semidiluted regime was attributed to the bulky side groups of PDMA chains causing a lower crosslinking reactivity. Thus, improvement of the PAAm hydrogels through the introduction of DMA and NIPA co-monomers was investigated [48]. A positive effect on the homogeneity of the gels was observed as a consequence of the shift of the gel point to later reaction times in comparison to the critical overlap concentration. This delay was ascribed to the steric effects of the side groups of DMA and NIPA in crosslinking, also causing a decrease in termination reactions [48]. Additionally, the change of the initiation system, causing the formation of shorter primary chains and a delay in the gelation point, was also considered to generate more homogeneous AAm-based hydrogels [49]. Moreover, control of the gel point in AAm/MBAm copolymerization through manipulating the reactivity of the crosslinker or its availability using a semi-batch feed policy (eventually regulated by the solubility of the crosslinker in water) was also pointed out as a strategy to tailor the structure of hydrogels [50] (see also [51,52,53] where different chemical systems were addressed).
The studies above described [45,48,49,50] showed that control of gelation was a key point in tailoring hydrogels, and the two simulations presented for each run in Figure 8 highlight the possibility of using the developed modeling tool to get insights on this issue. Indeed, for the systems in Figure 8, the gelation predicted with equal reactivity () matched with the first peak observed in the experimental SLS signal. Considering previous research with AAm/MBAm [45,48,49,50], a close combination between chain overlapping and gelation at this point is plausible, and equal reactivity should therefore prevail in AAm/MBAm copolymerization. The simulations presented in Figure 8 with evidence the possibility to shift the gelation towards the semi-diluted regime, avoiding coexistence with chain overlapping. Note that the change in reactivity of the PDBs was here considered to illustrate this opportunity, but the simulation tool could be used to design other synthesis conditions leading to a similar outcome (e.g., definition of semi-batch feed policies, design of co-monomers composition, or manipulation of the initiation system, as above described).
Besides, a secondary peak on the SLS signal was clearly observed in some of our experiments with the system AAm/MBAm (see Figure 8a,b,f). Such kinds of peaks were not reported in previous related works [45,49], and a value was deliberatively selected in each of our simulations in order to force the match between the prediction of gelation and this maximum of the SLS signal. A very small reactivity of the PDBs was estimated in such circumstances (e.g., ), which suggested that this second SLS maximum is not associated to gelation but eventually to the rearrangement in the gel spatial structure, as above discussed in the framework of the model depicted in Figure 3. Although no independent replicates were conducted in this work with respect to SLS measurements, it is important to emphasize that with in-line SLS, and in spite of the stochastic nature of the phenomena measured, a low enough deviation from the average could be observed when different replicated experiments are performed with controlled conditions (see e.g., [45]).
It is also necessary to stress that a higher temperature (T = 26 °C) was used in our experiments compared to previous works [45,49], which should allow a higher rearrangement of the network during synthesis. On the other hand, notice that saturation of the SLS signal presented in Figure 8c was due to the high crosslinker content used in this run (), leading to a very strong scattering of the gel.
The spatial heterogeneity of the final hydrogels was also studied in our research considering the experimental and theoretical methods described in Section 2.3, Section 2.4, and Section 3.2.3. In Figure 9, typical results observed for in-line SLS monitoring of PAAm homopolymers and of AAm/MBAm hydrogel formation processes are compared. Light scattering measured at different angles (information needed for the spatial heterogeneity assessment) is here presented (the instrument used was equipped with eight scattering detectors). Note a higher scattering signal was measured with the hydrogel compared to the homopolymer, showing the inhomogeneities introduced by the crosslinking process (the excess scattering of the hydrogels, as described in Section 3.2.3). With all runs, the polymerization time = 24 h was considered as a reference for final product formation, and the corresponding scattering data were taken for inhomogeneity evaluation.
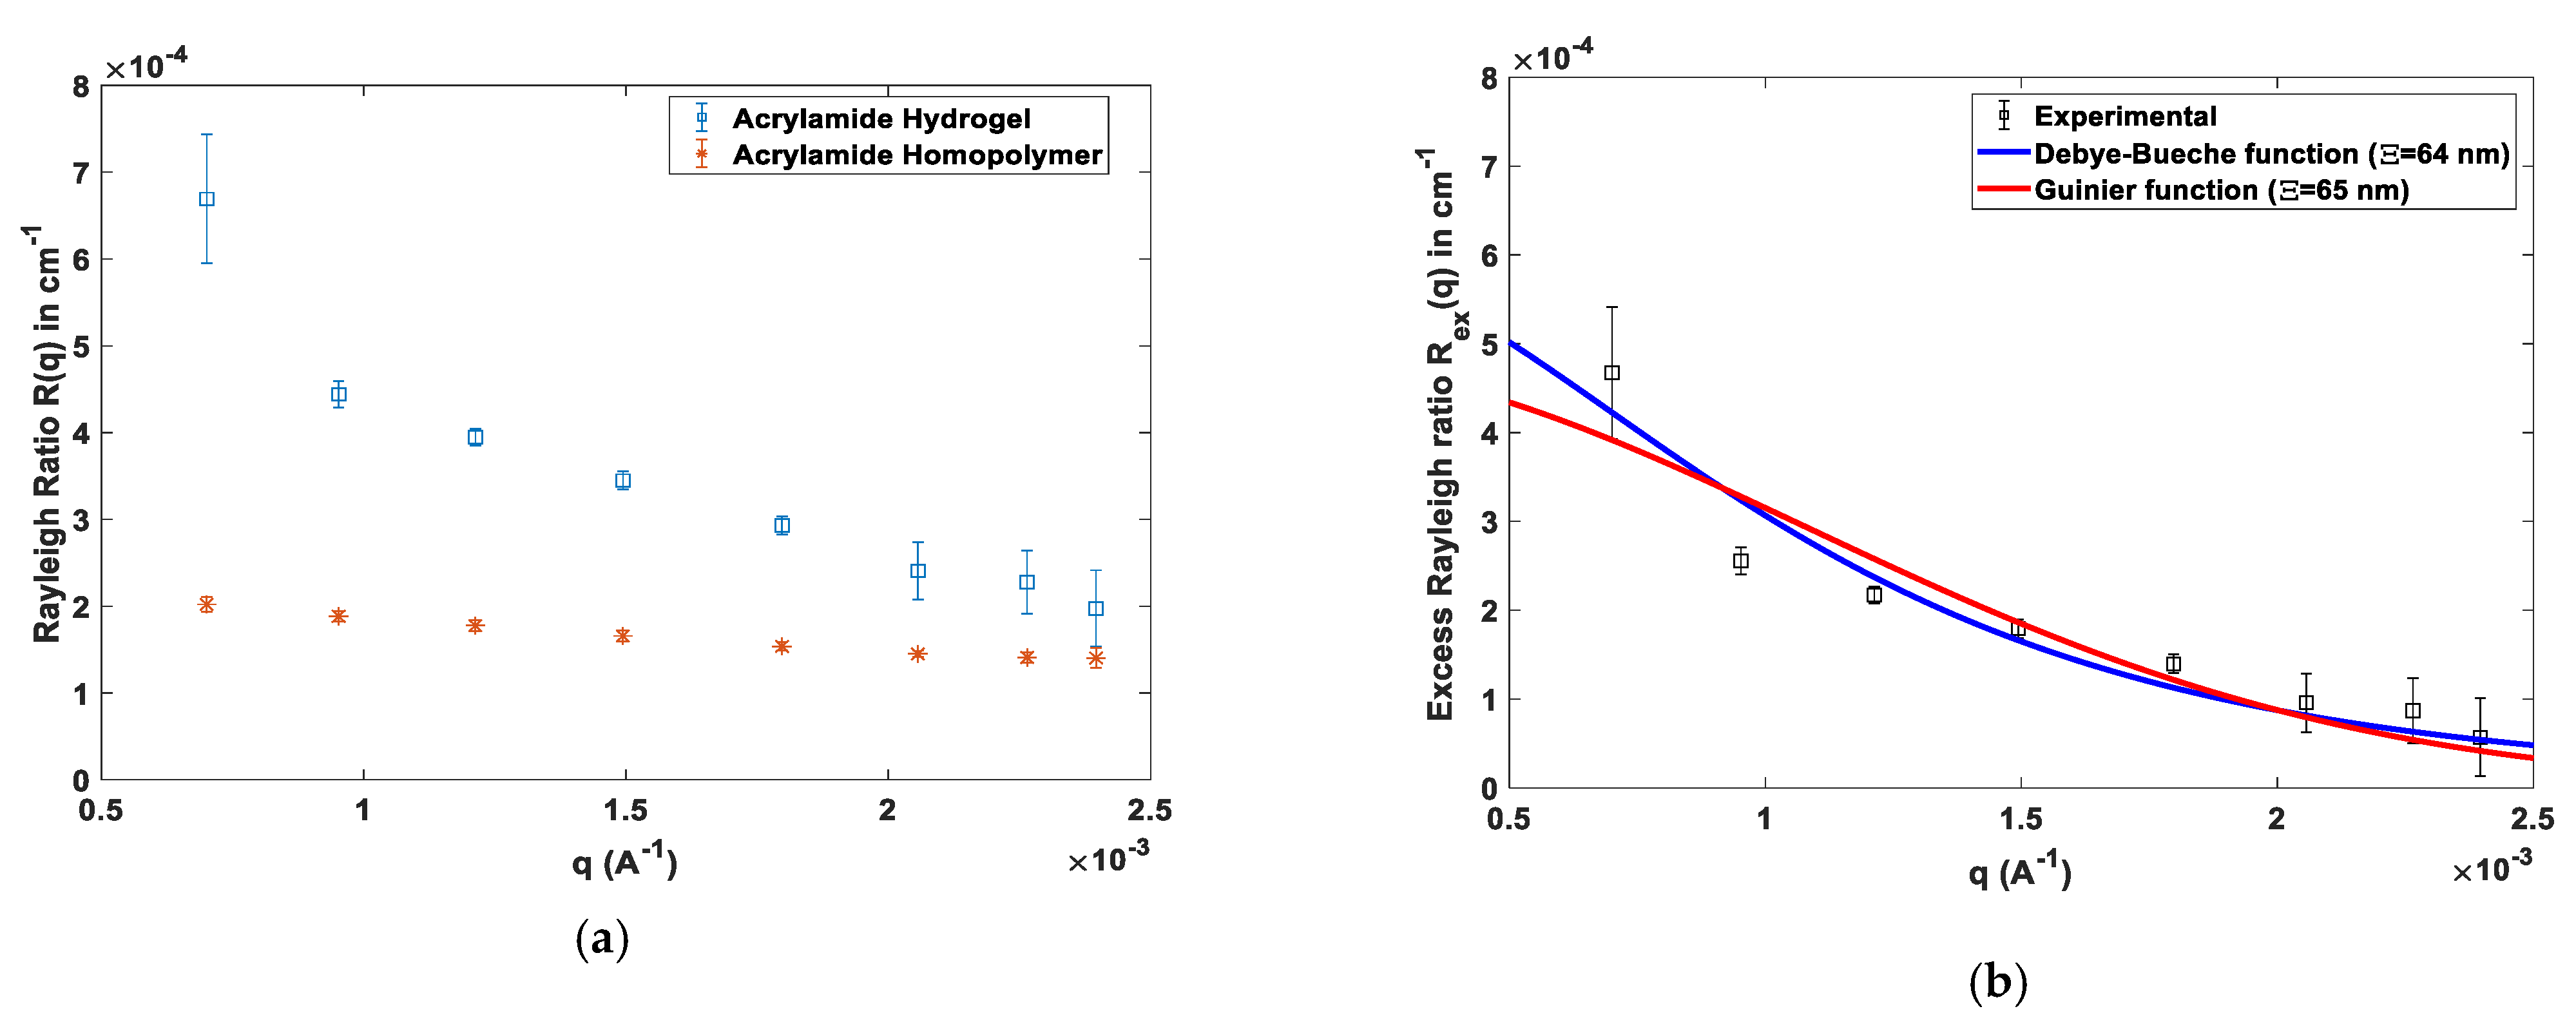
In Figure 10a, Figure 11a, and Figure 12a the comparison of the measured Rayleigh ratios ( in cm−1) is presented at different scattering angles ( in A−1) for the final products obtained in homopolymer and gel synthesis (the pairs H4/L2, H7/L5, and H8/L6 were here selected for illustration purposes). In Figure 10b, Figure 11b, and Figure 12b the associated excess Rayleigh ratios, are presented. Note that analysis of the excess scattering of gels, compared to the analogue homopolymers, is often performed using the Rayleigh ratios instead of the direct intensities (see Equation (6)). In Figure 10b, Figure 11b, and Figure 12b, the fitting of the excess Rayleigh ratios to the Debye-Bueche and Guinier models (see Equations (9) and (10)) is also shown, allowing the estimation of the characteristic length scale of the gel . In Figure 13, similar data for the excess Rayleigh ratios of gels produced with APS/TEMED or VA-044 initiation are presented (see Table 1).
An overview of the estimated correlation lengths associated to the different gels is provided in Table 5. Globally, these results seem to point to the spatial inhomogeneity of the prepared AAm/MBAm hydrogels. Indeed, high correlation lengths were also measured for these kinds of products in some previous works, namely on the order of 30 nm [50]. Moreover, in a very recent work [34], for FRP gels, values of nm were estimated, and this high correlation length was associated with a higher spatial heterogeneity of FRP networks compared to CRP products ( on the order of 17.5 nm was reported for analogous NMRP products [34]).
For hydrogel H3, estimation of was not possible because a high crosslinker content was used that led to a saturation of the SLS signal. Conversely, hydrogel H5 was produced with 0.1% of MBAm (see Table 1), and a negligible difference in the SLS signal was observed compared to the analogous AAm homopolymer.
Note that similar correlation lengths were estimated in our work for hydrogels synthesized with initiation by APS/TEMED or VA-044 (see Table 5), indicating an equivalent degree of spatial heterogeneity for these materials. Actually, simulations presented in Figure 14 for the production of PAAm or AAm/MBAm hydrogels with the two initiation systems showed common dynamics for homopolymer or network development, and the same range of values was predicted for the final properties (e.g., associated with the length of primary chains or a close relation between chain overlapping concentration and gelation).
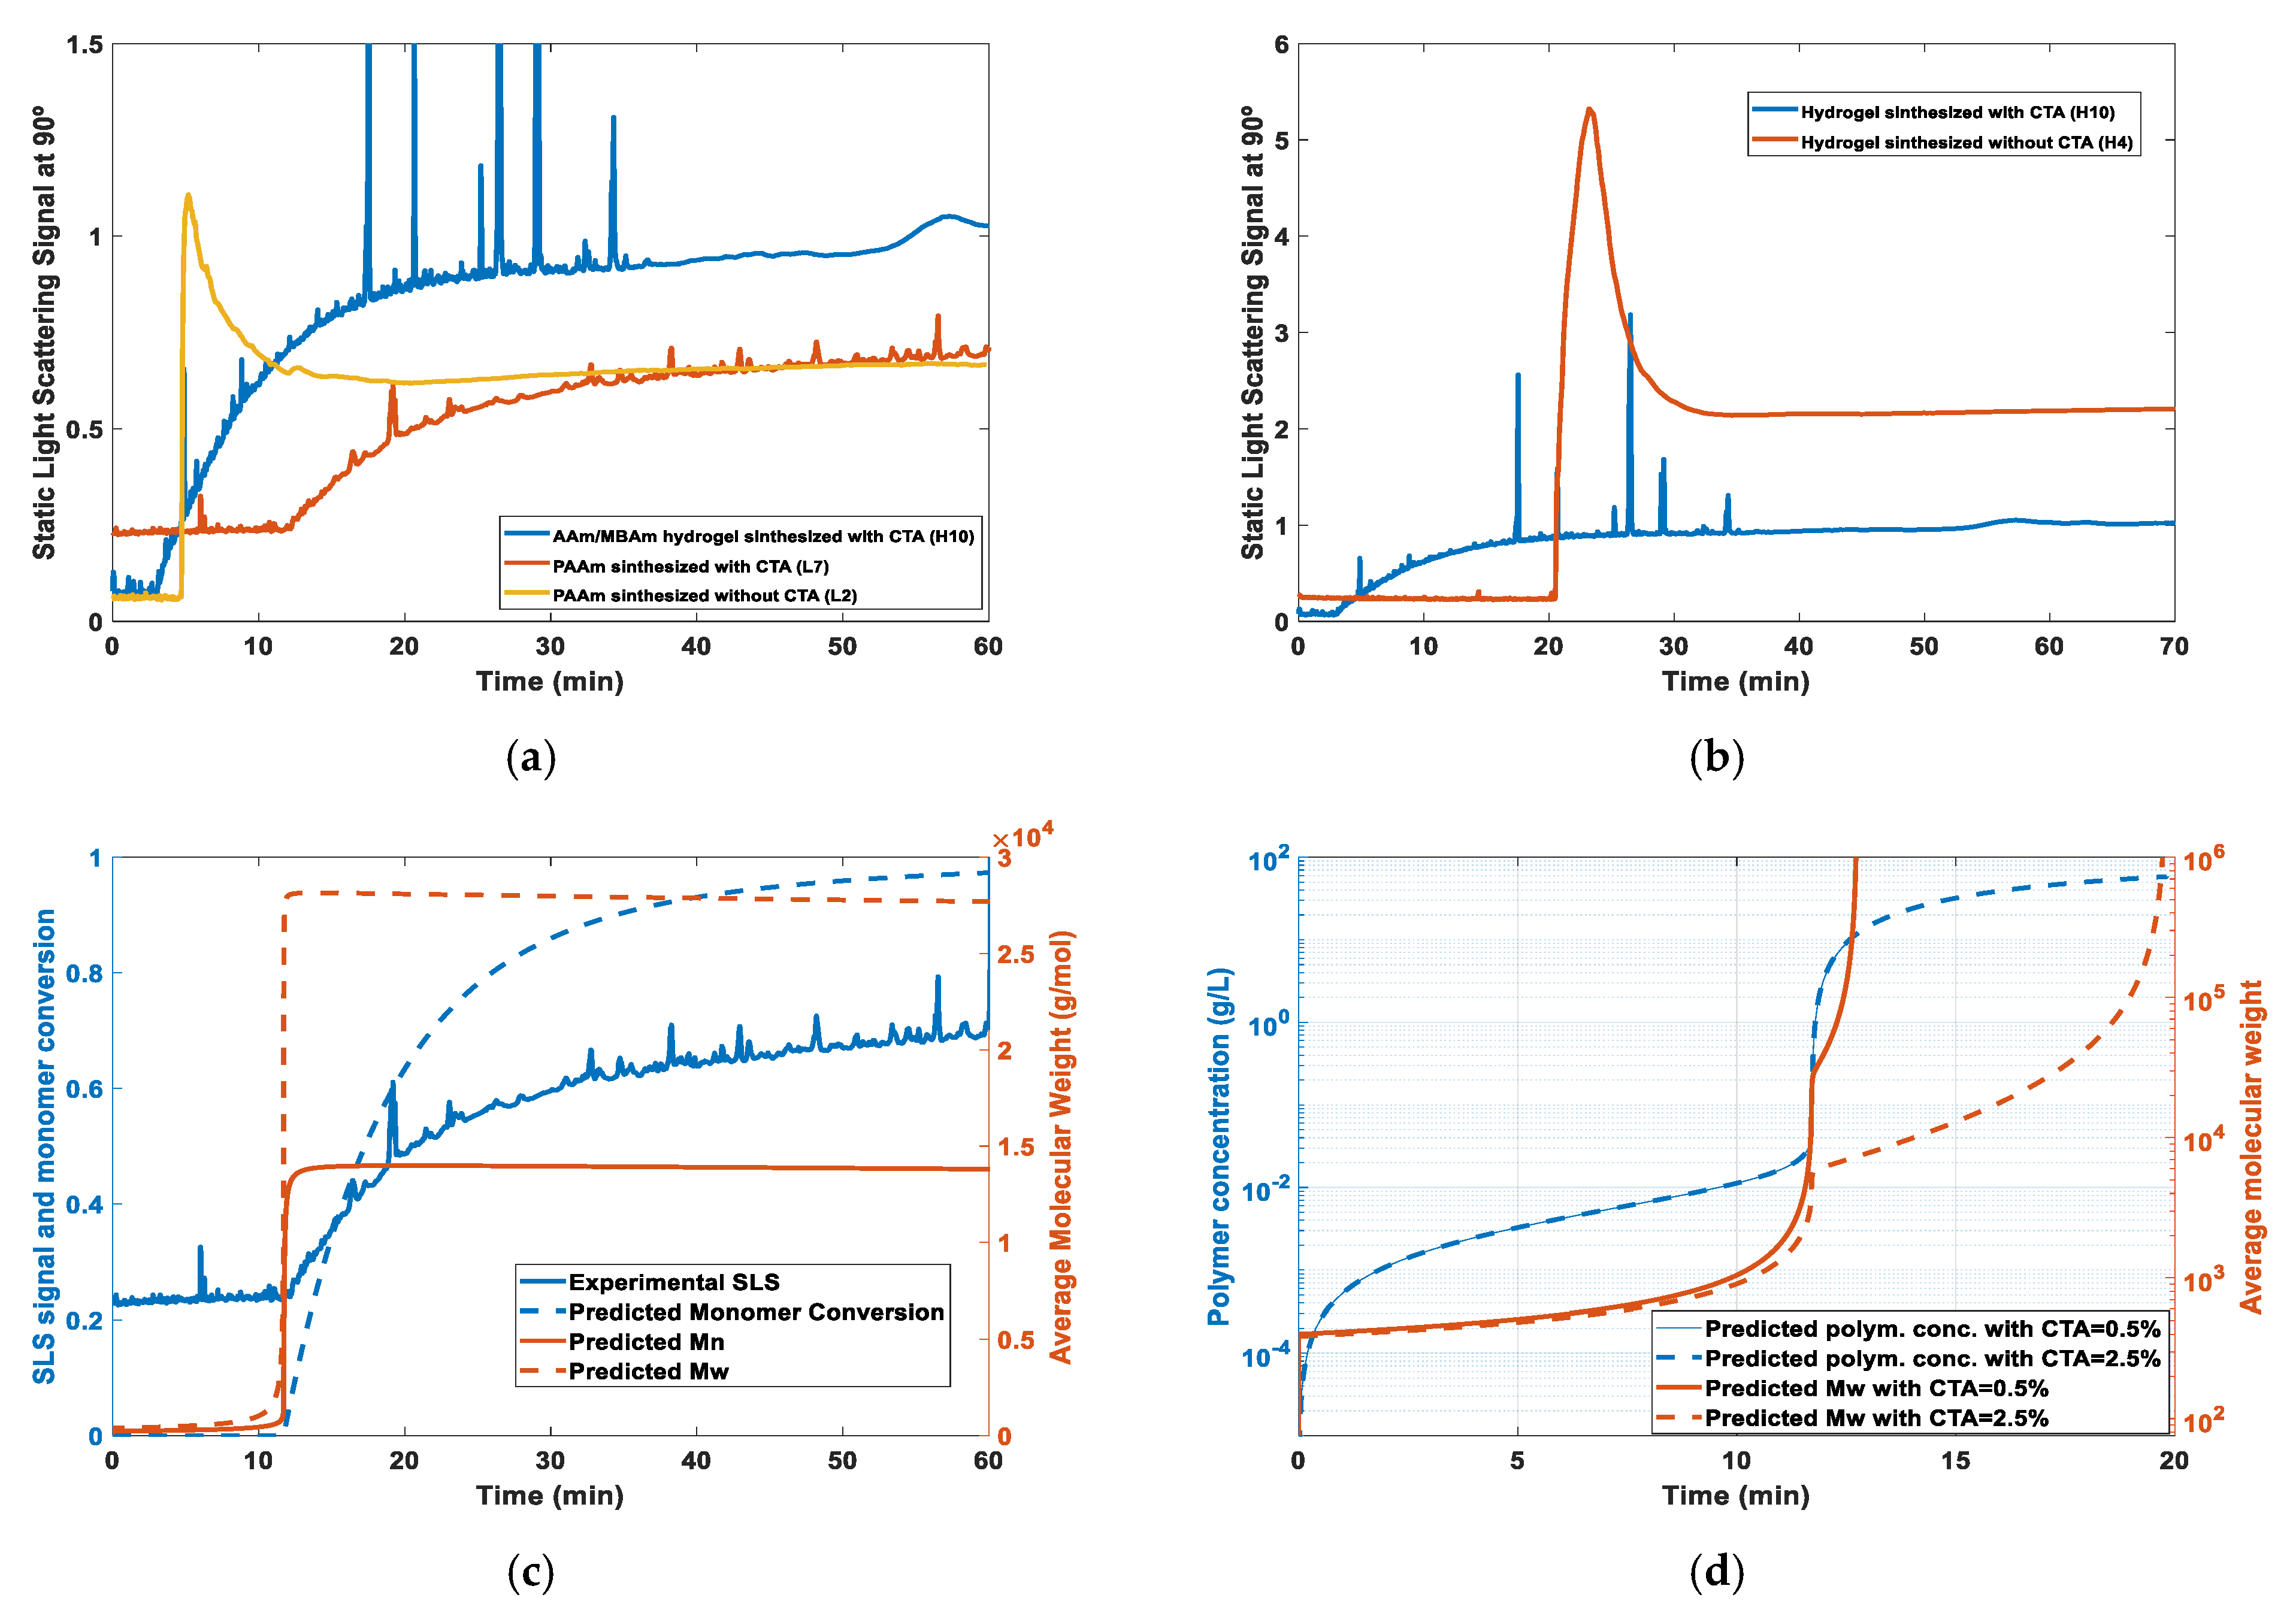
In Figure 15, experimental and theoretical results concerning the synthesis of PAAm homopolymers and AAm/MBAm hydrogels in the presence of a chain transfer agent (thioglycolic acid was used as CTA in this work, as detailed in Table 1) are presented. It is worth to observe the noisy SLS signal measured for experiments in the presence of CTA as a consequence of the higher thermal concentration fluctuations, allowed by the shortening polymer chains (see Figure 15a,b for the comparison of polymerization in the presence/absence of CTA). Thus, the decrease of chain length of the primary polymer chains was achieved using a CTA, and the peak corresponding to the critical overlapping polymer concentration could also be suppressed (Figure 15a,b).
Moreover, simulations for the dynamics of polymerization in the presence of CTA (Figure 15c,d) matched with these experimental observations, namely concerning the huge decrease in average molecular weight of the homopolymer (linked with the primary chain length) achieved with these conditions. Simulations also showed the possibility to shift the gelation point relatively to the abrupt increase in polymer concentration, as highlighted in Figure 15d. Thus, as above discussed, the production of hydrogels with higher spatial homogeneity should be possible with these synthesis conditions.
Current research work is being devoted to measuring effective crosslinking densities in these hydrogels, as well as their swelling and mechanical properties. However, results presented in Figure 15 anticipate promising applications of controlled radical polymerization, namely RAFT, with the current family of hydrogels. Actually, a higher precision in control of the size of primary chains and of the gelation is expected with RDRP compared to FRP, even when the latter is performed in the presence of irreversible CTA. Limited solubility of RAFT agents in aqueous systems and the concomitant need for the use of a co-solvent (e.g., dimethylformamide) are some shortcomings associated with reversible activation–fragmentation chain transfer mechanisms.
Prediction of post-gel properties [5,6,7,8,9,10,11,12,13,14], as well as the average chain length between crosslinking points (these calculations are possible, even after gelation, using the method developed for sequence size predictions [11,13]) are other issues that need to be addressed, namely in the framework of RDRP polymerization techniques.
5. Conclusions
In this work, a kinetic model useful for the description both of the aqueous acrylamide homopolymerization and copolymerization of acrylamide with methylene bisacrylamide was developed. Thus, reaction processes and reactors leading to the formation of polyacrylamide homopolymers or hydrogels can be simulated using this tool. Through the consideration of a modeling approach based on population balances of generating functions, complex kinetic steps such as the crosslinking mechanisms inherent to network formation and branching due to backbiting (important in acrylamide polymerization) were simultaneously accounted for in the simulations. These theoretical developments were accompanied by experimental work that included the synthesis of acrylamide polymers and hydrogels at 26 °C and at 40 °C. Two different initiation systems were used within this purpose, namely APS/TEMED and the thermal initiator VA-044. The formation of acrylamide homopolymers and hydrogels at 26 °C was monitored using in-line static light scattering (SLS), and the spatial inhomogeneity of the final hydrogels was also measured using the same experimental technique. In this work, we show that the simulations provided by the kinetic model are helpful in interpreting the information provided by SLS in-line monitoring, namely in the very beginning of the polymerization. Transition from a dilute to semi-dilute regime is a key point in hydrogel formation, as observed experimentally and confirmed by the theoretical predictions. Actually, a plausible match between the critical overlap polymer concentration and gelation was found, leading to the observed spatial heterogeneity of the polyacrylamide hydrogels. In this work, we also discussed the potential usefulness of the developed kinetic model in defining operation conditions (e.g., prescription of initial composition, semibatch feed policies, initiation system, presence of irreversible chain transfer, etc.), allowing the shift of gelation to the semidilute regime, with a possible decrease of the spatial inhomogeneity of the hydrogels. Results also showed that extending the theoretical and experimental work presented here to controlled radical polymerization should be a promising research line for tailoring hydrogels. Indeed, a higher control of the size of primary chains and gelation is expected with these techniques. Therefore, improved precision in designing these materials can be conceived.
Author Contributions
R.C.S.D. and M.R.P.F.N.C. developed the theoretical part concerning the kinetic modeling of AAm and AAm/MBAm polymerization. C.G. carried out most of the experimental work of this research that was supervised by R.C.S.D. C.G. also produced the first manuscript draft that was revised by R.C.S.D. and M.R.P.F.N.C.
Funding
This research was funded by project AIProcMat@N2020 (NORTE-01-0145-FEDER-000006) and project POCI-01-0145-FEDER-006984—Associate Laboratory LSRE-LCM.
Acknowledgments
This work is a result of project “AIProcMat@N2020—Advanced Industrial Processes and Materials for a Sustainable Northern Region of Portugal 2020”, with the reference NORTE-01-0145-FEDER-000006, supported by Norte Portugal Regional Operational Programme (NORTE 2020), under the Portugal 2020 Partnership Agreement, through the European Regional Development Fund (ERDF) and of Project POCI-01-0145-FEDER-006984—Associate Laboratory LSRE-LCM funded by ERDF through COMPETE2020—Programa Operacional Competitividade e Internacionalização (POCI)—and by national funds through FCT—Fundação para a Ciência e a Tecnologia.
Conflicts of Interest
The authors declare no conflict of interest.
References
- Penlidis, A. Special Issue: Water Soluble Polymers. Processes 2017, 5, 31. [Google Scholar] [CrossRef]
- Preusser, C.; Chovancová, A.; Lacík, I.; Hutchinson, R.A. Modeling the Radical Batch Homopolymerization of Acrylamide in Aqueous Solution. Macromol. React. Eng. 2016, 10, 490–501. [Google Scholar] [CrossRef]
- Asúa, J.M. Polymer Reaction Engineering; Blackwell Publishing: Oxford, UK, 2007; ISBN 978-1-4051-4442-1. [Google Scholar]
- Okay, O. General Properties of Hydrogels. Hydrogel Sensors and Actuators; Gerlach, G., Arndt, K.-F., Eds.; Springer Series on Chemical Sensors and Biosensors 6; Springer: Berlin, Germany, 2009. [Google Scholar] [CrossRef]
- Costa, M.R.; Dias, R.C. A general kinetic analysis of non-linear irreversible copolymerisations. Chem. Eng. Sci. 1994, 49, 491–516. [Google Scholar] [CrossRef]
- Costa, M.R.; Dias, R.C. An improved general kinetic analysis of non-linear irreversible polymerisations. Chem. Eng. Sci. 2005, 60, 423–446. [Google Scholar] [CrossRef]
- Costa, M.R.; Dias, R.C. Prediction of sol fraction and average molecular weights after gelation for non-linear free radical polymerizations using a kinetic approach. Macromol. Theory Simul. 2003, 12, 560–572. [Google Scholar] [CrossRef]
- Dias, R.C.; Costa, M.R. A New Look at Kinetic Modeling of Nonlinear Free Radical Polymerizations with Terminal Branching and Chain Transfer to Polymer. Macromolecules 2003, 36, 8853–8863. [Google Scholar] [CrossRef]
- Dias, R.C.; Costa, M.R. Transient Behavior and Gelation of Free Radical Polymerizations in Continuous Stirred Tank Reactors. Macromol. Theory Simul. 2005, 14, 243–255. [Google Scholar] [CrossRef]
- Dias, R.C.; Costa, M.R. Semi-batch operation and primary cyclization effects in homogeneous free-radical crosslinking copolymerizations. Polymer 2005, 46, 6163–6173. [Google Scholar] [CrossRef]
- Dias, R.C.; Costa, M.R. A General Kinetic Method to Predict Sequence Length Distributions for Non-Linear Irreversible Multicomponent Polymerizations. Polymer 2006, 47, 6895–6913. [Google Scholar] [CrossRef]
- Costa, M.R.; Dias, R.C. Prediction of Mean Square Radius of Gyration of Tree-Like Polymers by a General Kinetic Approach. Polymer 2007, 48, 1785–1801. [Google Scholar] [CrossRef]
- Dias, R.C.; Costa, M.R. Branching and crosslinking in coordination terpolymerizations. Macromol. React Eng. 2007, 1, 440–467. [Google Scholar] [CrossRef]
- Lazzari, S.; Hamzehlou, S.; Reyes, Y.; Leiza, J.R.; Costa, M.R.; Dias, R.C.; Storti, G. Bulk Crosslinking Copolymerization: Comparison of Different Modeling Approaches. Macromol. React. Eng. 2014, 8, 678–695. [Google Scholar] [CrossRef]
- Gonçalves, M.A.D.; Costa, M.R.; Dias, R.C. Modeling Studies on the Synthesis of Superabsorbent Hydrogels Using Population Balance Equations. Macromol. Symp. 2011, 306–307, 107–125. [Google Scholar] [CrossRef]
- Gonçalves, M.A.D.; Pinto, V.D.; Costa, M.R.; Dias, R.C. Polymer Reaction Engineering Studies on Smart Hydrogels Formation. J. Nanostruct. Polym. Nanocompos. 2013, 9, 40–45. [Google Scholar]
- Gomes, C.P.; Costa, M.R.; Dias, R.C. Polymer Reaction Engineering Tools to Tailor Smart and Superabsorbent Hydrogels. In Cellulose-Based Superabsorbent Hydrogels. Polymers and Polymeric Composites: A Reference Series; Mondal, M., Ed.; Springer: Cham, Switzerland, 2019; pp. 513–574. [Google Scholar] [CrossRef]
- Lacík, I.; Chovancová, A.; Uhelská, L.; Preusser, C.; Hutchinson, R.A.; Buback, M. PLP-SEC Studies into the Propagation Rate Coefficient of Acrylamide Radical Polymerization in Aqueous Solution. Macromolecules 2016, 49, 3244–3253. [Google Scholar] [CrossRef]
- Gonçalves, M.A.D.; Pinto, V.D.; Costa, M.R.; Dias, R.C. FTIR-ATR Monitoring and SEC/RI/MALLS Characterization of ATRP Synthesized Hyperbranched Polyacrylates. Macromol. Symp. 2010, 296, 210–228. [Google Scholar] [CrossRef]
- Flory, P.J. Principles of Polymer Chemistry; Cornell University Press: Ithaca, NY, USA, 1953; Chapter VII; ISBN 0-8014-0134-8. [Google Scholar]
- Patterson, G. Physical Chemistry of Macromolecules; CRC Press: Boca Raton, FL, USA, 2007; ISBN 0-8247-9467-2. [Google Scholar]
- Hiemenz, P.C.; Lodge, T.P. Polymer Chemistry, 2nd ed.; CRC Press: Boca Raton, FL, USA, 2007; Chapter 8; ISBN 1-57444-779-3. [Google Scholar]
- Zimm, B.H. Apparatus and Methods for Measurement and Interpretation of the Angular Variation of Light Scattering; Preliminary Results on Polystyrene Solutions. J. Chem. Phys. 1948, 16, 1099–1116. [Google Scholar] [CrossRef]
- Shibayama, M.; Norisuye, T. Gel Formation Analyses by Dynamic Light Scattering. Bull. Chem. Soc. Jpn. 2002, 75, 641–659. [Google Scholar] [CrossRef]
- de Gennes, P.G. Scaling Concepts in Polymer Physics; Cornell University Press: Ithaca, NY, USA, 1979; ISBN 0-08-044286-2. [Google Scholar]
- Shibayama, M. Spatial inhomogeneity and dynamic fluctuations of polymer gels. Macromol. Chem. Phys. 1998, 199, 1–30. [Google Scholar] [CrossRef]
- Shibayama, M. Exploration of Ideal Polymer Networks. Macromol. Symp. 2017, 372, 7–13. [Google Scholar] [CrossRef]
- Shibayama, M.; Okamoto, M. Dynamic light scattering study on gelatin aqueous solutions and gels. J. Chem. Phys. 2001, 4285–4291. [Google Scholar] [CrossRef]
- Shibayama, M.; Ozeki, S.; Norisuye, T. Real-time dynamic light scattering on gelation and vitrification. Polymer 2005, 97, 2381–2388. [Google Scholar] [CrossRef]
- Debye, P.; Bueche, A.M. Light Scattering by an Inhomogeneous Solid. J. Appl. Phys. 1949, 20, 518–525. [Google Scholar] [CrossRef]
- Debye, P.; Anderson, H.R.; Brumberger, H. Scattering by an Inhomogeneous Solid. II. The Correlation Function and Its Application. J. Appl. Phys. 1957, 28, 679–683. [Google Scholar] [CrossRef]
- Bueche, F. Light Scattering from Swollen Gels. J. Colloid Interface Sci. 1970, 33, 61–66. [Google Scholar] [CrossRef]
- Soni, V.K.; Stein, R.S. Light Scattering Studies of Poly(dimethylsi1oxane) Solutions and Swollen Networks. Macromolecules 1990, 23, 5257–5265. [Google Scholar] [CrossRef]
- Mehravar, E.; Agirre, A.; Ballard, N.; van Es, S.; Arbe, A.; Leiza, J.R.; Asua, J.M. Insights into the Network Structure of Cross-Linked Polymers Synthesized via Miniemulsion Nitroxide-Mediated Radical Polymerization. Macromolecules 2018, 51, 9740–9748. [Google Scholar] [CrossRef]
- Wu, W.-L.; Shibayama, M.; Roy, S.; Kurokawa, H.; Coyne, L.D.; Nomura, S.; Stein, R.S. Physical Gels of Aqueous Poly(vinyl alcohol) Solutions: A Small-Angle Neutron-Scattering Study. Macromolecules 1990, 23, 2245–2251. [Google Scholar] [CrossRef]
- Shibayama, M.; Tanaka, T. Small angle neutron scattering study on poly(N isopropyl acrylamide) gels near their volume-phase transition temperature. J. Chem. Phys. 1992, 97, 6829–6841. [Google Scholar] [CrossRef]
- Horkay, F.; Hecht, A.-M.; Geissler, E. Small Angle Neutron Scattering in Poly(viny1 alcohol) Hydrogels. Macromolecules 1994, 27, 1795–1798. [Google Scholar] [CrossRef]
- Pérez-Salinas, P.; Jaramillo-Soto, G.; Rosas-Aburto, A.; Vázquez-Torres, H.; Bernad-Bernad, M.J.; Licea-Claverie, Á.; Vivaldo-Lima, E. Comparison of Polymer Networks Synthesized by Conventional Free Radical and RAFT Copolymerization Processes in Supercritical Carbon Dioxide. Processes 2017, 5, 26. [Google Scholar] [CrossRef]
- Norisuye, T.; Shibayama, M.; Nomura, S. Time-resolved light scattering study on the gelation process of poly(N-isopropylacrylamide). Polymer 1998, 39, 2769–2775. [Google Scholar] [CrossRef]
- Norisuye, T.; Takeda, M.; Shibayama, M. Cluster-Size Distribution of Cross-Linked Polymer Chains across the Gelation Threshold. Macromolecules 1998, 31, 5316–5322. [Google Scholar] [CrossRef]
- Francis, R.S.; Patterson, G.D.; Kim, S.H. Liquid-like structure of polymer solutions near the overlap concentration. J. Polym. Sci. Part B Polym. Phys. 2006, 44, 703–710. [Google Scholar] [CrossRef]
- Giz, A.; Çatalgil-Giz, H.; Alb, A.; Brousseau, J.-L.; Reed, W.F. Kinetics and Mechanisms of Acrylamide Polymerization from Absolute, Online Monitoring of Polymerization Reaction. Macromolecules 2001, 34, 1180–1191. [Google Scholar] [CrossRef]
- Alb, A.M.; Mignard, E.; Drenski, M.F.; Reed, W.F. In Situ Time-Dependent Signatures of Light Scattered from Solutions undergoing Polymerization Reactions. Macromolecules 2004, 37, 2578–2587. [Google Scholar] [CrossRef]
- Drenski, M.F.; Mignard, E.; Alb, A.M.; Reed, W.F. Simultaneous in-Situ Monitoring of Parallel Polymerization Reactions Using Light Scattering; A New Tool for High-Throughput Screening. J. Comb. Chem. 2004, 6, 710–716. [Google Scholar] [CrossRef]
- Orakdogen, N.; Kizilay, M.Y.; Okay, O. Suppression of inhomogeneities in hydrogels formed by free-radical crosslinking copolymerization. Polymer 2005, 46, 11407–11415. [Google Scholar] [CrossRef]
- Wako-Chemicals. Available online: https://www.wako-chemicals.de/en/product/va-044 (accessed on 30 January 2019).
- Moad, G.; Solomon, D.H. The Chemistry of Radical Polymerization, 2nd ed.; Elsevier: Amsterdan, The Netherlands, 2006; ISBN 0-08-044286-2. [Google Scholar]
- Kuru, E.A.; Orakdogen, N.; Okay, O. Preparation of homogeneous polyacrylamide hydrogels by free-radical crosslinking copolymerization. Eur. Polym. J. 2007, 43, 2913–2921. [Google Scholar] [CrossRef]
- Orakdogen, N.; Okay, O. Influence of the Initiator System on the Spatial Inhomogeneity in Acrylamide-Based Hydrogels. J. Appl. Polym. Sci. 2007, 103, 3228–3237. [Google Scholar] [CrossRef]
- Abdurrahmanoglu, S.; Okay, O. Preparation of Homogeneous Hydrogels by Controlling the Crosslinker Reactivity and Availability. J. Macromol. Sci. Part A Pure Appl. Chem. 2008, 45, 769–775. [Google Scholar] [CrossRef]
- Yazici, I.; Okay, O. Spatial inhomogeneity in poly(acrylic acid) hydrogels. Polymer 2005, 46, 2595–2602. [Google Scholar] [CrossRef]
- Boyko, V.; Richter, S. Monitoring of the Gelation Process on a Radical Chain Cross-Linking Reaction Based on N-Vinylcaprolactam by Using Dynamic Light Scattering. Macromol. Chem. Phys. 2004, 205, 724–730. [Google Scholar] [CrossRef]
- Lesturgeon, V.; Nicolai, T.; Durand, D. Dynamic and static light scattering study of the formation of cross-linked PMMA gels. Eur. Phys. J. 1999, B9, 71–82. [Google Scholar] [CrossRef]
Figure 1.
Depiction of some possible frozen inhomogeneities often found in polymer gels: (a) spatial inhomogeneities, (b) topological inhomogeneities, and (c) connectivity inhomogeneities (scheme adapted from [24] with the publisher’s permission).
Figure 1.
Depiction of some possible frozen inhomogeneities often found in polymer gels: (a) spatial inhomogeneities, (b) topological inhomogeneities, and (c) connectivity inhomogeneities (scheme adapted from [24] with the publisher’s permission).

Figure 2.
Depiction of plausible spatial inhomogeneities observed with (a) reversible deactivated radical polymerization (RDRP) polymerization and (b) free radical polymerization (FRP) polymerization (scheme adapted from [34] with the publisher’s permission).
Figure 2.
Depiction of plausible spatial inhomogeneities observed with (a) reversible deactivated radical polymerization (RDRP) polymerization and (b) free radical polymerization (FRP) polymerization (scheme adapted from [34] with the publisher’s permission).

Figure 3.
Depiction of different time-stages in linear polymerization and gel formation processes and their impact on static light scattering (SLS) intensity (scheme adapted from [24,39,40] with the publisher’s permission).

Figure 4.
Predicted monomer conversion (a) and average molecular weights (b) for aqueous acrylamide polymerization at °C (the remaining simulation conditions are the same described in [45], namely 5% and 0.5%). Main kinetic parameters used in the simulations are those reported in [2,18], and the decomposition rate for APS/TEMED was estimated in order to reproduce the time evolution for monomer conversion reported in [45] (see Table 4). For comparison purposes, the measured value for reported in [45] was also included in plot (b).

Figure 5.
Predicted time-evolution of monomer conversion, polymer concentration, and average molecular weights for a typical run performed in this work concerning acrylamide polymerization with APS/TEMED initiation. (a) Monomer conversion, and . (b) Polymer concentration (g/L) and . The detailed experimental conditions correspond to product L2 in Table 1.

Figure 6.
Predicted time-evolution of polymer concentration (g/L) and in-line measured static light scattering signal (the 90° detector is here considered) for polyacrylamide synthesis at different starting conditions. (a) homopolymer L1, (b) L2, (c) L3, and (d) L4 (see Table 1).
Figure 6.
Predicted time-evolution of polymer concentration (g/L) and in-line measured static light scattering signal (the 90° detector is here considered) for polyacrylamide synthesis at different starting conditions. (a) homopolymer L1, (b) L2, (c) L3, and (d) L4 (see Table 1).

Figure 7.
Predicted time-evolution of polymer concentration and average molecular weights up to gelation for a typical run performed in this work concerning AAm/MBAm polymerization with APS/TEMED initiation ( 9%, 0.5%, and 0.1%). (a) Polymer concentration (g/L) and considering two different values for the reactivity of the pendant double bonds (). (b) and up to gelation considering two values for .

Figure 8.
Predicted time-evolution of weight-average molecular weight () and in-line measured static light scattering signal during AAm/MBAm hydrogel formation. Predictions considering two different values for the reactivity of the pendant double bonds () are here compared. (a) hydrogel H1, (b) H2, (c) H3, (d) H4, (e) H5, and (f) H6 (see Table 1).

Figure 9.
Typical results concerning the in-line static light scattering monitoring of polyacrylamide homopolymers and hydrogel formation processes. (a) Homopolymer L4. (b) Hydrogel H6.
Figure 9.
Typical results concerning the in-line static light scattering monitoring of polyacrylamide homopolymers and hydrogel formation processes. (a) Homopolymer L4. (b) Hydrogel H6.
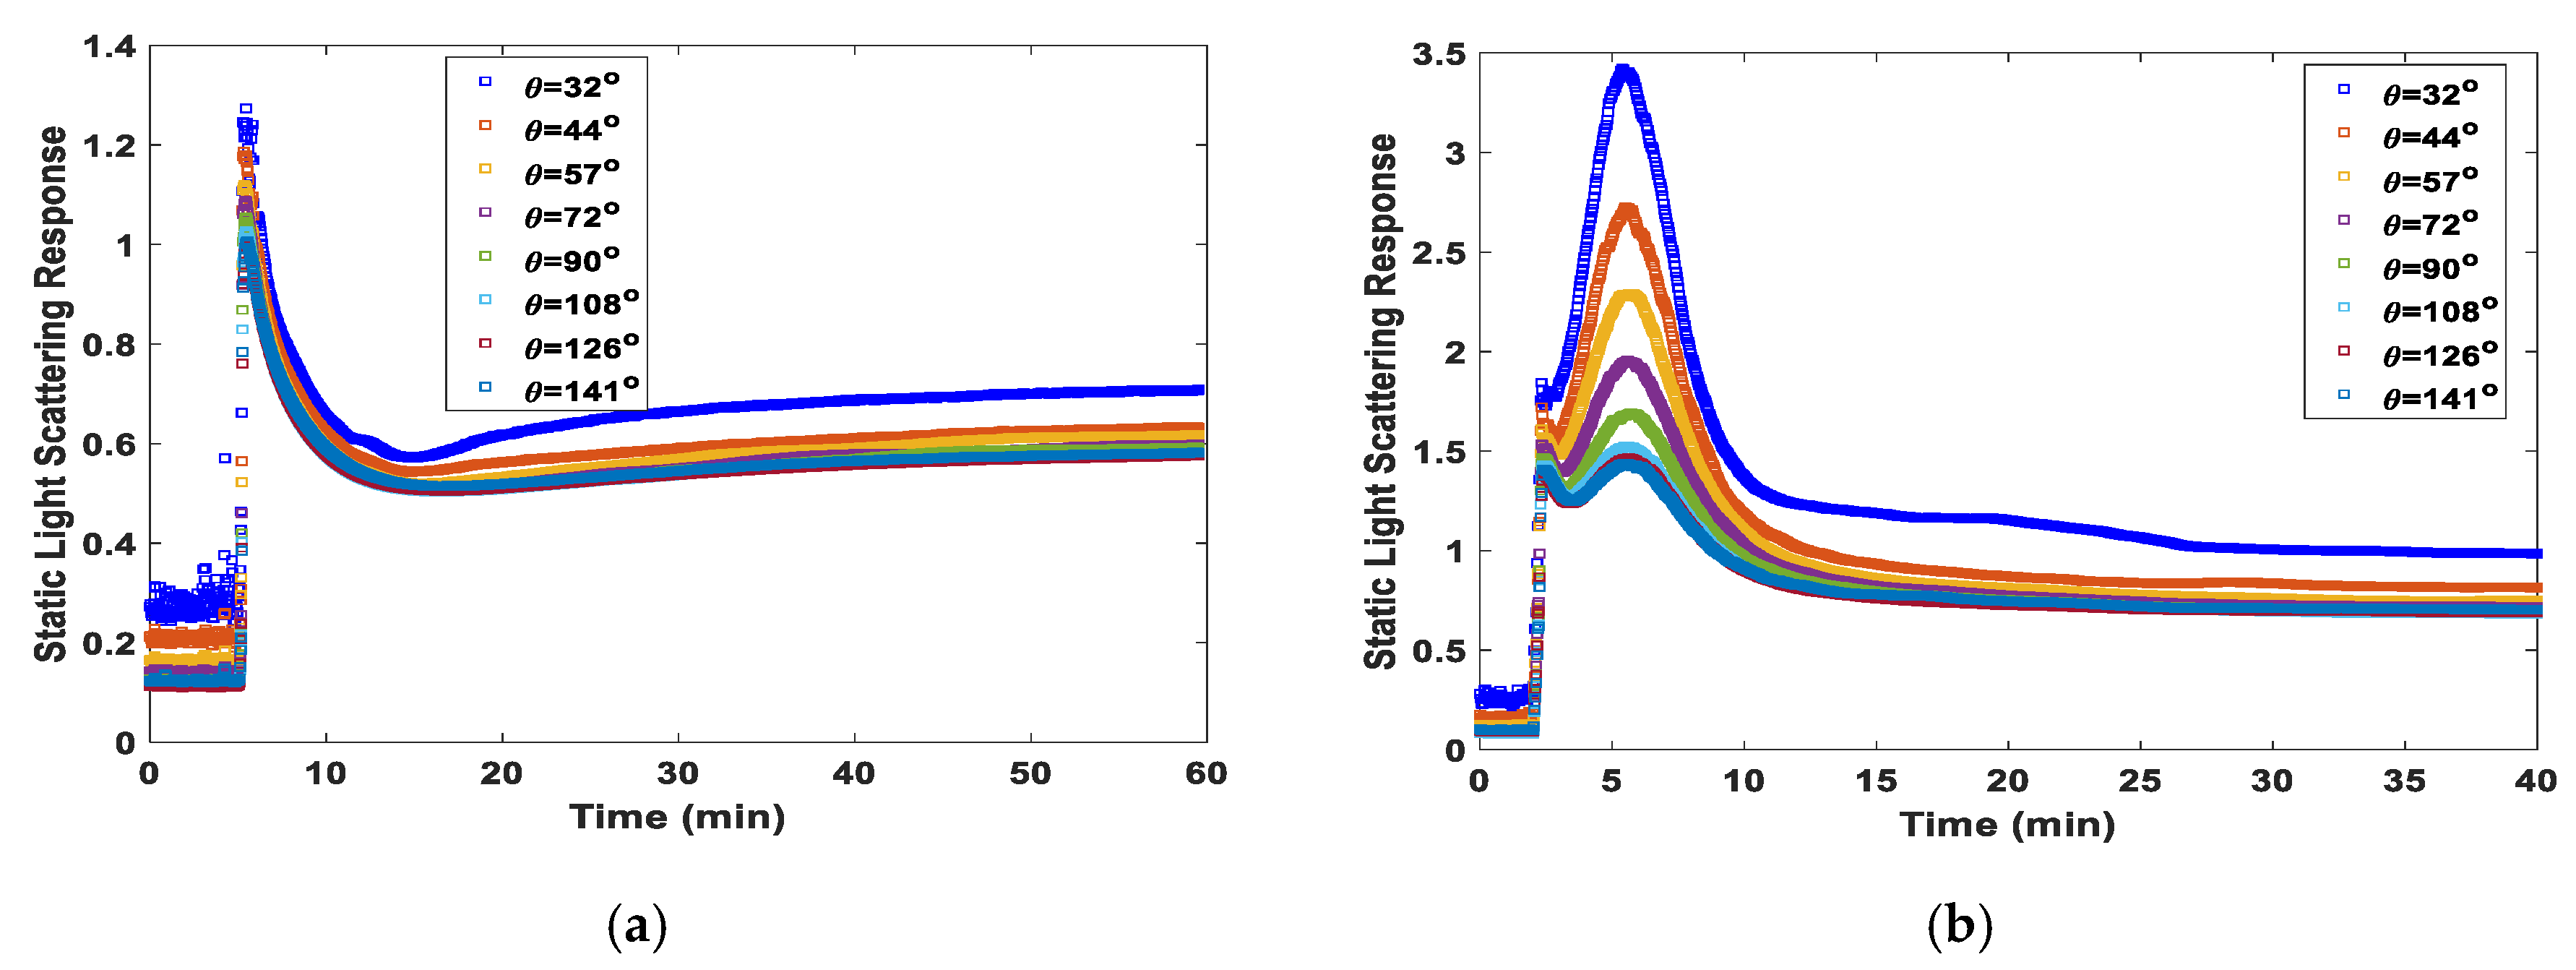
Figure 10.
(a) Experimental data relative to the SLS analysis of a polyacrylamide hydrogel and the analogous polyacrylamide homopolymer (Rayleigh ratios at different scattering angles for H4 and L2). (b) Measured excess Rayleigh ratio for hydrogel H4 and data fitted using the Debye-Bueche and Guinier functions.

Figure 11.
(a) Experimental data relative to the SLS analysis of a polyacrylamide hydrogel and the analogous polyacrylamide homopolymer (Rayleigh ratios at different scattering angles for H7 and L5). (b) Measured excess Rayleigh ratio for hydrogel H7 and data fitted using the Debye-Bueche and Guinier functions.

Figure 12.
(a) Experimental data relative to the SLS analysis of a polyacrylamide hydrogel and the analogous polyacrylamide homopolymer (Rayleigh ratios at different scattering angles for H8 and L6). (b) Measured excess Rayleigh ratio for hydrogel H8 and data fitted using the Debye-Bueche and Guinier functions.

Figure 13.
Measured excess Rayleigh ratio for different polyacrylamide hydrogels and the correspondent data fitting using the Debye-Bueche and Guinier functions. (a) H1, (b) H2, (c) H6, and (d) H9.
Figure 13.
Measured excess Rayleigh ratio for different polyacrylamide hydrogels and the correspondent data fitting using the Debye-Bueche and Guinier functions. (a) H1, (b) H2, (c) H6, and (d) H9.

Figure 14.
Simulation of the effect of the initiation system (VA-044 at C or APS/TEMED at C) on the dynamics of polymerization and gelation. (a) AAm polymerization with 9% and 0.2%. (b) AAm/MBAm copolymerization with 9%, 1.0%, and 0.2%.
Figure 14.
Simulation of the effect of the initiation system (VA-044 at C or APS/TEMED at C) on the dynamics of polymerization and gelation. (a) AAm polymerization with 9% and 0.2%. (b) AAm/MBAm copolymerization with 9%, 1.0%, and 0.2%.

Figure 15.
(a,b) In-line measured SLS signal for polymerization runs involving the use of a CTA and their comparison with experiments without CTA. (c) Predicted time-evolution of monomer conversion and weight-average molecular weights ( and ) during PAAm synthesis in the presence of a chain transfer agent (C, APS/TEMED, 9%, 0.2%, and 0.5%). (d) Predicted polymer concentration and corresponding to AAm/MBAm hydrogel synthesis in the presence of a chain transfer agent. Two different CTA concentrations were considered, 0.5% and 2.5%, with 9% and 0.2%.


Table 1.
Polymerization conditions used in the preparation of polyacrylamide homopolymers and hydrogels.
Table 1.
Polymerization conditions used in the preparation of polyacrylamide homopolymers and hydrogels.
| Product | Monomers | Initiator | T (°C) | CTA | ||||
|---|---|---|---|---|---|---|---|---|
| L1 | AAm | APS/TEMED | 26 | - | 9 | 0.1 | - | - |
| L2 | AAm | APS/TEMED | 26 | - | 9 | 0.2 | - | - |
| L3 | AAm | APS/TEMED | 26 | - | 5 | 0.2 | - | - |
| L4 | AAm | APS/TEMED | 26 | - | 13 | 0.1 | - | - |
| H1 | AAm/MBAm | APS/TEMED | 26 | - | 9 | 0.1 | 0.5 | - |
| H2 | AAm/MBAm | APS/TEMED | 26 | - | 9 | 0.1 | 1.0 | - |
| H3 | AAm/MBAm | APS/TEMED | 26 | - | 9 | 0.1 | 2.0 | - |
| H4 | AAm/MBAm | APS/TEMED | 26 | - | 9 | 0.2 | 1.0 | - |
| H5 | AAm/MBAm | APS/TEMED | 26 | - | 13 | 0.1 | 0.1 | |
| H6 | AAm/MBAm | APS/TEMED | 26 | - | 13 | 0.1 | 0.5 | - |
| L5 | AAm | VA-044 | 40 | - | 9 | 0.2 | - | - |
| L6 | AAm | VA-044 | 40 | - | 5 | 0.2 | - | - |
| H7 | AAm/MBAm | VA-044 | 40 | - | 9 | 0.2 | 0.5 | - |
| H8 | AAm/MBAm | VA-044 | 40 | - | 5 | 0.2 | 1.0 | - |
| H9 | AAm/MBAm | VA-044 | 40 | - | 9 | 0.2 | 1.0 | - |
| L7 | AAm | APS/TEMED | 26 | TA | 9 | 0.2 | - | 0.5 |
| H10 | AAm/MBAm | APS/TEMED | 26 | TA | 9 | 0.2 | 1.0 | 0.5 |
Definitions for the composition parameters described in this table are the following: —mass fraction of acrylamide + methylene bisacrylamide in the solution (×100). —mole ratio of initiator compared to acrylamide + methylene bisacrylamide (×100). —mole fraction of methylene bisacrylamide in the monomer mixture (×100). —mole ratio of chain transfer agent (CTA) compared to acrylamide (×100).
Table 2.
Set of chemical groups considered in the kinetic modeling of the crosslinking polymerization of acrylamide (AAm) with methylene bisacrylamide (MBAm).
Table 2.
Set of chemical groups considered in the kinetic modeling of the crosslinking polymerization of acrylamide (AAm) with methylene bisacrylamide (MBAm).
| Group Alias | Group Description | ||
|---|---|---|---|
| A1 | Secondary propagation polymer radical (SPR) | 1 | 1 |
| A2 | Pendant double bond | 1 | 1 |
| A3 | Mid-chain tertiary polymer radical (MCR) | 1 | 1 |
| A4 | Polymerized Acrylamide unit | 1 | 0 |
| A5 | Polymerized methylene bisacrylamide unit | 1 | 0 |
| A6 | Branching point due to backbiting | 1 | 0 |
| A7 | Acrylamide monomer | 0 | 1 |
| A8 | Methylene bisacrylamide monomer | 0 | 1 |
| A9 | Primary radical | 0 | 1 |
| A10 | Initiator | 0 | 1 |
| A11 | Chain transfer agent | 0 | 1 |
| A12 | Inhibitor/retarder | 0 | 1 |
Table 3.
Set of chemical reactions considered in kinetic modeling of the crosslinking polymerization of acrylamide (AAm) with methylene bisacrylamide (MBAm).
Table 3.
Set of chemical reactions considered in kinetic modeling of the crosslinking polymerization of acrylamide (AAm) with methylene bisacrylamide (MBAm).
| Chemical Reaction | Chemical Equation |
|---|---|
| Initiator decomposition | |
| Acrylamide initiation | |
| Methylene bisacrylamide initiation | |
| Pendant double bond initiation | |
| Acrylamide propagation with SPR | |
| Methylene bisacrylamide propagation with SPR | |
| Pendant double bond propagation with SPR | |
| Backbiting | |
| Acrylamide propagation with MCR | |
| Methylene bisacrylamide propagation with MCR | |
| Pendant double bond propagation with MCR | |
| Transfer to monomer | |
| Transfer to chain transfer agent | |
| Inhibition of primary radicals | |
| Inhibition of SPR radicals | |
| Inhibition of MRC radicals | |
| Termination by combination SPR/SPR | |
| Termination by disproportionation SPR/SPR | |
| Termination by combination SPR/MCR | |
| Termination by disproportionation of SPR/MCR | |
| Termination by combination MCR/MCR | |
| Termination by disproportionation of MCR/MCR |
Table 4.
Reference set of rate parameters considered in the kinetic modeling of the crosslinking polymerization of acrylamide (AAm) with methylene bisacrylamide (MBAm).
Table 4.
Reference set of rate parameters considered in the kinetic modeling of the crosslinking polymerization of acrylamide (AAm) with methylene bisacrylamide (MBAm).
| Kinetic Step | Rate Parameters | Reference |
|---|---|---|
| Initiator decomposition | With VA0-44 | [46] |
| With K2S2O8 in 0.1 M NaOH solution | [47] | |
| A multiplication factor of 2000 on the value for K2S2O8 was estimated in this work with APS/TEMED | This work | |
| Chain propagation | [2,18] | |
| Transfer to monomer | [2,18] | |
| Termination SPR-SPR | [2,18] | |
| Backbiting | [2,18] | |
| Addition to MCR | [2,18] | |
| Cross termination SPR-MCR | [2,18] | |
| Termination MCR-MCR | [2,18] | |
| Inhibition | This work | |
| Chain transfer to agent | This work |
Rate parameters expressed in s−1 for the unimolecular steps and in L·mol−1·s−1 for the bimolecular steps. Temperature ( expressed in K in the rate parameter expressions and the ideal gas constant was = 8.314 J/(mol·K).
Table 5.
Correlation length ( in nm) for different kinds of products estimated through static light scattering measurements and using different models for data analysis, namely the Debye-Bueche (DB) and the Guinier (GU) functions.
Table 5.
Correlation length ( in nm) for different kinds of products estimated through static light scattering measurements and using different models for data analysis, namely the Debye-Bueche (DB) and the Guinier (GU) functions.
| Product | H1 | H2 | H3 | H4 | H5 | H6 | H7 | H8 | H9 | |
|---|---|---|---|---|---|---|---|---|---|---|
| DB | 24 | 27 | - | 20 | - | 36 | 64 | 48 | 24 | |
| GU | 31 | 35 | - | 27 | - | 42 | 65 | 54 | 31 | |
© 2019 by the authors. Licensee MDPI, Basel, Switzerland. This article is an open access article distributed under the terms and conditions of the Creative Commons Attribution (CC BY) license (http://creativecommons.org/licenses/by/4.0/).
Share and Cite
MDPI and ACS Style
Gomes, C.; Dias, R.C.S.; Costa, M.R.P.F.N. Static Light Scattering Monitoring and Kinetic Modeling of Polyacrylamide Hydrogel Synthesis. Processes 2019, 7, 237. https://doi.org/10.3390/pr7040237
AMA Style
Gomes C, Dias RCS, Costa MRPFN. Static Light Scattering Monitoring and Kinetic Modeling of Polyacrylamide Hydrogel Synthesis. Processes. 2019; 7(4):237. https://doi.org/10.3390/pr7040237
Chicago/Turabian StyleGomes, Catarina, Rolando C.S. Dias, and Mário Rui P.F.N. Costa. 2019. "Static Light Scattering Monitoring and Kinetic Modeling of Polyacrylamide Hydrogel Synthesis" Processes 7, no. 4: 237. https://doi.org/10.3390/pr7040237
Note that from the first issue of 2016, this journal uses article numbers instead of page numbers. See further details here.