Article

Prediction of N-linked Glycoform Profiles of Monoclonal Antibody with Extracellular Metabolites and Two-Step Intracellular Models

1
Biomedical Engineering and Biotechnology, University of Massachusetts Lowell, Lowell, MA 01850, USA
2
Chemical Engineering, University of Massachusetts Lowell, Lowell, MA 01850, USA
3
Division II, Office of Biotechnology Products, Office of Pharmaceutical Quality, CDER, FDA, Silver Springs, MD 20903, USA
*
Author to whom correspondence should be addressed.
Disclaimers: This article reflects the views of the authors and should not be construed to represent official FDA’s views or policies.
Currently at Parexel International.
Processes 2019, 7(4), 227; https://doi.org/10.3390/pr7040227
Submission received: 5 March 2019 / Revised: 11 April 2019 / Accepted: 17 April 2019 / Published: 23 April 2019
(This article belongs to the Special Issue In silico metabolic modeling and engineering)

Abstract

:
Monoclonal antibodies (mAbs) are commonly glycosylated and show varying levels of galactose attachment. A set of experiments in our work showed that the galactosylation level of mAbs was altered by the culture conditions of hybridoma cells. The uridine diphosphate galactose (UDP-Gal) is one of the substrates of galactosylation. Based on that, we proposed a two-step model to predict N-linked glycoform profiles by solely using extracellular metabolites from cell culture. At the first step, the flux level of UDP-Gal in each culture was estimated based on a computational flux balance analysis (FBA); its level was found to be linear with the galactosylation degree on mAbs. At the second step, the glycoform profiles especially for G0F (agalactosylated), G1F (monogalactosylated) and G2F (digalactosylated) were predicted by a kinetic model. The model outputs well matched with the experimental data. Our study demonstrated that the integrated mathematical approach combining FBA and kinetic model is a promising strategy to predict glycoform profiles for mAbs during cell culture processes.

Graphical Abstract

1. Introduction

Monoclonal antibodies (mAbs) have achieved remarkable success in treating inflammatory disease, infectious diseases, autoimmune diseases and cancer [1]. N-linked glycoform profiles are product critical quality attributes (CQAs) which must be controlled in the production of mAbs [2,3]. Poor control of glycosylation can lead to immunogenicity and product efficacy issues, thus resulting in product rejections [2,4]. For example, the variation of galactosylation (the level of galactose attachment) could raise some batch consistency concerns for mAb pharmaceuticals, particularly oncology products, for which galactosylation can significantly alter effector functions [4,5].
Currently, glycosylation is often analyzed in products at the end of processing. For a better operation, the glycoform profiles on mAbs should be monitored throughout the duration of a given process and likely be fine-tuned. A box of “tools” to modulate N-linked glycan in process has been demonstrated with pre-defined components such as enzymatic inhibitors or activators [6]. For the next step, a monitoring technique will be needed in this application to realize a full control loop. However, most techniques for profiling N-linked glycoforms require extensive sample preparation and are not ready for on-line implementation [7]. The need for monitoring N-linked glycoform profiles in real time is still unmet.
Here, we asked the question—if a strategy for monitoring N-linked glycoform profiles can be accomplished by linking the N-linked glycan to a pool of extracellular metabolites in processes via mechanistic models. This is because a series of on-line technology is currently available for measuring metabolites in bioreactors. For example, glucose and lactate can be monitored in-situ and in real-time using systems such as the BioPAT® Trace. Amino acid measurements in the culture medium can be accelerated by rapid at-line approaches using high-pressure liquid chromatography (HPLC) or NMR [8,9,10]. More on-line techniques for amino acids are developed with Raman spectroscopy [11].
To construct a mechanistic model to link N-glycan to the culture medium, the metabolic processes involved in N-linked glycosylation must be considered. One of the key processes is nucleotide sugar synthesis. Many studies have reported that glycosylation is modulated by nucleotide sugar levels, which in turn are subject to perturbations of culture conditions and medium supplements [12,13,14,15,16,17,18,19,20]. Thus, the abundance of nucleotide sugars is considered in this work as a potential indicator for N-linked glycoform variation.
Here, a two-step mathematical model prototype was developed. The first step estimates the intracellular levels of nucleotide sugars in silico using spent medium data including glucose and amino acids. This step uses constraint-based flux balance analysis (FBA). The second step links the level of nucleotide sugars to a kinetic model. The model at this step describes the evolvement of oligosaccharide in the Golgi and ultimately estimates the glycoform profiles of mAbs. We applied this model framework to the data from our previous work and accurately predicted the mAb glycosylation in a number of hybridoma cultures.

2. Materials and Methods

2.1. Bioreactor Process and Analytics

The experimental details of the bioreactor runs have been described previously [21]. A model IgG3:K antibody-producing hybridoma cell was cultured in a parallel bioreactor system with multiple 1.2 L vessels in fed-batch mode for 5 days (120 h). To represent a diversity of culture variations within the realistic range of a commercial manufacturing environment, 11 parameters were varied in a Plackett-Burman design of 16 batches (including 12 experimental batches and 4 control batches).
The viable cell density, extracellular metabolites (glucose, glutamine, lactate, ammonia) and titer were measured daily. The glycoform profiles were analyzed from the harvested and purified antibodies. The analytical methods of the above components were introduced in the earlier publication [21]. The free amino acids content from daily culture media was 0.22 µm filtered and underwent automated derivatization, separation and detection using a Poroshell C18 3 × 100 mm column, a guard column and high-performance liquid chromatography (HPLC, Agilent Technologies, Lexington, MA, USA) following the instructions of the manufacturer.

2.2. Rationale of Data Selection from the Previous Study
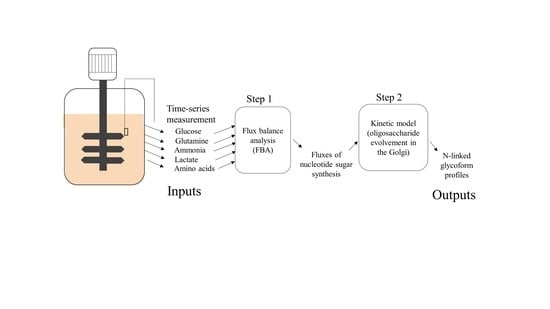
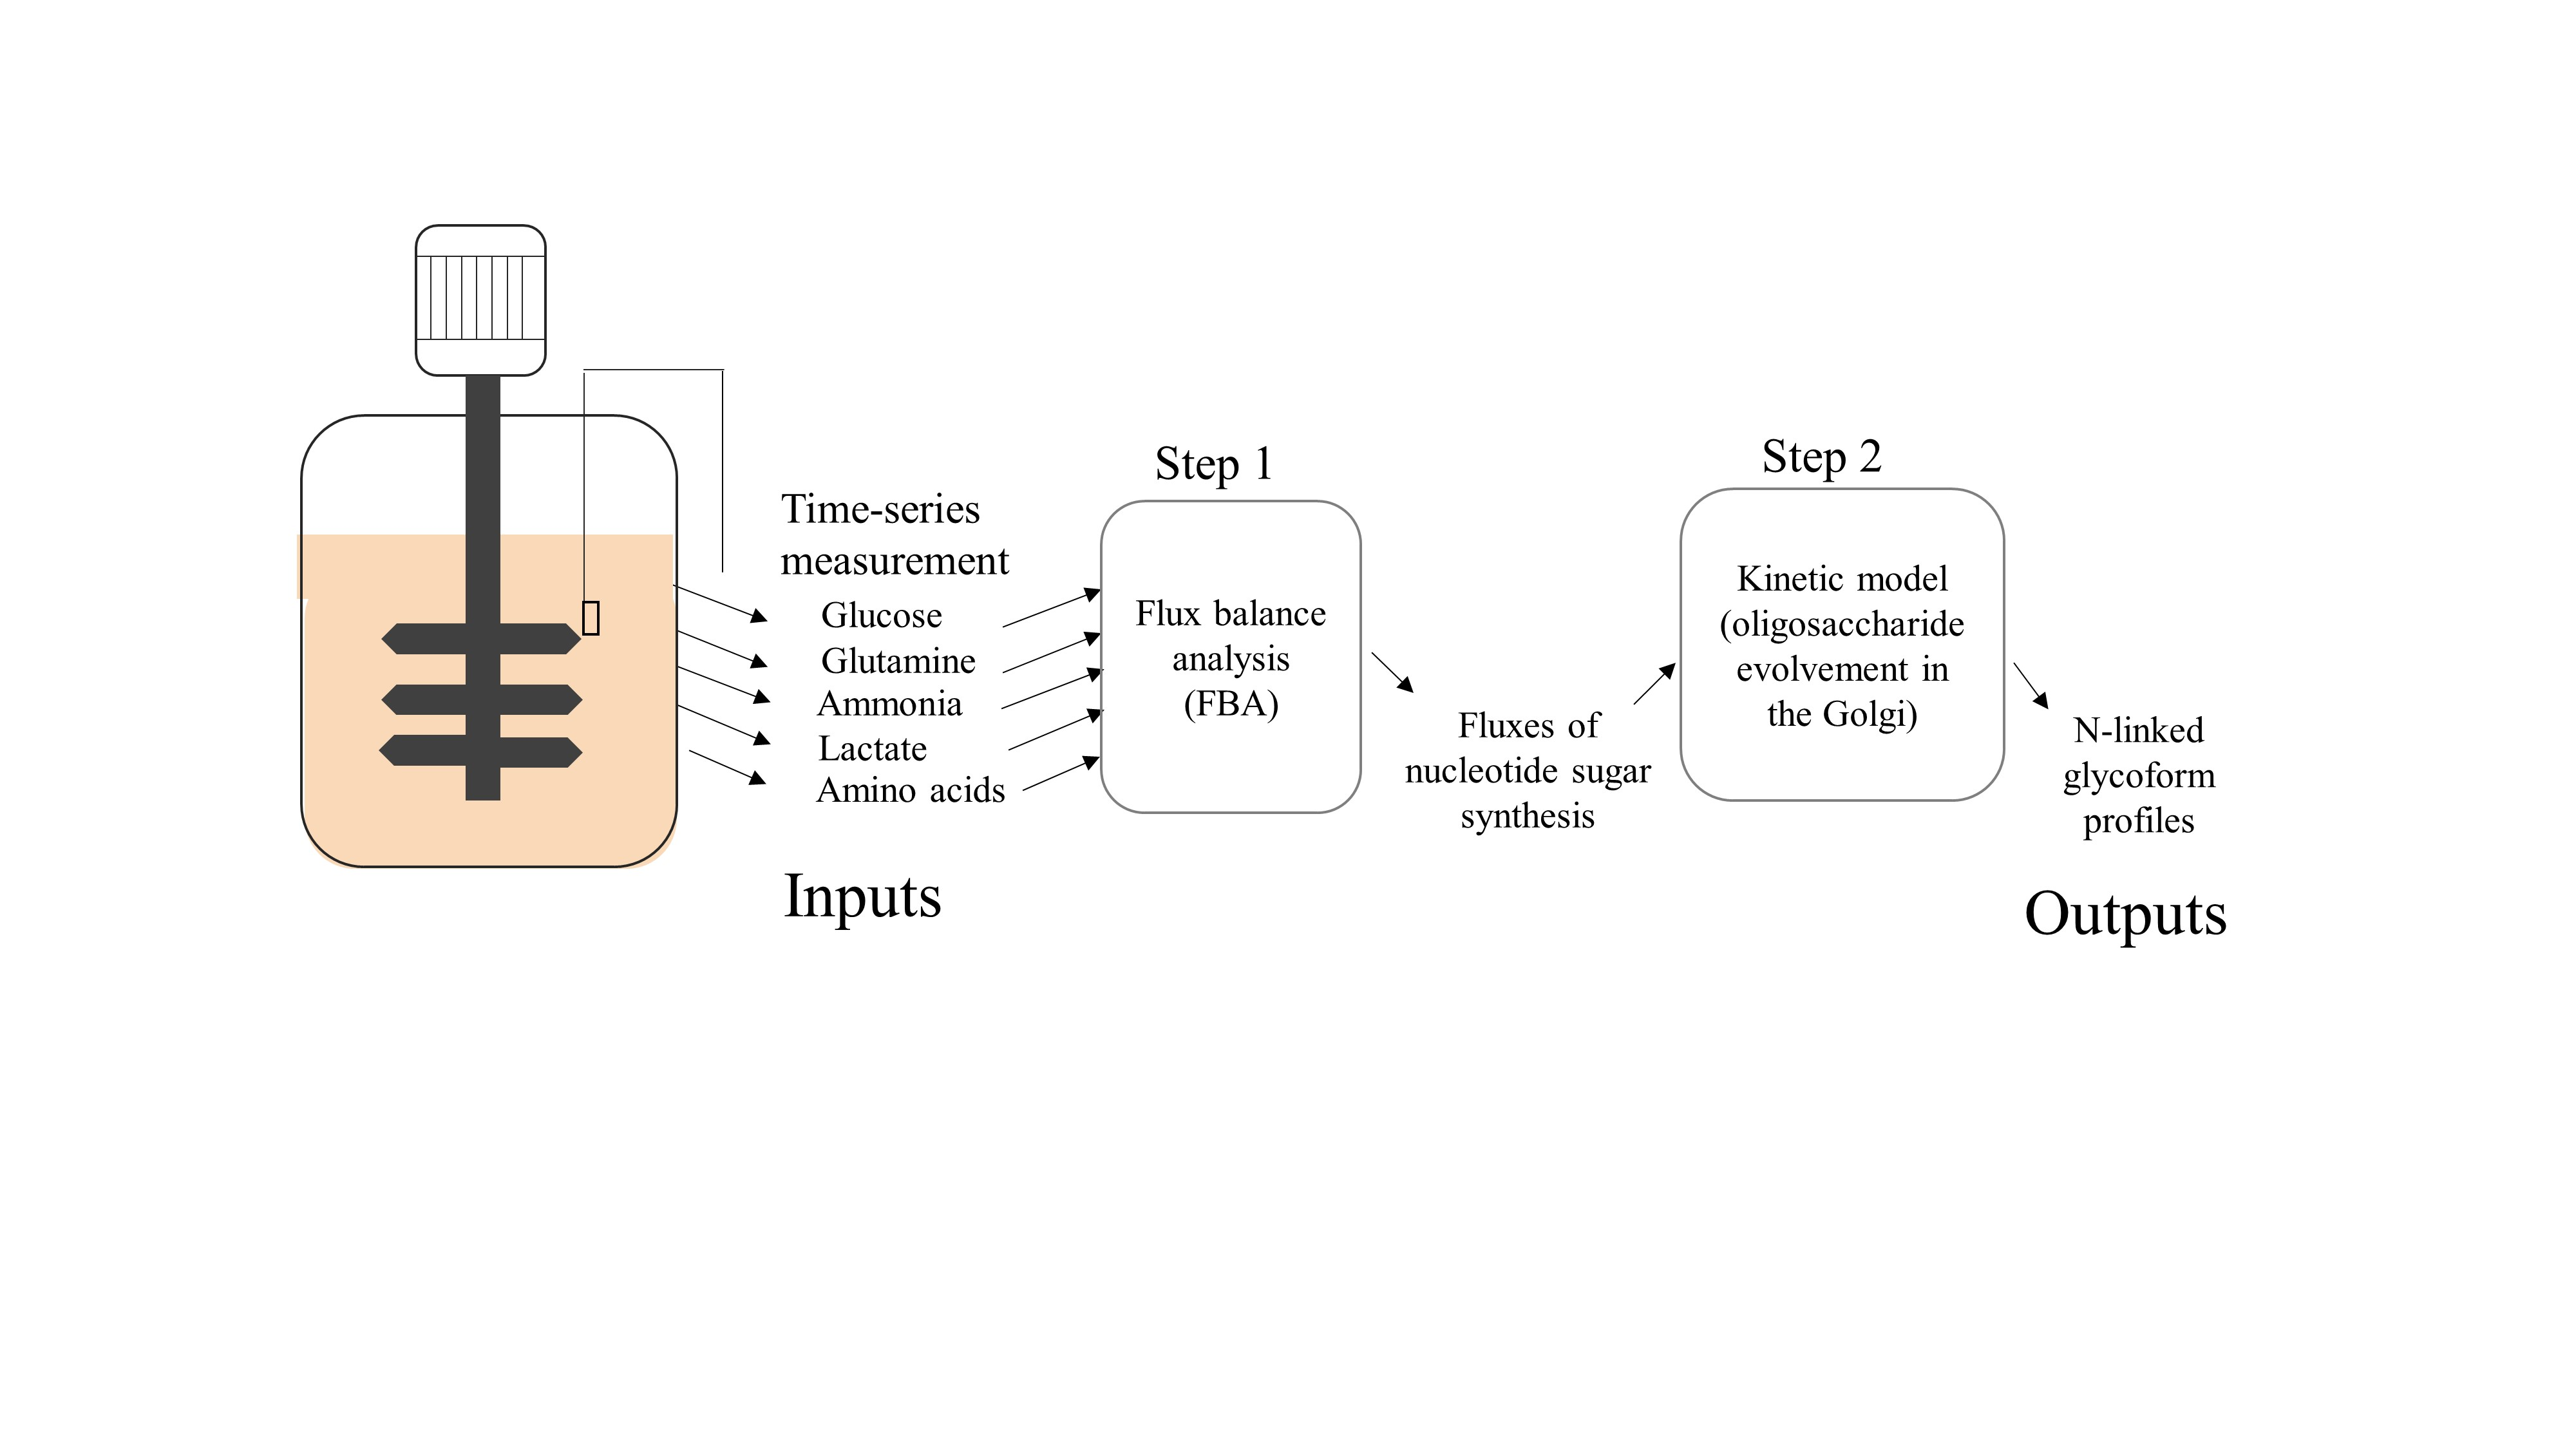
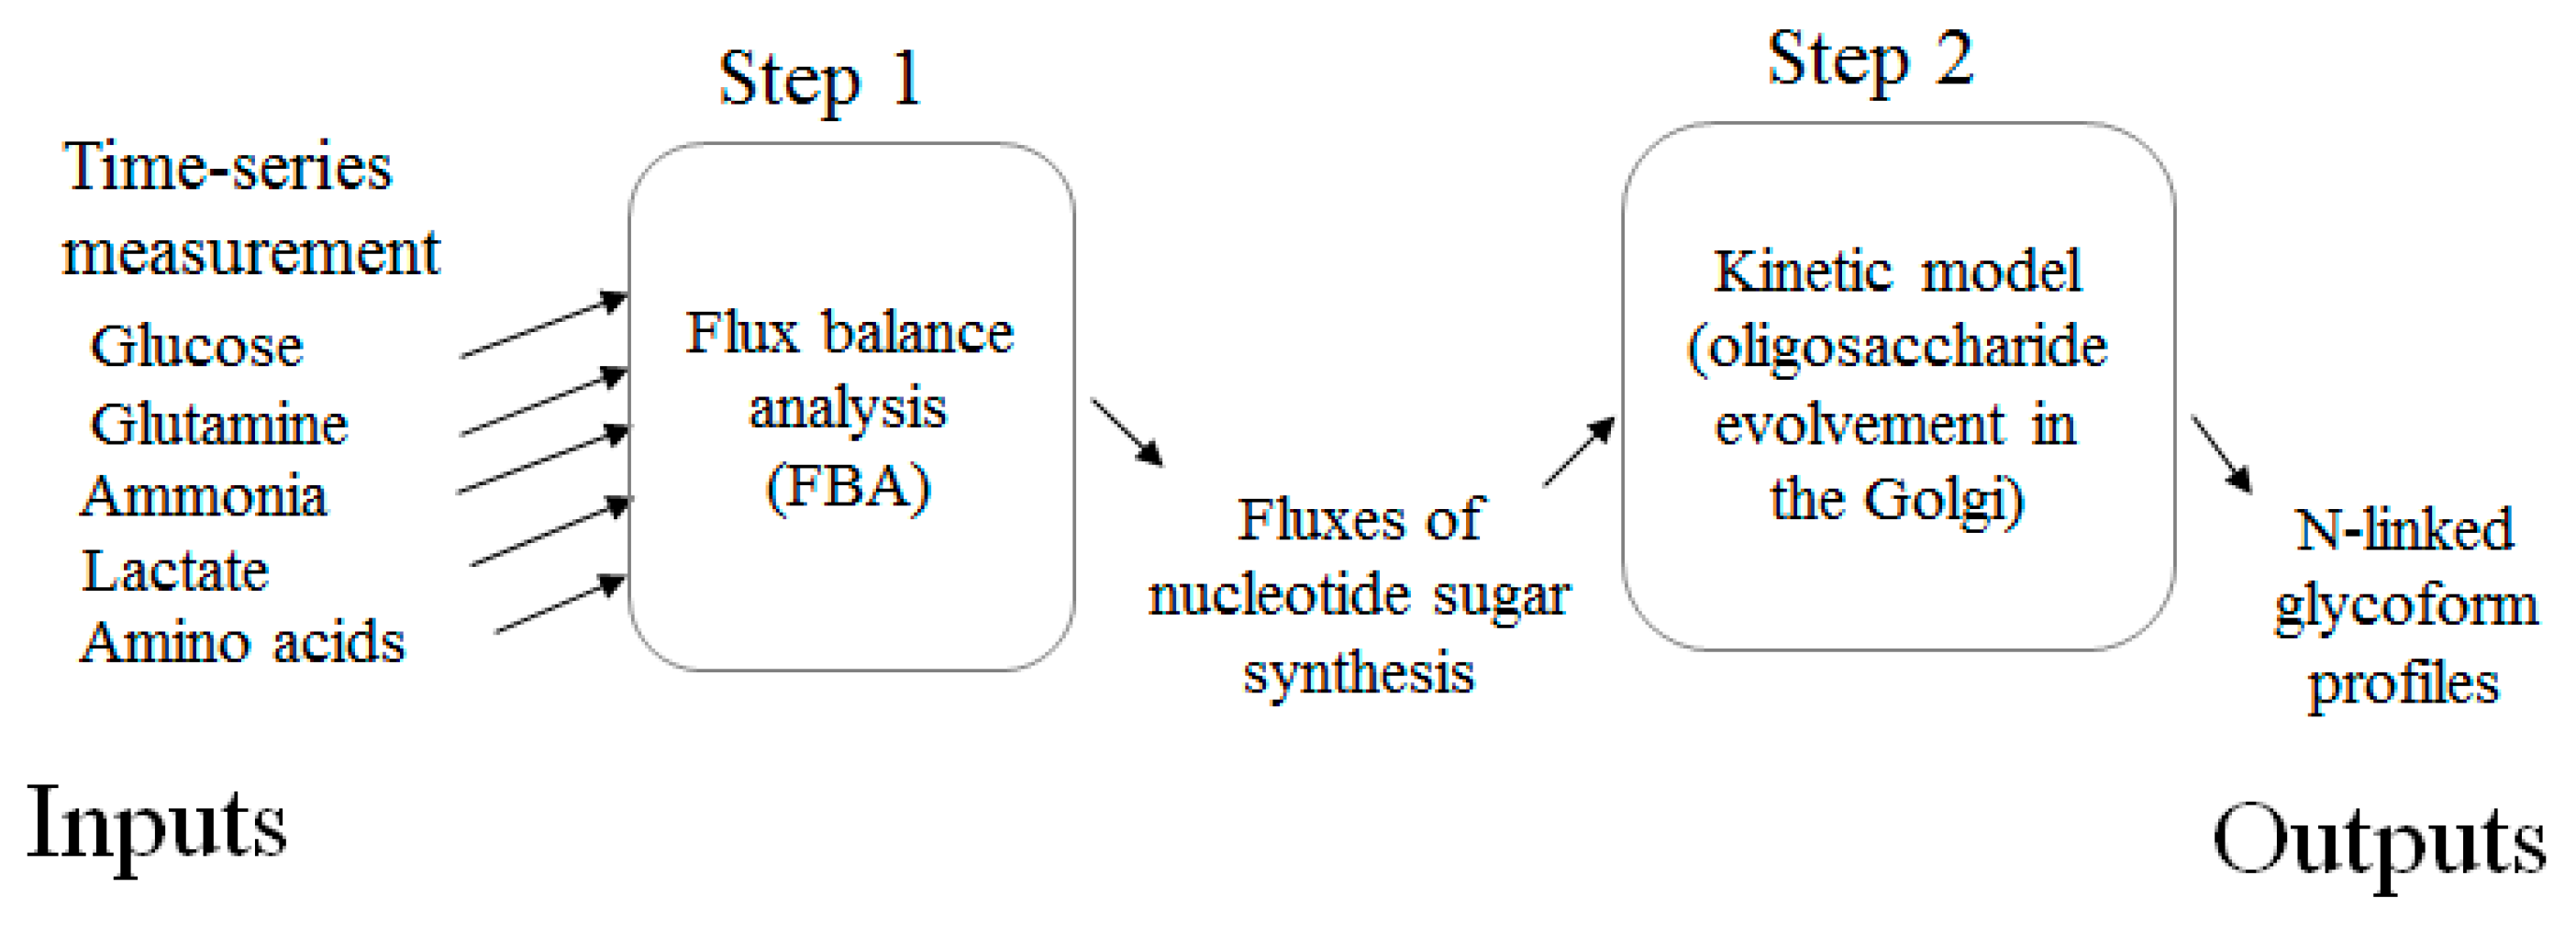
The 16 batches were sorted by level of galactosylation. Considering that some modest analytical error exists when measuring glycan profiles, only the batches of the highest, the lowest and one medium level of galactosylation, out of the total of 12 experimental batches, were selected to be used in this work. A fourth data set was from one of the control conditions in the Plackett-Burman design. This selection increased the odds that the model was tested for predicting substantial biological variation between batches versus analytical errors.
In this work, the batch with the medium level of galactosylation was named standard culture and will be used for model calibration. The other three batches with varied level of galactosylation (either higher or lower from the standard culture) were named Batch I, II and III and used for prediction. The culture operation patterns of those four batches selected are shown in Table 1. To express the difference in the level of galactosylation among those four batches, a galactosylation index (GI) was calculated for each batch using the Equation (1) [22]. In this equation, G0F is agalactosylated, G1F is monogalactosylated and G2F is digalactosylated. The GI value (between zero and one) represents the extent of galactosylation of each mAb.
Galactosylation   index   ( GI ) =   0 × G 0 F + 1 × G 1 F + 2 × G 2 F 2 × ( G 0 F + G 1 F + G 2 F )

3. Modeling

The model aims to estimate the glycan variation resulting from altered culture processes. The two steps are shown in Figure 1. The first component is an FBA. The inputs are the consumption or accumulation rates of extracellular metabolites. The second component is a kinetic model describing oligosaccharide evolution as nascent antibodies pass through the Golgi. The glycoform distribution at the exit of the Golgi determines the final glycoform profiles. Each step of the model is described in detail in the subsections.

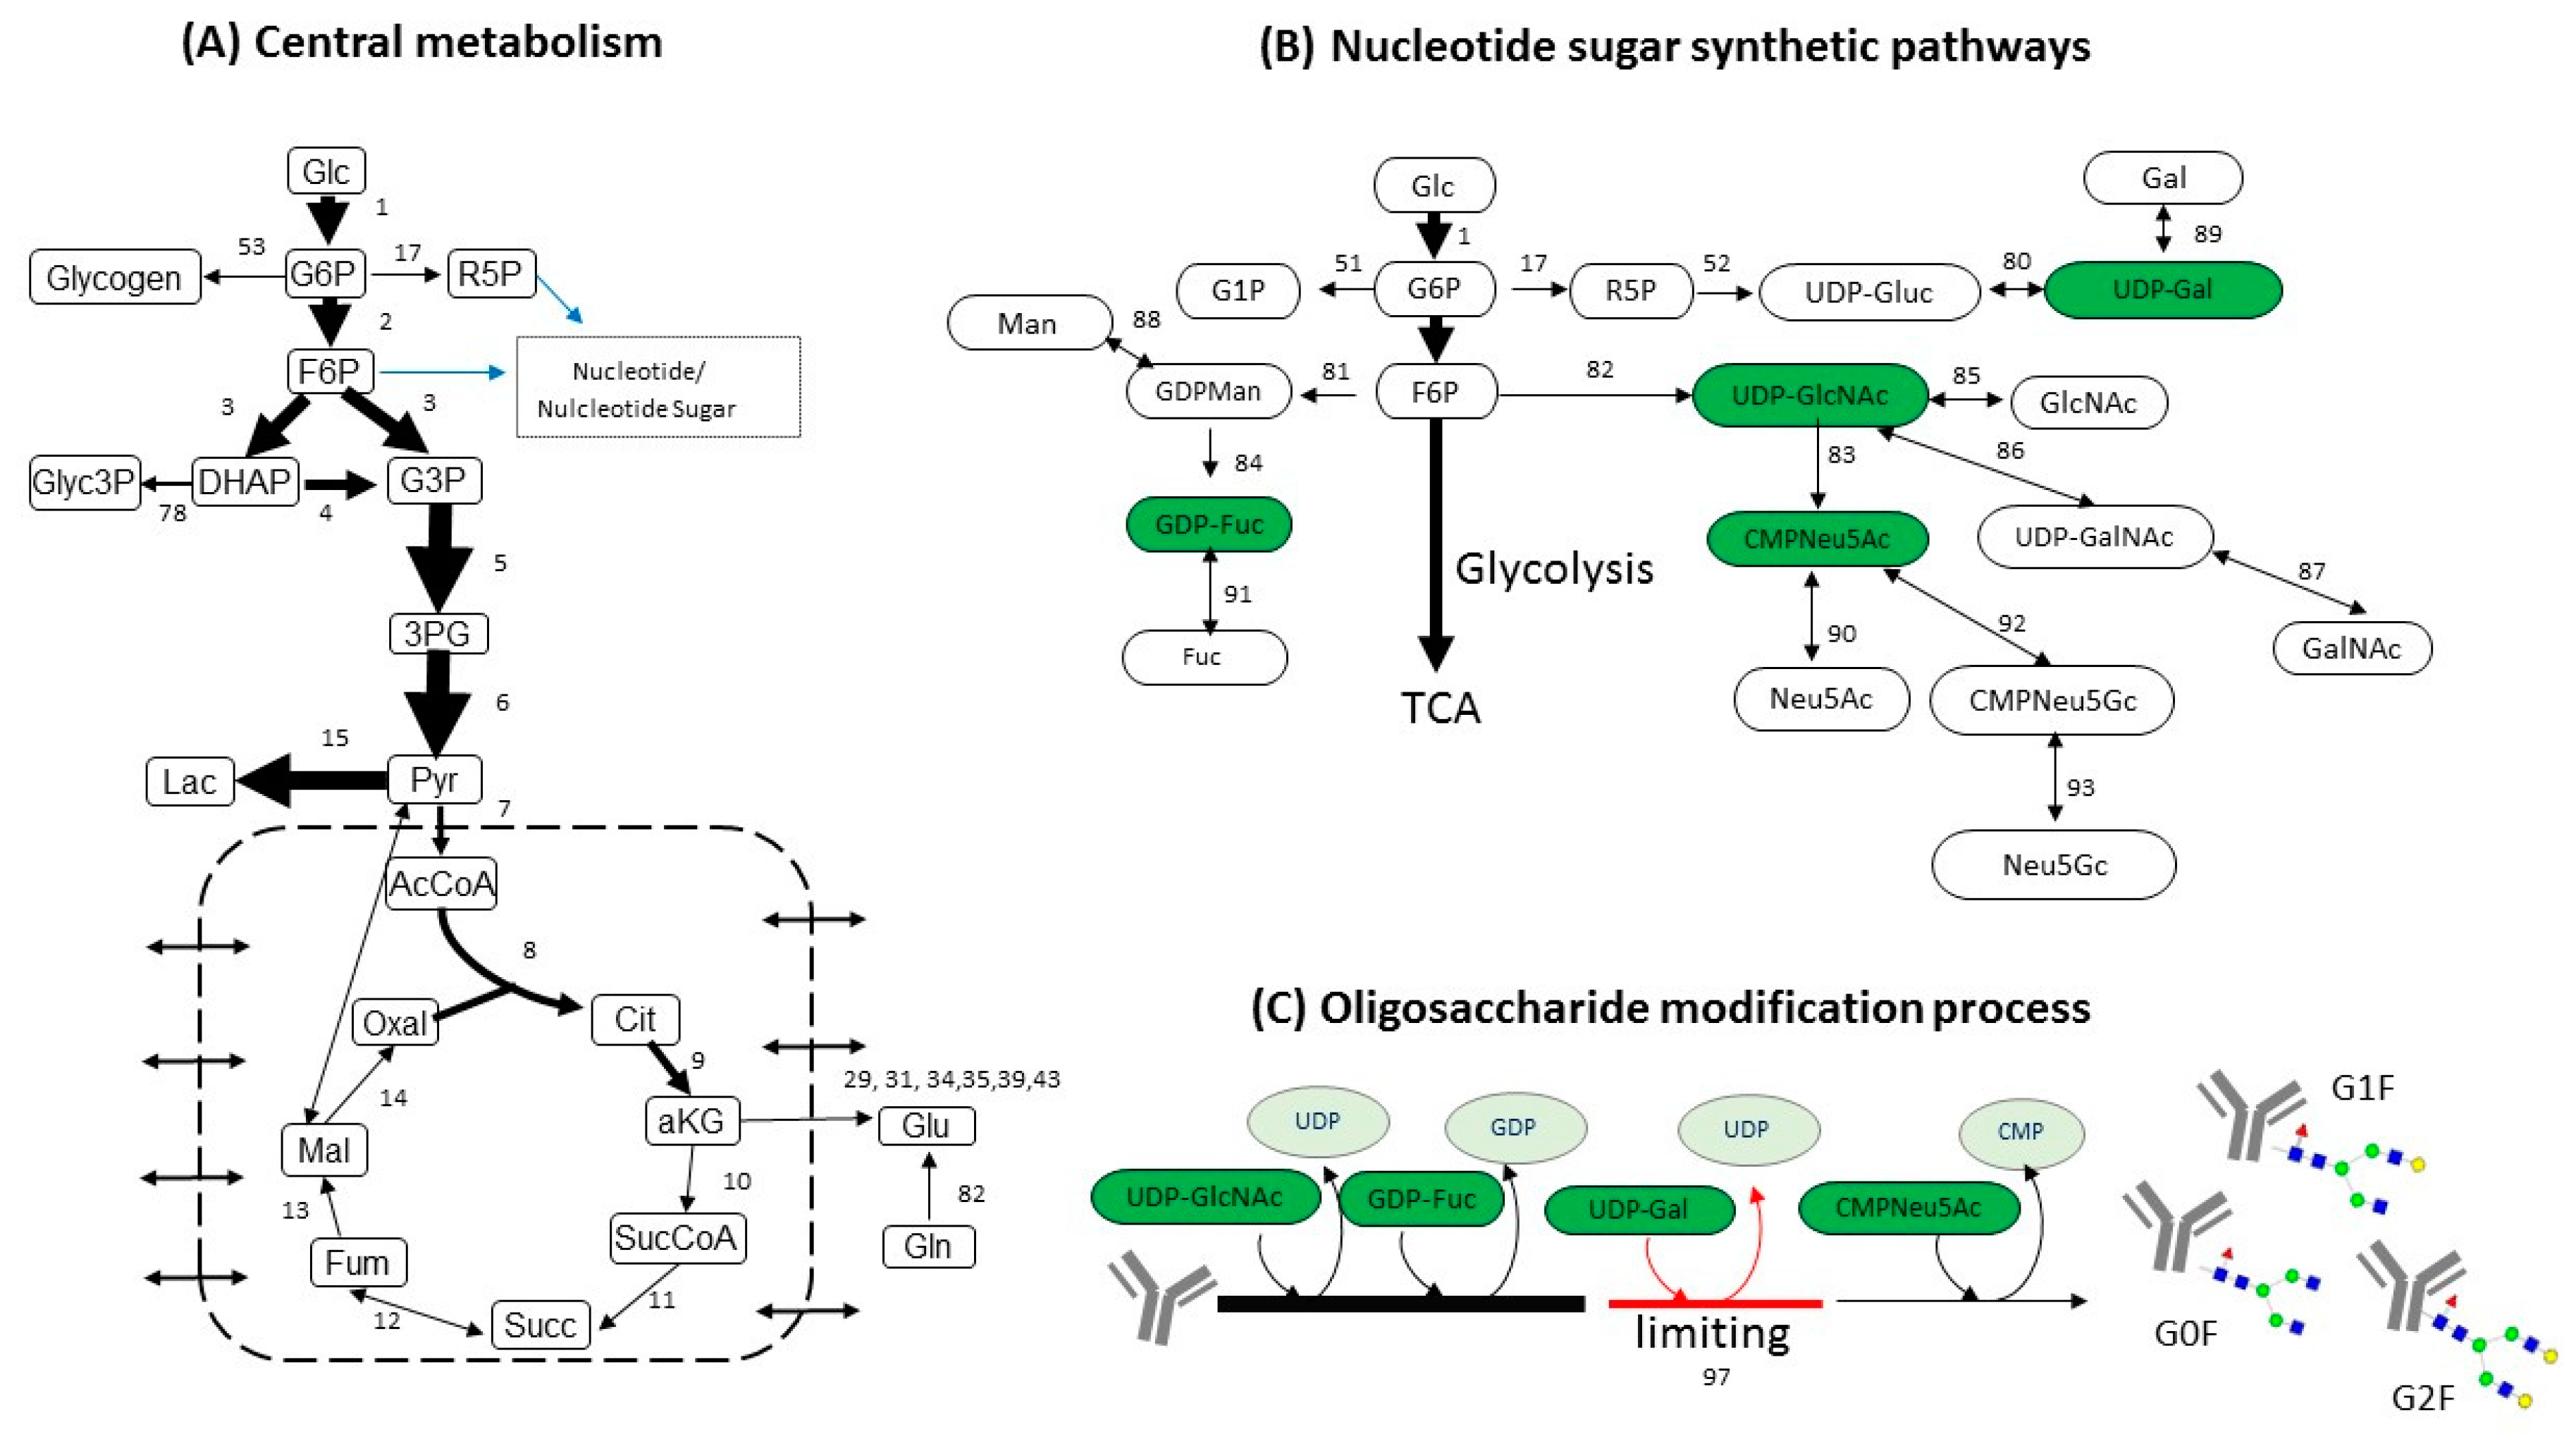
3.1. Estimating Fluxes of Nucleotide Sugar Syntheses from FBA

FBA is used to resolve intracellular fluxes at cellular pseudo steady-state [23]. The FBA network configuration and calculation were conducted using MATLAB software (MathWorks, Natick, MA, USA). The metabolic network was based on a previously published work [18] and the biomass composition was based on existing determination [24]. The metabolic network consists of 154 reactions and 120 metabolites [18], interlinking three metabolic parts: (1) central metabolism (glycolysis, TCA, amino acids metabolism and pentose phosphate pathways); (2) nucleotide sugar synthesis; and (3) mAb synthesis with nucleotide sugar attachment. These networks are represented in Figure 2.
The specific rates of consumption/accumulation of a series of extracellular components (including amino acids, glucose, lactate and ammonia) were calculated using Equation (2). In the equation, q represents the specific accumulation or consumption rate of a metabolite (e.g., glucose); c represents the concentration of extracellular metabolites; t represents time; X represents the viable cell density. The rates calculated were used as constraints to the FBA. The calculation finally resolved all the reaction fluxes included in the network with an objective function of maximum IgG accumulation.
q = d c d t · 1 X
The key outputs sought in the analysis were the fluxes of nucleotide sugars from synthesis. For example, the flux for UDP-Gal was a sum of flux 80 and 89 (Figure 2B). This calculated flux indicates the level of nucleotide sugar synthesized before entering the Golgi, which is the level of substrates that is available to be used for glycosylation.

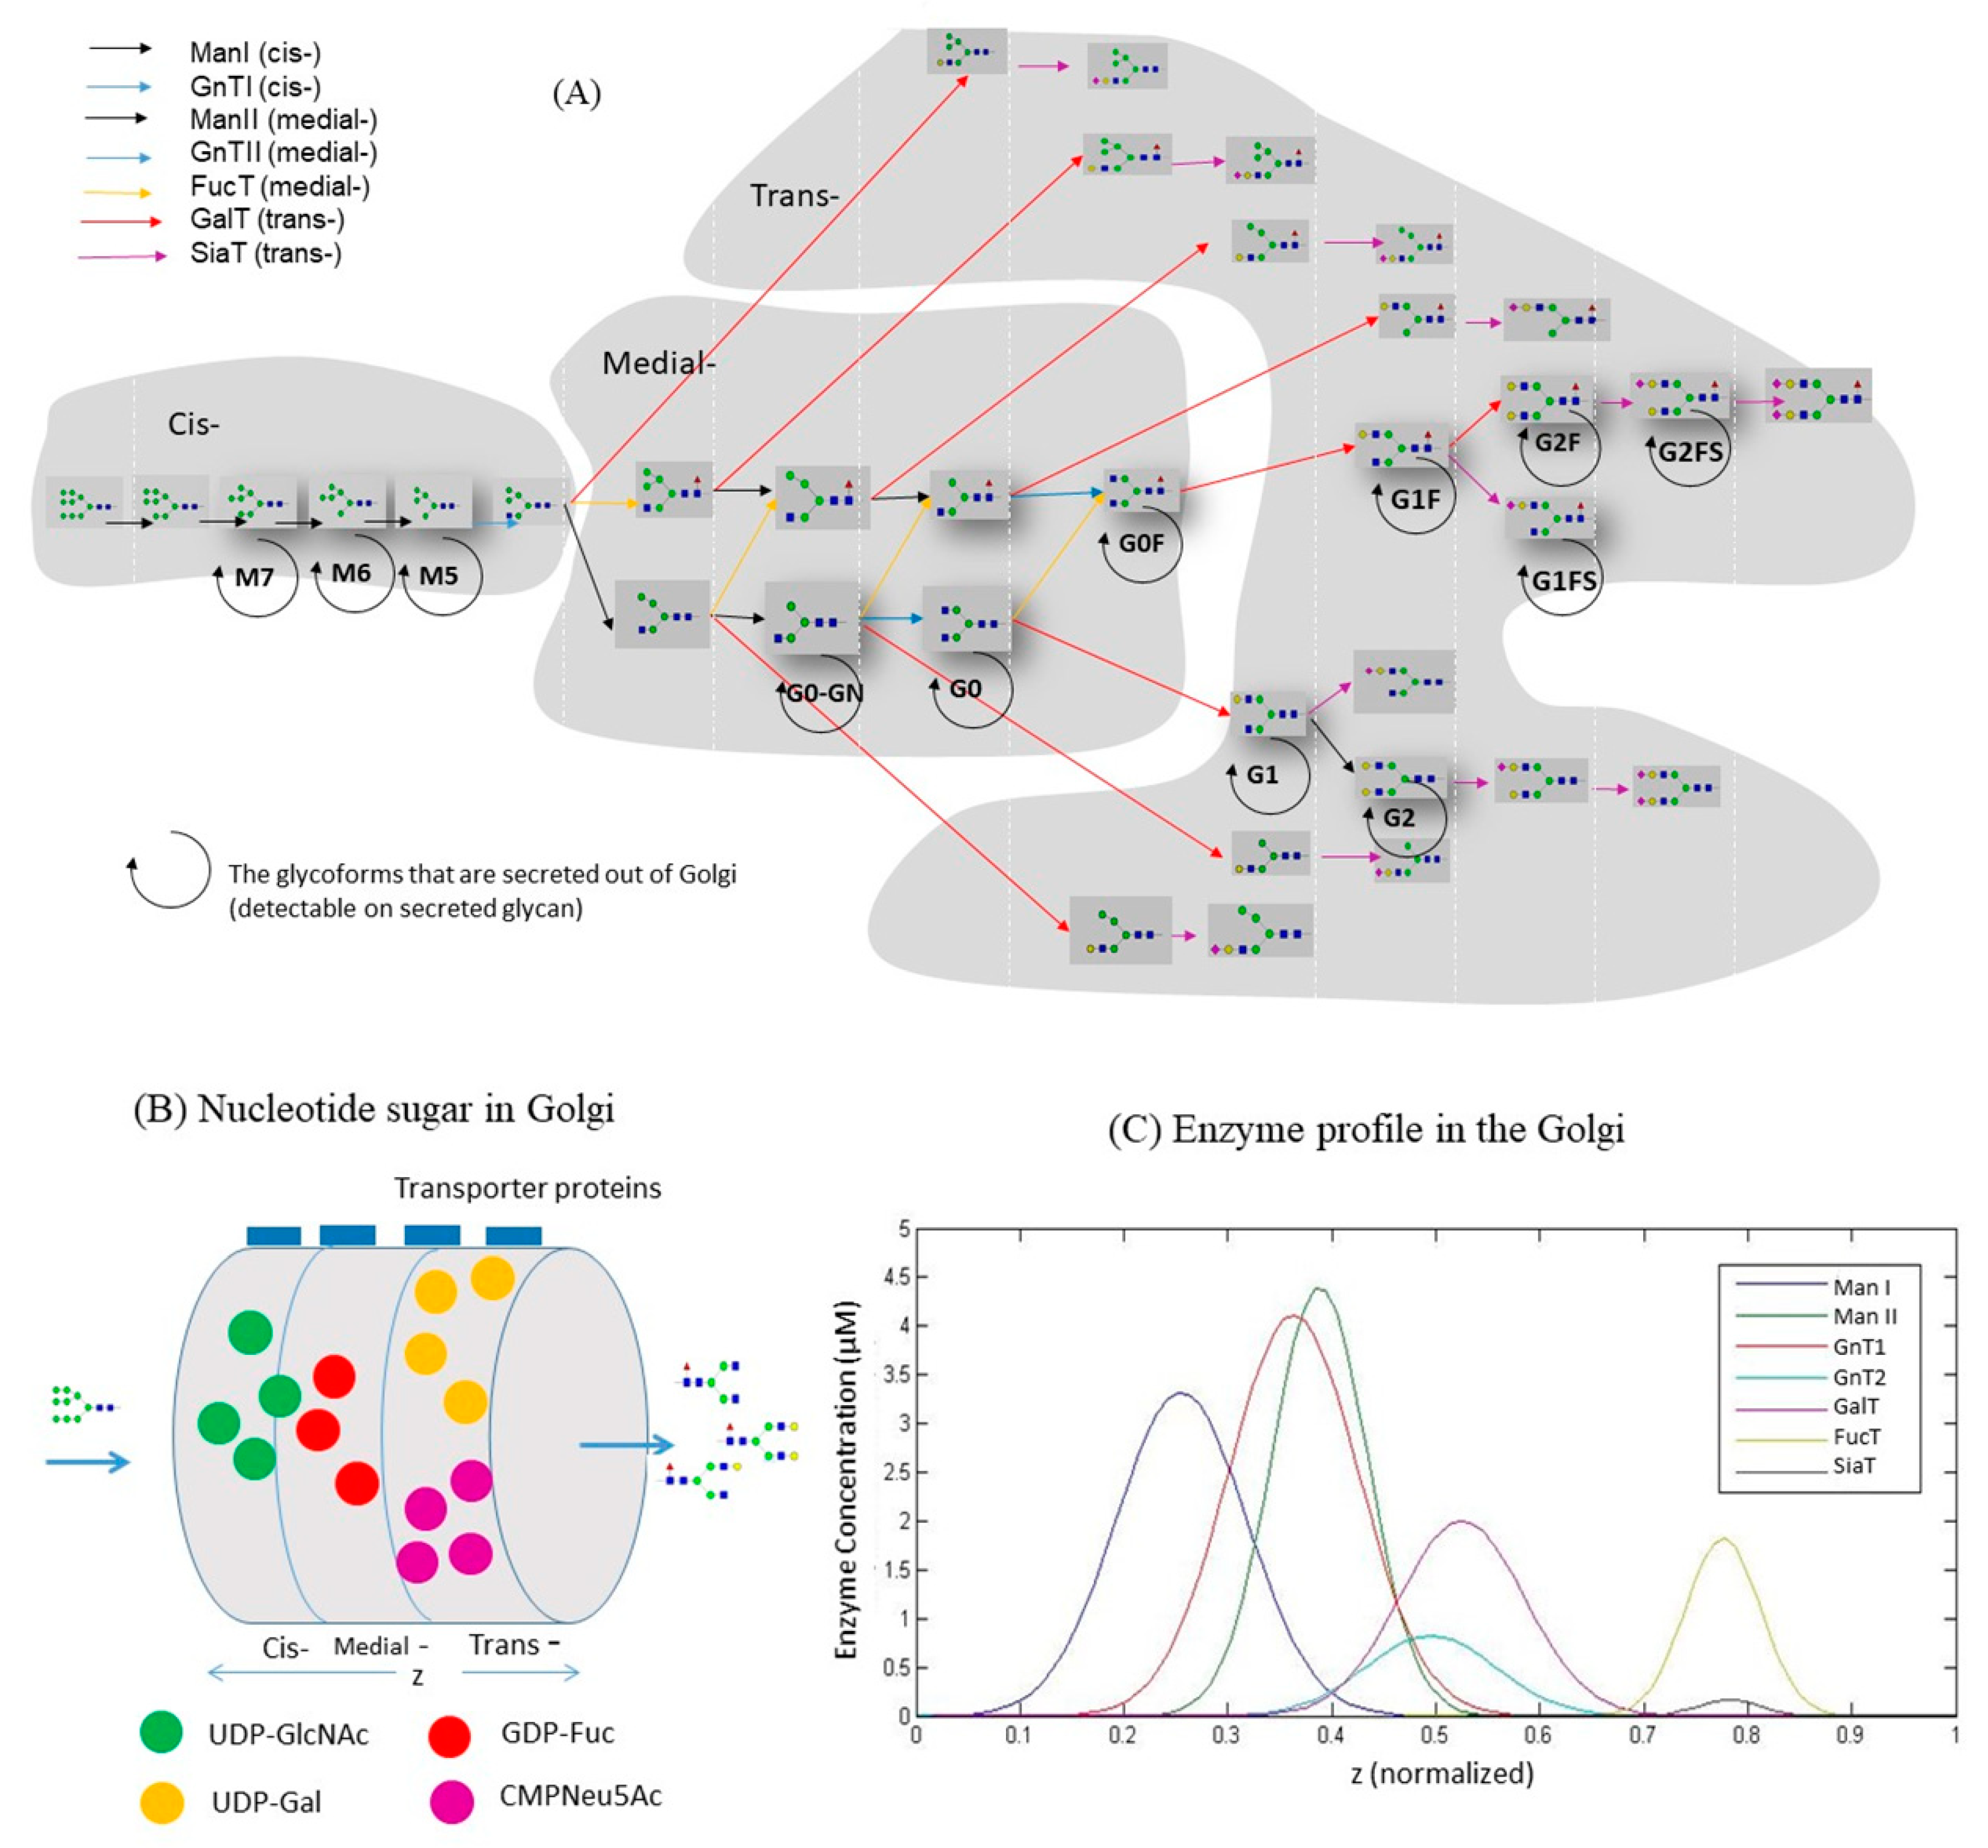
3.2. Construction of Glycosylation Kinetic Model

A glycosylation kinetic model was written in MATLAB (MathWorks, Natick, MA, USA). As shown in Figure 3B, the model treats the Golgi as a single plug flow reactor (PFR). A steady flow of antibody enters the PFR with 100% of initial glycoform (Man9). The glycan structures evolve along the Golgi as mAbs encounter with nucleotide sugar donors and enzymes, as shown in Figure 3A. This network keeps the necessary paths for mAbs to obtain the glycoforms detected in this study [25,26,27]. The network includes seven enzymes: mannosidase I (ManI), mannosidase II (ManII), N-acetylglucosaminyltransferase I (GnTI), N-acetylglucosaminyltransferase II (GnTII), galactosyltransferase (GalT), fucosyltransferase (FucT) and sialyltransferase (SiaT). The N-acetylglucosaminyltransferase III (GnTIII) is not included because bisecting N-acetylglucosamine was found only in ~0.2% of the total glycan, meaning this cell line had only minimal GnTIII activity.
The concentrations of all the intermediate glycoforms at steady state were calculated by a series of ordinary differential equations (ODEs). The generic equation representing the mass balance of each intermediate glycoform is shown in the Equation (3), where q represents the influx rate of mAb into Golgi; D represents the diameter of the Golgi; z represents the length of the Golgi; O S i represents each intermediate glycoform; v i , j represents the stoichiometric matrix for reaction network; r j represents the rate of each reaction in the network. The reactions adopt the Michaelis-Menten kinetics described in Reference [28]. Solving this series of ODEs gives the concentration profiles of each glycoform along the Golgi length. The percentage of each glycoform was calculated at the exit point of the Golgi and represents the glycoform profile on the secreted mAbs.
4 q π D 2 d O S i d z j = 1 N . R . v i , j r j = 0
Table S2 shows the whole list of parameters used for the model. All the kinetic model parameters are constants and keep same when using the model for predictions. The volumetric flow rate for antibodies entering Golgi was 1.12 × 10¹⁵ dm3/min. This value was referenced from a previous modeling study [28] where the protein production rate was between 7.5 and 112.5 µg (106 cells)−1 day−1. The rate of mAb production in this study during the exponential phase was around 17.5 µg (106 cells)−1 day−1 and falls into the range of reference. The same volumetric flow rate value was used for all the four batches since there was little variation for the mAb specific production rates across batches. The distribution of glycosylation enzymes in the sub-compartments of Golgi (i.e., Cis-Golgi, Medial-Golgi and Trans-Golgi) should be cell line specific. Therefore, the enzymatic profiles described in Reference [27] was slightly adjusted to fit our glycan datasets (Figure 3C). The kinetic constants were selected based on the values from previous models [25,28] and a full summary is shown in Table S2.
Nucleotide sugar concentrations in the Golgi are inputs for the kinetic model. The nucleotide sugar concentrations in the standard culture were calibrated by fitting the model with the experimental glycoform profiles. For the other culture conditions (I, II and III), the nucleotide sugar fluxes estimated by FBA for these batches were used as a basis for quantifying the variation of nucleotide sugar availability in the Golgi. Specifically, the values of nucleotide sugar concentrations in Batch I, II and III were adjusted from the value in the standard culture with the ratio obtained for nucleotide sugar fluxes between this batch and the standard batch.

4. Results

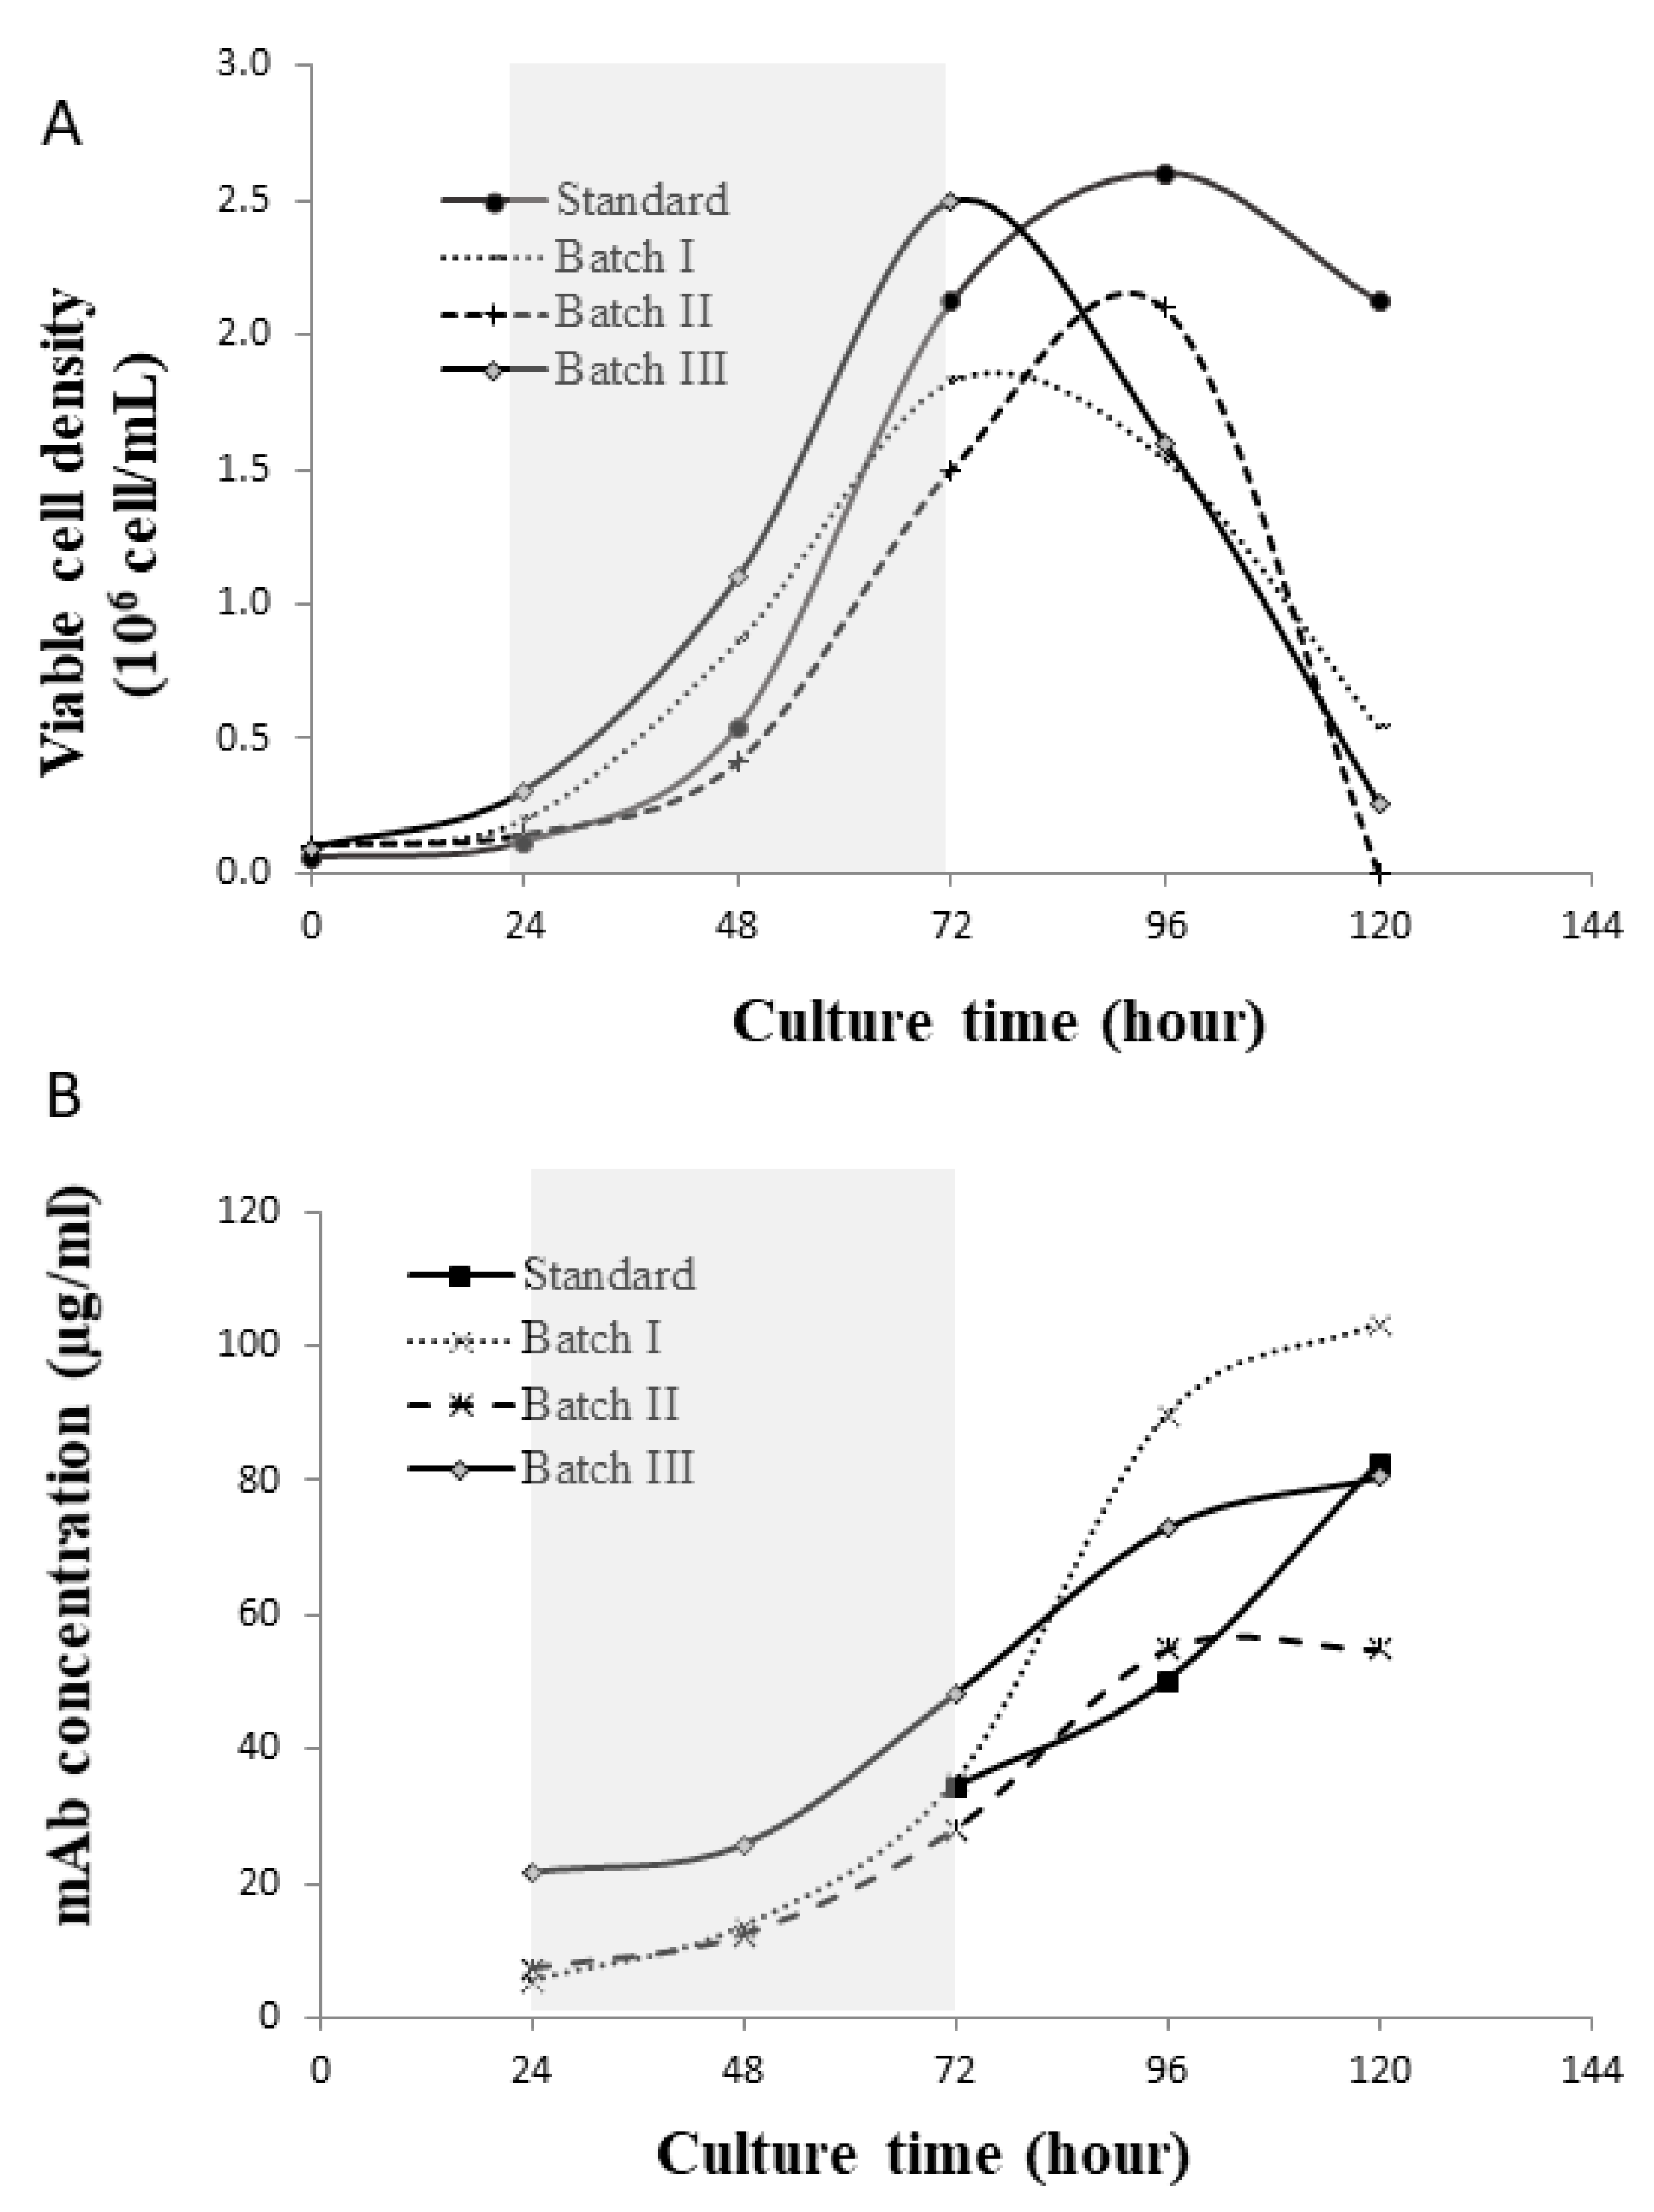
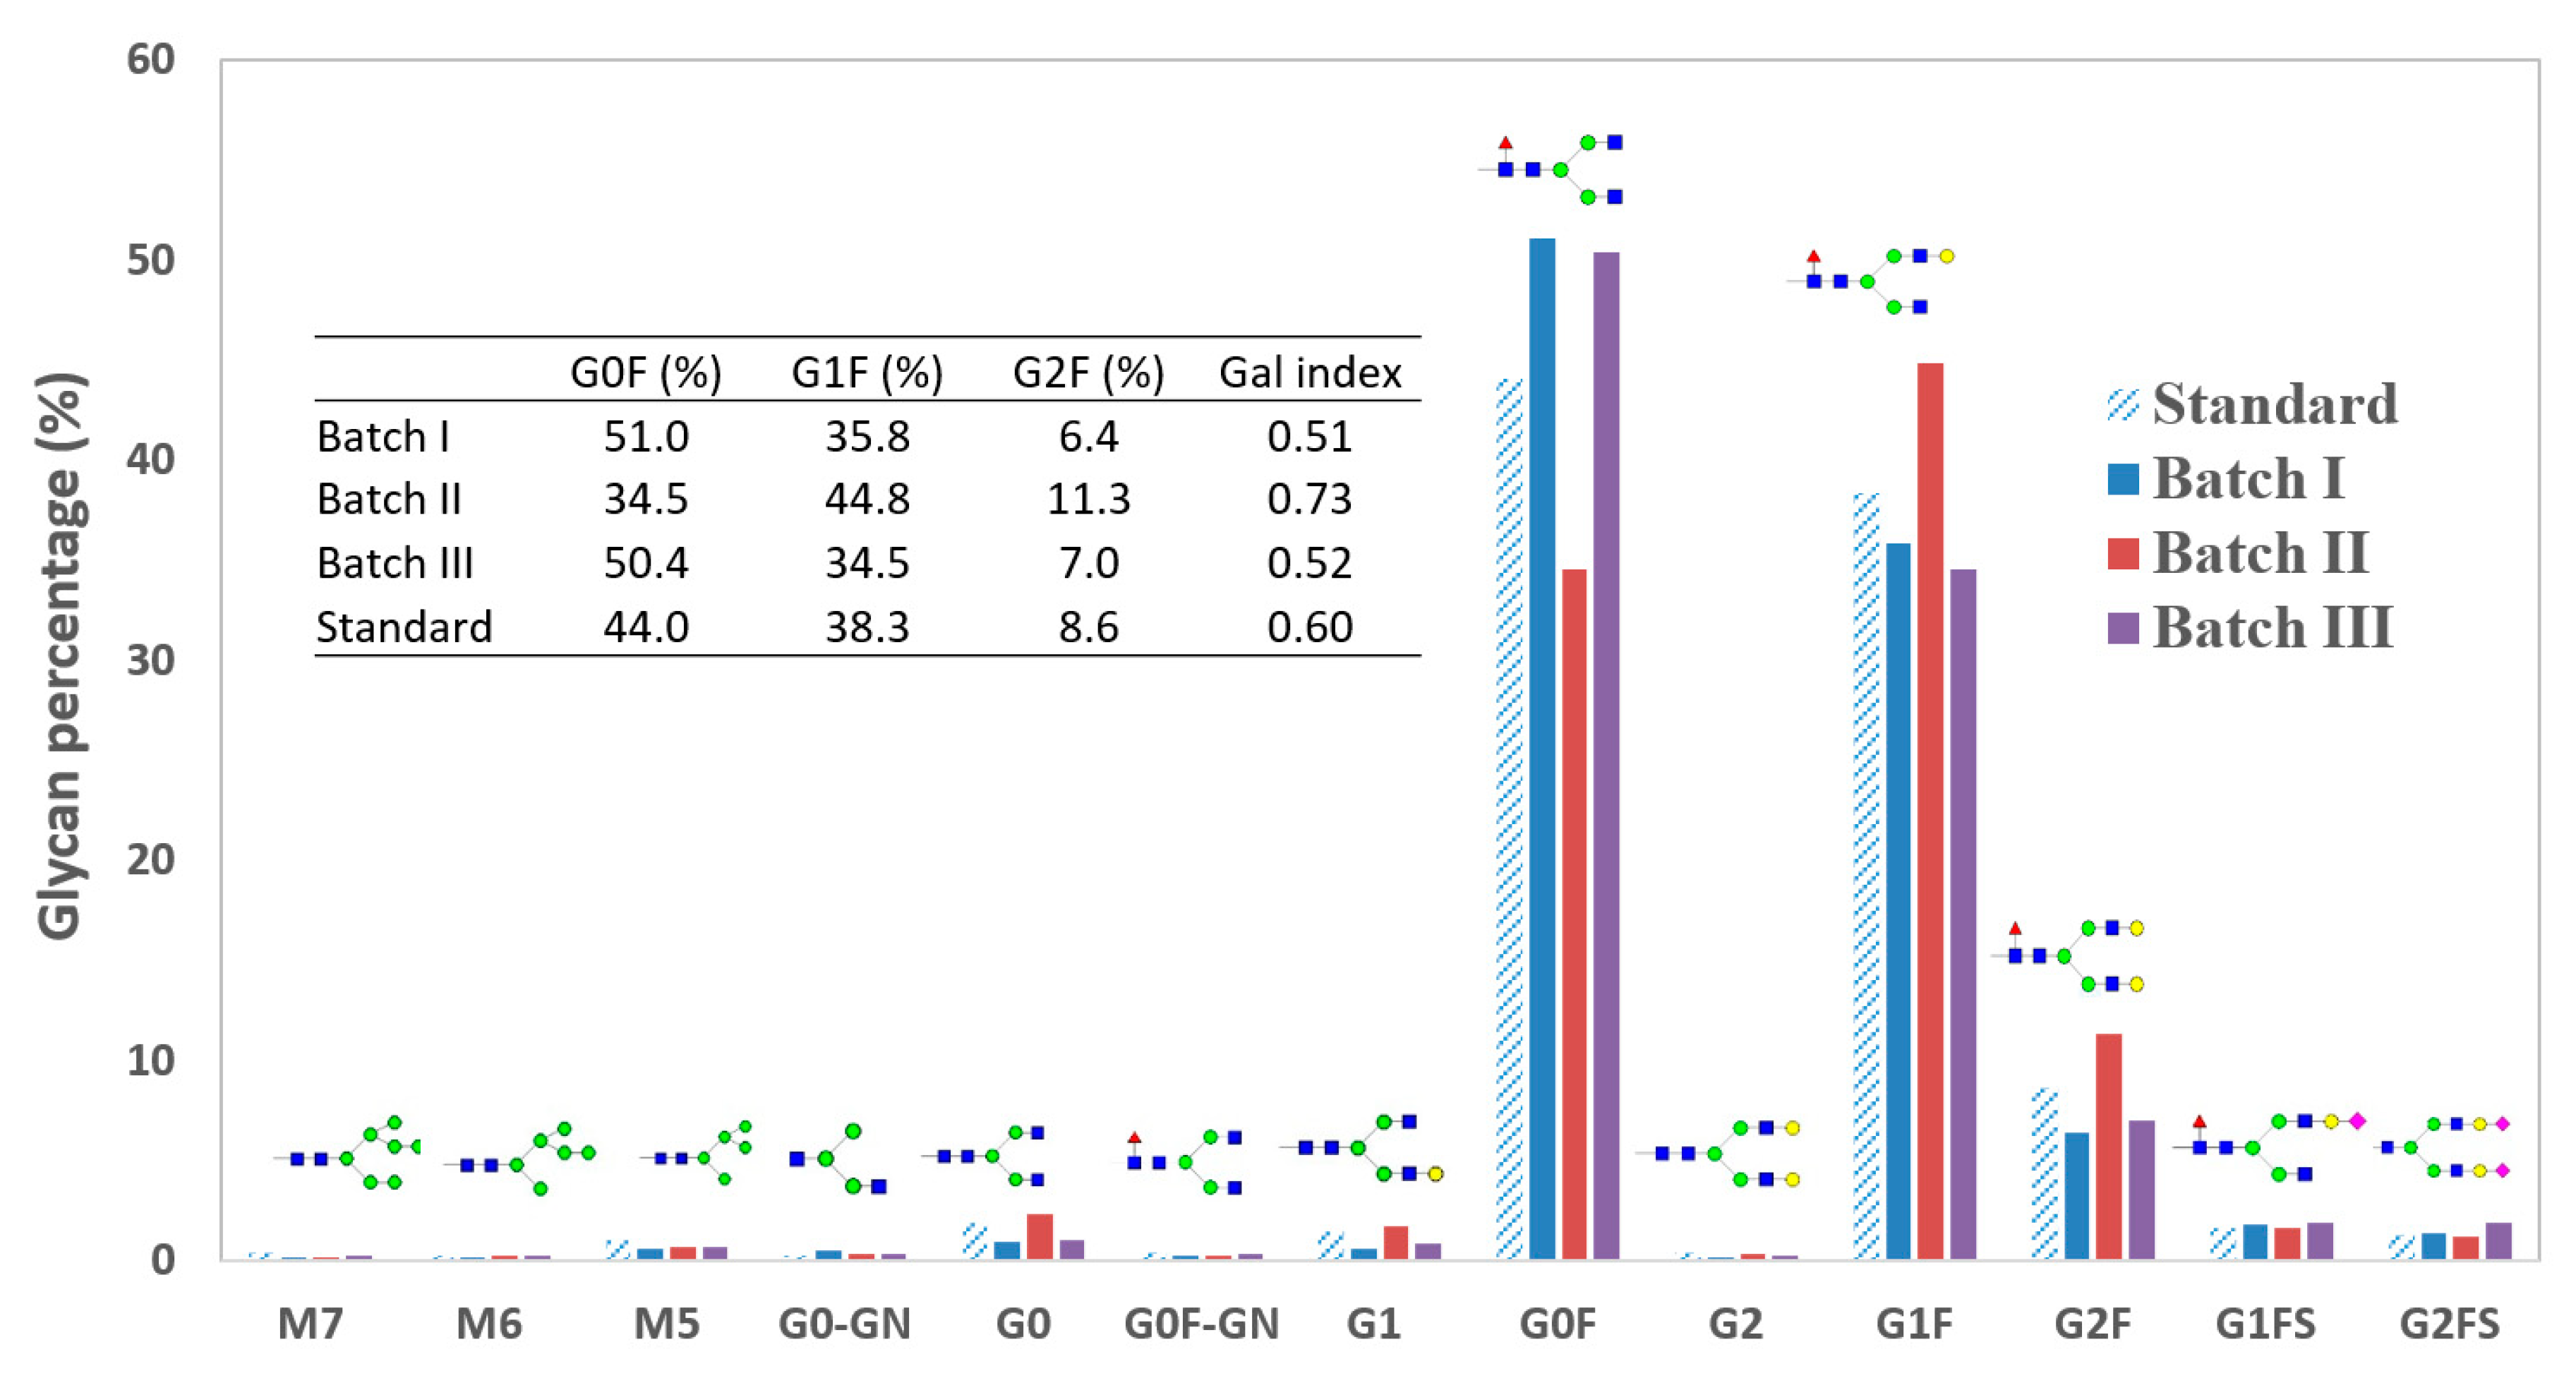
4.1. Glycan Variation across Batches

The profiles of cell growth and mAb production from the four batches (i.e., standard and Batch I, II and III) are shown in Figure 4. In these batches, cells reached peak density around 72 h or 96 h, followed by a rapid crash and absence of stationary phase. The period of 24–72 h (shaded in the plots) was considered as the cell exponential growth phase. In the following sections, the FBA and kinetic model were applied to this phase. Due to the lack of glycoform profile data at earlier days, we used glycoform profiles of mAbs at day 5 (Figure 5), assuming that the cross-batch glycoform profiles variation at day 5 in cultures could still represent the early point variation, even though the glycan for the mAbs produced at late culture would have been affected.
As expected for most mAbs, G0F, G1F and G2F were the most dominant glycoforms from cultures. Those three combined constituted more than 90% of the total glycan on mAbs. The rest of the glycoforms (e.g., high mannose, non-fucosylated or sialylated glycoforms) only represented a small fraction (each less than 1%) of the total glycoforms. The large population of G0F, G1F and G2F also indicates the highly completed fucosylation and N-aetyl-glucosaminylation since fucose and GlcNAc are both added to glycan before galactose (Figure 3A).
A GI value was used for each culture to represent the galactosylation level, as described in the Equation (1). A GI value of one represents a full galactosylation degree. For limited galactosylation, the GI value would be a number between zero and one. Compared to the standard batch (GI = 0.61), Batch I and III showed a lower level (GI = 0.52, 17% lower than the standard) and Batch II showed a higher level (GI = 0.74, 22% higher than the standard).

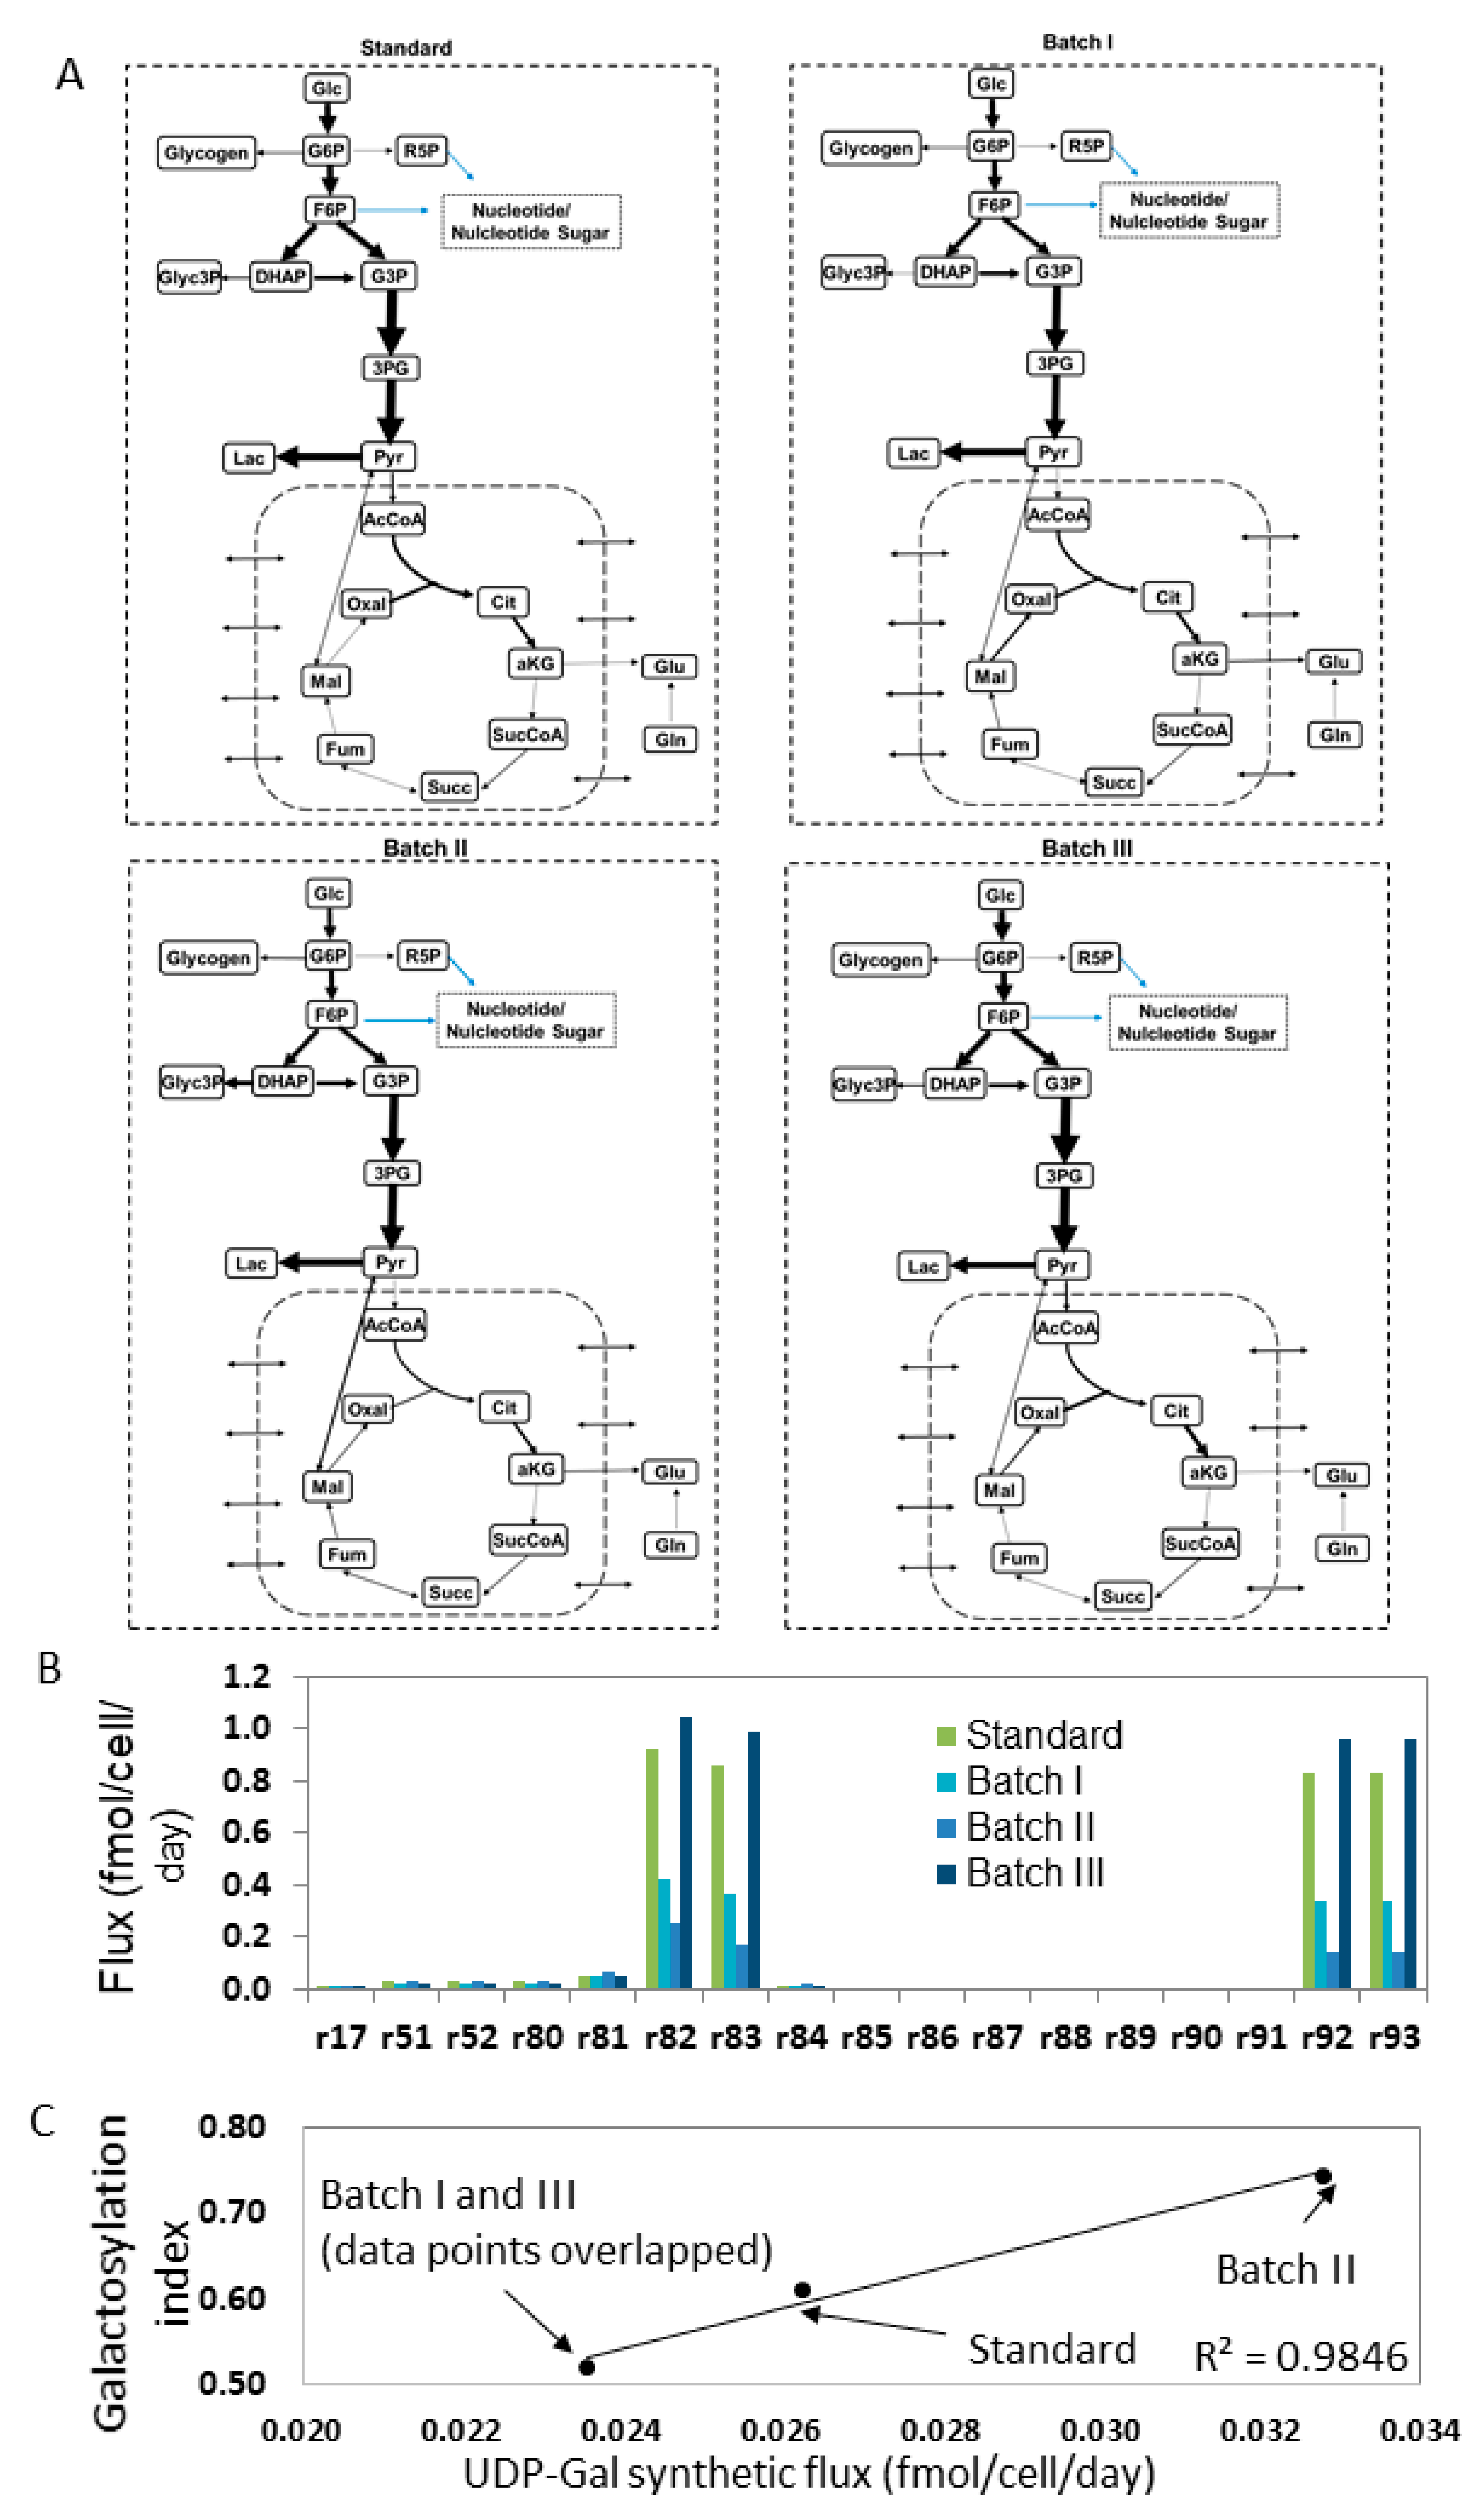
4.2. Estimating Nucleotide Sugar Fluxes by FBA

To estimate the intracellular fluxes for pathways including nucleotide sugars, the specific consumption or accumulation rates for the extracellular metabolites (glucose, lactate, ammonia and amino acids) were calculated during the exponential phase (24–72 h) in each culture. Fluxes of a total of 154 reactions were estimated. The complete set of flux values are not shown for brevity. Most of the carbon and nitrogen resources are distributed in the central metabolism fluxes. The distribution of TCA fluxes between the four batches was overall similar (Figure 6A), indicating that only little change had occurred in the energy generation during the exponential phase under these varied culture conditions. However, for the glycolysis, Batch I and II showed a lower glucose uptake flux than the standard batch and Batch III, coinciding with the slower growth of Batch I and II than the other two batches (Figure 4A).
The flux values of the seventeen reactions associated with nucleotide sugar synthesis and degradation are shown in Figure 6B. The list of reactions and reaction network can be referred to Table S1 and Figure 2B. The amount of fluxes flowing to several nucleotide sugars were calculated (Table 2). These nucleotide sugars include uridine diphosphate galactose (UDP-Gal), guanosine diphosphate mannose (GDP-Man), guanosine diphosphate fucose (GDP-Fuc), uridine diphosphate N-acetylglucosamine (UDP-GlcNAc) and cytidine-5′-monophospho-N-acetylneuraminic acid (CMP-Neu5Ac or CMP-SA). Variation was seen with the fluxes across four batches. When the overall galactosylation level from the four batches was plotted against the UDP-Gal synthetic flux, a significant linear correlation (R2 > 0.9) was found (Figure 6C). This correlation suggests that UDP-Gal level in cells has played a strong role in the galactosylation degree on mAbs and thus can be used as a relevant indicator to predict the galactosylation degree on mAbs.

4.3. Model Calibration

In this section, the concentrations of nucleotide sugars in the standard batch were calibrated by fitting the batch’s glycoform profiles to the kinetic model as described in Section 3.2. The values obtained are shown in the first column of Table 3. It was shown that the calibrated concentration of UDP-Gal was much lower than the other nucleotide sugars. A previous study where intracellular nucleotide sugar concentrations were measured in a hybridoma cell line found the range of concentration at 5–150 µM [29]. While the set of values listed in Table 3 was generated in silico, the range of 8–2000 µM is reasonable compared to the other study’s measured profiles. The values of kinetic parameters used in the model are shown in Table S2. The topological profiles from simulation for all the intermediate glycoforms are shown in Figure 7A. The glycan profile at the end of the Golgi is treated as the glycoform profiles on secreted mAbs. As shown in Figure 7B(i), the simulated glycoform profiles including G0F, G1F and G2F for the standard culture have well matched the experimental data.

4.4. Sensitivity Analysis of the Kinetic Model

The construction and parameter settings of a kinetic model can significantly affect a model’s performance [30,31]. Before predicting glycoform profiles for the other three batch cultures, we carried out a sensitivity analysis to examine if the model’s simulation with the current parameters can show expected cell behavior. To do so, each nucleotide sugar concentration was altered within a range from five times lower to five times higher than the calibrated value in the standard culture. The glycoform profiles were accordingly simulated (Figure S1, Supplementary Materials). As a result, several empiric characteristics of the cell line were shown, including: (1) The G0F, G1F and G2F distribution was highly sensitive to the variation of UDP-Gal concentrations (Figure S1-C); (2) Most of the glycoforms were insensitive to the variations at the UDP-GlcNAc and GDP-fucose concentrations (Figure S1-A and Figure 7B); (3) The sialylation level was insensitive to the variation of CMP-SA concentration (Figure S1-D). Ultimately, this sensitivity test proves the rationality of the structure and parameter values currently in our model.

4.5. Prediction of Glycoforms in Altered Culture Conditions

Finally, we tested the model to predict the glycoform profiles in the Batches I, II and III. As mentioned, the nucleotide sugar concentration values were the inputs for each prediction. The values were adjusted for each batch with the fold changes varied at the nucleotide sugar fluxes, following the steps described in Section 3.2. The concentration values after adjustments are shown in Table 3 (2nd to 4th columns). Note that the other parameters in the model remain the same as used in the calibration. The glycoform profiles simulated for mAbs in Batches I, II and III are respectively shown in Figure 7B (ii–iv). It was seen that the deviation between the simulated results and the experimental measurements was less than 10%. It was also noted that not only did the three major glycoforms (G0F, G1F, G2F) fit well with the experimental profiles but the distribution of all the other ten minor glycoforms were also consistent with the experimental results. The good agreement between the simulated and experimental profiles further indicates that the model construction and parameter setup had properly described the cellular physiology.

5. Discussion

Cell lines used in industry exhibit various characteristics in glycosylation. It was known from our experiments that the cell line has a limited processing capability for galactosylation. While only galactosylation was mainly found in our hybridoma processes, variation of high mannose (HM) glycoforms were found in CHO cells, indicating UDP-GlcNAc might also be limiting [32]. These cell line dependent characteristics should be considered in the kinetic model structures as going to be discussed later.
UDP-Gal is the main building block for galactosylation and has been found to be a limiting source of galactosylation [15,33,34]. Other possibilities of the process limitation might be associated with the activity of UDP-Gal transporter or galactosyltransferase. Several studies had previously shown that gene transcripts for glycosylation enzymes can be altered under different culture conditions [19,35]. According to our finding from FBA, the synthetic fluxes of UDP-Gal have correlated with the unsaturated level of galactosylation on mAbs. This provides the rationale for using the estimated nucleotide sugar level for N-linked glycoform prediction.
In several existing literatures, kinetic models have been made to link extracellular metabolites and nucleotide sugars with detailed kinetic reaction rates [22,29]. These reactions involve many kinetic constants which need to be parameterized beforehand. During cell growth and production, it remains unexplored if kinetic parameters would change, and therefore, it is a benefit to reduce parameter numbers in models. In this work, the usage of FBA for nucleotide sugar estimation and then base the flux level to adjust UDP-Gal concentrations in the Golgi for further prediction was to eliminate solving the excess parameters involved in the large network of nucleotide sugar synthesis. Even though we have only applied FBA to the exponential phase of the culture given the absence of stationary phase in cultures, the same approach can be applied to stationary phase, which is commonly seen for industrial fed-batch CHO cell cultures [36].
According to the FBA results, other nucleotide sugars, such as UDP-GlcNAc, GDP-fucose and CMP-SA were similarly altered. This indicates that the source of this variation was stemmed from precursors of these nucleotide sugars, such as G6P or F6P. A major effect on the carbon flux in glycolysis were probably raised by the varied culture conditions. However, the level of other monosaccharide on mAbs (such as fucose, mannose) was not affected by the variation of their influxes amongst the batches examined. This is because these pathways were not rate- limited by neither the substrate level nor other factors on the pathways, as a characteristic of the cell line. In fact, over 90% of glycan in all the four batches reached full attachment with fucose and GlcNAc. Although the terminal sialylation was exceptionally unsaturated, the limitation of sialic acid attached has been in general attributed to the steric hindrance on mAbs.
While non-parameter FBA is used in the first part of the model, the second model describing the kinetic details in the Golgi is necessary to obtain the distribution of differently galactosylated glycoforms (i.e., G0F, G1F and G2F). An inevitable weakness is the uncertainty of the parameters. While using most parameter values from literature, it is important for us to show that the model has exhibited the characteristic of the cell system— the galactosylation process is limited in this cell line.
Due to the data limitation in this study, we examined the model prediction with one time point glycan data. Further studies can be done to examine the model’s predictions in-process by comparing with the N-linked glycoform profiles over the course of cultures. Our recent study has showed detailed time series data for culture supplement, nucleotide sugars and N-linked glycoform profiles [20].

6. Conclusions

Real-time estimation of mAb glycosylation is highly desirable in manufacturing processes. In this work, a two-component modeling framework integrating FBA and glycosylation kinetic model was demonstrated. With the data tested from multiple altered cultures, it was shown that the model could successfully estimate the variation of glycosylation profiles from extracellular metabolite dynamic information. In the future, this approach can be potentially conducted in real time and used to monitor glycosylation against culture perturbations.

Supplementary Materials

The following are available online at https://www.mdpi.com/2227-9717/7/4/227/s1, Figure S1: Model-simulated glycan profiles in response to variation in each of the four nucleotide sugars. Table S1: Glycosylation precursor synthetic reactions. Table S2: Kinetic model parameter summary.

Author Contributions

Conceptualization, S.S. and Z.H.; Methodology, S.S. and Z.H.; Software, S.S. and Z.H.; Formal Analysis, S.S.; Experiments, C.D.A., S.C.L., K.A.B.; Writing-Original Draft Preparation, S.S.; Writing-Review & Editing, C.D.A., K.A.B., S.Y.; Supervision, S.Y.

Funding

This research was funded by NSF grant number 1706731.

Acknowledgments

The authors gratefully acknowledge scholarship support for this research from the Biomanufacturing Science and Technology Consortium (BSTC), University of Massachusetts Lowell. The bioreactor runs were funded by FDA/CDER Critical Path Project 1500. This project was also supported, in part, by an appointment to the Research Participation Program at the Center for Drug Evaluation and Research administered by the Oak Ridge Institute for Science and Education through an interagency agreement between the U.S. Department of Energy and the U.S. Food and Drug Administration.

Conflicts of Interest

No conflict of interest is reported.

References

  1. Aggarwal, S. What’s fueling the biotech engine—2012 to 2013. Nat. Biotechnol. 2014, 32, 32–39. [Google Scholar] [CrossRef]
  2. Siemiatkoski, J.; Ma, S.; Park, J.; Brorson, K.; Swann, P.; McLeod, L. Glycosylation of therapeutic proteins—Current understanding of structure-function relationships. BioProcess Int. 2011, 9, 48–53. [Google Scholar]
  3. Sha, S.; Agarabi, C.; Brorson, K.; Lee, D.Y.; Yoon, S. N-Glycosylation Design and Control of Therapeutic Monoclonal Antibodies. Trends Biotechnol. 2016, 34, 835–846. [Google Scholar] [CrossRef] [PubMed]
  4. Schiestl, M.; Stangler, T.; Torella, C.; Cepeljnik, T.; Toll, H.; Grau, R. Acceptable changes in quality attributes of glycosylated biopharmaceuticals. Nat. Biotechnol. 2011, 29, 310–312. [Google Scholar] [CrossRef]
  5. Raju, T.S.; Jordan, R.E. Galactosylation variations in marketed therapeutic antibodies. MAbs 2012, 4, 385–391. [Google Scholar] [CrossRef] [Green Version]
  6. Zupke, C.; Brady, L.J.; Slade, P.G.; Clark, P.; Caspary, R.G.; Livingston, B.; Taylor, L.; Bigham, K.; Morris, A.E.; Bailey, R.W. Real-time product attribute control to manufacture antibodies with defined N-linked glycan levels. Biotechnol. Prog. 2015, 31, 1433–1441. [Google Scholar] [CrossRef] [PubMed]
  7. Pais, D.A.; Carrondo, M.J.; Alves, P.M.; Teixeira, A.P. Towards real-time monitoring of therapeutic protein quality in mammalian cell processes. Curr. Opin. Biotechnol. 2014, 30, 161–167. [Google Scholar] [CrossRef] [PubMed]
  8. Read, E.K.; Bradley, S.A.; Smitka, T.A.; Agarabi, C.D.; Lute, S.C.; Brorson, K.A. Fermentanomics Informed Amino Acid Supplementation of an Antibody Producing Mammalian Cell Culture. Biotechnol. Prog. 2012, 29, 745–753. [Google Scholar] [CrossRef]
  9. Zhang, A.; Tsang, V.L.; Moore, B.; Shen, V.; Huang, Y.M.; Kshirsagar, R.; Ryll, T. Advanced process monitoring and feedback control to enhance cell culture process production and robustness. Biotechnol. Bioeng. 2015, 112, 2495–2504. [Google Scholar] [CrossRef] [PubMed]
  10. Larson, T.M.; Gawlitzek, M.; Evans, H.; Albers, U.; Cacis, J. Chemometric evaluation of on-line high-pressure liquid chromatography in mammalian cell cultures: Analysis of amino acids and glucose. Biotechnol. Bioeng. 2002, 77, 553–563. [Google Scholar] [CrossRef] [PubMed]
  11. Bhatia, H.; Mehdizadeh, H.; Drapeau, D.; Yoon, S. In-line monitoring of amino acids in mammalian cell cultures using raman spectroscopy and multivariate chemometrics models. Eng. Life Sci. 2018, 18, 55–61. [Google Scholar] [CrossRef]
  12. Cha, H.-M.; Lim, J.-H.; Lee, K.-S.; Kim, D.-I. Nucleotide sugar precursor feeding strategy to enhance sialylation of albumin-erythropoietin in CHO cell cultures. Process Biochem. 2018, 66, 197–204. [Google Scholar] [CrossRef]
  13. Villiger, T.K.; Steinhoff, R.F.; Ivarsson, M.; Solacroup, T.; Stettler, M.; Broly, H.; Krismer, J.; Pabst, M.; Zenobi, R.; Morbidelli, M.; et al. High-throughput profiling of nucleotides and nucleotide sugars to evaluate their impact on antibody N-glycosylation. J. Biotechnol. 2016, 229, 3–12. [Google Scholar] [CrossRef]
  14. Blondeel, E.J.; Braasch, K.; McGill, T.; Chang, D.; Engel, C.; Spearman, M.; Butler, M.; Aucoin, M.G. Tuning a MAb glycan profile in cell culture: Supplementing N-acetylglucosamine to favour G0 glycans without compromising productivity and cell growth. J. Biotechnol. 2015, 214, 105–112. [Google Scholar] [CrossRef]
  15. Kochanowski, N.; Blanchard, F.; Cacan, R.; Chirat, F.; Guedon, E.; Marc, A.; Goergen, J.L. Influence of intracellular nucleotide and nucleotide sugar contents on recombinant interferon-gamma glycosylation during batch and fed-batch cultures of CHO cells. Biotechnol. Bioeng. 2008, 100, 721–733. [Google Scholar] [CrossRef]
  16. Chee Furng Wong, D.; Tin Kam Wong, K.; Tang Goh, L.; Kiat Heng, C.; Gek Sim Yap, M. Impact of dynamic online fed-batch strategies on metabolism, productivity and N-glycosylation quality in CHO cell cultures. Biotechnol. Bioeng. 2005, 89, 164–177. [Google Scholar] [CrossRef] [PubMed]
  17. Lewis, A.M.; Croughan, W.D.; Aranibar, N.; Lee, A.G.; Warrack, B.; Abu-Absi, N.R.; Patel, R.; Drew, B.; Borys, M.C.; Reily, M.D.; et al. Understanding and Controlling Sialylation in a CHO Fc-Fusion Process. PLoS ONE 2016, 11, e0157111. [Google Scholar] [CrossRef]
  18. Sou, S.N.; Sellick, C.; lEE, K.; Mason, A.; Kyriakopoulos, S.; Polizzi, K.M.; Kontoravdi, C. How does mild hypothermia affect monoclonal antibody glycosylation. Biotechnol. Bioeng. 2015, 112, 1165–1176. [Google Scholar] [CrossRef]
  19. St Amand, M.M.; Radhakrishnan, D.; Robinson, A.S.; Ogunnaike, B.A. Identification of manipulated variables for a glycosylation control strategy. Biotechnol. Bioeng. 2014, 111, 1957–1970. [Google Scholar] [CrossRef] [PubMed]
  20. Sha, S.; Yoon, S. An investigation of nucleotide sugar dynamics under the galactose supplementation in CHO cell culture. Process Biochem. 2019. [Google Scholar] [CrossRef]
  21. Agarabi, C.D.; Schiel, J.E.; Lute, S.C.; Chavez, B.K.; Boyne, M.T.; Brorson, K.A.; Khan, M.; Read, E.K. Bioreactor process parameter screening utilizing a Plackett–Burman design for a model monoclonal antibody. J. Pharm. Sci. 2015, 104, 1919–1928. [Google Scholar] [CrossRef] [PubMed]
  22. Ohadi, K.; Aghamohseni, H.; Gädke, J.; Moo-Young, M.; Legge, R.L.; Scharer, J.; Budman, H.M. Novel Dynamic Model to Predict the Glycosylation Pattern of Monoclonal Antibodies from Extracellular Cell Culture Conditions. In Proceedings of the 12th IFAC Symposium on Computer Applications in Biotechnology 2013, Mumbai, India, 16–20 December 2013. [Google Scholar]
  23. Leighty, R.W.; Antoniewicz, M.R. Dynamic metabolic flux analysis (DMFA): A framework for determining fluxes at metabolic non-steady state. Metab. Eng. 2011, 13, 745–755. [Google Scholar] [CrossRef] [PubMed]
  24. Selvarasu, S.; Ho, Y.S.; Chong, W.P.; Wong, N.S.; Yusufi, F.N.; Lee, Y.Y.; Yap, M.G.; Lee, D.Y. Combined in silico modeling and metabolomics analysis to characterize fed-batch CHO cell culture. Biotechnol. Bioeng. 2012, 109, 1415–1429. [Google Scholar] [CrossRef]
  25. Krambeck, F.J.; Betenbaugh, M.J. A mathematical model of N-linked glycosylation. Biotechnol. Bioeng. 2005, 92, 711–728. [Google Scholar] [CrossRef] [PubMed]
  26. Hossler, P.; Mulukutla, B.C.; Hu, W.-S. Systems analysis of N-Glycan processing in mammalian cells. PLoS ONE 2007, 2, e713. [Google Scholar] [CrossRef]
  27. Kontoravdi, C.; Asprey, S.P.; Pistikopoulos, E.N.; Mantalaris, A. Development of a dynamic model of monoclonal antibody production and glycosylation for product quality monitoring. Comput. Chem. Eng. 2007, 31, 392–400. [Google Scholar] [CrossRef]
  28. del Val, I.J.; Nagy, J.M.; Kontoravdi, C. A dynamic mathematical model for monoclonal antibody N-linked glycosylation and nucleotide sugar donor transport within a maturing Golgi apparatus. Biotechnol. Prog. 2011, 27, 1730–1743. [Google Scholar] [CrossRef]
  29. Jedrzejewski, P.M.; del Val, I.J.; Constantinou, A.; Dell, A.; Haslam, S.M.; Polizzi, K.M.; Kontoravdi, C. Towards controlling the glycoform: A model framework linking extracellular metabolites to antibody glycosylation. Int. J. Mol. Sci. 2014, 15, 4492–4522. [Google Scholar] [CrossRef]
  30. Kyriakopoulos, S.; Ang, K.S.; Lakshmanan, M.; Huang, Z.; Yoon, S.; Gunawan, R.; Lee, D.Y. Kinetic Modeling of Mammalian Cell Culture Bioprocessing: The Quest to Advance Biomanufacturing. Biotechnol. J. 2017. [Google Scholar] [CrossRef]
  31. Sha, S.; Huang, Z.; Wang, Z.; Yoon, S. Mechanistic modeling and applications for CHO cell culture development and production. Curr. Opin. Chem. Eng. 2018, 22, 54–61. [Google Scholar] [CrossRef]
  32. Shi, H.H.; Goudar, C.T. Recent Advances in the Understanding of Biological Implications and Modulation Methodologies of Monoclonal Antibody N-Linked High Mannose Glycans. Biotechnol. Bioeng. 2014, 111, 1907–1919. [Google Scholar] [CrossRef]
  33. Gramer, M.J.; Eckblad, J.J.; Donahue, R.; Brown, J.; Shultz, C.; Vickerman, K.; Priem, P.; van den Bremer, E.T.; Gerritsen, J.; van Berkel, P.H. Modulation of antibody galactosylation through feeding of uridine, manganese chloride and galactose. Biotechnol. Bioeng. 2011, 108, 1591–1602. [Google Scholar] [CrossRef] [PubMed]
  34. Wong, N.S.; Wati, L.; Nissom, P.M.; Feng, H.T.; Lee, M.M.; Yap, M.G. An investigation of intracellular glycosylation activities in CHO cells: Effects of nucleotide sugar precursor feeding. Biotechnol. Bioeng. 2010, 107, 321–336. [Google Scholar] [CrossRef]
  35. Chen, P.; Harcum, S.W. Differntial display identifies genes in CHO cells sensitive to elevated ammonium. Appl. Biochem. Biotechnol. 2007, 141, 349–359. [Google Scholar] [CrossRef]
  36. Huang, Z.; Lee, D.Y.; Yoon, S. Quantitative intracellular flux modeling and applications in biotherapeutic development and production using CHO cell cultures. Biotechnol. Bioeng. 2017, 114, 2717–2728. [Google Scholar] [CrossRef]
Figure 1. The workflow of two-component prediction model of glycoform profiles.
Processes 07 00227 g001
Figure 2. Simplified view of metabolic pathways included in the flux balance analysis (FBA). (A) central metabolism; (B) nucleotide sugar synthetic pathways; (C) oligosaccharide modification process. The numbers of reactions correspond with the ones initially used in Reference [18].
Processes 07 00227 g002
Figure 3. Structure of the kinetic model. (A) Reaction network of oligosaccharide evolvement in the Golgi. (B) The analog of Golgi as a single plug flow reactor in the model. Nucleotide sugars are transported from cytoplasm to Golgi. (C) Distribution profile of glycosylation enzymes in Golgi as adjusted from Reference [27].
Processes 07 00227 g003
Figure 4. Cell culture performance (A) viable cell density; (B) mAb concentration. The exponential growth phase is shaded in grey.
Processes 07 00227 g004
Figure 5. Distribution of all 13 glycoforms detected from the standard batch and batches I, II and III. G0F, G1F and G2F comprise over 90% of all the glycoforms.
Processes 07 00227 g005
Figure 6. FBA results. (A) Flux distribution in the central metabolism network for four batches. (B) Fluxes of the reactions associated with glycosylation. (C) The linear correlation between UDP-Gal flux and the overall galactosylation level.
Processes 07 00227 g006
Figure 7. Kinetic model simulation. (A) The topological profile of high-mannose (HM), galactosylated and sialylated glycoforms evolving along the normalized reactor length-axis in the Golgi. (B) Calibration and simulation of the kinetic model describing oligosaccharide modification. (i) Simulation of the standard batch output after the calibration; (ii) simulation of Batch I glycan output; (iii) simulation of Batch II glycan output; (iv) simulation of Batch III glycan output.
Processes 07 00227 g007
Table 1. Operating patterns of the batches used in this study.
0 h48–72 h72 h
Batch ID% DO Set PointSparge Rate (SLPH)Agitation Rate (RPM)Temperature (°C)Inoculation Density (Cells/mL)Nonessential Amino AcidsFatty AcidsHydrocortisoneFeeding StrategyTemperature Shift
(at 72 h)
Standard batch200.3903750,000AddAddAddBolusShift
Batch I400.317037100,000Add BolusNo Shift
Batch II400.39035.5100,000 AddAddDripNo Shift
Batch III300.51353775,000 BolusNo Shift
Table 2. Influx values of the nucleotide sugars being synthesized (fmol/cell/day).
StandardBatch IBatch IIBatch III
UDP-Gal0.02620.02360.03280.024
GDP-Man0.03940.03530.04920.035
GDP-Fuc0.01310.01180.01640.012
UDP-GlcNAc0.06560.05890.08200.058
CMP-SA0.02620.02360.03280.023
Table 3. Input value setting for nucleotide sugars (µM).
Standard aBatch I bBatch II bBatch III b
UDP-Gal9.4812.68
UDP-GlcNAc1600143619981403
GDP-FUC576517719517
CMP-SA9508521187833
a—the nucleotide sugar concentrations were calibrated with experimental data. b—the nucleotide sugar concentrations were the product of the calibrated value and the ratio of nucleotide sugar fluxes between the specific condition and the standard condition.

