Article

Phytochemical Content of Melissa officinalis L. Herbal Preparations Appropriate for Consumption

by
Vassiliki T. Papoti
1,2,*,
Nikolaos Totomis
1,
Aikaterini Atmatzidou
1,
Kyriaki Zinoviadou
2,
Anna Androulaki
3,
Dimitris Petridis
1 and
Christos Ritzoulis
1
1
Department of Food Technology, Alexander Technological Educational Institute of Thessaloniki, Thessaloniki GR-57400, Greece
2
Department of Food Science & Technology, Perrotis College, American Farm School, Thessaloniki GR-57001, Greece
3
Aliment Lab, Water & Food Analysis-Consultants of Food/Beverage Industries, N. Plastira 3, Triandria, Thessaloniki GR-55337, Greece
*
Author to whom correspondence should be addressed.
Processes 2019, 7(2), 88; https://doi.org/10.3390/pr7020088
Submission received: 18 January 2019 / Revised: 1 February 2019 / Accepted: 5 February 2019 / Published: 12 February 2019
(This article belongs to the Special Issue Green Separation and Extraction Processes)

Abstract

:
Melissa Officinalis L. (MOL) domestic preparations appropriate for consumption were studied by monitoring content in Na, K, Ca, Li, phenolic bioactives (total phenols, hydroxycinnamic acid derivatives and flavonols), and antioxidant activity (1,1-diphenyl-2-picrylhydrazyl radical inhibition (DPPH) and ferric reducing ability (FRAP)). The effects of practice applied, material to solvent ratio, time of preparation, and solvent were studied. MOL decoctions and infusions, commonly prepared at home, were better or of equal nutritional value to preparations upon ultrasounds or maceration concerning the studied parameters. Aqueous MOL preparations were richer in total phenols (704–1949 mg per 250 mL) and the examined macroelements (1.1–2.9, 30.5–288.4 and 50.1–176.1 mg Na, K and Ca per 250 mL, respectively) and showed better antioxidant activity compared to ethanol counterparts. The 25% w/v hydroethanolic MOL preparations, suitable for consumption, presented a significant content in phenolic antioxidants and in the examined minerals, too. MOL infusions were significantly richer in total phenols with respective chamomile and olive leaf ones, comparatively examined. Overall acceptance scores of aqueous MOL preparations indicated that bitterness has to be masked for efficient reception by the consumers.

1. Introduction

The bioactivity of plants has been acknowledged worldwide throughout centuries; whereas lately, the interest in the beneficial power of nature has expanded. Scientists, consumers, food, pharmaceutical and cosmetic industries embrace Hippocrates’ (Greek physician, 460–377 BC) strong belief about the healing dynamic of natural sources. However, no matter that the bioactivity of numerous natural products has been well proved, there is still the need to ensure their safety [1]. Plant formulations have been reappraised, among others, as being of lower risk compared to synthetic counterparts. Since this is not always valid, materials that own a “safety passport” due to a history of safe use should be more preferable for exploitation than others [1]. Cultivation of the latter could be seen as a profitable commercial opportunity aiming at economic crisis outlets.
Melissa Officinalis L. (lemon balm or Melissa; MOL) is an edible perennial herb of the Lamiaceae family. Its name originates to the Greek words for bee (melissa) and honey (meli). There are worldwide records of its medicinal and culinary use [2,3,4] that date back to Dioscorides (father of pharmacology) times (40–90 A.D.) and which allow its safe exploitation [4,5,6].
MOL is reputed in folk medicine for memory enhancing effects, promoting long life, action against gastrointestinal disorders, rheumatism, Graves’, Alzheimer’s, thyroid diseases, flatulence, colic, anemia, nausea, vertigo, syncope, asthma, influenza, bronchitis, amenorrhea, cardiac disorders, epilepsy, insomnia, migraines, nervousness, malaise, depression, psychosis, hysteria, wounds [2,4,5,6]. Literature continually confirms the medicinal effectiveness of MOL preparations, as well as its antioxidant and other properties suggesting its use against anxiety disorders, digestive disturbances and for prevention of oxidative stress-related diseases [6]. The bioactivity of its extracts is mainly attributed, as for any other plant formulation, to the comprised phenolic acids, flavonoids and terpenoids. Qualitative and quantitative composition of MOL extracts depends on the inherent variability of the material (e.g., origin, harvest time, phenological phase of development) and the treatments (e.g., drying, extraction parameters) applied, as in any other natural source [7,8,9]. Furthermore, MOL contains essential oils of high value [10].
The bioactivity of MOL extracts has been pointed out, whilst recent studies deal with optimization of phytochemicals extraction from MOL [11,12]. Though, such practices are based on sophisticated extraction means or/and comprise solvents inappropriate for consumption. Additionally, other studies report either on individual preparations, that contain higher quantities of the herb than those normally consumed or deal with other objectives [13,14,15]. Meanwhile, due to the inherent variability of the material, differences in treatment and analysis conditions used, findings are difficult to compare. The innovation of the present study is the comparative examination of a wide array of preparations appropriate for consumption that may contribute to the daily intake of phytochemicals with nutritional interest.
The objective of the present study concerns the appraisal of the bioactive potential of MOL preparations as regards their content in total phenols, total hydroxycinnamic acid derivatives, total flavonols, antioxidant activity, pigments and content in selected minerals (Na, K, Ca and Li). A number of preparations easily made at home and usually consumed by general population (i.e., infusions, decoctions and macerates) are employed. In addition, extracts prepared upon ultrasounds are also studied due to the wide, advantageous (low cost, simplicity of use, short extraction times, high extraction yield, fast kinetics and recovery of thermolibile compounds) and efficient applicability of the latter in phytochemicals extraction [16]. Preparations of different material to solvent ratio, time and solvent (water, ethanol, 25% hydroethanolic mixture) are examined. Additionally, representative MOL infusions are examined in parallel with respective chamomile and olive leaf ones, known for their bioactive potential [17,18]. Aqueous MOL preparations are also assessed for their overall acceptance from a 45-member panel.

2. Materials and Methods

2.1. Chemicals

Caffeic acid (98%, CAF) and Li2SO4 × H2O (99.1%) were purchased from Riedel de Haën (Seelze, Germany). Gallic acid (99.5%, GAL), quercetin (99%, QUER), DPPH radical (1,1-diphenyl-2-picrylhydrazyl, 90%) and 2,4,6-tripyridyl-s-triazine (TPTZ), FeCl3 × 6H2O were from Sigma Chemical Co. (St. Louis, MO, USA). Folin-Ciocalteu reagent and Νa2CO3 (99.8%) were from Panreac Química (Barcelona, Spain). Potassium (K), High Performance Liquid Chromatography grade methanol (MeOH), NaCl, Span 60 and Tween 20 were from Merck (Darmstadt, Germany). Sodium (Na) and calcium (Ca) were from Polyscience (Niles, Illinois, USA). LiCl was from Sigma Aldrich (Berlin, Germany). All other common reagents and solvents were of the appropriate purity from various suppliers and the water used was deionized obtained by an ion-exchange resin system (ZALION 2000, IONEL, Athens, Greece) with a minimum resistance of 800,000 Ω/cm.

2.2. Plant Materials

Melissa Officinalis L. (MOL) was donated in a dry form by Apivita Cosmetic Company (Athens, Greece); the sample was collected from an organic farm placed in Arkadia region (Tripoli, Greece). Chamomile (CHM) was purchased in a dry form from an open market in Thessaloniki, Greece. Olive leaf (OLF) sample used was a mixture of lyophilized leaves collected from various olive trees grown in Thessaloniki, Greece.

2.3. Herbal Preparations

The studied extracts were prepared as described:
  • Decoction (D): A suitable amount of deionized water was boiled in a Duran bottle. Then, a suitable portion of MOL (2% w/v) was added and the mixture was further boiled for 5, 10 or 15 min (namely D MOL 2% 5’ W, D MOL 2% 10’ W, D MOL 2% 15’ W).
  • Infusion A: A suitable amount of boiled deionized water was immediately transferred to a Duran bottle that contained an appropriate portion of the plant material (2% w/v of MOL, CHM or OLF; namely I(A) MOL 2% 10’ W, I(A) CHM 2% 10’ W, I(A) OLF 2% 10’ W). The mixture was left to stand at room temperature for 10 min. 0.5% (I(A) MOL 0.5% 10’ W) and 4% w/v (I(A) MOL 4% 10’ W) MOL infusions were also prepared in the same way.
  • Infusion B: A Duran bottle containing an appropriate amount of deionized water was placed in a water bath at 80 °C. Then, a suitable portion of MOL (2% w/v) was added and the mixture was left to stand for 10 min (I(B) MOL 2% 10’ W).
  • Macerate: A suitable amount of MOL (2% w/v) was macerated in water (M MOL 2% 24 h W), ethanol (M MOL 2% 24 h E) or aqueous ethanol (EtOH/H2O: 25/75 v/v; M MOL 2% 24 h E/W) for 24 h at room temperature under periodical magnetic stirring.
  • Extract by Ultrasounds: MOL (2% w/v) was treated in an ultrasonic bath (Elmas 30H Elmasonic, Elma, Singen, Germany; ultrasonic power effective 80 W, ultrasonic frequency 37 kHz) at room temperature for 10 min. Extraction solvent was water (S MOL 2% 10’ W), ethanol (S MOL 2% 10’ E) or aqueous ethanol (EtOH/H2O: 25/75 v/v; S MOL 2% 10’ E/W)
Extracts were in each case prepared in triplicate and combined to a representative extract. Aliquots of the representative extracts were used in the determination of minerals, total phenol and pigments content. Another aliquot was brought up to dryness and used for the antioxidant activity studies, extraction yield determination and classification of bioactive compounds. Aqueous extracts were lyophilized in a freeze-dryer (Freeze dryer Gamma 1-20 LMC2, Christ, Osterode, Germany). Ethanolic extracts were evaporated to dryness by a rotary evaporator (Rotarvapor-R, Büchi, Flawil, Switzerland) under vacuum (at 60 °C). Hydroethanolic extracts were initially evaporated by the rotary evaporator to remove the ethanol fraction and then lyophilized to obtain freeze-dried extracts.

2.4. Content in Total Phenols (TP) Determined via the Folin-Ciocalteu Assay

Suitable aliquots of the extracts were transferred in a 10 mL volumetric flask and then, water (5 mL) and the Folin-Ciocalteu reagent (0.5 mL, Panreac Química, Barcelona, Spain) were added. After 3 min, 1 mL of carboante sodium solution (35% w/v) was added and the solution was further diluted with water to 10 mL. One hour latter the absorbance was measured at 725 nm against a blank solution with the aid of a spectrophotometer (Heλioς alpha and Beta, Thermo Scientific, London, England). TP content was expressed as mg CAF/250 mL extract through a CAF calibration curve. All determinations were performed in triplicate at room temperature and data are given as the mean ± standard deviation.

2.5. Determination and Classification of Different Bioactive Phenolic Compounds

Determination of bioactive phenolic classes was carried out according to Obied et al. [19] with slight modifications. 0.5 mL of MOL extract (2 mg dry MOL extract/mL MeOH) was mixed with 1 mL 0.1% HCl–ethanol solution and 8.5 mL 2% HCl–ethanol solution. The absorbance of the mixture was measured after 30 min at 280, 320 and 360 nm to evaluate total phenols, hydroxycinnamic acid derivatives and flavonols, respectively. The relative standard curves were prepared using GAL (65–400 mg/L), CAF (50–400 mg/L), and QUER (55–460 mg/L) solutions in MeOH, respectively. Measurements were carried out in triplicate and data are given as the mean ± standard deviation.

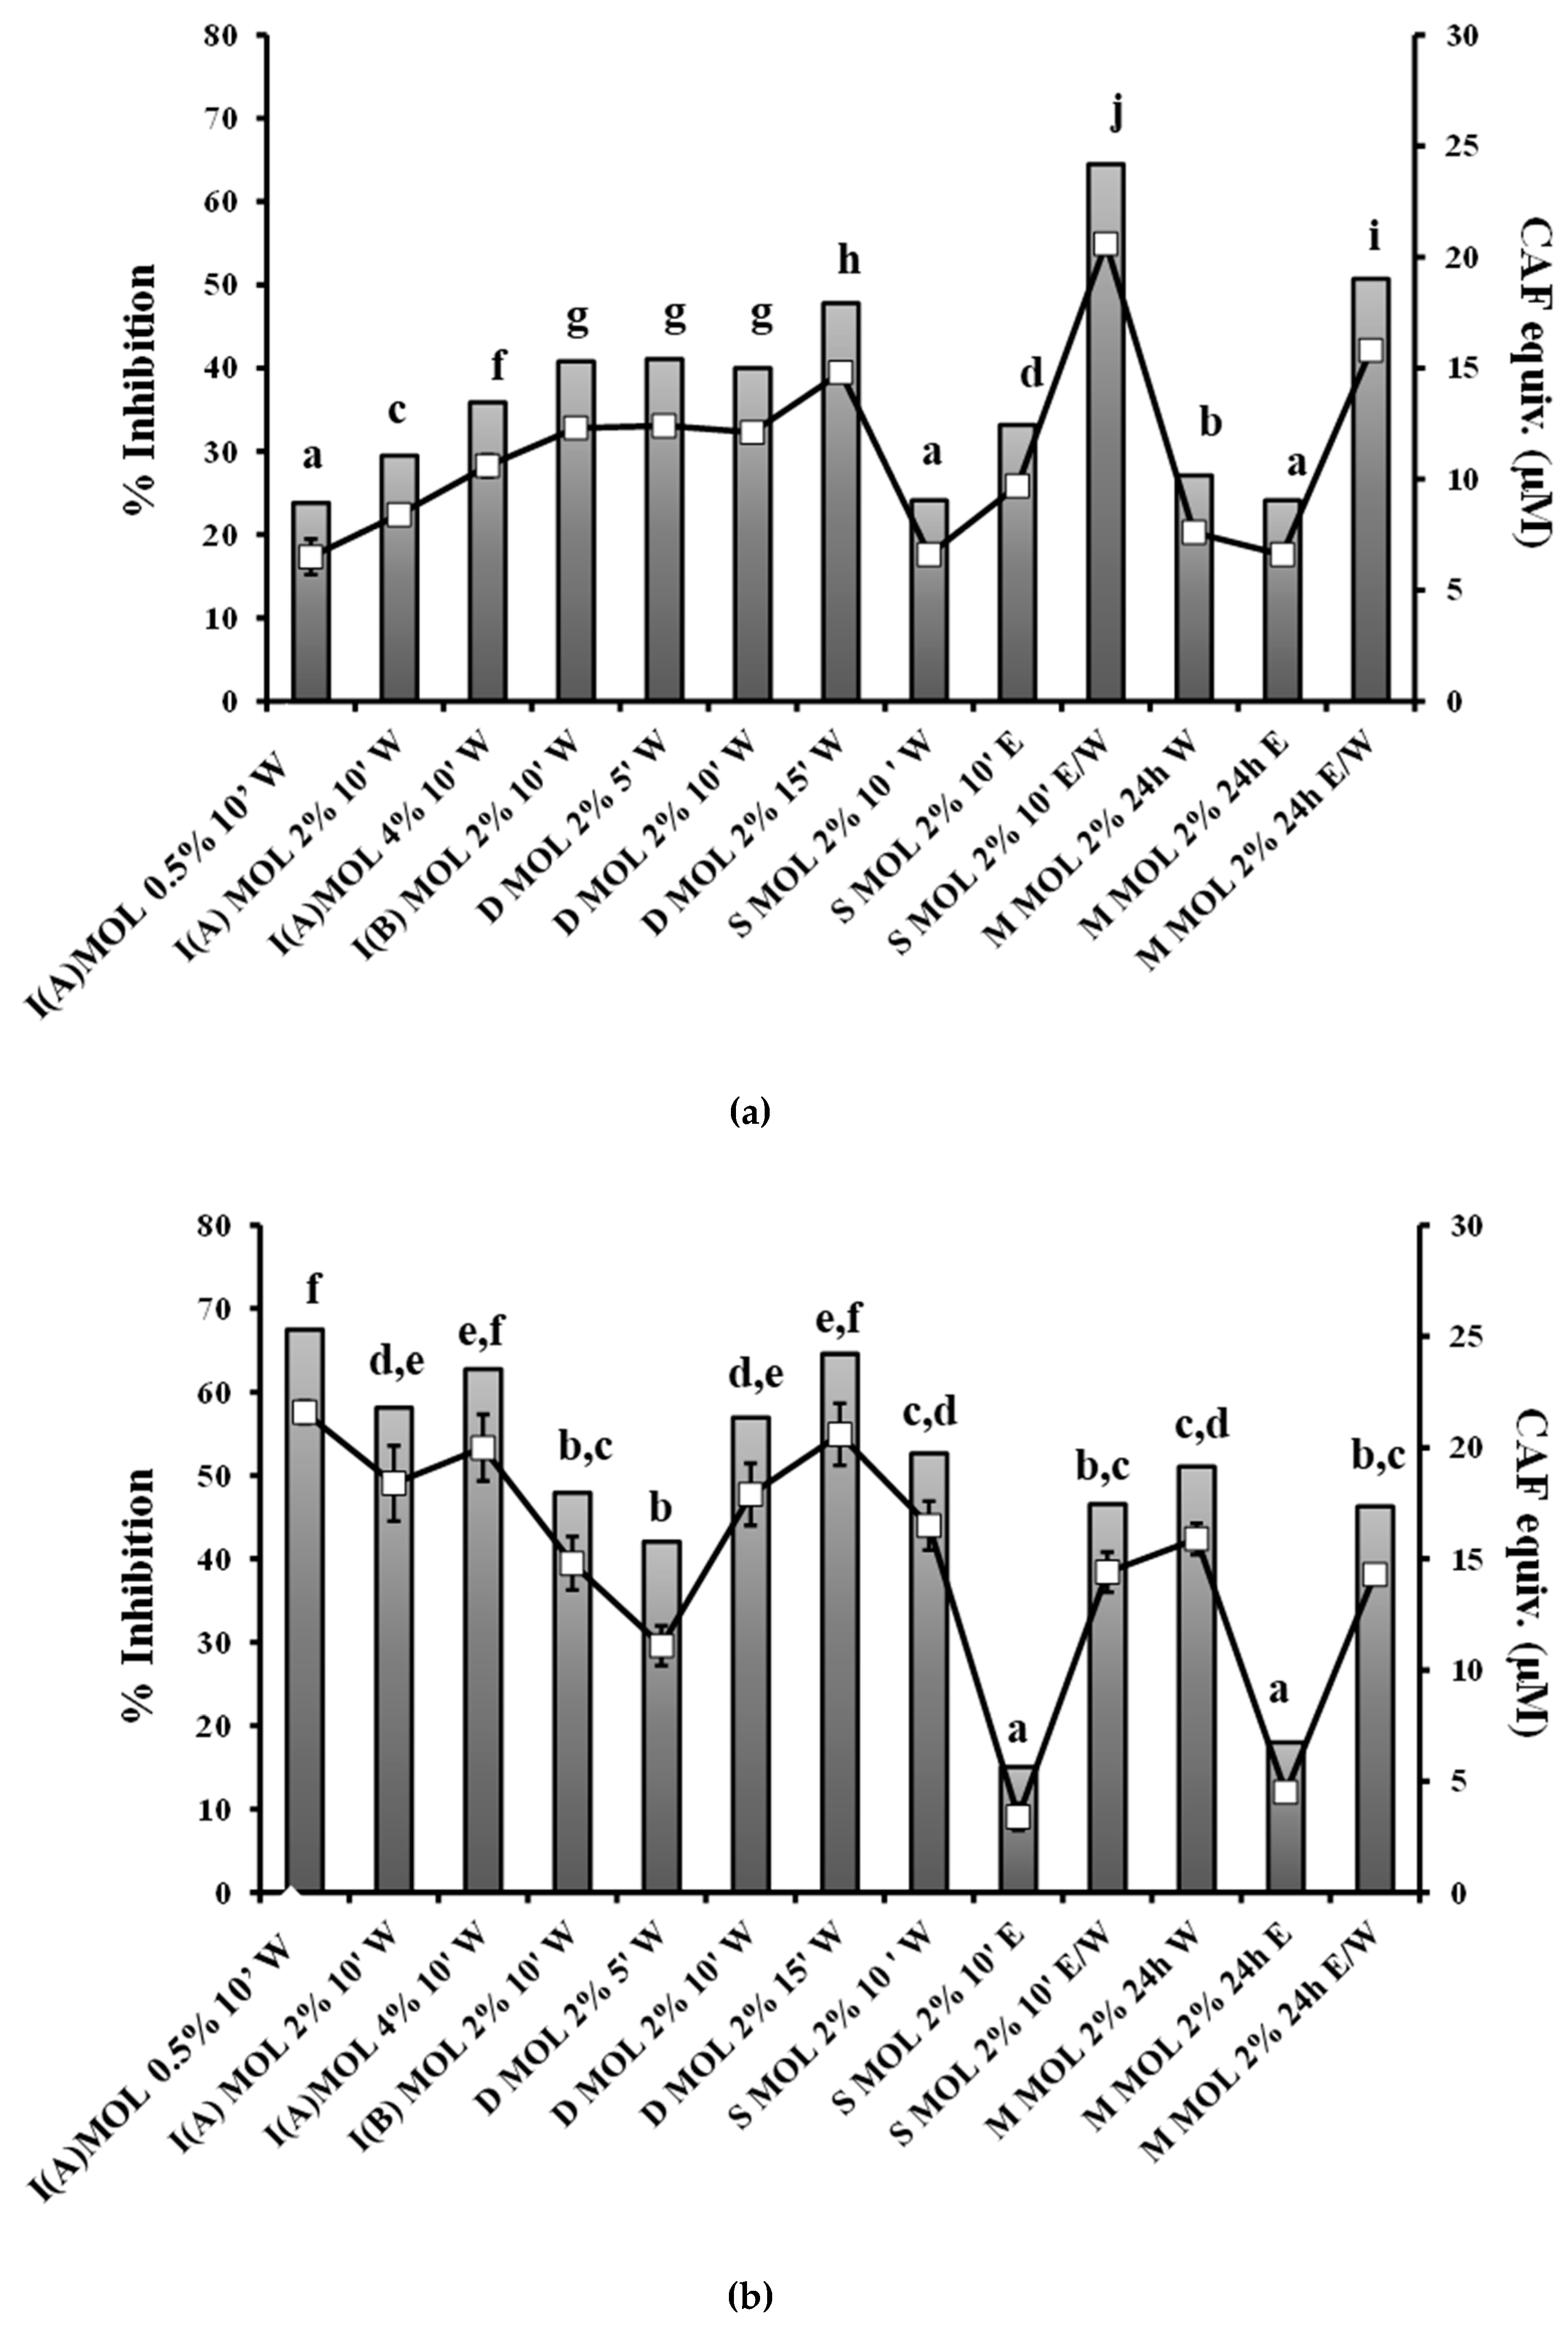
2.6. Antioxidant Activity Determined via the DPPH Assay

Assay employed for determination of extracts ability to scavenge the DPPH radical was based on a protocol employed by Hatzidimitriou et al. [20]. Briefly, 2.9 mL of a DPPH solution (0.1 mM in MeOH) was mixed with 0.1 mL of a methanolic extract (aliquot tested contained 15, 25, 35 or 50 μg dry MOL decoction). Moreover % DPPH inhibition was also estimated on the same dry extract weight basis (aliquot tested contained 35 μg of dry extract) and on the same TP content basis (aliquot tested contained 5 μg TP expressed as CAF) of herbal preparations. Standard solutions of CAF at concentrations of 20–160 mg/L were also tested. The absorption at 516 nm (A516) was recorded at the start of the reaction (t = 0) and after 30 min (t = 30). The results were expressed as % inhibition = [(A516 (t = 0) − A516 (t = 30)) × 100 / A516 (t = 0)], as well as CAF equivalents. All determinations were performed in triplicate at room temperature and data are given as the mean ± standard deviation. IC50 value, the concentration able to scavenge the 50% of the DPPH radical, was also determined.

2.7. Antioxidant Activity Determined via the Ferric Reducing Ability (FRAP) Assay

The FRAP assay was carried out according to Benzie and Strain [21] with slight modifications to determine the ferric reducing power capacity of the studied extracts. A mixture containing 3 mL of freshly prepared and prewarmed at 37 °C FRAP reagent and 50 μL of MOL extract (2 mg dry extract/mL MeOH) was incubated at 37 °C for 30 min and the absorbance was then recorded at 593 nm. The same was applied for CAF solutions (125–1000 mg/L) to construct a standard curve. The ferric reducing ability of the examined extracts was expressed as CAF equivalents. Measurements were carried out in triplicate and data are given as the mean ± standard deviation. The FRAP reagent contained 2.5 mL of a 10 mM TPTZ solution in 40 mM HCl (Sigma Chemical Co., St. Louis, MO, USA) and 2.5 mL of 20 mM FeCl3 × 6H2O (Sigma Chemical Co., St. Louis, MO, USA) and 25 mL of 0.3 M acetate buffer, pH 3.6.

2.8. Na, K, Ca and Li Content Determination via Emission Flame Photometry

The content of the extracts in Na, K, Ca and Li was determined with the aid of a single channel emission flame photometer (model PFP7 Jenway, Essex, UK) after selection of the appropriate optical filter for the element being assessed. In each set of measurements under the same experimental conditions (fuel and air flow, sensitivity adjustments) along with the extracts, respective standard solutions of known concentrations were also analysed. The concentration of examined extracts was then determined via the constructed calibration curves, depicting light emitted from the flame (direct reading digital instrument) versus concentration of the respective standard. Measurement repeatability was determined in every set of measurements and was always satisfactory (Coefficient of Variation < 10%, n = 5).

2.9. Pigment Content

For the determination of the pigment content of selective aqueous preparations the equations of Lichtenthaler and Welburn [22] were employed. Absorbance values of diluted herbal preparations (1/80) were recorded at 470, 647 and 663 nm using a spectrophotometer and results for Chlorophyll a, Chlorophyll b and Carotenoid content are given as μg per extract mL. Results are the mean value of two independent measurements.

2.10. Extraction Yield

Extracts were dried as described in herbal preparations section. The dried extracts were then weighed, and the extraction yield was expressed as the weight (mg) of the crude extract contained in 250 mL of each preparation. Results are the mean value of two independent measurements.

2.11. Sensory Evaluation

Selective aqueous MOL preparations were scored for overall acceptance by a non trained panel consisting of 45 panelists using a 1–9 hedonic scale; 1: indicated extreme dislike, 2: great dislike, 3: moderate dislike, 4: slight dislike, 5: neither liking nor dislike, 6: slight liking, 7: moderate liking, 8: great liking, 9: extreme liking. A preliminary experiment was performed only for MOL infusions and decoctions, when herbal preparations were served without the addition of honey. In the final trial 2% w/v honey was added in the tested samples (namely I(A) MOL 2% 10’ W, I(B) MOL 2% 10’ W, D MOL 2% 10’ W, M MOL 2% 24 h W and S MOL 2% 10’ W) to overcome bitterness. Preparations were served at room temperature.

2.12. Statistical Analysis

A principal component analysis (PCA) was used to detect potential relationship between mineral content of herbal preparations using MINITAB 16 software (Minitab, Inc., State College, PA, USA). The mean values for total phenols, total hydroxycinnamic acid derivatives, total flavonols and antioxidant activity experiments were statistically compared based on one-way analysis of variance (ANOVA), followed by the multiple Duncan test (0.05 significance level) using PASW statistics 18.0 software (SPSS Inc., Chicago, IL, USA).

3. Results and Discussion

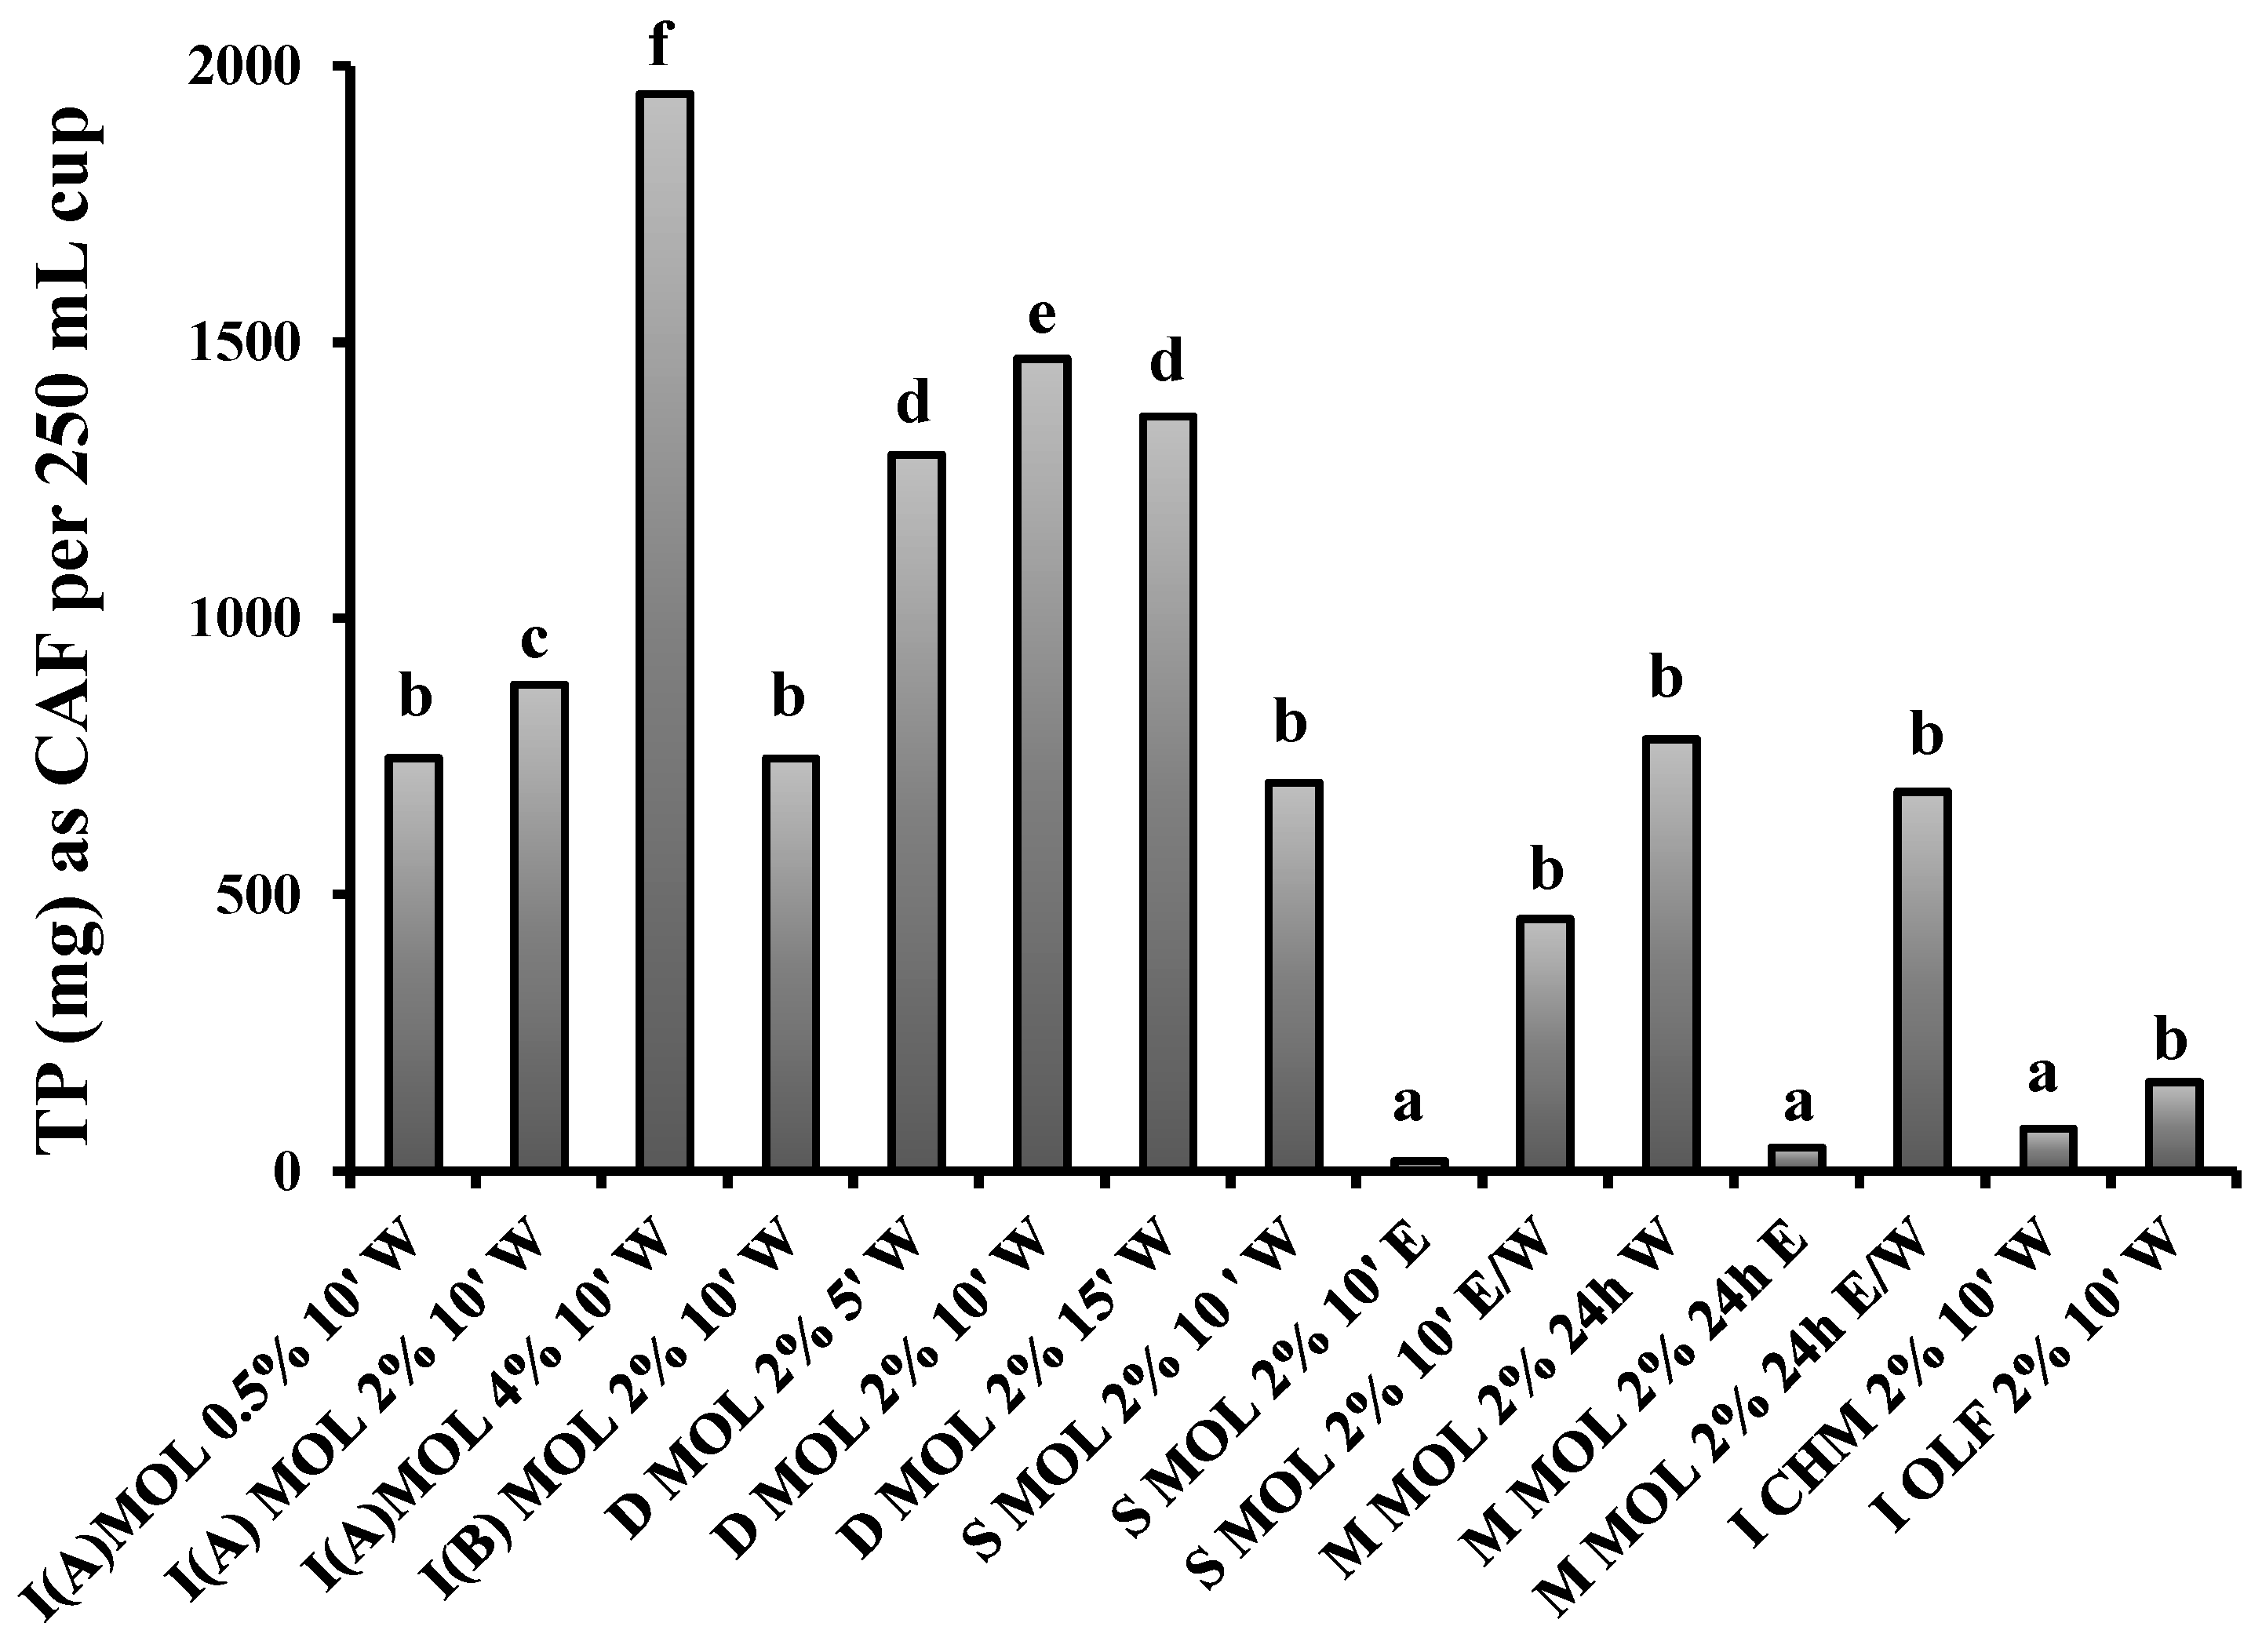
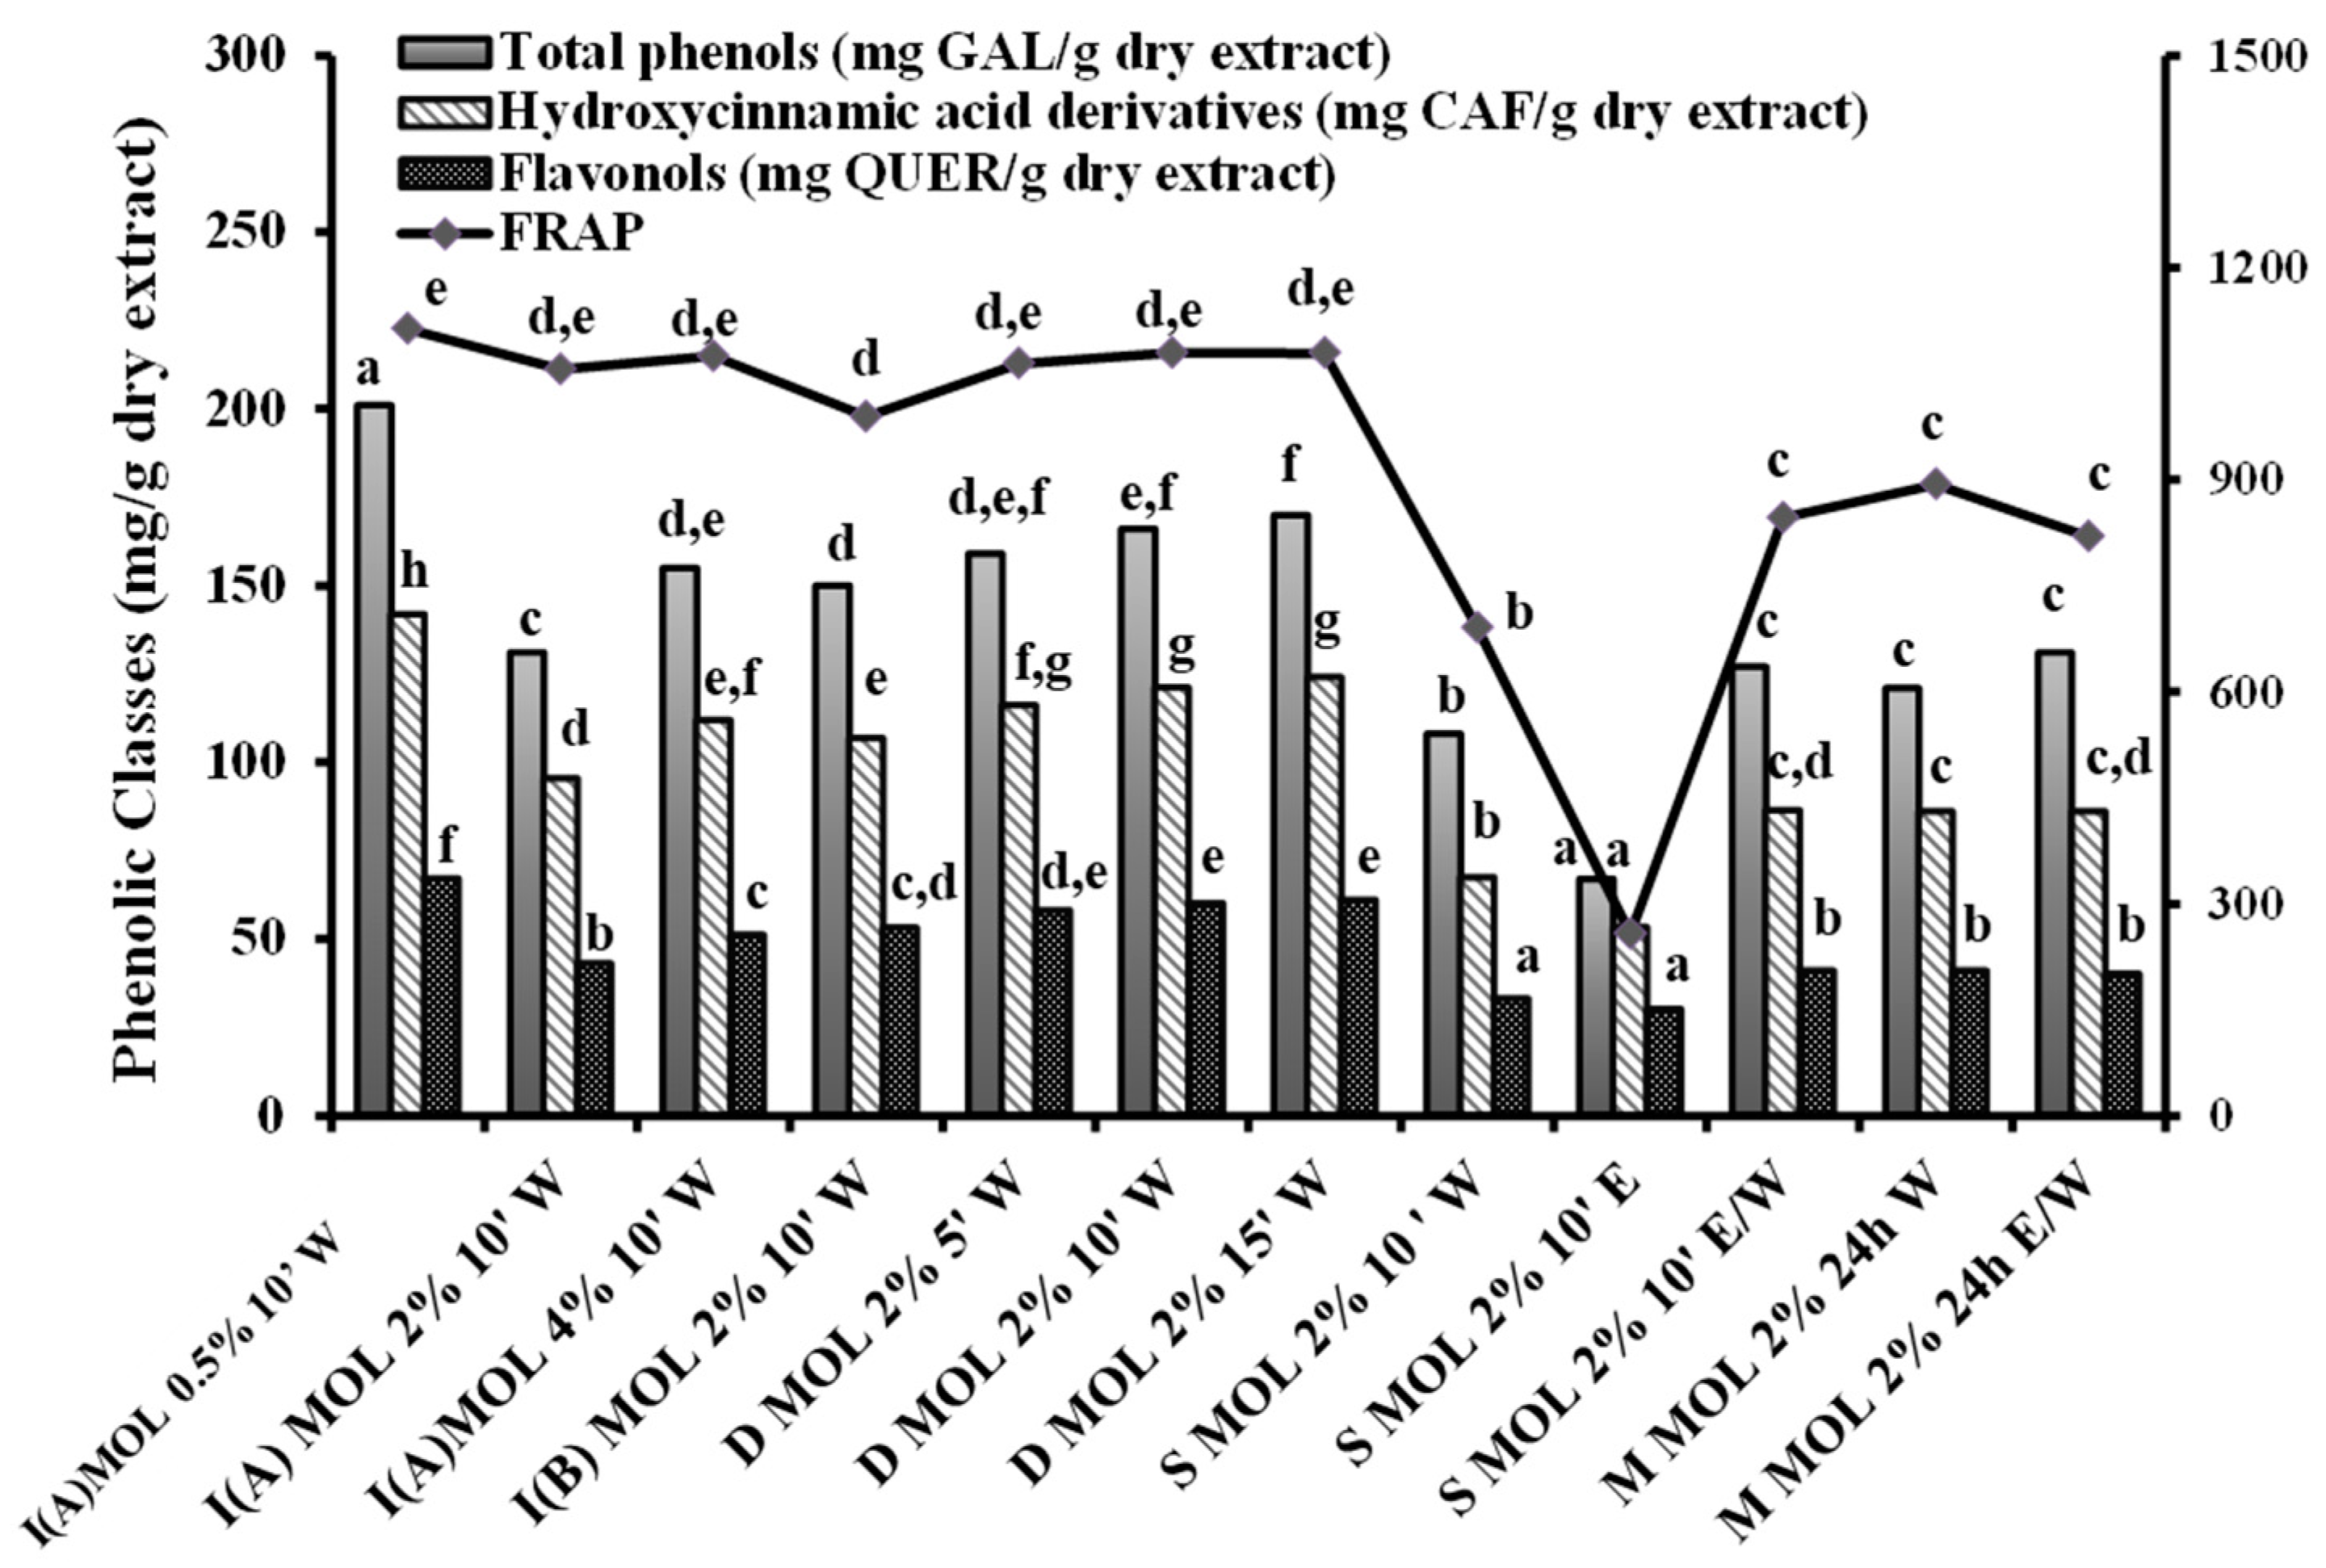
3.1. Content in TP, Hydroxycinnamic Acid Derivatives and Flavonols of Herbal Preparations

Appraisal of the phenol content of a plant material is amongst the most popular subjects of study in favor of their health beneficial actions [23,24]. The TP content of the prepared herbal formulations was assessed, and results are depicted in Figure 1.
Material to solvent ratio affected the TP content of the examined MOL infusions (0.5, 2 and 4% w/v) in a linear manner. I(A) MOL 4% 10’ W held a double TP content (1949 ± 163 mg TP as CAF per 250 mL cup) in comparison to I(A) MOL 2% 10’ W and I(A)MOL 0.5% 10’ W. 2% MOL decoctions in comparison to the rest 2% MOL preparations possessed a richer content (1297–1471 mg TP as CAF per 250 mL cup). Initially, TP slightly increased with prolonged time of decoction process (from 5 to 10 min), no further increase was noticed when time was further extended (at 15 min). Similar were the observations for MOL preparations studied by Sentkowska, et al. [25]. Apart from I(A) MOL 4% 10’ W and MOL decoctions the rest aqueous MOL preparations had similar TP content.
The aqueous MOL preparations were followed by the hydroethanolic ones regarding phenol content and that by the ethanol ones. The inferior performance of ethanol to extract phenolics from MOL was expected since it has been repeatedly published for MOL and other natural sources [12,26,27,28,29].
Additionally, MOL infusion when compared to CHM and OLF had a considerably higher (correspondingly ~11 and ~5 times more) TP content. MOL infusions studied by [8] also presented higher TP content than olive leaf ones. Considering that Folin Ciocalteu assay calibration curves for caffeic and gallic acid are similar [30], findings of the present study were compared to literature and MOL preparations appeared remarkable TP sources [31]. Jiménez-Zamora et al. [32] also distinguished this material for its high TP content (1003 mg GAL/L) among 36 plants (6–1387 mg GAL/L).
Furthermore, the hydroethanolic MOL preparations of the present study have a richer TP content in respect to similar natural preparations such as Salvia fruticosa, Origanum dictamnus L., Olea europaeae L. and Citrus sinensis leaves [29]. Similarly, ethanol MOL extracts of the present study had 13800 (S MOL 2% 10’ E) and 15130 (M MOL 2% 24 h E) mg CAF per 100 g dry extract, when TP content of other Lamiaceae ethanol extracts vary among 5000–15,100 mg CAF per 100 g dry extract [33].
Values for MOL aqueous preparations of this study were higher to that reported by Triantaphyllou et al. [15] for a relevant MOL preparation (5% w/v infusion of 25 min: 0.13 g CAF/100 mL) and respective ones of Komes and coworkers (2011) [8] (1% w/v infusions of 5 and 15 min: ~791 and 929 mg GAL/L, respectively) and Skotti et al. [34] (1% preparation of 15 min at 85 °C: 0.985mg CAF/mL, and ultrasounds at room temperature: 0.8 mg CAF/mL). Such differences are expected, due to discrepancies in biotic, abiotic parameters and postharvest treatment of the material [7,8,9].
To further evaluate the bioactive potential of MOL a series of samples of same extract weight basis was assessed for content in total phenols, hydroxycinnamic acid derivatives, and flavonols. As shown in Figure 2, all infusions and decoctions analysed had an almost similar profile, irrespectively to material to solvent ratio, time, and temperature employed regarding the above-mentioned bioactive classes (hydroxycinnamic acid derivatives and flavonols correspond respectively to ~2/3 and 1/3 of total phenols). Common tea preparation practices, such as infusions and decoctions, had higher content in the examined phenolic classes than those prepared upon maceration and ultrasounds. This finding was in line with data of İnce et al. [35], according to which ultrasounds and maceration lead to extracts poorer in hydroxycinnamic acid derivatives and other phenolics in relation to the conventional (hot plate heating) extraction method employed. Hydroethanolic macerates had statistically similar content in the examined bioactives with the respective aqueous ones. The hydroethanolic extract examined upon ultrasound was statistically richer compared to its aqueous counterpart. Still, differences are not immense. Once more ethanol showed its inferior potency in comparison to water and the hydroethanolic mixture to extract MOL bioactives. The TP value (67 mg GAL/g dry extract) of the ethanolic MOL extract prepared upon ultrasounds was ~2.5 times lower compared to that of Lin et al. [36]. The determined TP content values for the aqueous MOL preparations were in line with those reported by İnce et al. [35] for aqueous MOL extracts (1:30 g per mL solid-to-solvent ratio) prepared conventionally, upon maceration, microwaves and ultrasounds (90–146 mg GAE per g dry material) and lower than that reported by Szabó et al. [37] for aqueous extracts of different MOL origin (1% infused with hot water and let stand for 24 h; 359–427 mg GAE per g dry extract weight).
The high content of aqueous and hydroalcoholic extracts in phenolic bioactive classes was related to matters of solvents polarity and other solubility matters of the individual constituents. The latter has been well documented in literature for several natural sources and is associated with the nature of the material, nature (polarity and stereochemistry) of individual phenols, intermolecular forces among phenols and extraction solvent, easier penetration of solvent to solvent matrix due to swelling effect drawn by the presence of water among others [28,29,38]. According to Arceusz and Wesolowski [39] mixtures of ethanol with water are more effective for the extraction of phenolic acids from MOL.
Determination of the concentrations of the main individual phenolics could add some value to the evaluation of the effect of the extraction method on the phenolic dynamic of the herbal preparations. Still, this was beyond the scope of this study. The phenolic composition of MOL has been studied and is shown to bear qualitative similarities but quantitative variability in individual constituents according to many factors (e.g., nature, origin, postharvest treatment conditions of MOL) [25,26,35,39,40]. Since in plant materials levels of bioactive ingredients may vary significantly, individual phenolics cannot be easily considered suitable quality markers for final formulations, when content in TP and other phenolic classes, as well as antioxidant activity data can be [41,42].
The antioxidant activity of plant products has been widely accredited owning to its relation with treatment and prevention of diseases and disorders. Whereas, for safe antioxidant capacity evaluations more than one method based on different principles of action are needed [24,43,44]. Therefore, in order to assess the antioxidant activity of the studied extracts, the latter were examined for their ability to inhibit the DPPH radical (on the same TP and dry extract basis) and their ferric reducing power capacity (on the same dry extract basis) (Figure 2 and Figure 3).
Regarding results of DPPH findings on the same extract weight basis (Figure 3a) it was shown that all aqueous and hydroethanolic preparations were potent radical scavengers. The inhibiting activity of the aqueous and hydroethanolic macerates and extracts upon ultrasounds presented statistically similar potency. Ethanol preparations showed a significantly lower activity in relation to the rest studied extracts. This was according to previous findings (Figure 1 and Figure 2) as ethanol extracts were expected to contain significantly lower amounts of phenolic compounds. Our results were in line with those reported by others [26,45] that found aqueous MOL extracts to be more antioxidant potent than ethanol counterparts.
All infusions and decoctions (of same extract weight basis) assessed for their ferric reducing ability showed an almost equal capacity (Figure 2). These common tea preparation practices produce extracts of higher potency in relation to ones prepared upon ultrasounds or maceration. This was also observed from DPPH assay findings on same extract weight basis (Figure 3a). Aqueous and hydroethanolic macerates were equally potent, whereas the hydroethanolic extract of ultrasounds was slightly better than its aqueous counterpart. Ethanol preparation was shown to be significantly inferior to relevant aqueous and hydroethanolic ones. The moderate linear correlation (R2 = 0.621) between FRAP and DPPH assay (on same extract weight basis) findings implied that the antioxidant activity as determined with the two assays could be not exclusively due to the action of the same phenolics.
On the other hand, DPPH radical scavenging activity data of same TP basis (Figure 3b) revealed interesting information. The hydroethanolic preparations were now dominant in scavenging of the DPPH radical, followed by decoctions and I(B) MOL 2% 10’ W. The latter presented according to previous findings a moderate profile and a low TP content, statistically similar to hydroethanolic preparations (Figure 1). Moreover, ethanol preparations presented comparable capacity to respective aqueous ones. These data were in accordance to Papoti and Tsimidou [41] that presented natural compositional variability of olive leaf samples not to be reflected to DPPH inhibition values on same phenol basis.
The above-mentioned observations could be related with almost equivalent contribution of most of the main phenolic constituents [42]. Additionally, synergistic effects among the individual components are not excluded. Moreover, the powerful antioxidants carnosic and gallic acids [28,43,46,47], as well as the weaker scavengers of the DPPH radical oleanolic and ursolic acids [48], are expected to be better extracted with ethanol from the material. Additionally, hydroalcoholic mixtures are expected to recover higher amounts of the main MOL constituents namely rosmarinic, caffeic, protocatehuic, vanillic and syringic acids. Moreover, rosmarinic and caffeic acid are known to be strong inhibitors of the DPPH radical, possessing better activity in comparison to cinnamic acids, protocatehuic and other benzoic acids [49,50] expected in such MOL preparations. Additionally, glucoside form phenols such as luteolin 7-O-glucoside (respected to polar MOL extracts) [13] are also expected to be more efficiently extracted from MOL with hydroalcoholic solvents due to solubility matters [51] and are dominant DPPH radical scavengers [42].
Additionally, increase of material to solvent ratio and time of decoction preparation led to no or slightly enhancement of the radical scavenging ability (Figure 3a,b) and ferric reducing capacity (Figure 2) of the studied preparations (infusions and decoctions respectively). The latter is in line to Komes et al. [8] that report prolongation of extraction time not to significantly affect the antioxidant activity of MOL extracts.
Finally, the concentration of an aqueous MOL dry extract capable to inhibit 50% DPPH radical formation (IC50 value) was found to be 309 μg dry MOL per extract mL, whereas for CAF 80 μg/mL. Considering that a cup (250 mL) of a 2% MOL infusion or decoction contains according to our findings ~1700–3300 mg dry extract it can be safely said that its consumption may effectively contribute to daily radical inhibitors intake.
The different conditions employed in the experimental parts of published antioxidant activity data of MOL preparations do not allow direct comparisons [35,36,52,53,54,55]. Still, findings of the present study, in line with literature, indicate that MOL preparations show significant antioxidant activity.

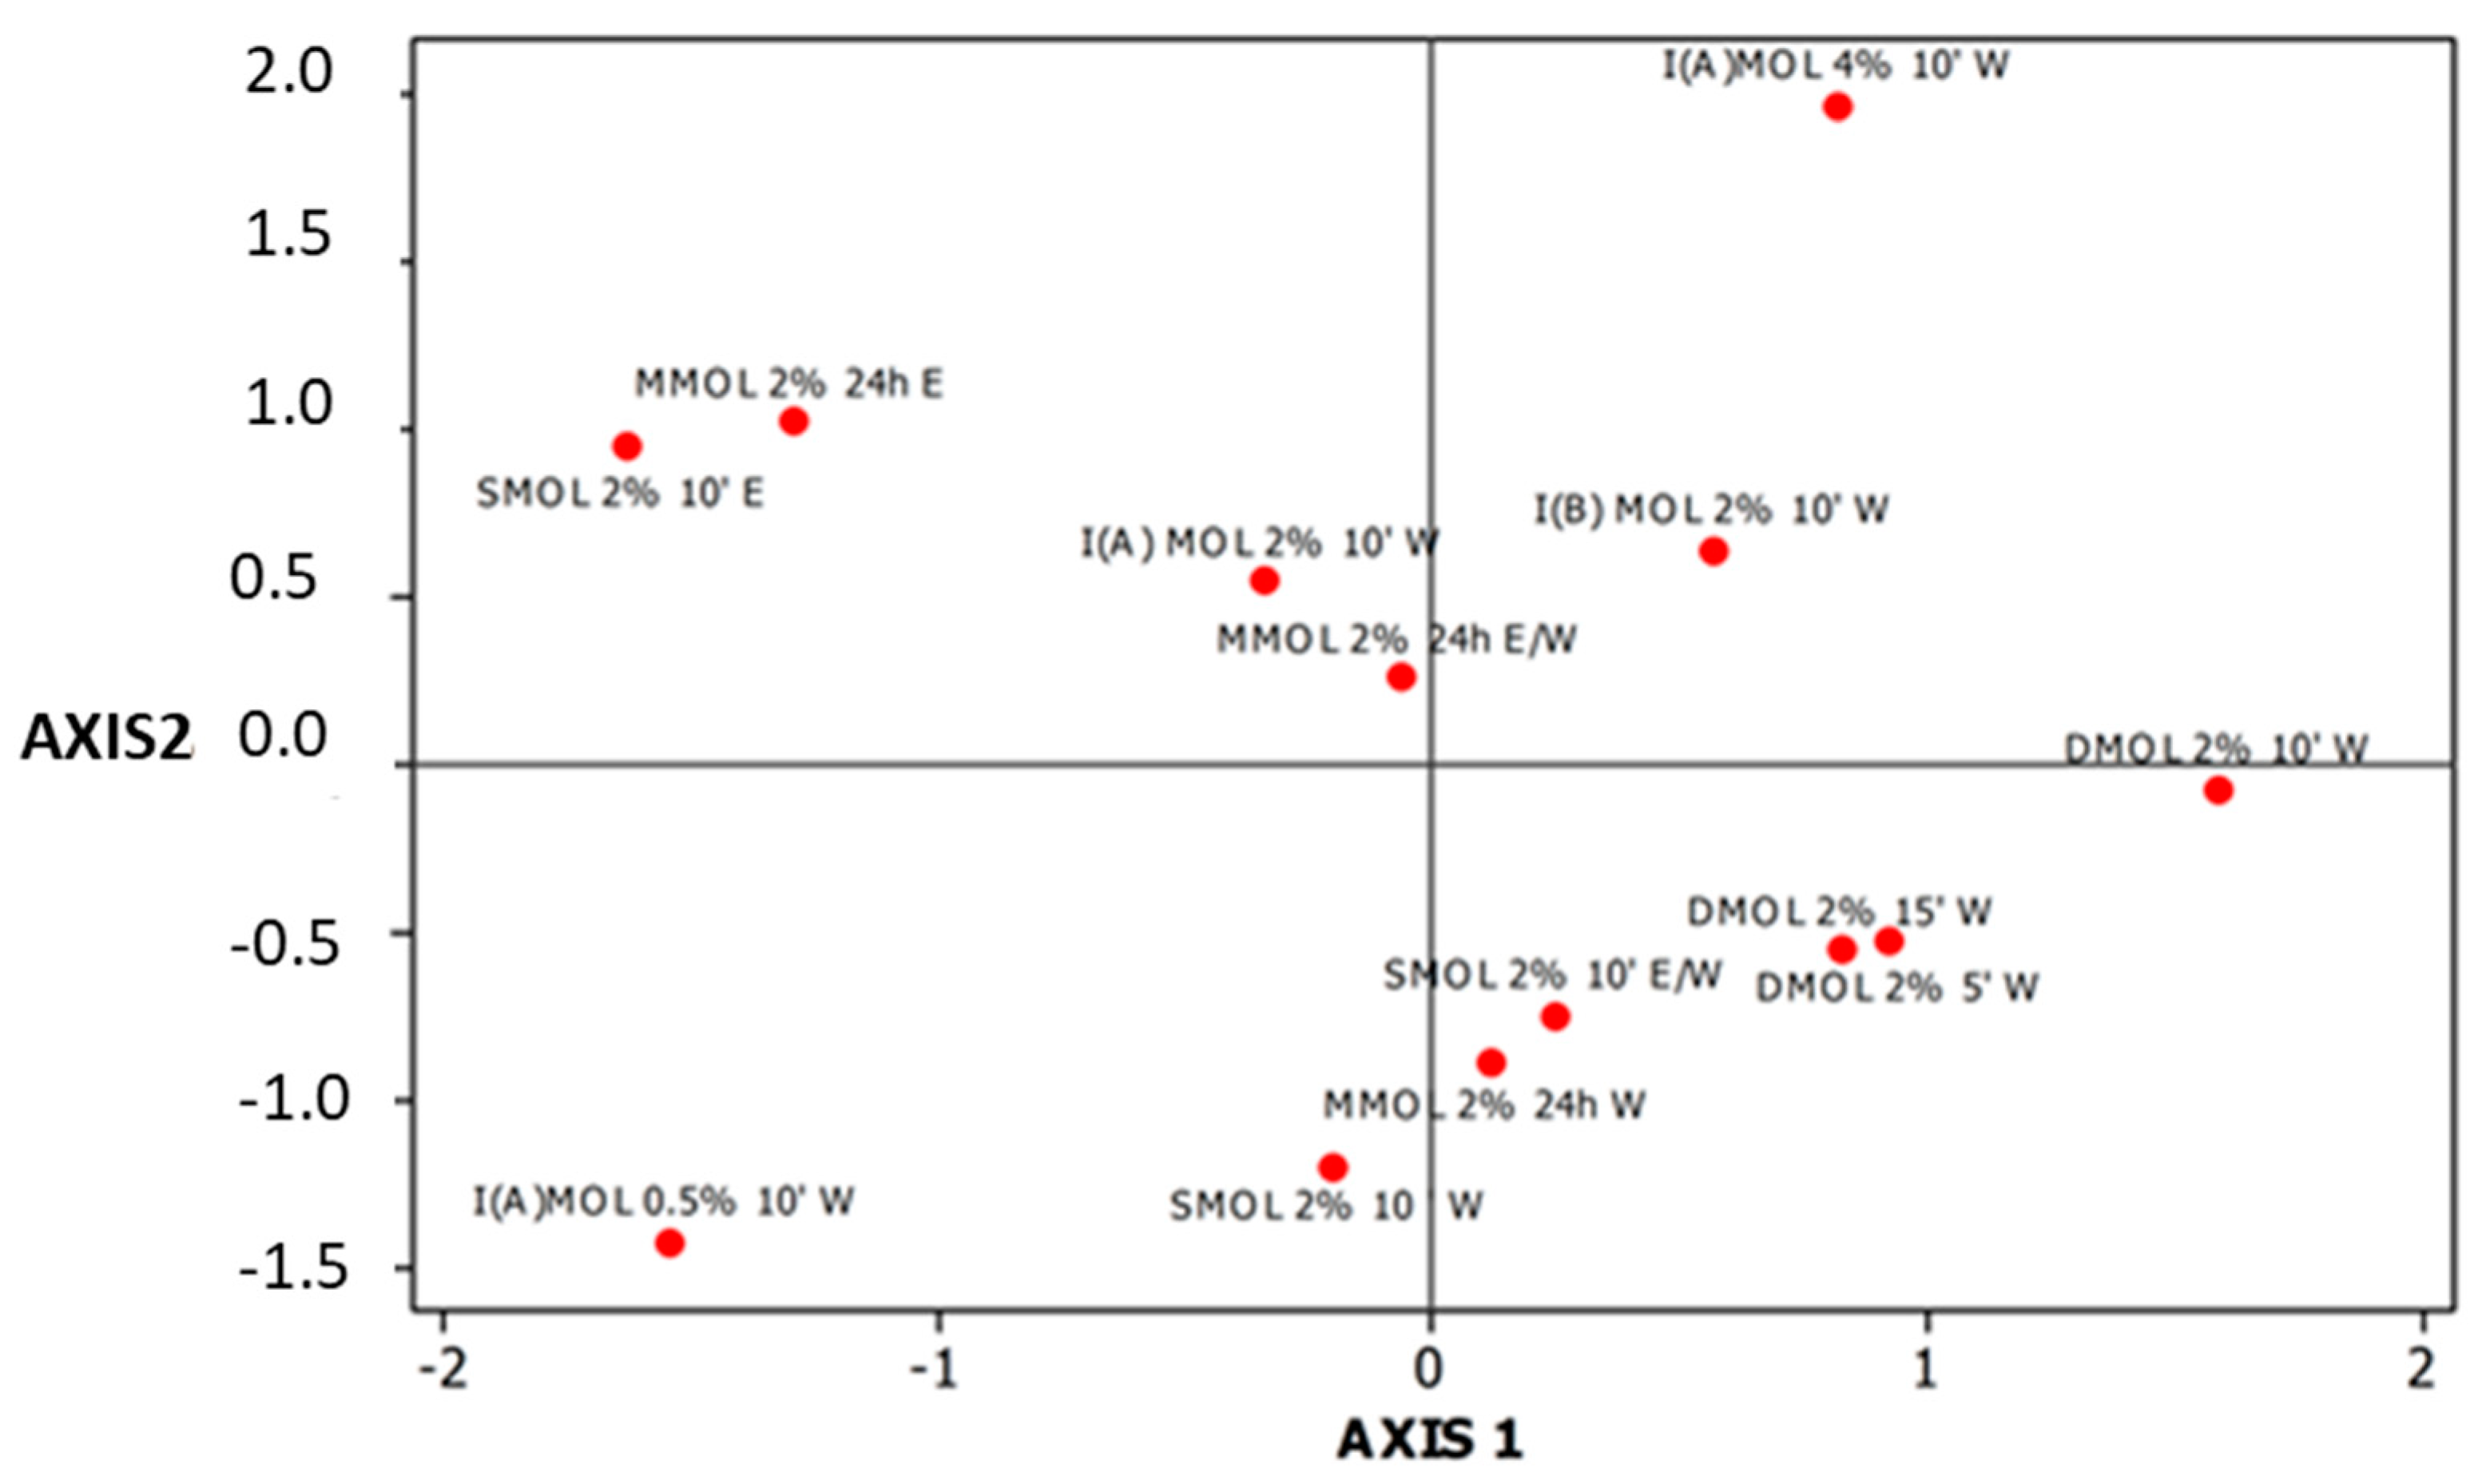
3.2. Mineral Content of Herbal Preparations

Minerals are known to influence human metabolism, affect general health and be linked to physiological function of the human body and are therefore commonly examined in studies dealing with herbal issues. In the present study the Na, K, Ca and Li content of the examined preparations was determined, and data are presented in Table 1. To better elucidate the effect of various herbal preparations on the mineral concentration a principal component analysis was employed (Table 2, Figure 4).
The content of the MOL preparations in the above-mentioned minerals was 0.8–2.9, 4.1–288.4, 50.1–176.1 and 0.1–0.4 mg per 250 mL respectively (Table 1). Data for metal concentrations determined in the present study for 2% w/v MOL aqueous preparations were of the same size for K and Ca and higher for Na and Li to that of relevant MOL preparations examined by Özcan et. al. [56].
Data for MOL herbal treatments shown in Figure 4 imply that high values of Na, K and Ca are found in MOL decoctions and secondarily in I(B) MOL 2% 10’ W, prepared at 80 °C. High temperature seems to enable the extraction of these macroelements from MOL. Concerning Ca this could be attributed to the fact that it is mainly accumulated into cells, making its extraction hard [57] and higher temperatures could enhance its release. The intense conditions employed in decoction process, as well as the long extraction process (24 h) of the M MOL 2% 24 h W enhanced K extraction. Potassium is considered a highly extractable element from herbs in favor to its chemical properties and its abundance outside plant cells [57].
Effect of material to solvent ratio in the prepared infusions influenced in a linear way the recovery of the studied minerals from MOL. Time of decoction preparation did not statistically affected mineral content. This was in accordance to Özcan et al. [9] that found this parameter to be non-dependent to the mineral content of the studied infusions. Literature data indicate that this parameter depends on the nature of the material or the recovered metal [9,56].
Ethanol was negatively correlated with Na, K and Ca extraction from MOL. However, ethanol was proved to be better concerning Li extraction for both studied practices. This could be linked to the chemical properties of Li, its lower density, in comparison to that of Na, K and Ca, and the fact that ethanol presents lower density in comparison to water. Table 2 demonstrates the correlation coefficients between minerals and axes 1 and 2. Both axes explain 79.7% (54.1 and 25.6) of the total variation of the analysis. Thus, Na, K and Ca are very important for the formation of axis 1 (coefficient greater than 0.800) and Li of axis 2 (r = 0.983). Concerning axis 2 it appears that I(A) MOL 4% 10’ W is the exclusive representative of high Li responses, therefore implying that the microelement is found in higher amounts in extracts of higher material concentration.
Differences among MOL, CHM and OLF infusions were not considered significant. The exception was the Na content of CHM that was considerably higher in respect to MOL and OLF infusions that possessed a similar content. Literature data confirm that MOL contains significant amounts of minerals (including Na, K, Ca, and Li) in respect to other plant materials [9,14]. However, discrepancies among materials could be related to agricultural, climatic or raw material treatment variability.

3.3. Pigment Content of Herbal Preparations

Pigments are also considered compounds with nutritional interest since their presence in plant products is related, apart from color, also with the antioxidant potential and provitamin A dynamic [57,58]. Since their absorption spectra are noticeably solvent dependent [57,59] data are only presented (Table 3) for selected aqueous herbal preparations. MOL infusion was shown to comprise considerably higher amounts of chlorophylls and carotenoids when compared to respective CHM and OLF preparations. However, differences could be attributed among others to climatic, agronomical and treatment conditions applied to the plant materials [57].
Material to water ratio linearly affected the extractability of pigments from MOL infusions. The I(A) MOL 4% 10’ W prepared with the higher material to water ratio contained the higher amount of pigments, whereas the I(A) MOL 0.5% 10’ W, holding the lower plant material had the lower levels. Decoction process resulted in preparations with high amounts of chlorophylls and carotenoids. It seems that temperature enhances the extraction of pigments from MOL since apart from the D MOL 2% 10’ W, also the I(B) MOL 2% 10’ W prepared at 80 °C presented also a richer profile in relation to the I(A) MOL 2% 10’ W.

3.4. Extract Yield of Herbal Preparations

Content in total solids of the prepared herbal formulations is depicted in Table 1. This parameter is considered important as it affects organoleptic characteristics, such as taste and color [60]. As expected, preparations with higher concentration of dry extract material were the MOL decoctions prepared upon the intense process of boiling and the I(A) MOL 4% 10’ W that hold the higher amount of MOL. Increase of the % w/v significantly raised the amount of solids in the prepared infusions. The effect of time preparation of decoctions was not considered significant. However, a slight rise was noted when time of decoction process was prolonged. Similarly, slight increase in total solids has been also reported in literature when the effect of extraction time was studied upon total solids for other aqueous herbal teas [61]. Hydroethanolic macerates and extracts prepared upon ultrasounds had values of total solids of similar size compared to aqueous counterparts. Moreover, ethanol preparations contained considerable low amounts of dry extract. Total solids of MOL, CHM and OLF respective infusions were similar. Values of total solids had a high correlation with TP values (as determined via the Folin Ciocalteu assay) of the examined herbal preparations (R2 = 0.781), as well as with total pigments content values (R2 = 0.856).

3.5. Sensory Evaluation

The sensorial properties of food products are of great importance since they indicate how the final product is perceived by consumers. In this case the overall acceptance of MOL preparations was evaluated by using a 1–9 hedonic scale. A preliminary test was performed only for infusions and decoctions (without the addition of honey), as these are the preparations practically made at home. Data revealed that infusions I(A) MOL 0.5% 10’ W and I(A) MOL 2% 10’ W (holding scores of 4.5 and 4.0 respectively) were much preferable than decoctions (scored at 2.9–3.6) and the I(A) MOL 4% 10’ W (with higher level of plant material; 4% w/v scored at 2.5) that were perceived as very bitter. The I(A) MOL 0.5% 10’ W (although gained the highest score) received negative comments concerning its color, that was considered very fade. Testers suggested that sweetening of the herbal preparations would probably improve their general acceptance. Therefore, in the final trial honey was added in the tested preparations (I(A) MOL 2% 10’ W, D MOL 2% 10’ W, I(B) MOL 2% 10’ W, S MOL 2% 10’ W, and M MOL 2% 24 h W). The highest score (4.5) was given to the S MOL 2% 10’ W while the lowest one (3.1) to D MOL 2% 10’ W. It is important to point out that when all the preparations were tested using the same plant material percentage, strong negative correlation (R2 = 0.86) was shown between the TP and the overall acceptance due to increased bitterness as mentioned by the tasters. Furthermore, sensory evaluation findings showed a similar trend with pigment content determination data and mainly the content in chlorophyll pigments. Sensorial findings including the comments of the tasters can be considered an indication that consumers will probably accept the product more if the bitterness is lowered by the addition of extra sweetener or masked e.g., by the addition of lemon, cinnamon, or other herbs.

4. Conclusions

Melissa Officinalis L. aqueous preparations easily made at home such as infusions were considered remarkable sources of phytochemicals with nutritional importance. Such aqueous preparations may regularly provide human body with minerals (Na, K, Ca, Li) and phenolic antioxidants, contributing to healthy living, while exploiting their calming and refreshing properties. Infusion of 2% was preferable regarding organoleptic properties and nutritional values. Decoctions, although superior in the phytochemical characteristics studied were rejected in terms of sensorial attributes. 25% hydroethanolic MOL preparations are also significant sources of phenolic antioxidants and minerals. In a period that anxiety and gastroesophagic disorders have been worryingly expanded, MOL preparations easily made at home could, apart from boosting human body defense via phytochemical consumption, relieve from stress associated effects in a natural manner. Moreover, in view of the urgent demand for the introduction of medicinal plants in the agricultural systems of Mediterranean area, due to economic emergencies, MOL could be a profitable choice regarding phytochemical content, bioactivity and safety issues.

Author Contributions

Methodology, N.T., A.A. (Aikaterini Atmatzidou), A.A. (Anna Androulaki), V.T.P., K.Z. and C.R.; Software, D.P., V.T.P. and K.Z.; Validation, V.T.P. and D.P.; Formal Analysis, V.T.P.; Investigation, V.T.P.; Resources, N.T., A.A (Aikaterini Atmatzidou) and V.T.P.; Data Curation, V.T.P.; Writing-Original Draft Preparation, V.T.P.; Writing-Review & Editing, V.T.P. and K.Z.; Supervision, V.T.P., and C.R.; Project Administration, V.T.P.

Funding

This research received no external funding.

Acknowledgments

Apivita Cosmetic Company is gratefully acknowledged for providing Melissa Officinalis L. from companies’ organic farm. The authors also gratefully acknowledge Ioannis Mourtzinos (Assistant Professor Laboratory of Food Chemistry - Biochemistry, Dept. of Food Science & Technology, Faculty of Agriculture Aristotle University of Thessaloniki) for his advice on the bioactive potential of MOL.

Conflicts of Interest

The authors declare no conflict of interest.

Abbreviations

The abbreviation list is given below:
Melissa Officinalis L. (MOL); caffeic acid (CAF); gallic acid (GAL); quercetin (QUER); 1,1-diphenyl-2-picrylhydrazyl (DPPH); Potassium (K); Sodium (Na); calcium (Ca); Lithium (Li); methanol (MeOH); Chamomile (CHM); Olive leaf (OLF); Water–in–oil–in water (W/O/W); Total Phenols (TP); 0.5% w/v MOL aqueous preparation prepared by 10 min infusion at room temperature (I(A) MOL 0.5% 10’ W); 2% w/v MOL aqueous preparation prepared by 10 min infusion at room temperature (I(A) MOL 2% 10’ W); 4% w/v MOL aqueous preparation prepared by 10 min infusion at room temperature (I(A) MOL 4% 10’ W); 2% w/v CHM aqueous preparation prepared by 10 min infusion at room temperature (I(A) CHM 2% 10’ W); 2% w/v OLF aqueous preparation prepared by 10 min infusion at room temperature (I(A) OLF 2% 10’ W); 2% w/v MOL aqueous preparation prepared by 10 min infusion at 80 °C (I(B) MOL 2% 10’ W); 2 % w/v MOL aqueous preparation prepared by 5 min boiling/decoction (D MOL 2% 5’ W); 2 % w/v MOL aqueous preparation prepared by 10 min boiling/decoction (D MOL 2% 10’ W); 2 % w/v MOL aqueous preparation prepared by 15 min boiling/decoction (D MOL 2% 15’ W); 2% w/v aqueous MOL preparation prepared by 10 min ultrasounds (S MOL 2% 10’ W); 2% w/v ethanol MOL preparation prepared by 10 min ultrasounds (S MOL 2% 10’ E); 2% w/v hydroethanolic (25/75 v/v EtOH/H2O) MOL preparation prepared by 10 min ultrasounds S MOL 2% 10’ E/W); 2% w/v MOL aqueous preparation prepared by 24 h maceration (M MOL 2% 24 h W); 2% w/v ethanol MOL preparation prepared by 24 h maceration (M MOL 2% 24 h E); 2% w/v hydroethanolic (25/75 v/v EtOH/H2O) MOL preparation prepared by 24 h maceration (M MOL 2% 24 h E/W).

References

  1. Rietjens, I.M.C.M.; Slob, W.; Galli, C.; Silano, V. Risk assessment of botanicals and botanical preparations intended for use in food and food supplements: Emerging issues. Toxicol. Lett. 2008, 180, 131–136. [Google Scholar] [CrossRef] [PubMed]
  2. González-Tejero, M.R.; Casares-Porcel, M.; Sánchez-Rojas, C.P.; Ramiro-Gutiérrez, J.M.; Molero-Mesa, J.; Pieroni, A.; Giusti, M.E.; Censorii, E.; de Pasquale, C.; Della, A.; et al. Medicinal plants in the mediterranean area: Synthesis of the results of the project rubia. J. Ethnopharmacol. 2008, 116, 341–357. [Google Scholar] [CrossRef] [PubMed]
  3. Moradkhani, H.; Sargsyan, E.; Bibak, H.; Naseri, B.; Sadat-Hosseini, M.; Fayazi-Barjin, A.; Meftahizade, H. Melissa officinalis L., a valuable medicine plant: A review. J. Med. Plants Res. 2010, 4, 2753–2759. [Google Scholar]
  4. Shakeri, A.; Sahebkar, A.; Javadi, B. Melissa officinalis L.—A review of its traditional uses, phytochemistry and pharmacology. J. Ethnopharm. 2016, 188, 204–228. [Google Scholar] [CrossRef] [PubMed]
  5. Lardos, A. The botanical materia medica of the iatrosophikon—A collection of prescriptions from a monastery in Cyprus. J. Ethnopharm. 2006, 104, 387–406. [Google Scholar] [CrossRef] [PubMed]
  6. Gomes, N.; Campos, M.; Órfão, J.; Ribeiro, C. Plants with neurobiological activity as potential targets for drug discovery. Prog. Neuro-Psychopharmacol. Biol. Psychiatry 2009, 33, 1372–1389. [Google Scholar] [CrossRef] [PubMed]
  7. Škrovánková, S.; Mišurcová, L.; Machů, L. Antioxidant Activity and Protecting Health Effects of Common medicinal Plants; Elsevier Inc.: Amsterdam, The Netherlands, 2012; pp. 75–139. [Google Scholar]
  8. Komes, D.; Belščak-Cvitanović, A.; Horžić, D.; Rusak, G.; Likić, S.; Berendika, M. Phenolic composition and antioxidant properties of some traditionally used medicinal plants affected by the extraction time and hydrolysis. Phytochem. Anal. 2011, 22, 172–180. [Google Scholar] [CrossRef]
  9. Musa Özcan, M.; Ünver, A.; Uçar, T.; Arslan, D. Mineral content of some herbs and herbal teas by infusion and decoction. Food Chem. 2008, 106, 1120–1127. [Google Scholar] [CrossRef]
  10. Topal, U.; Sasaki, M.; Goto, M.; Otles, S. Chemical compositions and antioxidant properties of essential oils from nine species of turkish plants obtained by supercritical carbon dioxide extraction and steam distillation. Int. J. Food Sci. Nutr. 2008, 59, 619–634. [Google Scholar] [CrossRef]
  11. Kim, S.; Yun, E.J.; Bak, J.S.; Lee, H.; Lee, S.J.; Kim, C.T.; Lee, J.H.; Kim, K.H. Response surface optimised extraction and chromatographic purification of rosmarinic acid from Melissa officinalis leaves. Food Chem. 2010, 121, 521–526. [Google Scholar] [CrossRef]
  12. Peev, G.; Penchev, P.; Peshev, D.; Angelov, G. Solvent extraction of rosmarinic acid from lemon balm and concentration of extracts by nanofiltration: Effect of plant pre-treatment by supercritical carbon dioxide. Chem. Eng. Res. Des. 2011, 89, 2236–2243. [Google Scholar] [CrossRef]
  13. Fecka, I.; Turek, S. Determination of water-soluble polyphenolic compounds in commercial herbal teas from Lamiaceae: Peppermint, Melissa, and Sage. J. Agric. Food Chem. 2007, 55, 10908–10917. [Google Scholar] [CrossRef] [PubMed]
  14. Petenatti, M.E.; Petenatti, E.M.; del Vitto, L.A.; Téves, M.R.; Caffini, N.O.; Marchevsky, E.J.; Pellerano, R.G. Evaluation of macro and microminerals in crude drugs and infusions of five herbs widely used as sedatives. Braz. J. Pharm. 2011, 21, 1144–1149. [Google Scholar] [CrossRef] [Green Version]
  15. Triantaphyllou, K.; Blekas, G.; Boskou, D. Antioxidative properties of water extracts obtained from herbs of the species Lamiaceae. Int. J. Food Sci. Nutr. 2001, 52, 313–317. [Google Scholar] [CrossRef] [PubMed]
  16. Vilkhu, K.; Mawson, R.; Simons, L.; Bates, D. Applications and opportunities for ultrasound assisted extraction in the food industry—A review. Innov. Food Sci. Emerg. Technol. 2008, 9, 161–169. [Google Scholar] [CrossRef]
  17. McKay, D.L.; Blumberg, J.B. A review of the bioactivity and potential health benefits of chamomile tea (Matricaria recutita L.). Phytother. Res. 2006, 20, 519–530. [Google Scholar] [CrossRef] [PubMed]
  18. Papoti, V.; Pegklidou, K.; Perifantsi, E.; Nenadis, N.; Demopoulos, V.; Tsimidou, M. Antioxidant and aldose reductase inhibition activity of Ligustrum japonicum and Olea europaea L. leaf extracts. Eur. J. Lipid Sci. Technol. 2011, 113, 876–885. [Google Scholar] [CrossRef]
  19. Obied, H.K.; Allen, M.S.; Bedgood, D.R., Jr.; Prenzler, P.D.; Robards, K. Investigation of australian olive mill waste for recovery of biophenols. J. Agric. Food Chem. 2005, 53, 9911–9920. [Google Scholar] [CrossRef]
  20. Hatzidimitriou, E.; Nenadis, N.; Tsimidou, M.Z. Changes in the catechin and epicatechin content of grape seeds on storage under different water activity (aw) conditions. Food Chem. 2007, 105, 1504–1511. [Google Scholar] [CrossRef]
  21. Benzie, I.F.; Strain, J.J. The ferric reducing ability of plasma (frap) as a measure of “antioxidant power”: The frap assay. Anal. Biochem. 1996, 239, 70–76. [Google Scholar] [CrossRef]
  22. Lichtenthaler, H.K.; Wellburn, A.R. Determinations of total carotenoids and chlorophylls A and B of leaf extracts in different solvents. Biochem. Soc. Trans. 1983, 11, 591–592. [Google Scholar] [CrossRef]
  23. Ignat, I.; Volf, I.; Popa, V.I. A critical review of methods for characterisation of polyphenolic compounds in fruits and vegetables. Food Chem. 2011, 126, 1821–1835. [Google Scholar] [CrossRef] [PubMed]
  24. Moon, J.K.; Shibamoto, T. Antioxidant assays for plant and food components. J. Agric. Food Chem. 2009, 57, 1655–1666. [Google Scholar] [CrossRef] [PubMed]
  25. Sentkowska, A.; Biesaga, M.; Pyrzynska, K. Polyphenolic composition and antioxidative properties of lemon balm (Melissa officinalis L.) extract affected by different brewing processes. Int. J. Food Prop. 2015, 18, 2009–2014. [Google Scholar] [CrossRef]
  26. Pereira, R.P.; Fachinetto, R.; de Souza Prestes, A.; Puntel, R.L.; Santos da Silva, G.N.; Heinzmann, B.M.; Boschetti, T.K.; Athayde, M.L.; Bürger, M.E.; Morel, A.F.; et al. Antioxidant effects of different extracts from Melissa officinalis, Matricaria recutita and Cymbopogon citratus. Neurochem. Res. 2009, 34, 973–983. [Google Scholar] [CrossRef]
  27. Caniova, A.; Brandsteterova, E. HPLC analysis of phenolic acids in Melissa officinalis. J. Liq. Chromatogr. Relat. Technol. 2001, 24, 2647–2659. [Google Scholar] [CrossRef]
  28. Galanakis, C.M.; Goulas, V.; Tsakona, S.; Manganaris, G.A.; Gekas, V. A knowledge base for the recovery of natural phenols with different solvents. Int. J. Food Prop. 2013, 16, 382–396. [Google Scholar] [CrossRef]
  29. Tsakona, S.; Galanakis, C.M.; Gekas, V. Hydro-ethanolic mixtures for the recovery of phenols from mediterranean plant materials. Food Bioprocess Technol. 2012, 5, 1384–1393. [Google Scholar] [CrossRef]
  30. Blekas, G.; Psomiadou, E.; Tsimidou, M.; Boskou, D. On the importance of total polar phenols to monitor the stability of Greek virgin olive oil. Eur. J. Lipid Sci. Technol. 2002, 104, 340–346. [Google Scholar] [CrossRef]
  31. Atoui, A.K.; Mansouri, A.; Boskou, G.; Kefalas, P. Tea and herbal infusions: Their antioxidant activity and phenolic profile. Food Chem. 2005, 89, 27–36. [Google Scholar] [CrossRef]
  32. Jiménez-Zamora, A.; Delgado-Andrade, C.; Rufián-Henares, J.A. Antioxidant capacity, total phenols and color profile during the storage of selected plants used for infusion. Food Chem. 2016, 199, 339–346. [Google Scholar] [CrossRef] [PubMed]
  33. Exarchou, V.; Nenadis, N.; Tsimidou, M.; Gerothanassis, I.P.; Troganis, A.; Boskou, D. Antioxidant activities and phenolic composition of extracts from Greek oregano, Greek sage, and summer savory. J. Agric. Food Chem. 2002, 50, 5294–5299. [Google Scholar] [CrossRef] [PubMed]
  34. Skotti, E.; Anastasaki, E.; Kanellou, G.; Polissiou, M.; Tarantilis, P.A. Total phenolic content, antioxidant activity and toxicity of aqueous extracts from selected Greek medicinal and aromatic plants. Ind. Crops Prod. 2014, 53, 46–54. [Google Scholar] [CrossRef] [Green Version]
  35. İnce, A.E.; Şahin, S.; Şάmnά, S.G. Extraction of phenolic compounds from Melissa using microwave and ultrasound. Turk. J. Agric. For. 2013, 37, 69–75. [Google Scholar]
  36. Lin, J.-T.; Chen, Y.-C.; Lee, Y.-C.; Rolis Hou, C.-W.; Chen, F.-L.; Yang, D.-J. Antioxidant, anti-proliferative and cyclooxygenase-2 inhibitory activities of ethanolic extracts from lemon balm (Melissa officinalis L.) leaves. LWT Food Sci. Technol. 2012, 49, 1–7. [Google Scholar] [CrossRef]
  37. Szabó, K.; Malekzadeh, M.; Radácsi, P.; Ladányi, M.; Rajhárt, P.; Inotai, K.; Tavaszi-Sárosi, S.; Németh, É. Could the variety influence the quantitative and qualitative outcome of lemon balm production? Ind. Crops Prod. 2016, 83, 710–716. [Google Scholar] [CrossRef]
  38. Naczk, M.; Shahidi, F. Phenolics in cereals, fruits and vegetables: Occurrence, extraction and analysis. J. Pharm. Biomed. Anal. 2006, 41, 1523–1542. [Google Scholar] [CrossRef]
  39. Arceusz, A.; Wesolowski, M. Quality consistency evaluation of Melissa officinalis L. Commercial herbs by HPLC fingerprint and quantitation of selected phenolic acids. J. Pharm. Biomed. Anal. 2013, 83, 215–220. [Google Scholar] [CrossRef]
  40. Skendi, A.; Irakli, M.; Chatzopoulou, P. Analysis of phenolic compounds in Greek plants of Lamiaceae family by HPLC. J. Appl. Res. Med. Aromat. Plants 2017, 6, 62–69. [Google Scholar] [CrossRef]
  41. Papoti, V.T.; Tsimidou, M.Z. Impact of sampling parameters on the radical scavenging potential of olive (Olea europaea L.) leaves. J. Agric. Food Chem. 2009, 57, 3470–3477. [Google Scholar] [CrossRef]
  42. Goulas, V.; Papoti, V.T.; Exarchou, V.; Tsimidou, M.Z.; Gerothanassis, I.P. Contribution of flavonoids to the overall radical scavenging activity of olive (Olea europaea L.) leaf polar extracts. J. Agric. Food Chem. 2010, 58, 3303–3308. [Google Scholar] [CrossRef] [PubMed]
  43. Mishra, K.; Ojha, H.; Chaudhury, N.K. Estimation of antiradical properties of antioxidants using DPPH-assay: A critical review and results. Food Chem. 2012, 130, 1036–1043. [Google Scholar] [CrossRef]
  44. Prior, R.L.; Wu, X.; Schaich, K. Standardized methods for the determination of antioxidant capacity and phenolics in foods and dietary supplements. J. Agric. Food Chem. 2005, 53, 4290–4302. [Google Scholar] [CrossRef] [PubMed]
  45. Koksal, E.; Bursal, E.; Dikici, E.; Tozoglu, F.; Gulcin, I. Antioxidant activity of Melissa officinalis leaves. J. Med. Plants Res. 2011, 5, 217–222. [Google Scholar]
  46. Erkan, N.; Ayranci, G.; Ayranci, E. Antioxidant activities of rosemary (Rosmarinus officinalis L.) extract, blackseed (Nigella sativa L.) essential oil, carnosic acid, rosmarinic acid and sesamol. Food Chem. 2008, 110, 76–82. [Google Scholar] [CrossRef] [PubMed]
  47. Herodež, S.S.; Hadolin, M.; Škerget, M.; Knez, Ž. Solvent extraction study of antioxidants from balm (Melissa officinalis L.) leaves. Food Chem. 2003, 80, 275–282. [Google Scholar] [CrossRef]
  48. Nugraheni, M.; Santoso, U.; Suparmo, H.; Wuryastuti, H. In vitro antioxidant, antiproliferative and apoptosis effect of coleus Tuberosus L. Afr. J. Food Sci. 2011, 5, 232–241. [Google Scholar]
  49. Nenadis, N.; Tsimidou, M. Observations on the estimation of scavenging activity of phenolic compounds using rapid 1,1-diphenyl-2-picrylhydrazyl (DPPH.) tests. J. Am. Oil Chem. Soc. 2002, 79, 1191–1195. [Google Scholar] [CrossRef]
  50. Ordoudi, S.A.; Tsimidou, M.Z.; Vafiadis, A.P.; Bakalbassis, E.G. Structure-DPPH scavenging activity relationships: Parallel study of catechol and guaiacol acid derivatives. J. Agric. Food Chem. 2006, 54, 5763–5768. [Google Scholar] [CrossRef] [PubMed]
  51. Silva, E.M.; Pompeu, D.R.; Larondelle, Y.; Rogez, H. Optimisation of the adsorption of polyphenols from Inga edulis leaves on macroporous resins using an experimental design methodology. Sep. Purif. Technol. 2007, 53, 274–280. [Google Scholar] [CrossRef]
  52. Spiridon, I.; Colceru, S.; Anghel, N.; Teaca, C.A.; Bodirlau, R.; Armatu, A. Antioxidant capacity and total phenolic contents of oregano (Origanum vulgare), lavender (Lavandula angustifolia) and lemon balm (Melissa officinalis) from romania. Nat. Prod. Res. 2011, 25, 1657–1661. [Google Scholar] [CrossRef] [PubMed]
  53. Dias, M.I.; Barros, L.; Sousa, M.J.; Ferreira, I.C.F.R. Systematic comparison of nutraceuticals and antioxidant potential of cultivated, in vitro cultured and commercial Melissa officinalis samples. Food Chem. Toxicol. 2012, 50, 1866–1873. [Google Scholar] [CrossRef] [PubMed]
  54. Kamdem, J.P.; Adeniran, A.; Boligon, A.A.; Klimaczewski, C.V.; Elekofehinti, O.O.; Hassan, W.; Ibrahim, M.; Waczuk, E.P.; Meinerz, D.F.; Athayde, M.L. Antioxidant activity, genotoxicity and cytotoxicity evaluation of lemon balm (Melissa officinalis L.) ethanolic extract: Its potential role in neuroprotection. Ind. Crops Prod. 2013, 51, 26–34. [Google Scholar] [CrossRef]
  55. Nicolai, M.; Pereira, P.; Vitor, R.F.; Reis, C.P.; Roberto, A.; Rijo, P. Antioxidant activity and rosmarinic acid content of ultrasound-assisted ethanolic extracts of medicinal plants. Measurement 2016, 89, 328–332. [Google Scholar] [CrossRef]
  56. Pytlakowska, K.; Kita, A.; Janoska, P.; Połowniak, M.; Kozik, V. Multi-element analysis of mineral and trace elements in medicinal herbs and their infusions. Food Chem. 2012, 135, 494–501. [Google Scholar] [CrossRef] [PubMed]
  57. Rodriguez-Amaya, D.B.; Kimura, M. Harvestplus handbook for carotenoid analysis. In Harvestplus Technical Monographs; International Food Policy Research Institute (IFPRI) International Center for Tropical Agriculture (CIAT): Washington, WA, USA, 2004; pp. 1–58. [Google Scholar]
  58. Bernal, J.; Mendiola, J.A.; Ibáñez, E.; Cifuentes, A. Advanced analysis of nutraceuticals. J. Pharm. Biomed. Anal. 2011, 55, 758–774. [Google Scholar] [CrossRef] [PubMed] [Green Version]
  59. Wellburn, A.R. The spectral determination of chlorophylls a and b, as well as total carotenoids, using various solvents with spectrophotometers of different resolution. J. Plant Physiol. 1994, 144, 307–313. [Google Scholar] [CrossRef]
  60. Joubert, E. Chemical and sensory analyses of spray- and freezedried extracts of rooibos tea (Aspalathus linearis). Int. J. Food Sci. Technol. 1990, 25, 344–349. [Google Scholar] [CrossRef]
  61. Von Gadow, A.; Joubert, E.; Hansmann, C.F. Effect of extraction time and additional heating on the antioxidant activity of rooibos tea (Aspalathus linearis) extracts. J. Agric. Food Chem. 1997, 45, 1370–1374. [Google Scholar] [CrossRef]
Figure 1. Total phenols (TP) content of herbal preparations expressed as mg caffeic acid (CAF) per 250 mL cup (p < 0.05); in Section 2.3 details for sample names are provided.
Processes 07 00088 g001
Figure 2. Total phenols, total hydroxycinnamic acid derivatives, total flavonols and ferric reducing ability (FRAP) of Melissa Officinalis L. (MOL) preparations of same extract weight basis.
Processes 07 00088 g002
Figure 3. DPPH radical scavenging activity (expressed as %Inhibition and CAF μM equivalents) of MOL preparations. (a) same TP content basis; (b) same dry extract weight basis.
Processes 07 00088 g003
Figure 4. Arrangement of MOL herbal preparations according to the scores produced by the PCA technique based on Na, K, Ca and Li data. Table 2 shows the contribution of each of the four studied variables (Na, K, Ca, Li) with each axis.
Processes 07 00088 g004
Table 1. Na, K, Ca and Li content of herbal preparations expressed as mg per 250 mL cup and mg dry extract (n = 2) contained in 250mL cup (MOL: Melissa Officinalis L; CHM: Chamomile; OLF: Olive leaf).
Herbal Beverage(mg per 250 mL cup)
NaaKbCacLidDry Extract Weighte
I(A)MOL 0.5% 10’ W1.130.550.10.1455
I(A) MOL 2% 10’ W2.0100.098.30.31707
I(A)MOL 4% 10’ W2.9175.7137.70.43377
I(B) MOL 2% 10’ W2.1115.5176.10.31742
D MOL 2% 5’ W2.0288.4154.10.22856
D MOL 2% 10’ W2.8263.0153.40.33381
D MOL 2% 15’ W2.1256.1150.70.23185
S MOL 2% 10’ W1.9117.493.70.21564
S MOL 2% 10’ E1.25.156.00.4144
S MOL 2% 10’ E/W2.7125.0101.10.21383
M MOL 2% 24 h W1.6125.197.70.21609
M MOL 2% 24 h E0.84.165.00.4283
M MOL 2% 24 h E/W2.0130.3118.50.31730
I CHM 2% 10’ W15.0103.6108.20.31199
I OLF 2% 10’ W1.962.770.80.31524
a: Coefficient of Variance (CV) < 4%, b: CV < 6%, c: CV < 1%, d: CV < 2%, e: CV < 5%.
Table 2. Correlation coefficients between principal component analysis (PCA) axes 1 and 2 and the mineral concentration of MOL herbal preparations.
VariableAXIS 1AXIS 2
mg Ca per 250 mL0.9140.141
mg Na per 250 mL0.8190.07
mg K per 250 mL0.809−0.142
mg Li per 250 mL−0.0710.989
Variance2.1641.023
Var%54.125.6
Table 3. Pigment (Chlorophyll and Carotenoid) Content (μg/mL) of aqueous herbal preparations.
Herbal Preparations×80 = μg/mL
Chlorophyll aaChlorophyll bbCarotenoidsc
I(A) MOL 0.5% 10’ W0.10.30.5
I(A) MOL 2% 10’ W1.02.01.8
I(A) MOL 4% 10’ W2.14.26.6
I(B) MOL 2% 10’ W1.22.02.5
D MOL 2% 10’ W2.03.92.8
I CHM 2% 10’ W0.20.40.5
I OLF 2% 10’ W0.40.80.2
a, b, c: CV < 1%.

