Abstract
Influenced by the complexity of ocean environmental noise and the time-varying of underwater acoustic channels, feature extraction of underwater acoustic signals has always been a difficult challenge. To solve this dilemma, this paper introduces a hybrid energy feature extraction approach for ship-radiated noise (S-RN) based on complete ensemble empirical mode decomposition with adaptive noise (CEEMDAN) combined with energy difference (ED) and energy entropy (EE). This approach, named CEEMDAN-ED-EE, has two main advantages: (i) compared with empirical mode decomposition (EMD) and ensemble EMD (EEMD), CEEMDAN has better decomposition performance by overcoming mode mixing, and the intrinsic mode function (IMF) obtained by CEEMDAN is beneficial to feature extraction; (ii) the classification performance of the single energy feature has some limitations, nevertheless, the proposed hybrid energy feature extraction approach has a better classification performance. In this paper, we first decompose three types of S-RN into sub-signals, named intrinsic mode functions (IMFs). Then, we obtain the features of energy difference and energy entropy based on IMFs, named CEEMDAN-ED and CEEMDAN-EE, respectively. Finally, we compare the recognition rate for three sorts of S-RN by using the following three energy feature extraction approaches, which are CEEMDAN-ED, CEEMDAN-EE and CEEMDAN-ED-EE. The experimental results prove the effectivity and the high recognition rate of the proposed approach.
1. Introduction
Due to the complexity of ocean ambient noise and the time-varying of underwater acoustic channels, feature extraction of underwater acoustic signals has always been a difficult problem in the area of underwater acoustic signal processing [1,2]. In order to solve this problem, some feature extraction approaches for underwater acoustic signals have been proposed, including a time domain analysis, a spectral analysis, a time–frequency analysis, a high-order statistics analysis and a complexity analysis. In recent years, with the development of mode decomposition, feature extraction approaches have been proposed based on mode decomposition [3].
After Empirical mode decomposition (EMD) was first proposed as a classical mode decomposition approach, it has become widely used [4,5]. The research history and the current status of EMD mainly include two parts. On the one hand, it is the improvement of EMD, in particular for mode mixing. Two of the revised EMD approaches are generally accepted to be effective, they are ensemble EMD (EEMD) [6] and complete ensemble empirical mode decomposition with adaptive noise (CEEMDAN) [7]. In addition, CEEMDAN is an upgrade of EEMD, which can better suppress mode mixing than EEMD. On the other hand, their application areas are expanding and deepening gradually. EMD has been widely used in different fields, such as short-term wind speed forecasting combined with hybrid linear and nonlinear models [8], the detection and location of pipeline leakage [9], the detection of incipient damages for truss structures [10], denoising for grain flow signal [11], biomedical photoacoustic imaging optimization [12] and heart rate variability analysis [13]. Many scholars have also applied EEMD to their research fields, such as wind speed forecasting combined with the cuckoo search algorithm [14], machine feature extraction combined with a kernel-independent component [15], feature extraction for motor bearing combined with multi-scale fuzzy entropy [16], a bearing fault diagnosis combined with correlation coefficient analysis [17], a partial discharge feature extraction combined with sample entropy [18] and monthly streamflow forecasting combined with multi-scale predictors selection [19]. In addition, CEEMDAN is used in machinery, electricity and medicine, such as impact signal denoising [20], daily peak load forecasting [21], health degradation monitoring for rolling bearings combined with multi-scale sample entropy [22], planetary gear fault diagnosis combined with permutation entropy [23], denoising for gear transmission system [24], friction signal denoising combined with mutual information [25] and electrocardiogram signal denoising combined with wavelet threshold [26]. Generally, the three EMD approaches can solve practical problems in different fields. Some comparative studies have also proven that CEEMDAN has a better decomposition performance.
In the past three years, the mode decomposition approach has been applied to the underwater acoustic field. Two frequency feature extraction approaches were proposed, based on maximum energy intrinsic mode function (IMF) by using EEMD and variational mode decomposition (VMD), respectively [27,28]. In addition, two complexity feature extraction approaches were proposed based on the permutation entropy of maximum energy IMF by EMD [29] and the multi-scale permutation entropy of maximum energy IMF by VMD [30]. Energy feature extraction approaches for underwater acoustic signals were seldom proposed by scholars. In Reference [31], an energy feature extraction approach was put forward based on EEMD, which extracted the energy difference between the high-frequency and the low-frequency bands as a new energy feature. However, this energy feature extraction approach has limited recognition ability for different sorts of ship-radiated noise (S-RN) signals.
In this paper, we propose a new energy feature extraction approach to effectively extract the energy feature for underwater acoustic signals. The method we propose, named CEEMDAN-ED-EE, is based on CEEMDAN, energy difference (ED) and energy entropy (EE). We use CEEMDAN to decompose three sorts of S-RN signals into IMFs. According to the rule of ED and EE, we can obtain the features of ED and EE for three sorts of S-RN. Compared with CEEMDAN-ED and CEEMDAN-EE, the proposed CEEMDAN-ED-EE approach can extract energy features more effectively and has a relatively higher recognition rate.
The following section presents the theory related to CEEMDAN, ED and EE; the novel energy feature extraction approach for underwater acoustic signal is presented in Section 3; the proposed energy feature extraction approach is used to three sorts of S-RN signals in Section 4; finally, the concluding remarks are made in the last section.
2. Theory
2.1. CEEMDAN
In this study, we use the CEEMDAN approach for two main reasons: (i) CEEMDAN has a better anti-mode mixing performance than EMD and EEMD and (ii) thus far, an energy feature extraction approach using CEEMDAN has not been found for underwater acoustic signals. The main procedures of CEEMDAN can be summarized as follows:
CEEMDAN, as an improved algorithm of EMD and EEMD, can adaptively decompose complex signals into IMFs in order. The specific steps of CEEMDAN are summarized as follows [8]:
(1) Construct the noise signal by combining the original signal and white noise , noisy signals can be obtained:
(2) Decompose each by using EMD in order to get the IMF1 and its residual item, :
(3) Calculate the average value of to get the IMF1 of CEEMDAN:
(4) Subtract from to get the residual item :
(5) White noise participates in subsequent decompositions at different scales. Here we use EMD to decompose white noise as follows:
where is the j-th IMF of the i-th white noise , and is the residual item of . For convenience, we define as a set, which consists of the j-th IMFs of . Therefore, can be expressed as:
(6) Construct by combining and . We can decompose as follows:
(7) Calculate the average value of to get the IMF2 of CEEMDAN, . Residual item of CEEMDAN can be expressed as follows:
(8) In order to get the rest of IMFs and the residual item , we can construct and repeat step (6) and step (7). We can express and as follows:
(9) If the new IMF cannot be extracted from , we make equal to . We can express as follows:
where and are the number of IMFs and the residual item of .
2.2. ED
According to the definition of energy difference in Reference [31], we define an instantaneous frequency that is equal or less than 1 kHz as the low-frequency band, and an instantaneous frequency that is more than 1 kHz as the high-frequency band. Therefore, ED is defined as the difference between the high-frequency band energy and the low-frequency band energy. In this paper, the specific calculation steps of ED for S-RN are as follows:
(1) Decompose S-RN into IMFs by CEEMDAN, and then process each IMF through the Hilbert transform:
(2) The analytic signal of each IMF is represented as:
(3) We can obtain the instantaneous amplitude , instantaneous phase and instantaneous frequency as follows:
(4) Calculate the instantaneous energy intensity of each sampling point by using the instantaneous amplitude of each sampling point. For example, the q-th sampling point of p-th IMF is , the instantaneous energy intensity of this sampling point can be represented as:
(5) Calculate the high-frequency band energy and the low-frequency band energy , respectively.
where and are the instantaneous energy intensity of the k-th sampling point in the high-frequency and the low-frequency bands, respectively.
(6) ED is represented as:
2.3. EE
The difference in time–frequency distribution can be expressed by the uncertainty of energy distribution in different time–frequency bands. Time–frequency bands can be provided by using IMFs. In this paper, we propose an energy feature extraction approach for S-RN, based on CEEMDAN and EE. The specific calculation steps of EE for S-RN are as follows:
(1) Decompose S-RN into IMFs by CEEMDAN. The energy sum of each IMF equals the total energy of the S-RN signal without considering the residual item.
where and are the energy of the S-RN signal and the energy of i-th IMF.
(2) Calculate the energy proportion of each IMF in the S-RN signal.
where is the energy proportion of i-th IMF.
(3) According to the definition of information entropy, we can express EE of the S-RN signal as:
3. Hybrid Energy Feature Extraction Approach for S-RN
This paper presents a hybrid energy feature extraction approach for S-RN, based on CEEMDAN, ED and EE. The proposed CEEMDAN-ED-EE approach, combining the advantages of CEEMDAN-ED and CEEMDAN-EE, can reflect the energy distribution of a S-RN signal at different scales. The flowchart of the hybrid energy feature extraction approach is shown in Figure 1. The specific steps of the hybrid energy feature extraction approach are as follows:
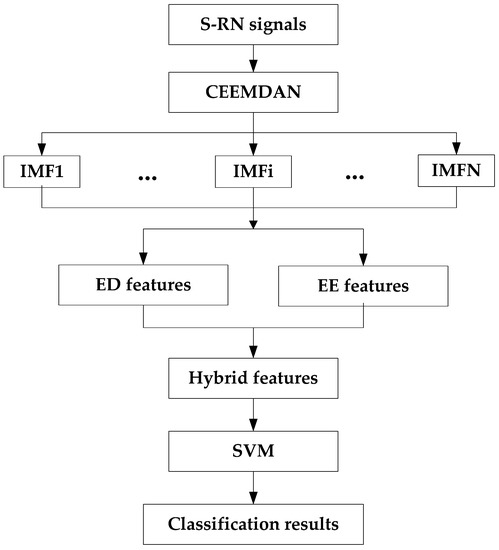
Figure 1.
The flowchart of the hybrid energy feature extraction approach; S-RN: ship-radiated noise, CEEMDAN: complete ensemble empirical mode decomposition with adaptive noise; IMF: intrinsic mode function, ED: energy difference, EE: energy entropy, SVM: support vector machine.
Step 1: The S-RN signal decomposition.
(1) Collect S-RN signals under sensor measurement;
(2) Decompose S-RN signals into N IMFs by CEEMDAN.
Step 2: hybrid energy feature extraction.
(1) Extract ED features for S-RN signals;
(2) Extract EE features for S-RN signals;
(3) Extract hybrid energy features for S-RN signals by combining ED and EE;
Step 3: classification and recognition.
(1) Input hybrid energy features of different S-RN signals into a support vector machine (SVM);
(2) Obtain the classification accuracy for S-RN signals.
4. Energy Feature Extraction for S-RN
4.1. Data Measurement
In this paper, three sorts of S-RN signals were measured in the South China Sea, called Ship-1, Ship-2 and Ship-3. In order to reduce the influence of artificial and ocean background noise, we obtained the data under a sea state of level 1. The depths of the measurement area and the hydrophones were about 4 km and 30 m, respectively. Each sample of S-RN had 5000 sampling points; the three types of S-RN signals, which were normalized are shown in Figure 2.
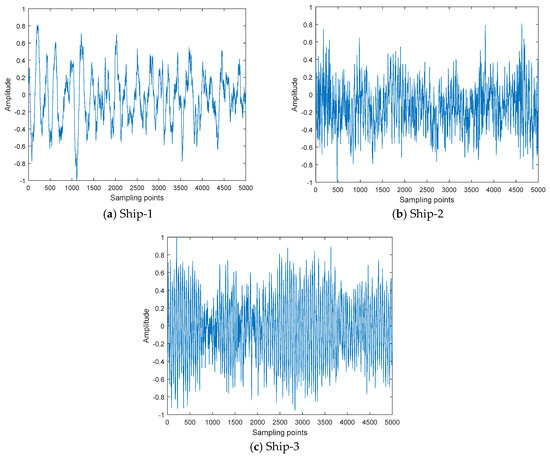
Figure 2.
Three sorts of S-RN signals.
4.2. CEEMDAN for S-RN
Traditional feature extraction approaches usually extract features from original target signals, which can only acquire limited features. In this study, three sorts of S-RN signals were decomposed from a high-frequency to a low-frequency by using CEEMDAN. The CEEMNAN results for S-RN signals are shown in Figure 3. By observing Figure 3, it can be seen that the amplitude and the number of IMFs were different for all three types of S-RN signals.
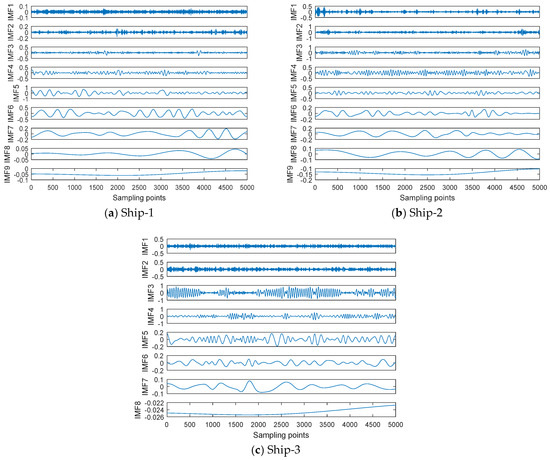
Figure 3.
CEEMNAN results for S-RN signals.
4.3. CEEMDAN-ED
The ED of the high-frequency and the low-frequency bands can reflect the energy distribution of S-RN signals on the macroscopic scale. The CEEMDAN-ED approach was first used to calculate the analytic signal of each IMF; we then obtained the energy of the high-frequency and the low-frequency bands, according to the instantaneous frequency and amplitude of each sampling point. The energy of the low-frequency and the high-frequency bands for S-RN signals are shown in Figure 4. Finally, the ED was obtained by a subtraction operation. The ED for S-RN signals are shown in Table 1. As can be seen from Figure 4 and Table 1, the ED of Ship-1 was distinctly different from the other two ships, while the EDs of Ship-2 and Ship-3 were very close.
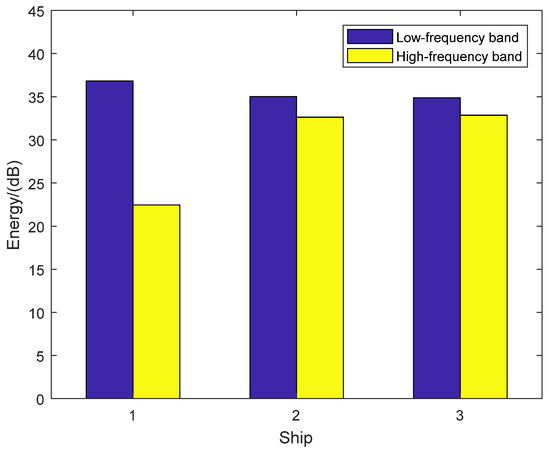
Figure 4.
The energy of the low-frequency and the high-frequency band for S-RN signals.

Table 1.
The ED for S-RN signals. S-RN: ship-radiated noise, ED: energy difference.
The ED distribution for S-RN signals (20 samples for each ship) is shown in Figure 5. As can be seen from Figure 5, the ED of the same ship remained at the same level. We could easily distinguish Ship-1 by using ED, however, it was difficult to distinguish between Ship-2 and Ship-3, due to their similar EDs.
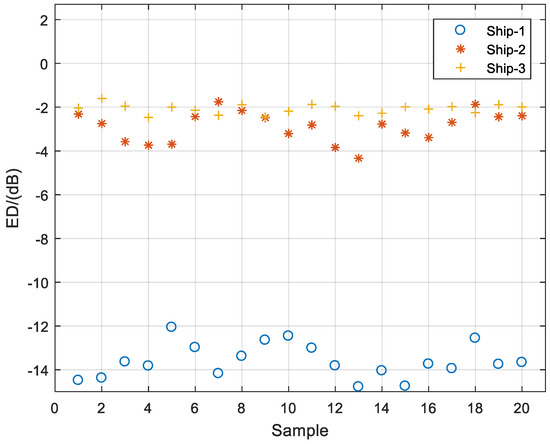
Figure 5.
The ED distribution for S-RN signals.
4.4. CEEMDAN-EE
The energy of IMF by CEEMDAN can reflect the energy distribution of S-RN signals on the IMF scale. The CEEMDAN-EE approach was first used to calculate the energy of each IMF according to the instantaneous amplitude of each sampling point; we then obtained the energy proportion of each IMF. The energy proportion for S-RN signals is shown in Figure 6. Finally, the EE was calculated according to information entropy. The EE for S-RN signals is shown in Table 2. As can be seen from Figure 6 and Table 2, the EE of Ship-2 was distinctly different from the other two ships, while the EE difference between Ship-1 and Ship-3 was small.
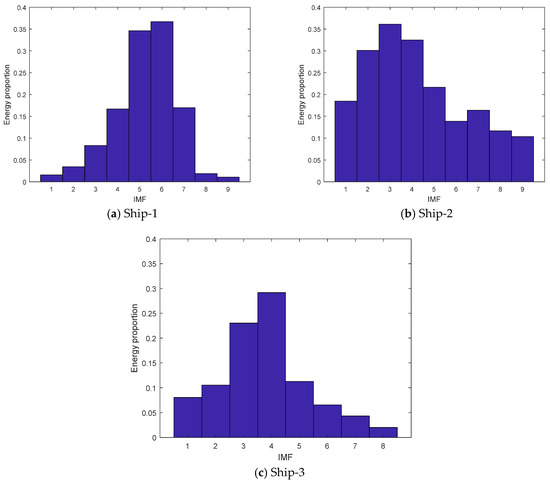
Figure 6.
The energy proportion for S-RN signals.
Table 2.
The EE for S-RN signals. EE: energy entropy.
The EE distribution for S-RN signals (20 samples for each ship) is shown in Figure 7. As was the case in the measurement of the ED distribution, the EE of the same ship was also at the same level, as can be seen in Figure 7; we could distinguish Ship-2 by using EE, however, it was hard to distinguish between Ship-1 and Ship-3 because of their similar EEs.
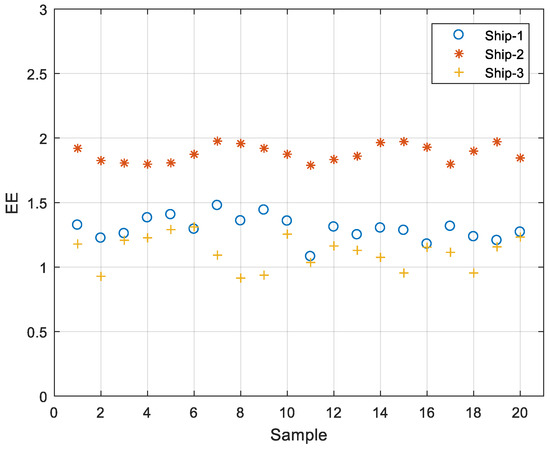
Figure 7.
The EE distribution for S-RN signals.
4.5. CEEMDAN-ED-EE
CEEMDAN-ED and CEEMDAN-EE are all energy feature extraction approaches for S-RN signals. The two approaches extract energy features based on the macroscopic scale and the IMF scale, respectively. However, CEEMDAN-ED and CEEMDAN-EE have limited and different capabilities for S-RN signals that distinguish them. In this paper, CEEMDAN-ED-EE, as a hybrid energy feature extraction approach, was proposed because it combines the advantages of CEEMDAN-ED and CEEMDAN-EE. The hybrid feature distribution for S-RN signals (20 samples for each ship) is shown in Figure 8. As can be seen from the horizontal and vertical coordinates in Figure 8, representing ED and EE respectively, the hybrid features of the same ship were distributed in a limited region, and the hybrid features of the different ships were independent and non-overlapping. Therefore, we could easily distinguish the three sorts of S-RN.
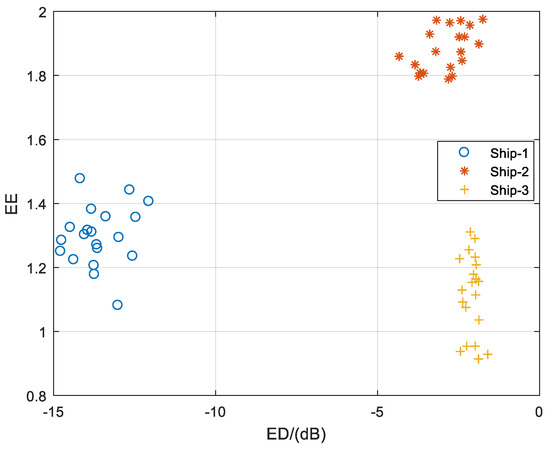
Figure 8.
The hybrid feature distribution for S-RN signals.
In order to further prove the effectiveness of CEEMDAN-ED-EE, we used SVM for the classification of the three sorts of S-RN. The number of samples for each ship was 100, and the classification results for S-RN signals are listed in Table 3. As shown in the Table 3, CEEMDAN-ED and CEEMDAN-EE had a higher recognition rate than EMD-ED, EMD-EE, EEMD-ED and EEMD-EE; CEEMDAN-ED-EE also had a higher recognition rate than EMD-ED-EE and EEMD-ED-EE; in addition, the classification result of CEEMDAN-ED-EE was shown to be 100%, which was better than CEEMDAN-ED and CEEMDAN-EE.
Table 3.
The classification results for S-RN signals. CEEMDAN: complete ensemble empirical mode decomposition with adaptive noise; EMD: empirical mode decomposition; EEMD: ensemble empirical mode decomposition.
5. Conclusions
A hybrid energy feature extraction approach for S-RN was proposed in this paper based on CEEMDAN, ED and EE. The main contributions to this work are as follows:
- (1)
- CEEMDAN was first used to extract the energy features of IMF for underwater acoustic signals in this paper.
- (2)
- An energy feature extraction approach for S-RN was proposed in this paper based on IMFs by CEEMDAN and EE.
- (3)
- CEEMDAN-ED-EE was successfully applied to extract the energy feature of S-RN signals. CEEMDAN-ED-EE can be more accurate and efficient in extracting the energy feature.
- (4)
- Compared with CEEMDAN-ED and CEEMDAN-EE, CEEMDAN-ED-EE was shown to have a better performance, which proves its effectivity and its high recognition rate.
Author Contributions
Y.L. contributed the energy feature extraction method, all authors designed and analyzed the experiments.
Funding
Authors gratefully acknowledge the supported by National Natural Science Foundation of China (No. 51409214 and No. 51179157).
Conflicts of Interest
The authors declare no conflict of interest.
References
- Li, Y.; Li, Y.; Chen, X.; Yu, J. Denoising and Feature Extraction Algorithms Using NPE Combined with VMD and Their Applications in Ship-Radiated Noise. Symmetry 2017, 9, 256. [Google Scholar] [CrossRef]
- Li, Y.; Li, Y.; Chen, X.; Yu, J. Research on ship-radiated noise denoising using secondary variational mode decomposition and correlation coefficient. Sensors 2018, 18, 48. [Google Scholar]
- Wang, S.; Zeng, X. Robust underwater noise targets classification using auditory inspired time-frequencyanalysis. Appl. Acoust. 2014, 78, 68–76. [Google Scholar] [CrossRef]
- Huang, N.E.; Shen, Z.; Long, S.R.; Wu, M.C.; Shih, H.H.; Zheng, Q.; Yen, N.C.; Tung, C.C.; Liu, H.H. The empirical mode decomposition and the Hilbert spectrum for nonlinear and non-stationary time series analysis. Proc. R. Soc. Lond. A 1998, 454, 903–995. [Google Scholar] [CrossRef]
- Ge, H.; Chen, G.; Yu, H.; Chen, H.; An, F. Theoretical Analysis of Empirical Mode Decomposition. Symmetry 2018, 10, 623. [Google Scholar] [CrossRef]
- Wu, Z.; Huang, N.E. Ensemble empirical mode decomposition: A noise-assisted data analysis method. Adv. Adapt. Data Anal. 2009, 1, 1–41. [Google Scholar] [CrossRef]
- Li, Y.; Li, Y.; Chen, X.; Yu, J.; Yang, H.; Wang, L. A New Underwater Acoustic Signal Denoising Technique Based on CEEMDAN, Mutual Information, Permutation Entropy, and Wavelet Threshold Denoising. Entropy 2018, 20, 563. [Google Scholar] [CrossRef]
- Han, Q.; Wu, H.; Hu, T.; Chu, F. Short-Term Wind Speed Forecasting Based on Signal Decomposing Algorithm and Hybrid Linear/Nonlinear Models. Energies 2018, 11, 2976. [Google Scholar] [CrossRef]
- Pan, S.; Xu, Z.; Li, D.; Lu, D. Research on Detection and Location of Fluid-Filled Pipeline Leakage Based on Acoustic Emission Technology. Sensors 2018, 18, 3628. [Google Scholar] [CrossRef] [PubMed]
- Moreno-Gomez, A.; Amezquita-Sanchez, J.P.; Valtierra-Rodriguez, M.; Perez-Ramirez, C.A.; Dominguez-Gonzalez, A.; Chavez-Alegria, O. EMD-Shannon Entropy-Based Methodology to Detect Incipient Damages in a Truss Structure. Appl. Sci. 2018, 8, 2068. [Google Scholar] [CrossRef]
- Wang, H.; Song, H. A Filtering Method for Grain Flow Signals Using EMD Thresholds Optimized by Artificial Bee Colony Algorithm. Symmetry 2018, 10, 575. [Google Scholar] [CrossRef]
- Guo, C.; Chen, Y.; Yuan, J.; Zhu, Y.; Cheng, Q.; Wang, X. Biomedical Photoacoustic Imaging Optimization with Deconvolution and EMD Reconstruction. Appl. Sci. 2018, 8, 2113. [Google Scholar] [CrossRef]
- Bin Queyam, A.; Kumar Pahuja, S.; Singh, D. Quantification of Feto-Maternal Heart Rate from Abdominal ECG Signal Using Empirical Mode Decomposition for Heart Rate Variability Analysis. Technologies 2017, 5, 68. [Google Scholar] [CrossRef]
- Liu, T.; Liu, S.; Heng, J.; Gao, Y. A New Hybrid Approach for Wind Speed Forecasting Applying Support Vector Machine with Ensemble Empirical Mode Decomposition and Cuckoo Search Algorithm. Appl. Sci. 2018, 8, 1754. [Google Scholar] [CrossRef]
- Fang, L.; Sun, H. Study on EEMD-Based KICA and Its Application in Fault-Feature Extraction of Rotating Machinery. Appl. Sci. 2018, 8, 1441. [Google Scholar] [CrossRef]
- Zhao, H.; Sun, M.; Deng, W.; Yang, X. A New Feature Extraction Method Based on EEMD and Multi-Scale Fuzzy Entropy for Motor Bearing. Entropy 2017, 19, 14. [Google Scholar] [CrossRef]
- Jiang, F.; Zhu, Z.; Li, W.; Ren, Y.; Zhou, G.; Chang, Y. A Fusion Feature Extraction Method Using EEMD and Correlation Coefficient Analysis for Bearing Fault Diagnosis. Appl. Sci. 2018, 8, 1621. [Google Scholar] [CrossRef]
- Shang, H.; Lo, K.L.; Li, F. Partial Discharge Feature Extraction Based on Ensemble Empirical Mode Decomposition and Sample Entropy. Entropy 2017, 19, 439. [Google Scholar] [CrossRef]
- Chu, H.; Wei, J.; Qiu, J. Monthly Streamflow Forecasting Using EEMD-Lasso-DBN Method Based on Multi-Scale Predictors Selection. Water 2018, 10, 1486. [Google Scholar] [CrossRef]
- Zhan, L.; Li, C. A Comparative Study of Empirical Mode Decomposition-Based Filtering for Impact Signal. Entropy 2017, 19, 13. [Google Scholar] [CrossRef]
- Dai, S.; Niu, D.; Li, Y. Daily Peak Load Forecasting Based on Complete Ensemble Empirical Mode Decomposition with Adaptive Noise and Support Vector Machine Optimized by Modified Grey Wolf Optimization Algorithm. Energies 2018, 11, 163. [Google Scholar] [CrossRef]
- Lv, Y.; Yuan, R.; Wang, T.; Li, H.; Song, G. Health Degradation Monitoring and Early Fault Diagnosis of a Rolling Bearing Based on CEEMDAN and Improved MMSE. Materials 2018, 11, 1009. [Google Scholar] [CrossRef] [PubMed]
- Kuai, M.; Cheng, G.; Pang, Y.; Li, Y. Research of Planetary Gear Fault Diagnosis Based on Permutation Entropy of CEEMDAN and ANFIS. Sensors 2018, 18, 782. [Google Scholar] [CrossRef] [PubMed]
- Bai, L.; Han, Z.; Li, Y.; Ning, S. A Hybrid De-Noising Algorithm for the Gear Transmission System Based on CEEMDAN-PE-TFPF. Entropy 2018, 20, 361. [Google Scholar] [CrossRef]
- Li, C.; Zhan, L.; Shen, L. Friction Signal Denoising Using Complete Ensemble EMD with Adaptive Noise and Mutual Information. Entropy 2015, 17, 5965–5979. [Google Scholar] [CrossRef]
- Xu, Y.; Luo, M.; Li, T.; Song, G. ECG Signal De-noising and Baseline Wander Correction Based on CEEMDAN and Wavelet Threshold. Sensors 2017, 17, 2754. [Google Scholar] [CrossRef]
- Li, Y.; Li, Y.; Chen, X. Ships’radiated noise feature extraction based on EEMD. J. Vib. Shock 2017, 36, 114. [Google Scholar]
- Li, Y.; Li, Y.; Chen, X.; Yu, J. Feature extraction of ship-radiated noise based on VMD and center frequency. J. Vib. Shock 2018, 37, 213. [Google Scholar]
- Li, Y.; Li, Y.; Chen, Z.; Chen, X. Feature Extraction of Ship-Radiated Noise Based on Permutation Entropy of the Intrinsic Mode Function with the Highest Energy. Entropy 2016, 18, 393. [Google Scholar] [CrossRef]
- Li, Y.; Li, Y.; Chen, X.; Yu, J. A Novel Feature Extraction Method for Ship-Radiated Noise Based on Variational Mode Decomposition and Multi-Scale Permutation Entropy. Entropy 2017, 19, 342. [Google Scholar]
- Yang, H.; Li, Y.; Li, G. Energy analysis of ship-radiated noise based on ensemble empirical mode decomposition. J. Vib. Shock 2015, 34, 55–59. [Google Scholar]


© 2019 by the authors. Licensee MDPI, Basel, Switzerland. This article is an open access article distributed under the terms and conditions of the Creative Commons Attribution (CC BY) license (http://creativecommons.org/licenses/by/4.0/).