Article

Smart Community Energy Cost Optimization Taking User Comfort Level and Renewable Energy Consumption Rate into Consideration

1
Department of Power Consumption, China Electric Power Research Institute, Beijing 100192, China
2
Department of Electrical Engineering, Northeast Electric Power University, Jilin 132012, China
*
Author to whom correspondence should be addressed.
Processes 2019, 7(2), 63; https://doi.org/10.3390/pr7020063
Submission received: 14 January 2019 / Revised: 23 January 2019 / Accepted: 24 January 2019 / Published: 26 January 2019

Abstract

:
With the rapid development of smart community technologies, how to improve user comfort levels and make full use of renewable energy have become urgent problems. This paper proposes an optimization algorithm to minimize daily energy costs while considering user comfort level and renewable energy consumption rate. In this paper, the structure of a typical smart community and the output models of all components installed in the community are introduced first. Then, the characteristics of different types of loads are analyzed, followed by defining the coefficients of user comfort level. In this step, the influence of load-scheduling on user comfort level and the renewable energy consumption rate is emphasized. Finally, based on the time-of-use gas price, this paper optimizes the daily energy costs for an off-grid community under the constraints of the comfort level and renewable energy consumption rate. Results show that scheduling transferable loads and interruptible loads are not independent to each other, and improving user comfort level requires spending more money as compensation. Moreover, fully consuming renewable energy has side effects on energy bills and battery lifetime. It is more conducive to system economy and stability if the maximum renewable energy consumption rate is restricted to 95%.

1. Introduction

A smart community is a standard architecture group, which is planned and constructed by governments. It has complete supporting facilities, including energy supply, communication, transportation, and warehousing, which makes it possible to meet the needs of industrial production and specific scientific experiments. More importantly, an advanced smart community can provide convenient and personalized services in terms of human work and life [1]. Since smart communities have obvious advantages compared with traditional communities, the development of smart communities has prompted considerable awareness from all over the world, which thus accelerates the pace of planning and constructing of smart communities [2,3,4].
With the rapid development of renewable energy and internet of things technology, the proportion of distributed power generation increases significantly in smart communities. By increasing the amount of renewable generation, smart communities can not only reduce the exploitation of fossil energy, but also promote the sustainable development of society [5,6]. In addition, a smart community has the characteristic of local consumption of renewable energy, which is considered to be an effective means of dealing with energy efficiency [7,8]. Therefore, it plays an important role in improving energy efficiency and promoting the use of low-carbon energy [9,10]. However, at present, the operation and management of smart communities still lacks perfect user comfort evaluation methods and research on renewable energy consumption, which will seriously hinder the further development of smart communities [11]. Therefore, it is of great significance to study further the influence of user comfort level, renewable energy consumption, and other factors on the optimal operation of the smart community.
In the study of controllable load optimization in smart communities, user comfort level is an important evaluation index and an essential constraint condition. An optimal and automatic residential energy consumption scheduling framework, proposed in [12], aimed to find a desired trade-off between the optimal energy costs and the waiting time of equipment operation under the incentive of electricity price. It was mentioned in [13] that an approximate greedy iterative algorithm had been employed to adjust the use time of electric equipment to reduce the cost of electricity. Both above-mentioned articles used the same criteria to judge user comfort level for all the electrical appliances in a unified way. However, regarding controllable loads, the influences of shifting transferable loads and shedding interruptible loads on user comfort level are significantly different, and therefore the lack of classification of user comfort level would lead to a large error in optimization results. The coordination scheduling method of electric vehicles and home energy was described in [14] based on energy costs and comfort levels. The authors only considered the influence of a detailed controllable load (electric vehicle) optimization on user comfort level, while there are multiple controllable loads in smart communities. Therefore, it is necessary to classify controllable loads and propose a universal comfort evaluation method. In this paper, the controllable loads in smart communities were divided into transferable loads and interruptible loads, and the coefficients of user comfort levels relating to transferable and interruptible loads were proposed according to their respective characteristics, to optimize the load-scheduling of the smart community.
With the rapid development of clean energy technologies, how to improve the consumption rate of renewable energy has become a research hotspot of power system optimization. To enhance a network’s peak load regulation capacity and improve system efficiency, an additional portable energy system and a heat storage tank were introduced in [15] to optimize the operation of a distributed network. This study significantly improved the stability of network operation, but it ignored renewable energy consumption rate. Based on the state-queuing model, a renewable energy output tracking control algorithm was put forward in [16] to consume renewable energy. To maximize the direct self-consumption of photovoltaic power, [17] proposed a new method to determine the power generation of photovoltaic generators based on the cost-competitiveness. A logarithmic mean divisia index method was proposed in [18], proving that urbanization had a positive effect on the growth of renewable energy consumption. All the aforementioned articles promote the consumption rate of renewable energy. However, there was no quantitative analysis of the impact of promoting renewable consumption rate on energy costs. This paper compared and analyzed the cost changes under different renewable energy consumption rates and revealed the relationship between the renewable energy consumption rate and the cost change.
To make full use of demand-side resources to participate in power system interaction programs, many experts have carried out studies on tariff policies such as time-of-use tariff. The authors of [19,20] put forward optimization methods of scheduling controllable loads according to the electricity price policy. Yu et al. proposed a new operation method of risk-averse to adjust hybrid power generation with the purpose of dealing with price fluctuations in the power market and saving electricity costs for industrial users [21]. Nojavan et al. developed a model relating to user demand response under the time-of-use tariff policy, and discussed the impact of time-of-use tariff on load-scheduling and electricity purchase [22]. The authors of [23] proposed an EV impact analysis approach and analyzed the impact of EV charging on distributed network under time-of-use pricing. The above articles, in terms of the influence of electricity price policy upon power grid and users, played an important guiding role in reducing electricity costs and improving system stability. It is worth noting that with the rapid development of power generation technologies in recent years, many fuel cells and diesel generators fueled by natural gas and diesel emerge on the demand side, causing price fluctuations of gas and diesel. However, there is a lack of research on power system optimization based on gas price or diesel price. Therefore, this paper proposed a fuel cell operation optimization strategy considering time-of-use gas price.
The main contributions of this paper can be summarized as follows:
(1) Controllable loads were classified as transferable loads and interruptible loads, and then the coefficients of user comfort level relating to transferable loads and interruptible loads were defined, respectively. Additionally, the influences of load-shifting and interruption on user comfort level were studied.
(2) Based on different renewable energy consumption rates, daily energy costs of the smart community were optimized, which revealed how the renewable energy consumption rate influenced the daily energy costs and user comfort level.
(3) Considering the influence of user comfort level and renewable energy consumption rate on system optimization, the optimal operation strategy of the smart community was proposed based on time-of-use gas price, and subsequently verified by the case study.

2. System Definition and Its Modelling

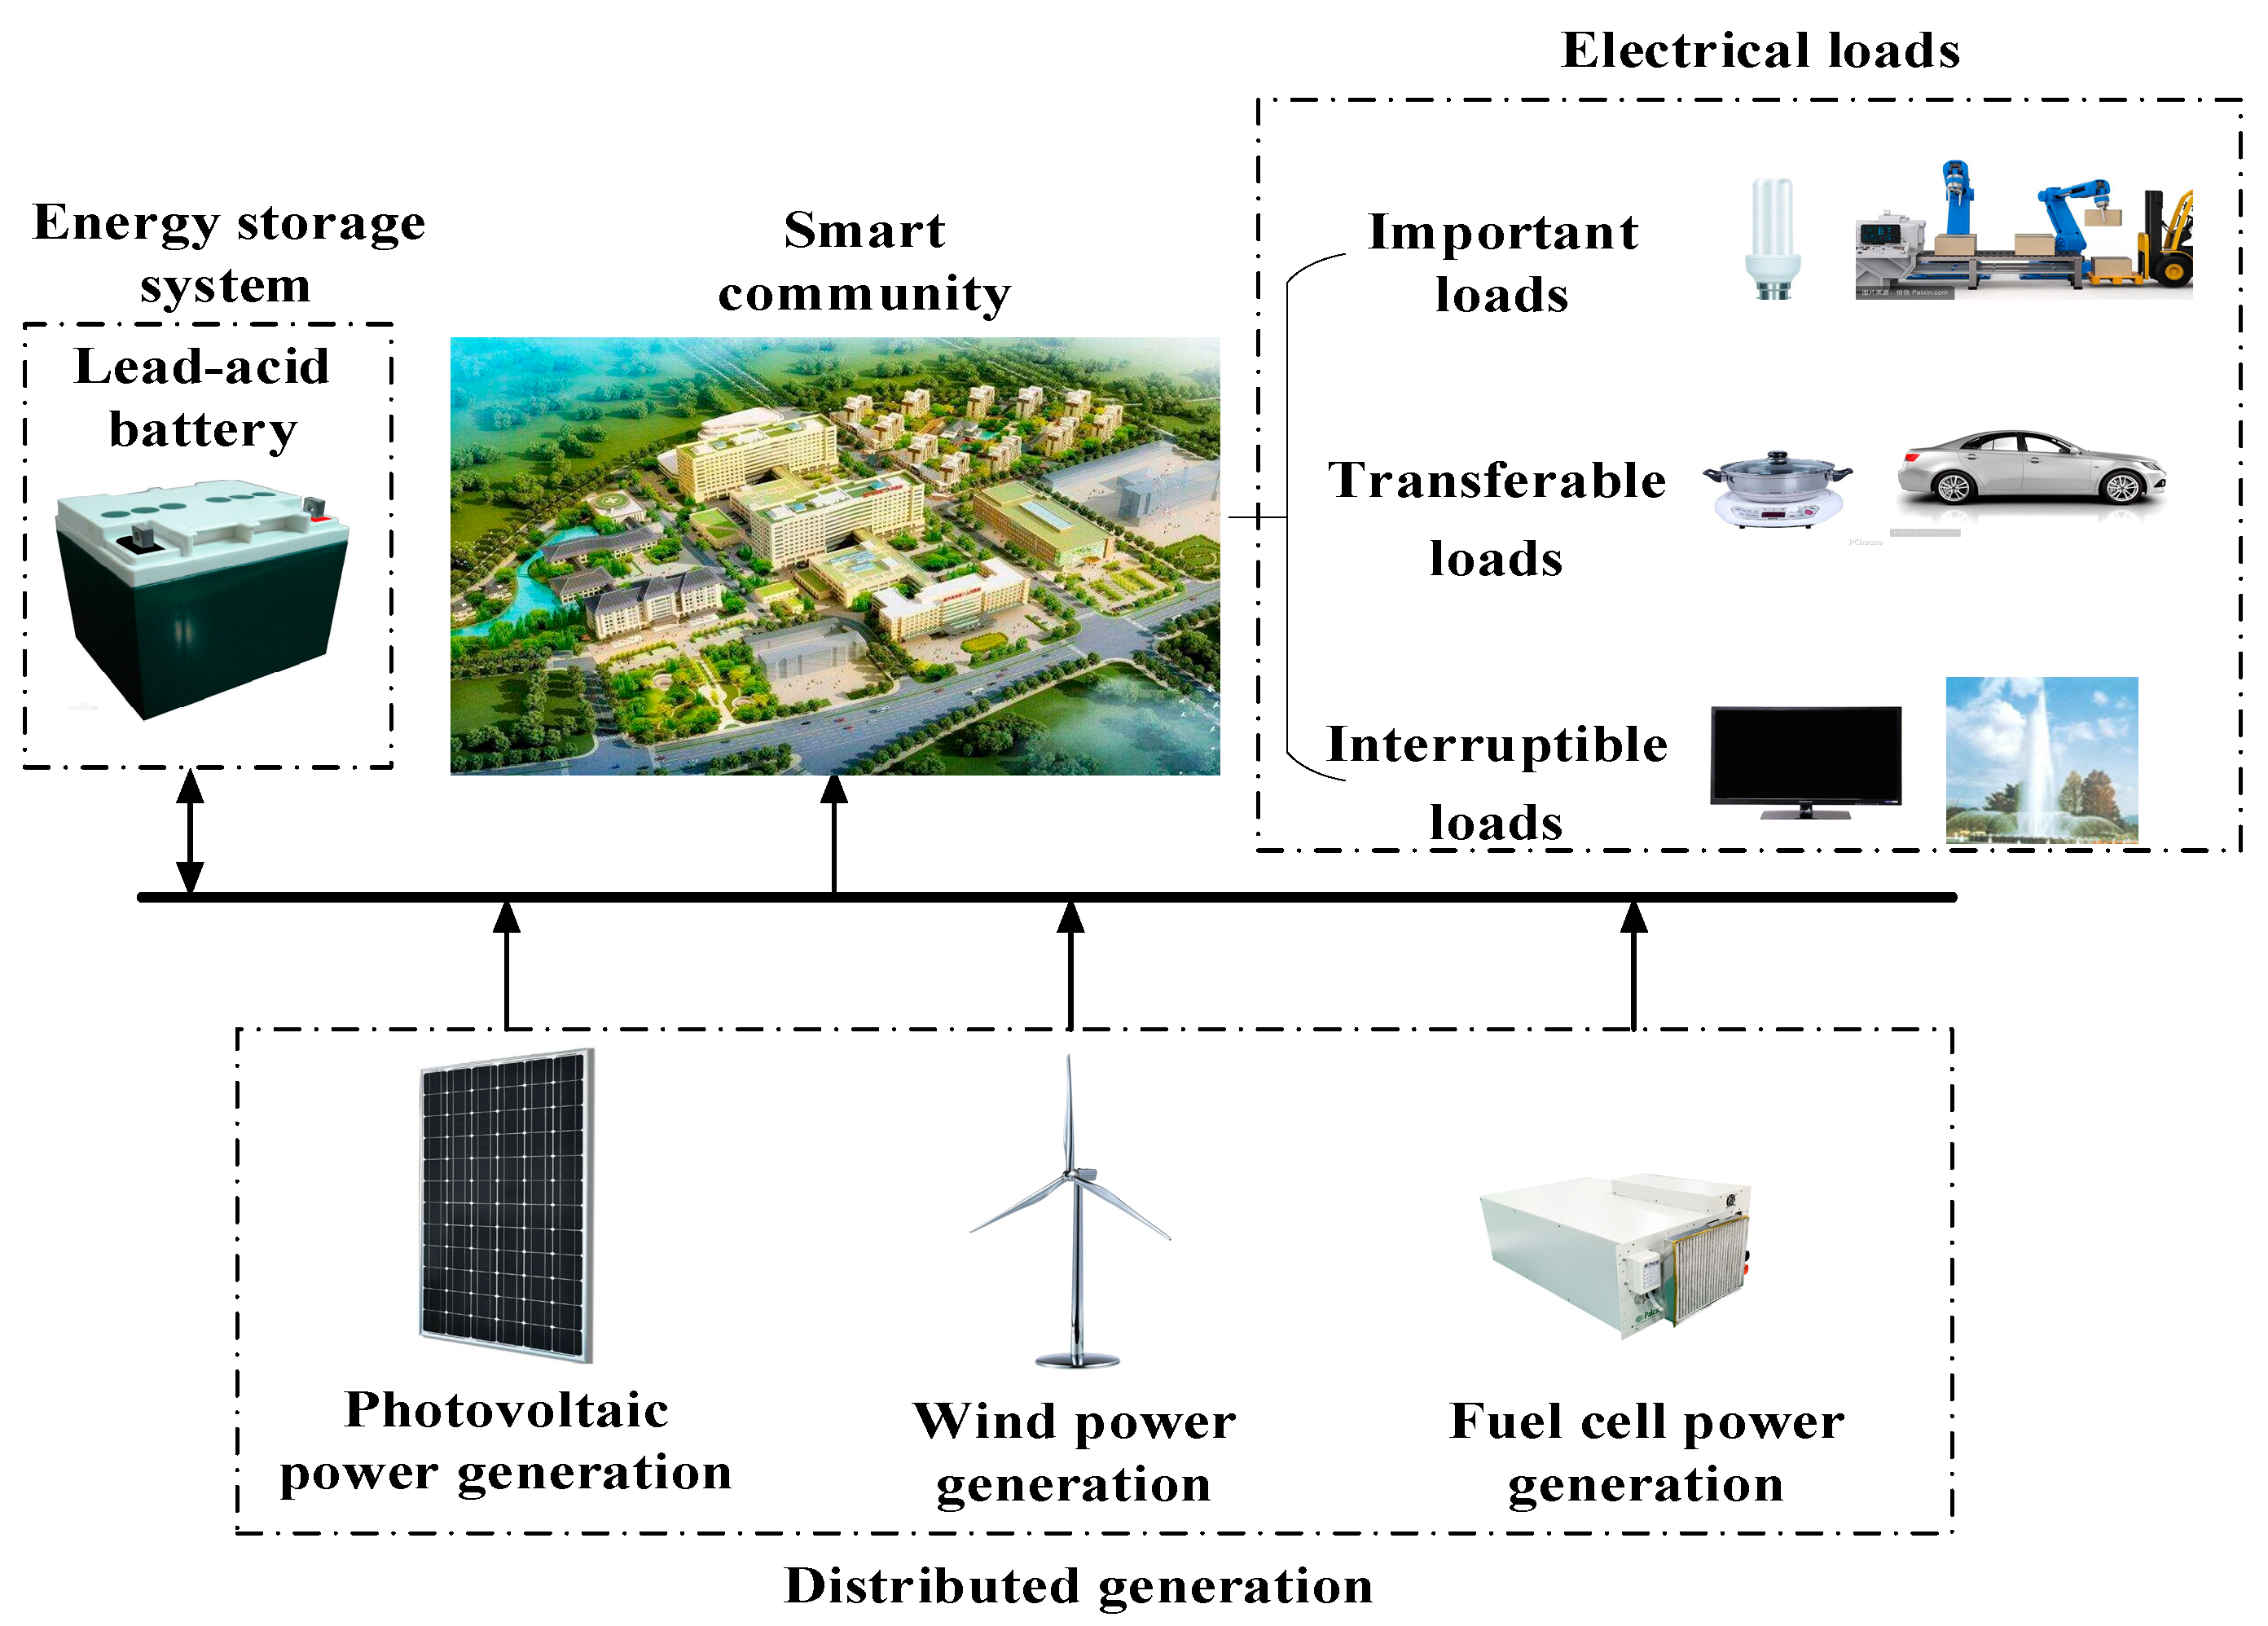
2.1. System Definition

Compared with a traditional community, a smart community integrates the most advanced technologies of information, communication, and renewable energy, and these technologies enable the smart community to interlace information with energy generation system, storage system, and loads. In addition, a clear classification of electrical loads and proper configuration of energy storage system capacity can help smart communities optimize power flow in multiple time scales.
In this paper, a distributed generation system with photovoltaic, wind turbine, and fuel cells installation is selected as an example to show the typical structure of the distributed generation system. Additionally, lead-acid batteries are used as an energy storage system. Figure 1 is the structure diagram of a smart community.

2.2. Modelling of Distributed Power Systems

To accurately balance power generation and consumption within smart communities, the mathematical output power models of the distributed power sources (including distributed photovoltaic, wind turbine power and fuel cell), distributed energy storage systems, and loads are developed in this part.

2.2.1. Modelling of Renewable Energy Generation Systems

As four primary types of renewable energy generation, solar generation, wind turbine power generation, geothermal generation, and tidal generation have their own remarkable advantages of less pollution and strong sustainability, and therefore are widely deployed in distributed smart communities to reduce carbon emissions in the process of power generation [24]. Considering the fact that solar energy generation and wind turbine power generation are easy to access and are complementary to each other, they are selected as examples to show the output power models of renewable energy generation systems.
  • Modelling of Photovoltaic Generation
Photovoltaic generation is a kind of noise-free and pollution-free energy technology, which can be installed on roofs to reduce the footprint of power generation [25]. Since the output of photovoltaic generation is strongly affected by solar radiation intensity, ambient temperature, etc., its output power needs to be revised under the standard test condition (STC). The realistic output power of photovoltaic can be expressed as [26]:
P p v = P S T C G S G S T C [ 1 + k ( T c T 0 ) ]
  • Modelling of Wind Turbine Generation
Similarly to photovoltaic generation, wind turbine power generation also has the advantage of environmentally friendliness, and additionally it achieves much lower levelized cost of energy (LCOE). Because the output powers of photovoltaic generation and wind turbine power generation are complementary to each other, they can be installed as a package to compensate for the uncertainty of renewable generation.
Based on the operation characteristics, wind turbines can be divided into two categories, namely the fixed-speed generator and the variable-speed generator. Compared with the fixed-speed generator, the variable-speed generator is more cost efficient, stable, and lightweight. Therefore, it is preferable to install variable-speed generators in smart communities. The mathematical output power model of variable-speed generators can be expressed as follows [27]:
P w = { 0 , v < v c i , v > v c o a v + b , v c i v < v r P 0 , v r v v c o
where:
a = P 0 v r v c i
b = P 0 v c i v r v c i

2.2.2. Modelling of Fossil Power Generation Systems

Fossil power generation systems have characteristics of high energy efficiency, flexible use, and low environmental dependency. They can be used to supply supplementary power for loads when renewable generation cannot meet loads. In this paper, the fuel cell is selected as an example to demonstrate the output power of a fossil power generation system [28].
P f c = η f c P f c i n

2.2.3. Modelling of Distributed Energy Storage Systems

Since renewable generation is the dominant form of power generation in most smart communities, the great uncertainty of renewable energy may break the balance of power generation and loads. To improve power quality and maintain system stability, an energy storage system is generally installed in smart communities.
The optimization of an energy storage system helps to boost system flexibility and reduce system loss of load probability (LOLP). As an important parameter that needs to be monitored, battery state of charge (SOC) represents the proportion of remaining battery capacity to battery installation capacity at the current time. Therefore, the mathematical expression of battery SOC can be represented by [29]:
S O C e s ( t ) = ( 1 δ ) S O C e s ( t 1 ) P e s ( t ) η e s ( t ) Δ t E e s

2.2.4. Modelling of Loads

According to the importance of user loads, electrical demands can be classified into three types: important loads, transferable loads, and interruptible loads. Among them, important loads, which include basic lighting, production equipment, etc., must be satisfied in all operation conditions, and cannot be removed or shifted. However, transferable loads, which include residential electric cookers, electric vehicles etc., can be transferred from one time period to another without changing total power consumption. Finally, interruptible loads, including air conditioning and electrical heating systems, can be cut off for some time according to system scheduling plans. Since important loads have no effects on user comfort levels, this paper focuses on modelling the influences of transferable loads and interruptible loads on user comfort levels.
The length of operation time can be different for different types of transferable loads. However, for a specific transferable load, the amount of energy consumption cannot be changed within an optimization period. When scheduling transferable loads, it is not only necessary to consider current transferable loads, but also the number of loads shifted in/out to the current/next period. Therefore, the net transferable loads at time t can be expressed as:
H T L N ( t ) = H T L C ( t ) + H T L I ( t ) H T L O ( t )
where:
H T L C ( t ) = i = 1 N P T L C i ( t )
H T L I ( t ) = m = 1 J P T L I m ( t )
H T L O ( t ) = n = 1 K P T L O n ( t )
When renewable power generation is less than the predicted value or system spinning reserve is insufficient to cover all electrical loads, some of interruptible loads should be cut off to ensure network safety operation. Total electrical loads that need to be cut off at time t can be expressed as:
H I L ( t ) = max { Δ P r _ d ( t ) f s r _ u ( t ) , 0 }
As demonstrated in the introduction, most previous studies focus on minimizing user energy costs without considering customer comfort level. A few studies may consider user comfort level when optimizing user energy costs, but in this process, they do not clearly specify the types of loads. In the following parts, two coefficients of customer comfort level relating to transferable loads and interruptible loads are defined separately.
For transferable loads, user comfort level is directly related to the time interval of load-shifting. If the time interval of load-shifting is shorter, less impact will be given to users and higher comfort can be experienced by users. Therefore, the coefficient of user comfort level relating to transferable loads (φTL) is defined as follows:
φ T L = | t s t α | t β t α
In contrast to transferable loads, interruptible loads can be directly cut off at peak demand time and do not need to make up for it at low demand time. For interruptible loads, user comfort level is mainly affected by the actual interruption power. For a given amount of interruptible energy, if it is removed in a short period (i.e., the interruption power is high), user comfort level can be significantly affected. By contrast, if it is removed for a relatively long period of time (i.e., the interruption power is lower), user comfort level be will less affected. In other words, it is preferable to cut off interruptible loads with lower power and longer period of time. In summary, the coefficient of user comfort level relating to interruptible loads (φIL) can be expressed as:
φ I L = { 0 U I L = 0 i = 1 T I L ( P I L i Δ t U I L ) 2 U I L 0

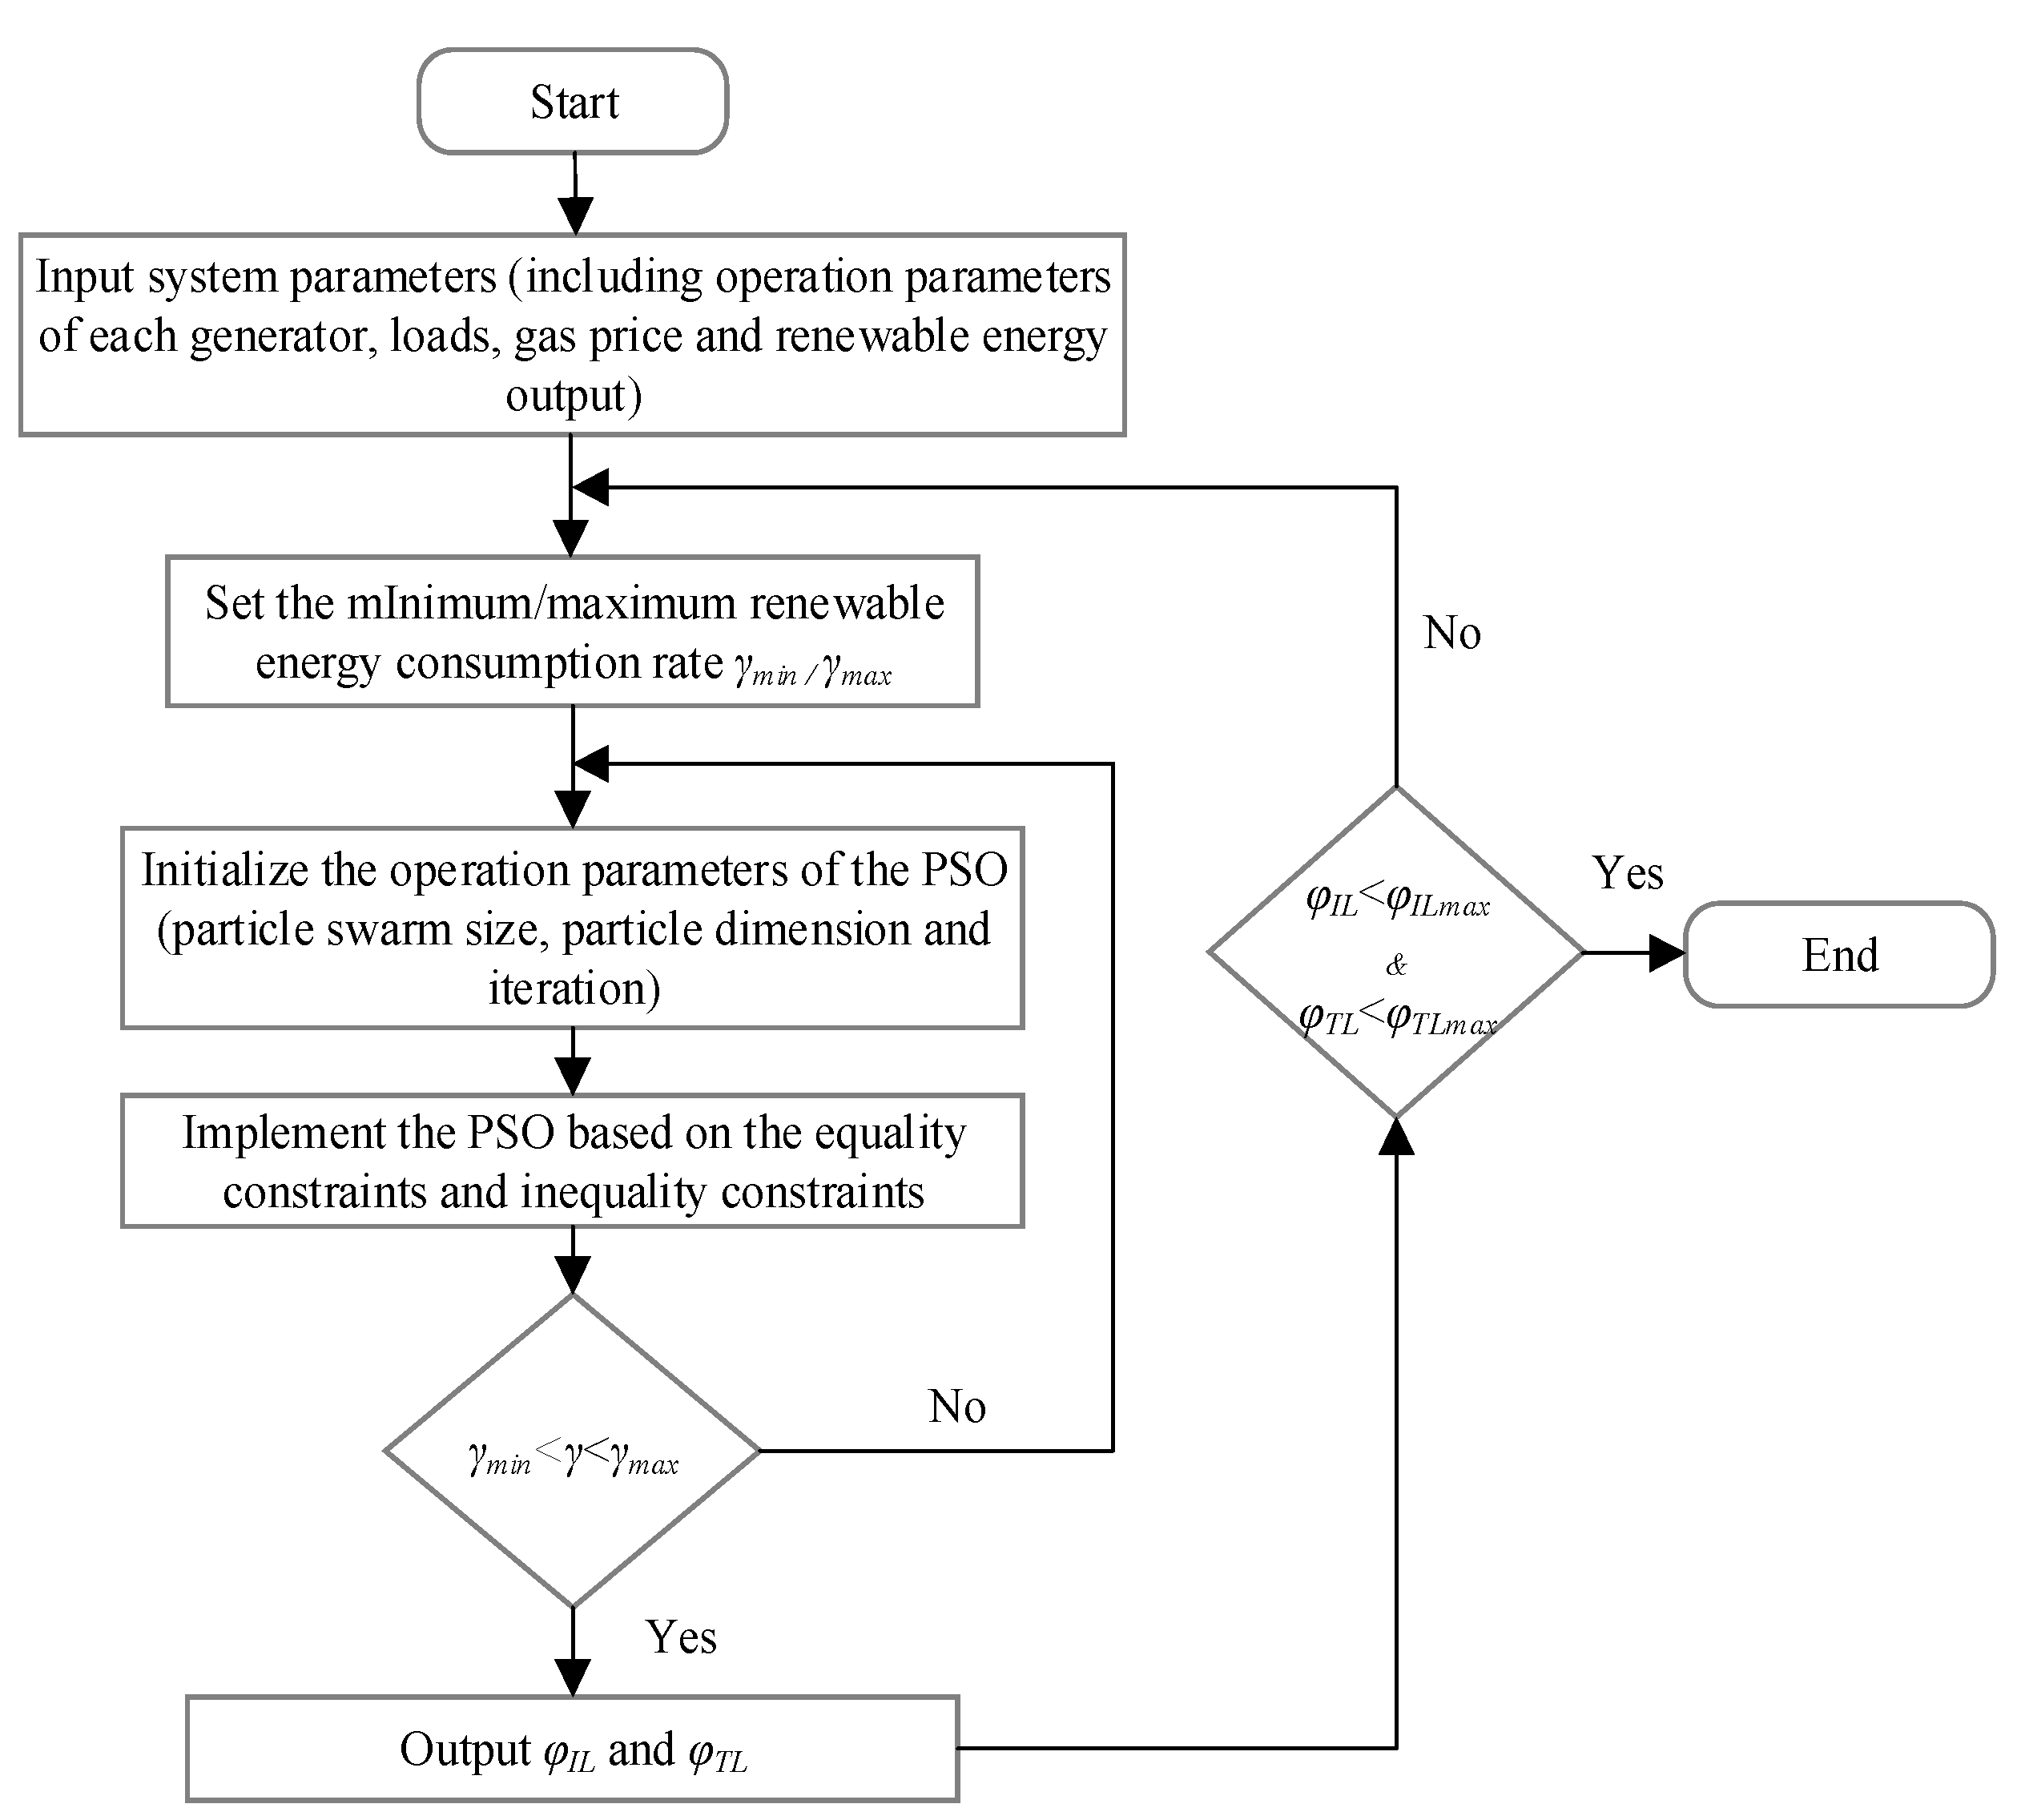
3. System Optimization Strategy

To balance the calculation speed and accuracy of simulation results, this paper takes day-ahead planning to optimize power flow within the smart community. Day-ahead planning focuses on optimizing daily energy costs on the time scale of 24 h.

3.1. Objective Function

This paper selects daily energy costs as the objective to optimize power flow within the smart community. For a smart community, daily energy costs mainly include two parts, which are the costs of renewable generation and fuel cell. Therefore, the objective function can be expressed as:
min C = min t = 1 T i = 1 M C i ( P i ( t ) ) Δ T
The operation costs of a distributed fuel cell generally include fuel costs, maintenance costs and emission penalty costs, which can be listed as follows:
C f c = C f u e l + C o p + y = 1 Y C y e n

3.2. Constraints

  • Power Conservation
To improve the reliability of energy supply and avoid system loss of load, energy generation must be greater than community electrical demands all the time. Moreover, since the distance of power transmission within the community is relatively short, electricity transmission loss is neglected in this paper. Equation 16 shows the constraint of power conservation [30]:
P p v ( t ) + P w ( t ) + P f c ( t ) + P e s ( t ) = P l o a d s ( t )
  • Fuel Cell Operation Constraints
Fuel cell, as a typical fossil generator, is constrained by its rated maximum output power and minimum output power, which can be written as [31]:
P f c min < P f c ( t ) < P f c max
In addition, the operation of a fuel cell is also limited by its ramp rate and can be described as [31]:
- Δ P f c d max < P f c ( t + 1 ) P f c ( t ) < Δ P f c u max
  • Battery Operation Constraints
To maintain battery safety operation, its charging/discharging power needs to be limited within a certain range, which can be written as [29]:
P e s c max < P e s ( t ) < P e s d max
Moreover, the energy storage system SOC needs to be constrained within a certain range to extend the life of battery. Therefore, the inequality constraint of SOC can be expressed as [29]:
S O C e s min < S O C e s ( t ) < S O C e s max
  • User Comfort Level Constraints
Considering the fact that the reduction of interruptible loads and the shift of transferable loads have direct influence on user comfort level, it is necessary to set the threshold of the coefficients of user comfort level relating to the interruptible and transferable loads.
0 < φ I L φ I L max
0 < φ T L φ T L max
  • Renewable Energy Consumption Rate Constraints
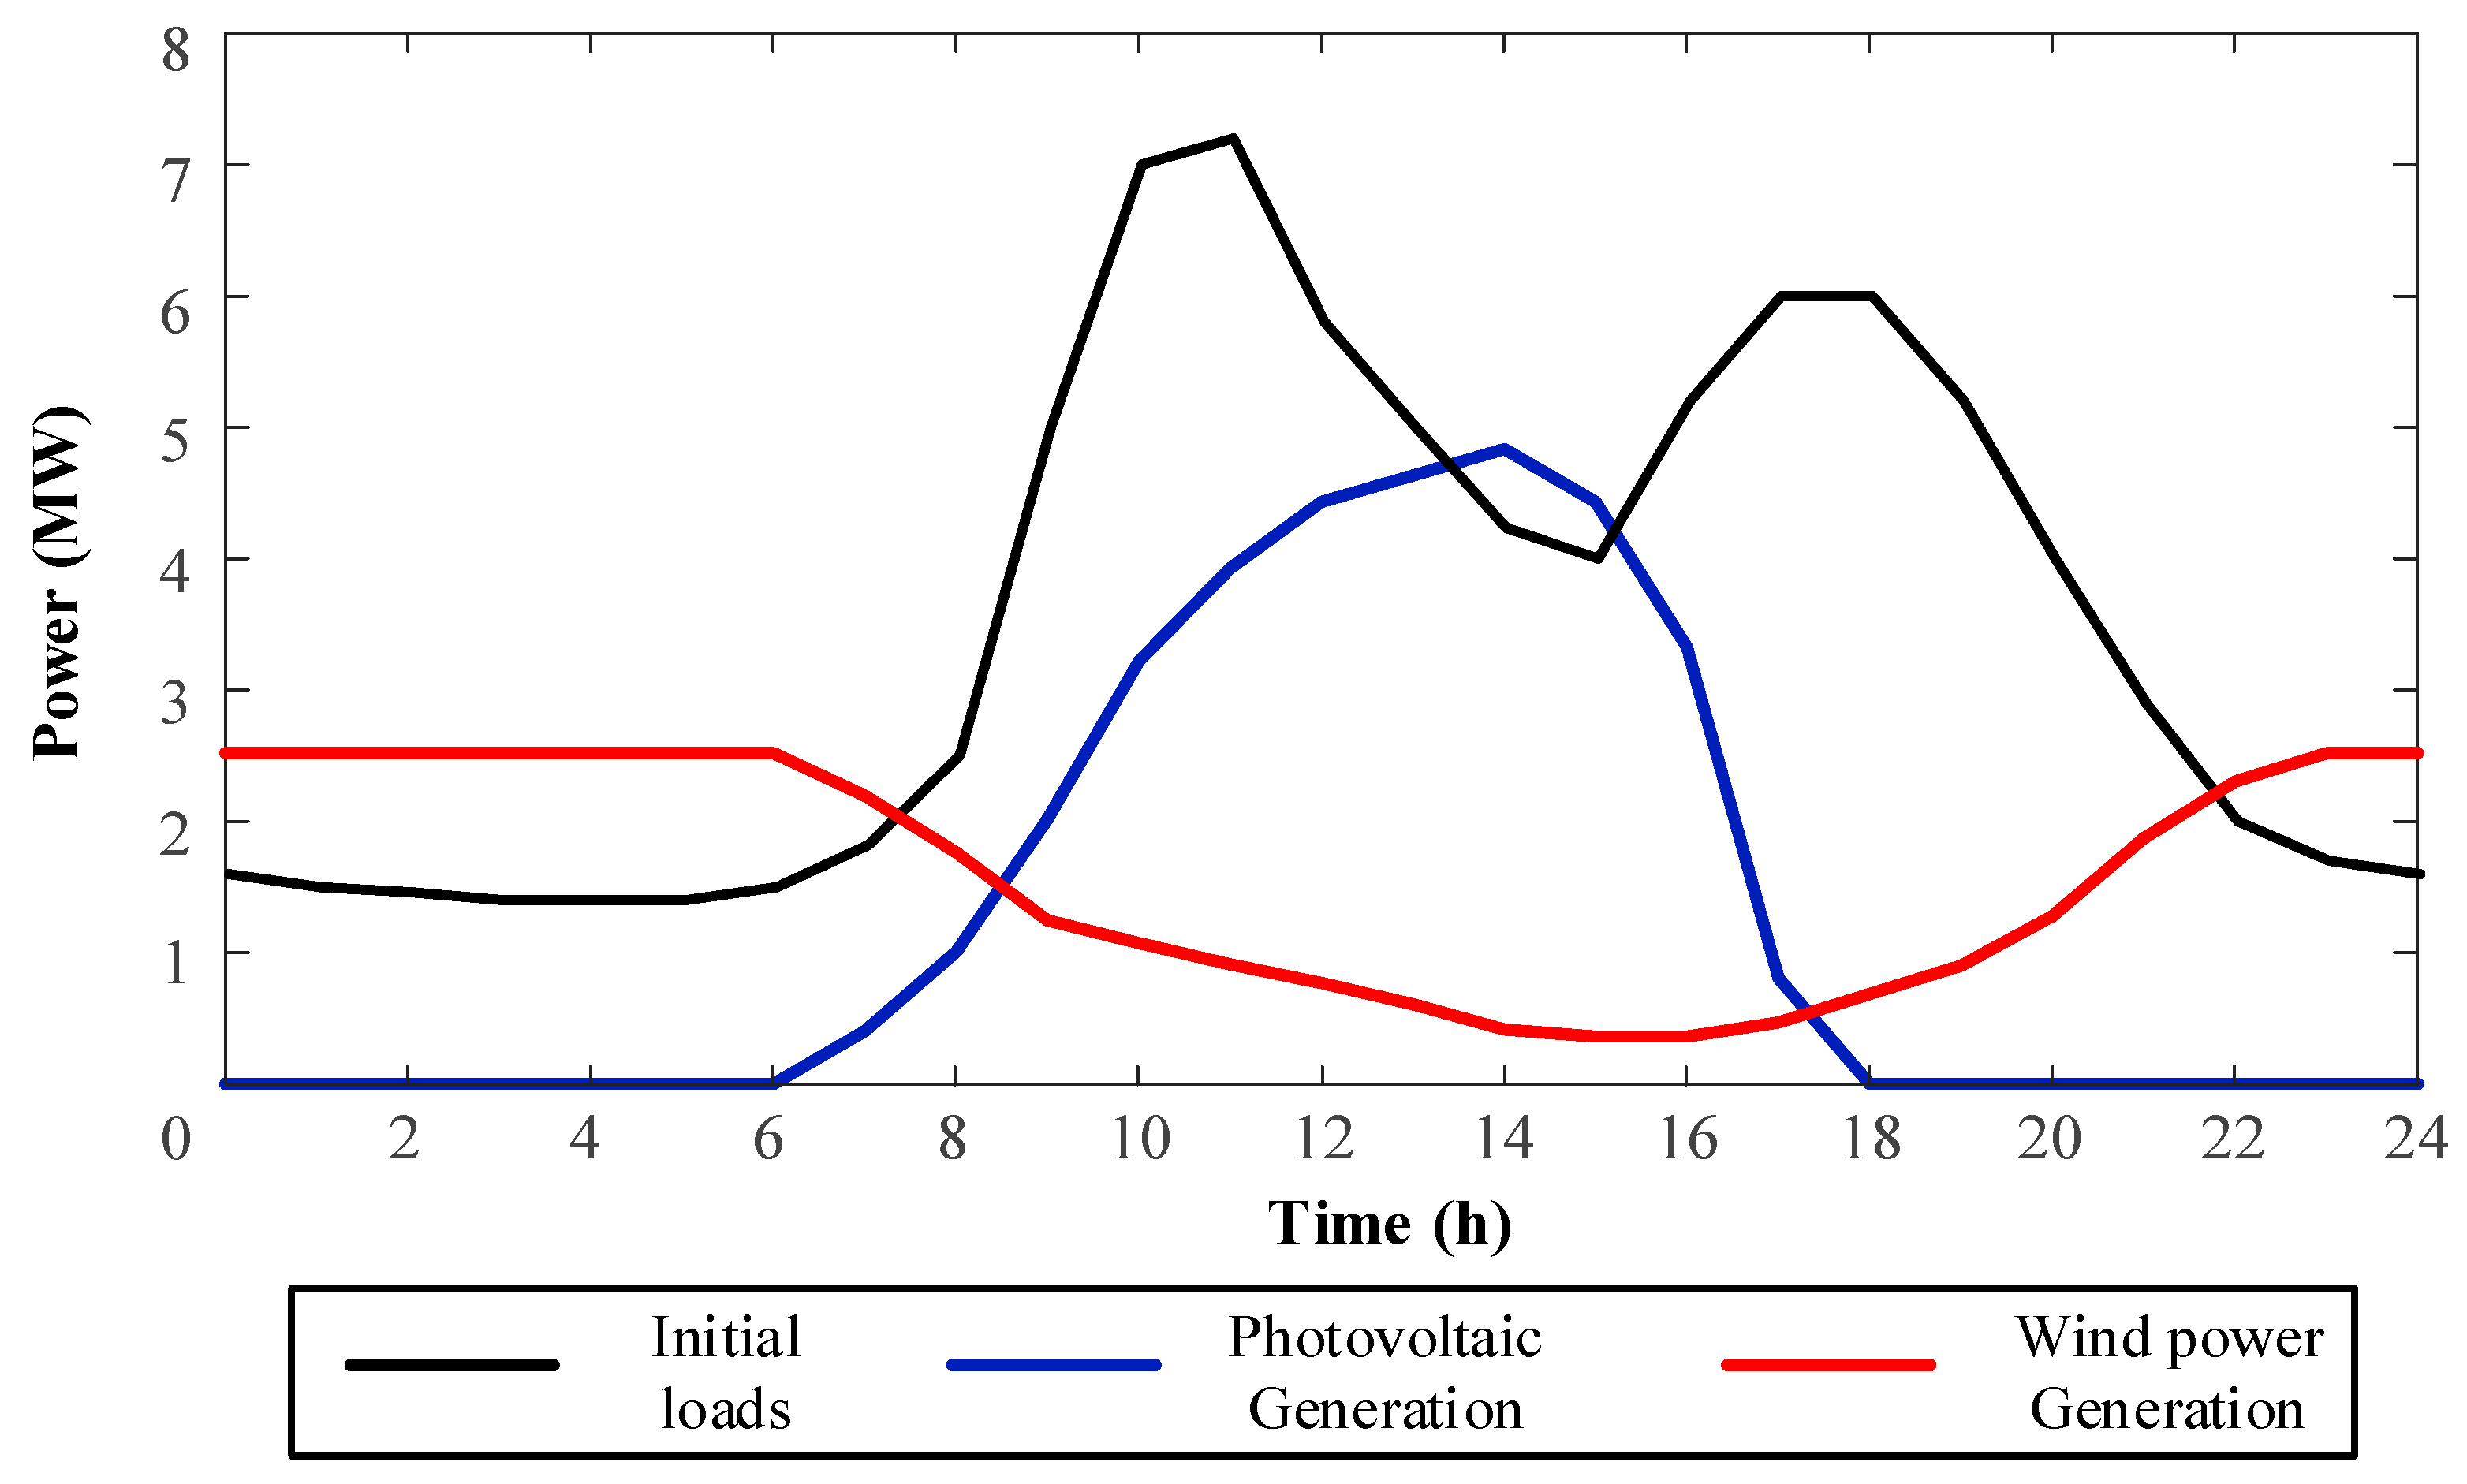
To make full use of renewable energy generator installation capacity and reduce carbon emissions, renewable energy consumption rate needs to be designed.
γ min < γ < γ max
In this paper, the Particle Swam Optimization (PSO) is selected to optimize daily energy costs of the aforementioned smart community under the equality and inequality constraints proposed in this section. Figure 2 shows the flow diagram of the proposed PSO-based optimization model.

4. Case Study

In this paper, a smart community (shown in Figure 1) located in the north of China is selected as an example to verify the proposed operation strategy. In this community, the installation capacity of the distributed photovoltaic generation system is 5 MW, and the rated power of the distributed wind turbine generation system is 2.5 MW. To improve the power consumption rate of renewable generation and avoid system loss of loads, a 3 MWh lead-acid battery is installed as the energy storage system. Meanwhile, the smart community is equipped with a 3 MW fuel cell as a backup power generator and its energy conversion efficiency is 40%. Table 1 shows the rated parameters of the fuel cell and energy storage system. Figure 3 reveals the initial load curve and the output curves of photovoltaic and wind turbine power.
Because of the irregular use of nature gas [32], this paper takes time-of-use gas price to optimize system operation cost. The time-of-use gas price is shown in Table 2. In addition, the costs of photovoltaic and wind turbine power generation are set as 10 and 14 US cents/kWh [33].

5. Results and Analysis

5.1. The Influence of Load-Scheduling on User Comfort Level

To show the influence of load-scheduling on user comfort levels, Figure 4 shows the optimal loads scheduling results under different comfort levels.
By ignoring user comfort level (shown in Figure 4, Case 1), the optimal daily energy cost reduces to $8894.90. In this case, three types of transferable loads are shifted to other time periods and the interruptible loads are largely cut off between 10:00–12:00 and 16:00–19:00. To be specific, the operation time periods of transferable loads are shifted to a high photovoltaic output period or a lower gas price period. For interruptible loads, they are mainly cut off in a period of higher gas price. By reducing interruptible loads and transferable loads during peak gas price time, Case 1 minimizes users’ energy costs. However, this method neglects user comfort levels, which results in a relatively long load-shifting time period for transferable loads and high interruption power for interruptible loads. Simulation results show that φTL and φIL are 28.5 and 0.182, if user comfort levels are ignored.
Case 2 shows the optimization results of load-scheduling with the restriction of user comfort level. In this case, the coefficients of user comfort level relating to the transferable loads and interruptible loads are set as 8.5 and 0.150, respectively. It can be seen from Case 2 that the transferable load TLa shifted its demands from the period of 16:00–19:00 to the period of 13:00–16:00. Compared with Case 1, the length of the load-shifting period reduces from 16 h to 3 h. In addition, the length of the load-shifting periods for TLb and TLc are also shortened to some extent. For interruptible loads, the interruption power is much lower compared with Case 1, but the length of time that needs to cut off loads is extended. Simulation results show that the optimal daily energy cost is $9055.00 in this case, which gives a 1.8% of increase compared with Case 1. However, this optimization method significantly enhances user comfort level and is more practical in engineering applications.
The optimization results of Case 3 and Case 4 are obtained by increasing the coefficients of user comfort level relating to the transferable loads and interruptible loads based on Case 2 (the threshold of φTL in Case 3 are increased to 13 and the threshold of φIL in Case 4 are increased to 0.170). It can be concluded from Figure 4c,d, the length of the load-shifting period is extended in Case 3 compared with Case 2 and the average interruption power in Case 4 is increased compared with Case 2. The results show that the optimal daily energy costs in Case 3 and Case 4 are $8976.70 and $9018.40, which are 0.9% and 0.4% decreases compared with Case 2. Simulation results indicate that the increase of the coefficients of user comfort level can reduce users’ energy costs, which further proves the inverse proportional relationship between user energy costs and the coefficients of comfort levels. It is worth noting that the optimal results of Case 2 and Case 3 are not same in terms of interruptible loads reduction, given that the coefficient of user comfort level relating to interruptible loads stays the same in Case 3. This is because scheduling transferable loads and scheduling interruptible loads are not independent of each other. Similarly, changing the coefficient of user comfort level relating to interruptible loads will also affect the optimization results of transferable loads.

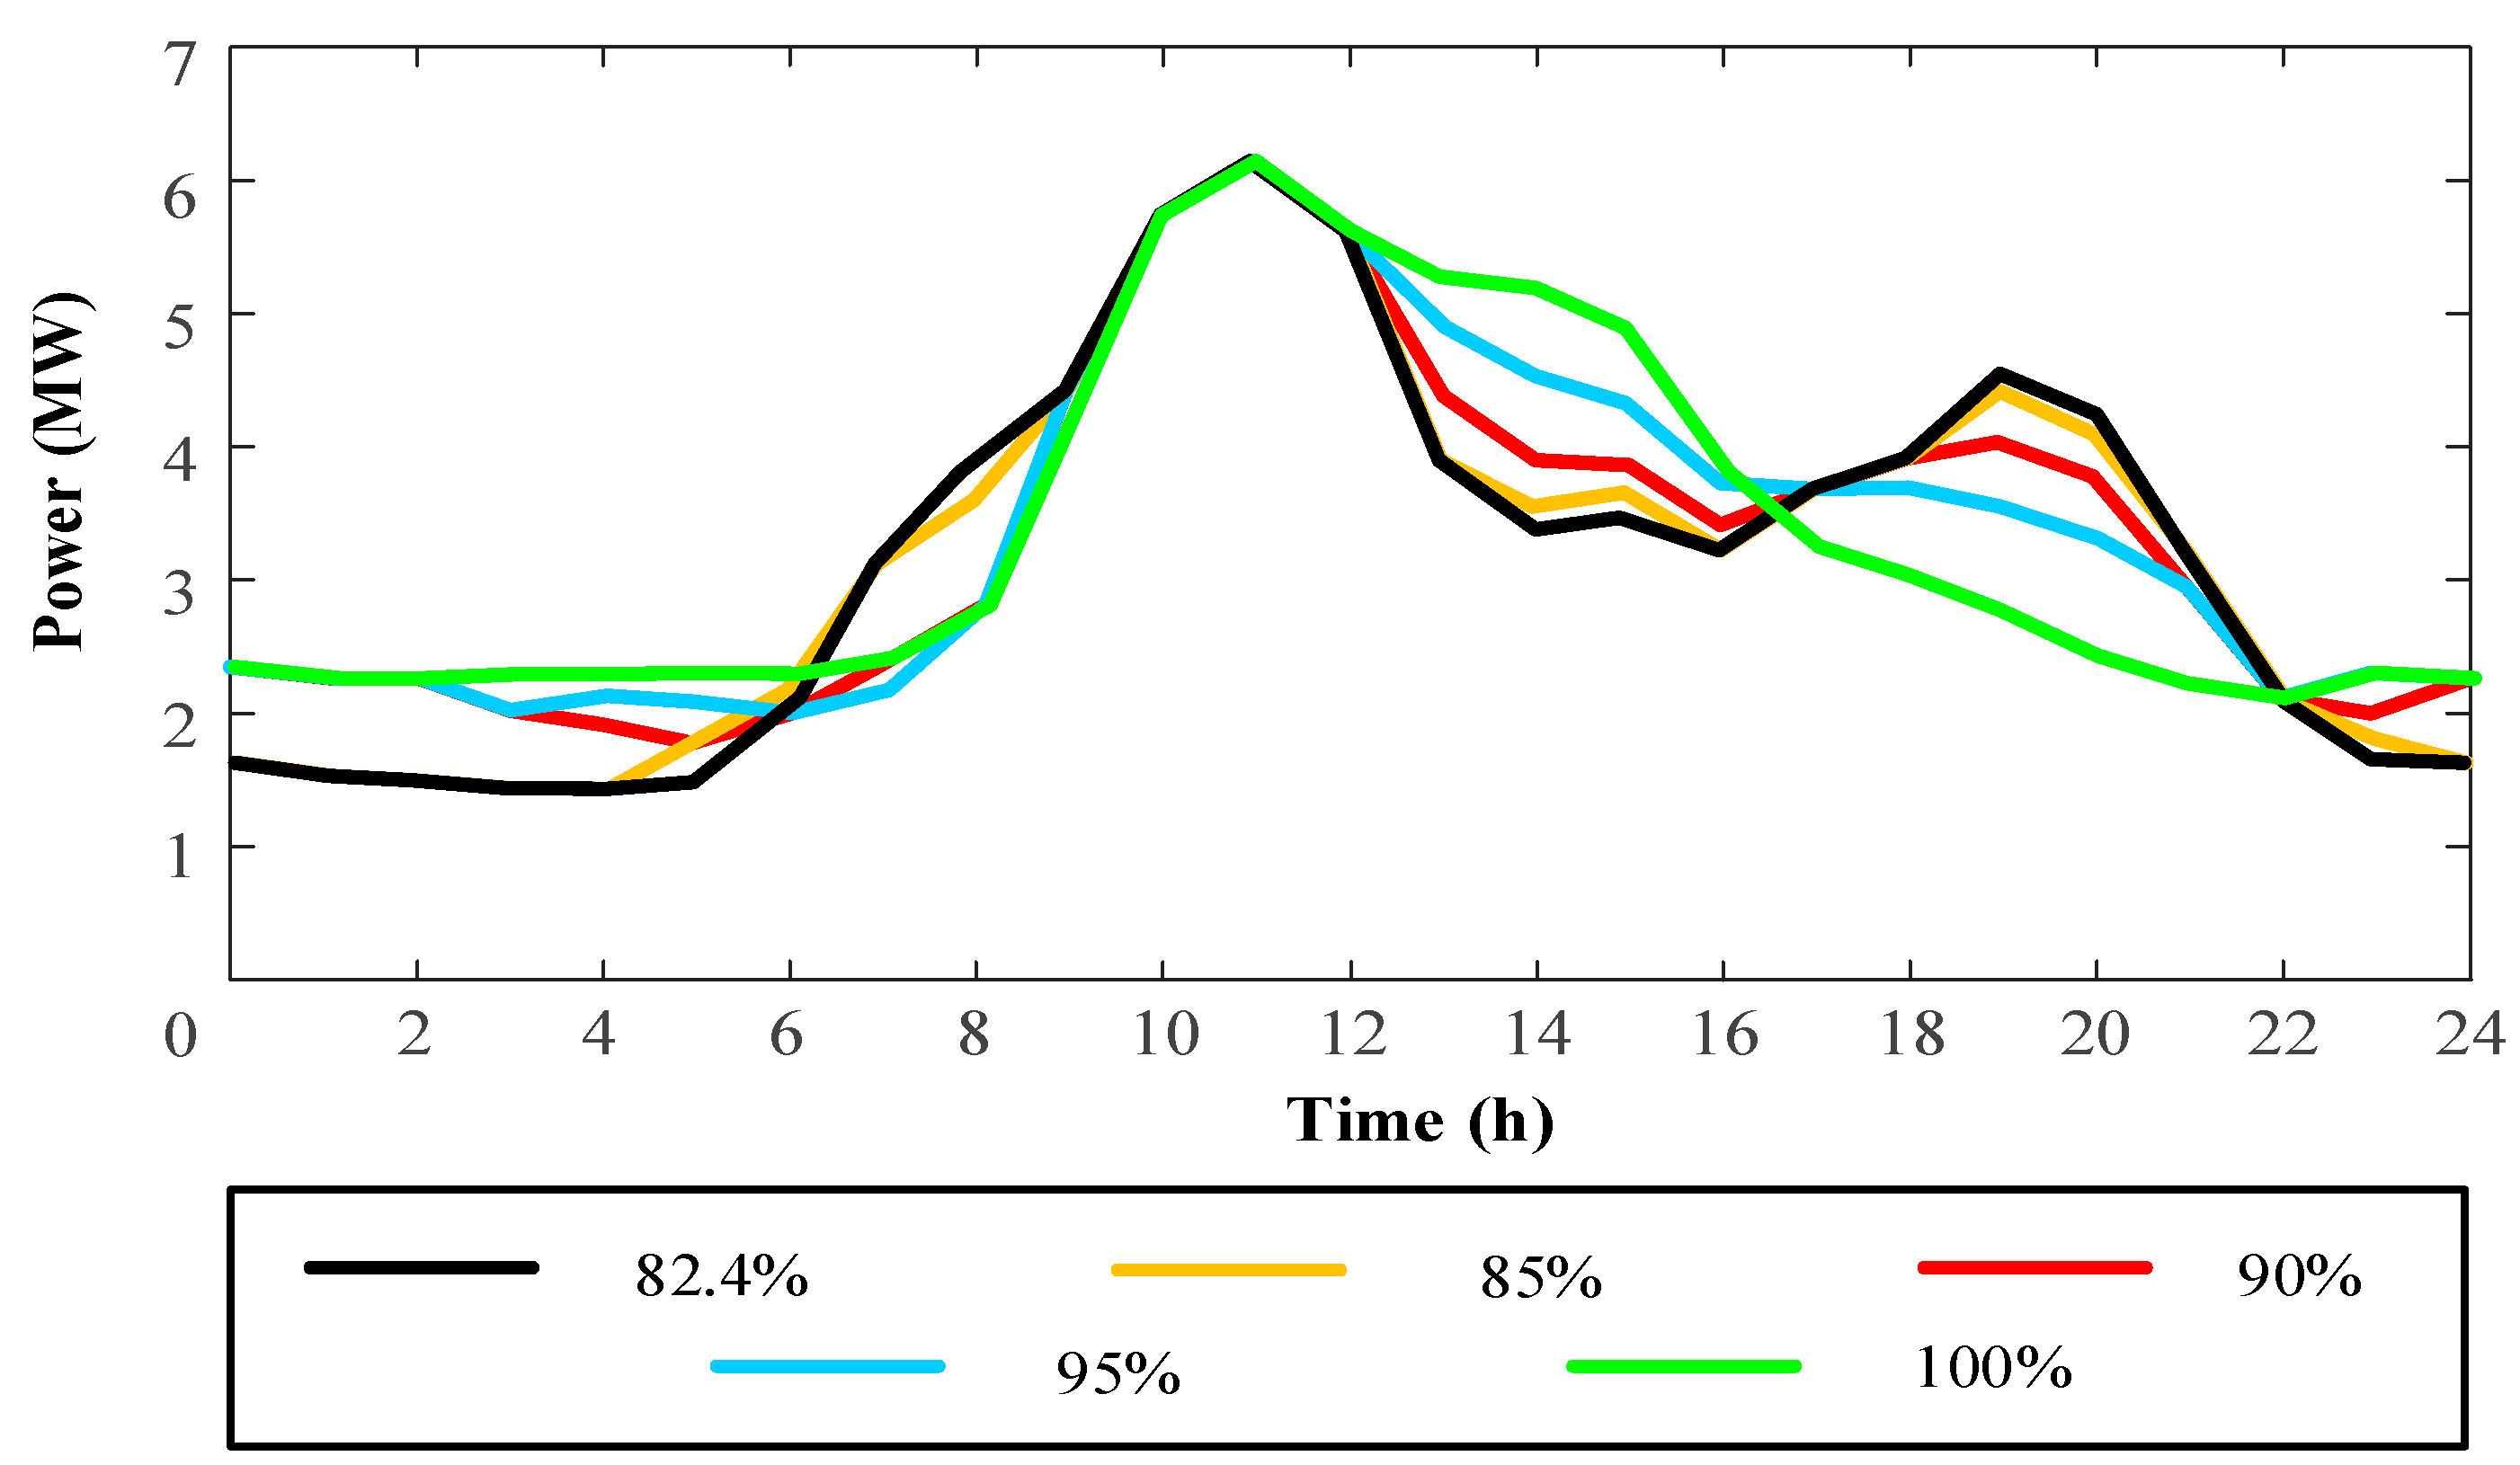
5.2. The Influence of Increasing Renewable Energy Consumption Rate on User Comfort Level

Simulation results show that when only selecting the daily energy costs as the criterion, the renewable energy consumption rate in the aforementioned Case 1 is 82.5%, which is about 7.5% lower than the minimum requirement of the renewable energy consumption rate published by Chinese National Energy Administration. Therefore, to reveal the impact of increasing renewable energy consumption rate on user comfort level, this part presents further research.
Figure 5 shows the optimal daily load curves (including transferable loads, interruptible loads, and important loads) of the proposed community, given that the minimum renewable energy consumption rates are set as 82.5%, 85%, 90%, 95%, and 100%, respectively. It can be seen from Figure 5 that with the increase of the renewable energy consumption rate, the demands increase during the maximum PV output period (13:00–14:00). When the renewable energy consumption rate reaches 100%, the peak demand time period will shift from 18:00–19:00 to 13:00–14:00, exerting a significant impact on user comfort levels.
Table 3 shows the optimization results of the system operating parameters under different renewable energy consumption rates. It can be concluded that when the renewable energy consumption rate increases from 82.5% to 85%, 90%, and 95%, daily energy costs can increase about 0.23%, 0.33%, and 0.74%, respectively. In these situations, user average daily energy costs almost remain the same and user comfort levels will not be strongly affected. However, when the renewable energy consumption rate reaches 100%, daily energy costs increase to $9295.20, which is about 3.16% of increase. In addition, compared with the case of 95% of renewable energy consumption, the coefficients of user comfort level relating to the transferable and interruptible loads increase significantly as well. Simulation results show that the coefficients of user comfort level relating to the transferable loads (φTL) and interruptible loads (φIL) increase from 31.5 and 0.193 to 36.5 and 0.213, respectively. The growth rates of these two parameters are more than 10%, which is mainly caused by the mismatch between renewable energy generation and community demands.
To completely consume renewable energy generated during the period of 13:00–14:00, an excessive number of transferable loads need to be shifted to this period.
To improve the renewable energy consumption rate, one possible solution is to shift loads, or alternatively to store redundant electricity generated by the renewable energy sources in energy storage systems. However, since the loss of energy storage system is relatively high (20%), inappropriate use of energy storage can lead to the decrease of battery lifetime and the increase of daily energy costs. As can be seen from Table 3, the operation range of battery SOC in a day does not change significantly during the process of increasing the renewable energy consumption rate from 82.5% to 95%. In this process, the maximum SOC of battery decreases from 88.7% to 85.9%, which is 3.2 percent of reduction. However, when the renewable energy consumption rate increases to 100%, the operation range of battery SOC decreases to 20%–80.2%. In this situation, the maximum SOC of battery reduces by 9.6%. In addition, it can be concluded from Table 3 that when the renewable energy consumption rate is lower than 95%, total energy interaction between the energy storage system and the smart community is almost the same. While, when the renewable energy consumption rate increases from 95% to 100%, total daily energy interaction between the energy storage system and the smart community increases rapidly, which is about 21.5% increase. This indicates that when fully consume renewable energy, 0.19 MWh extra electricity will be generated to compensate the loss of energy storage system compared to the case of 95% of renewable energy consumption. Therefore, fully consuming renewable energy will lead to the decrease of battery lifetime and the increase of users’ daily energy costs.

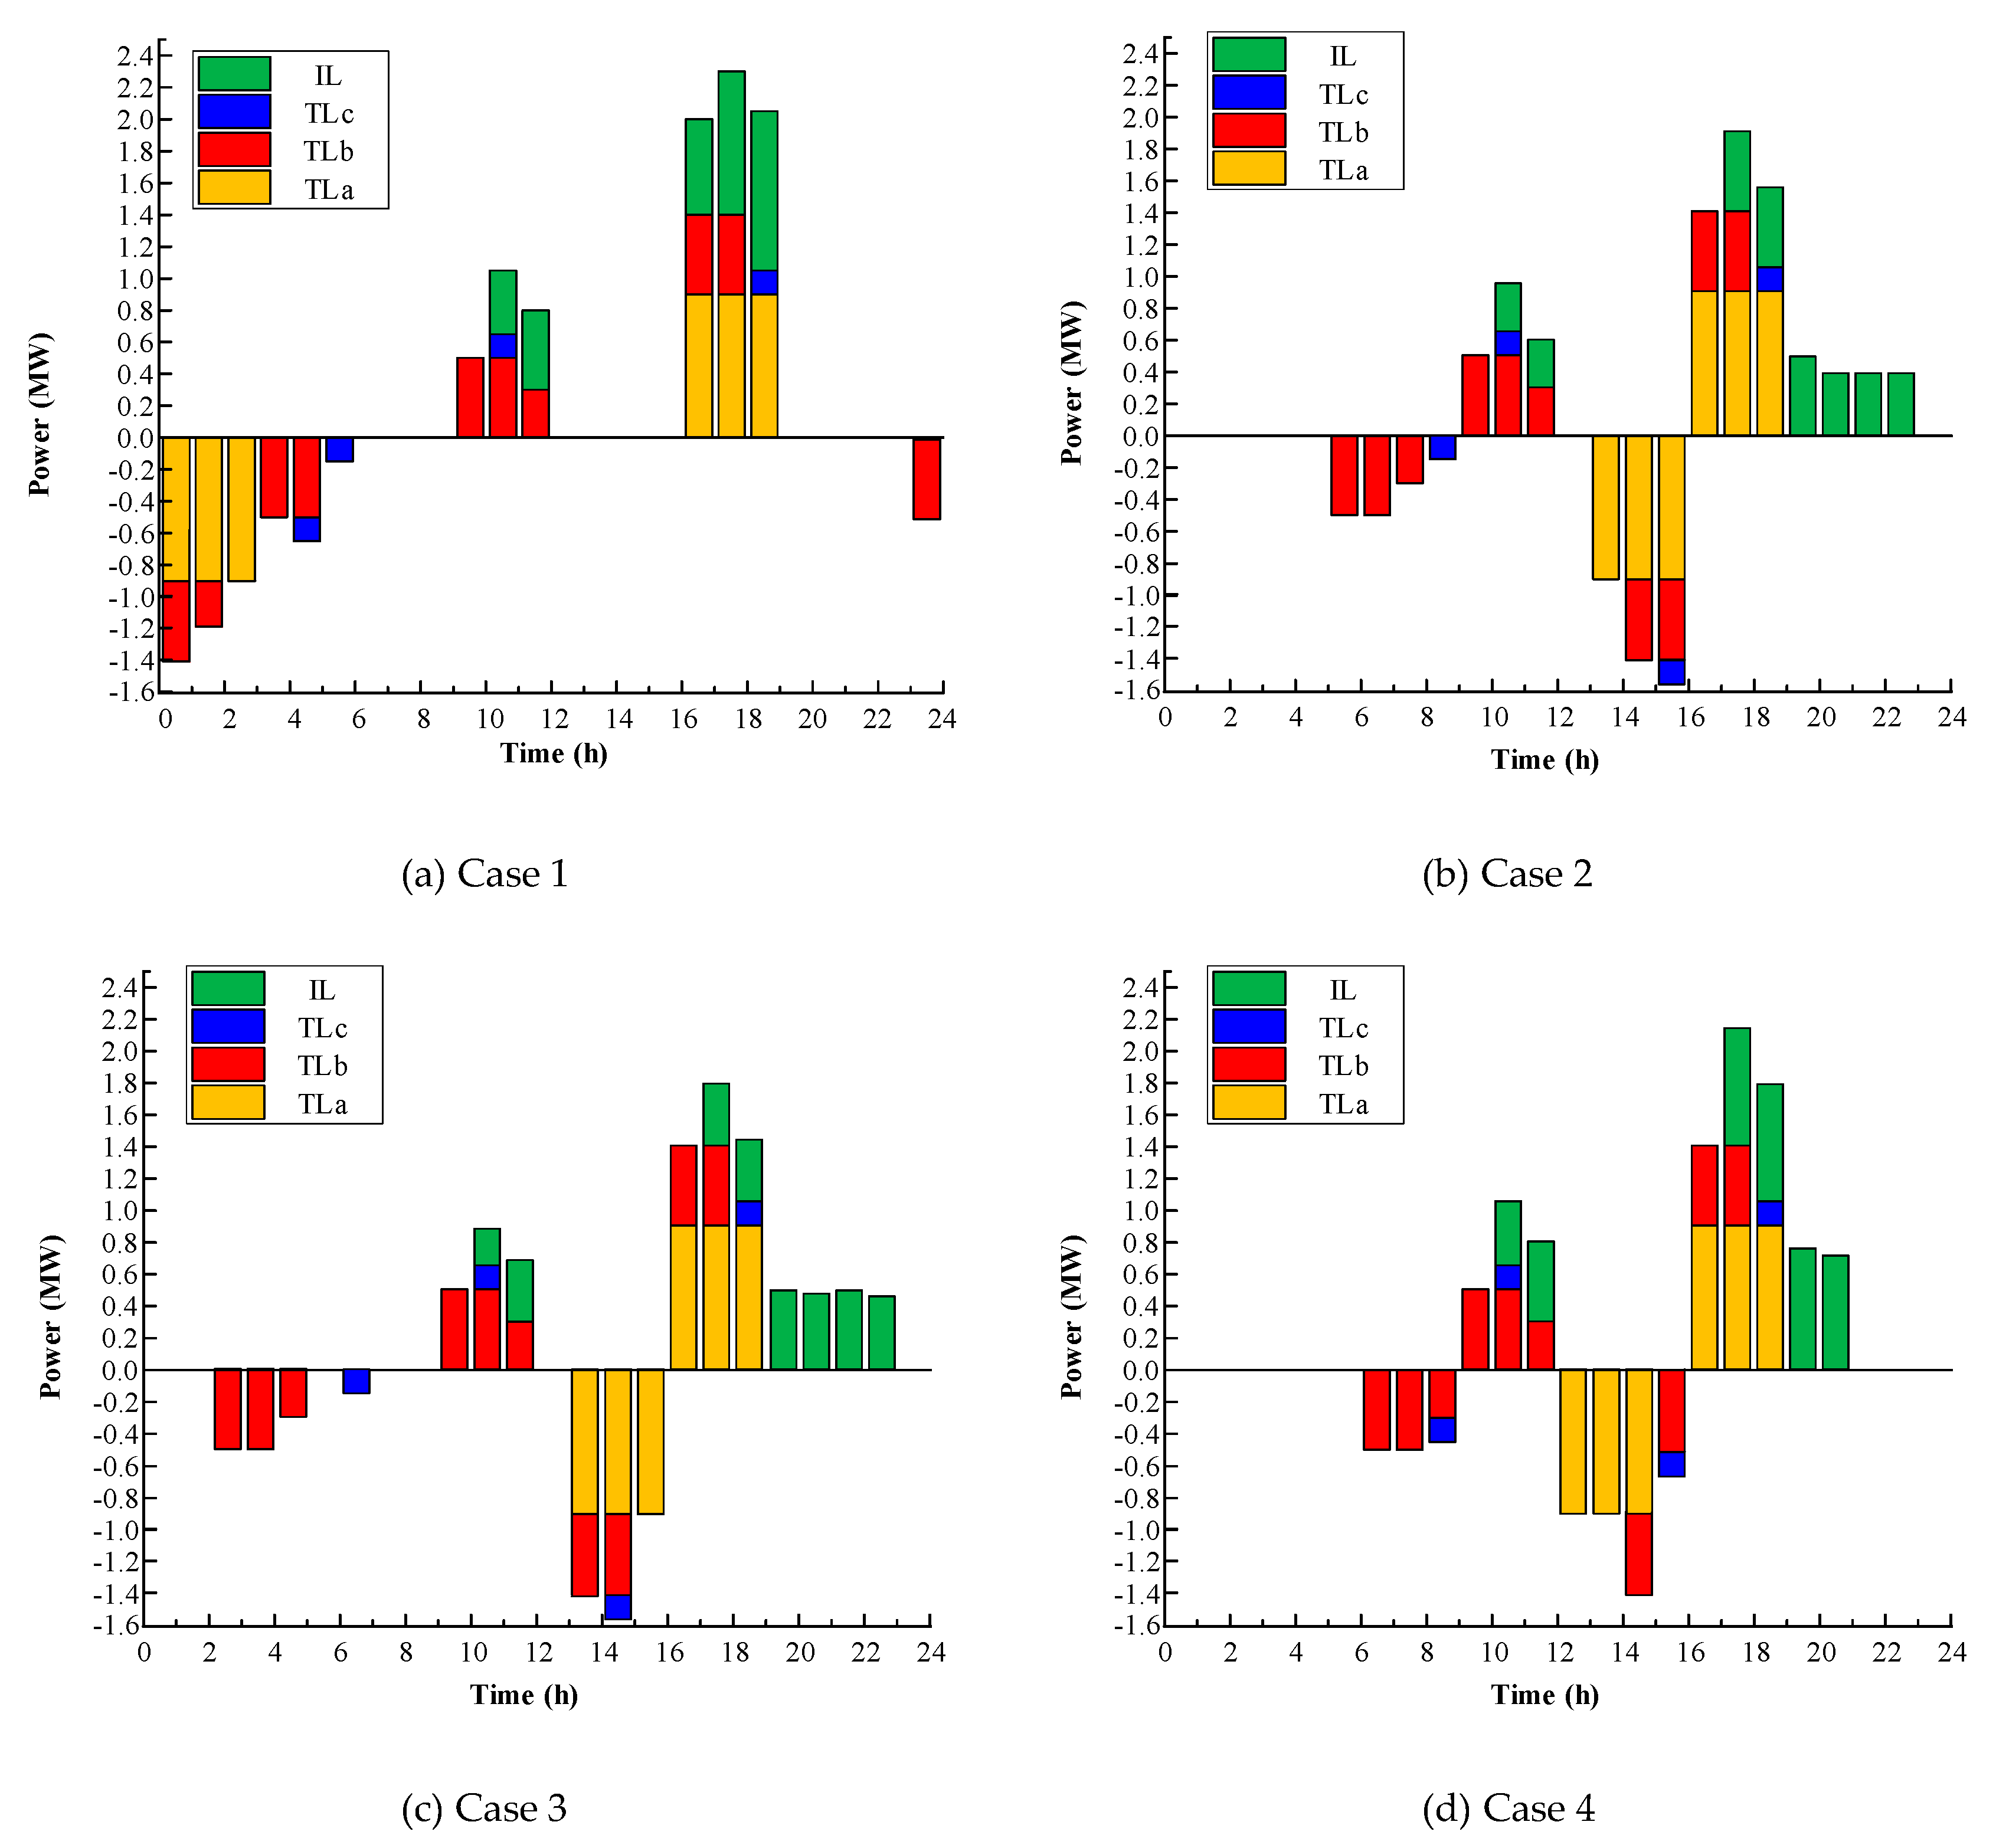
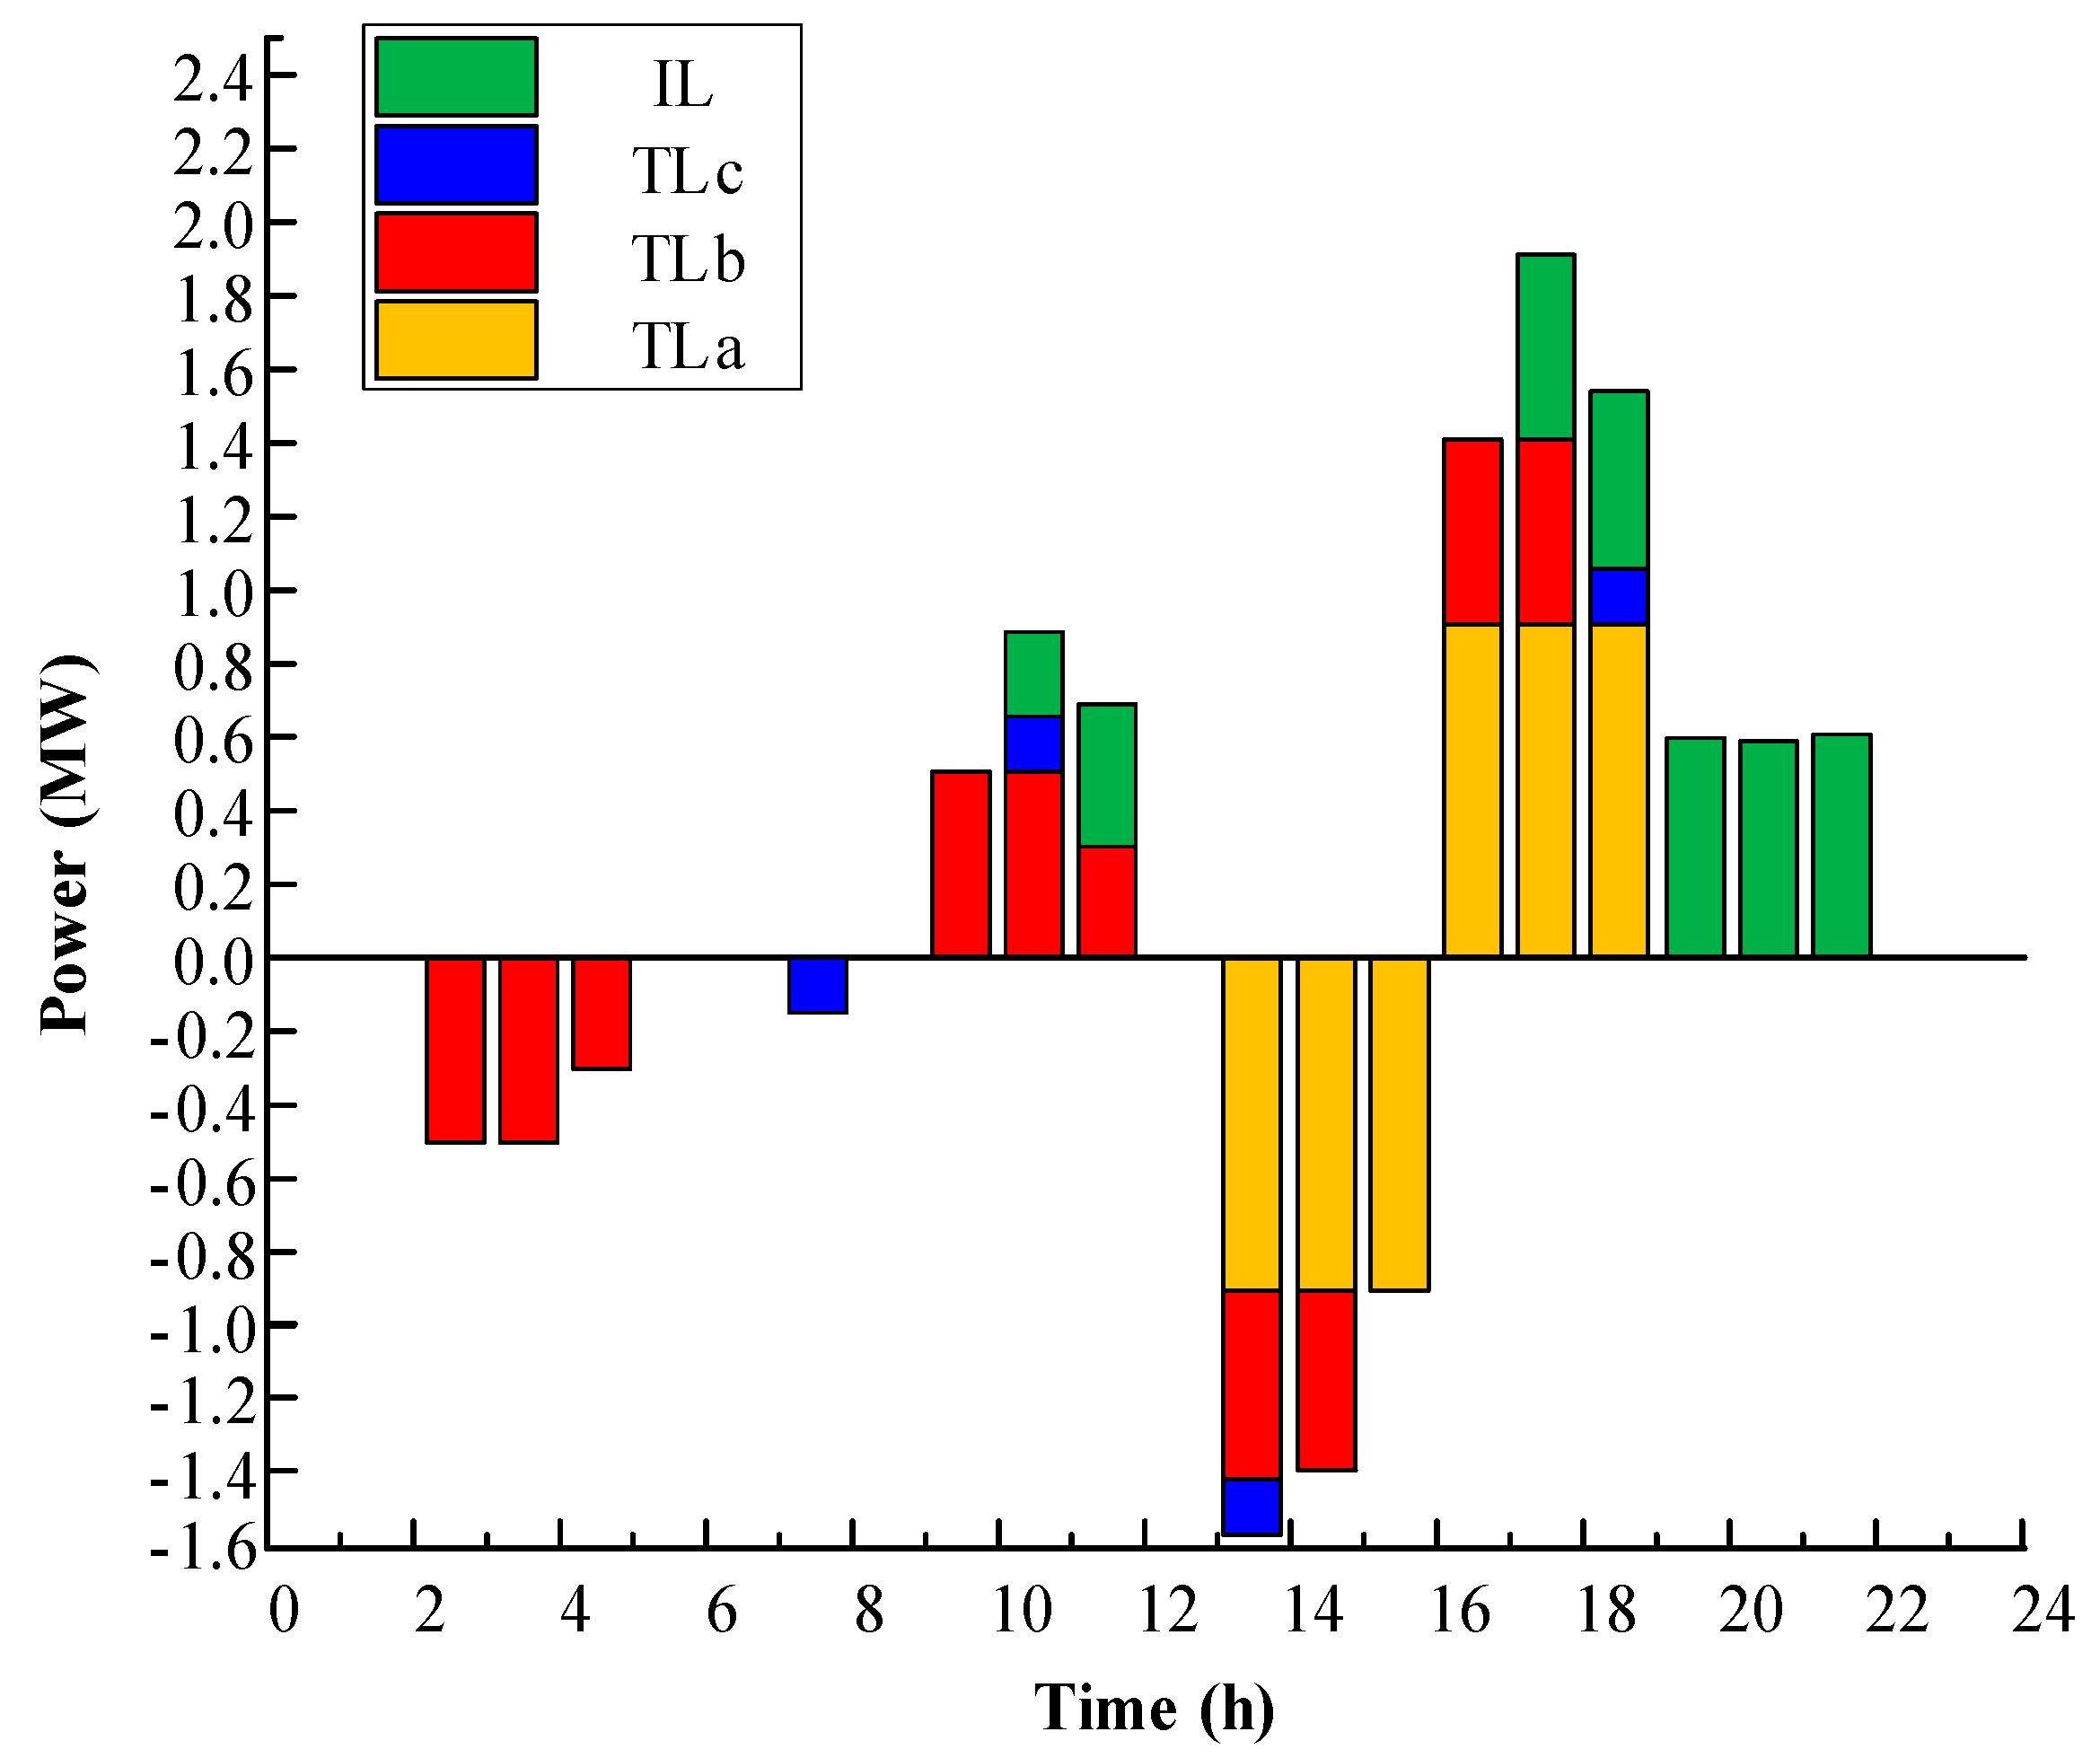
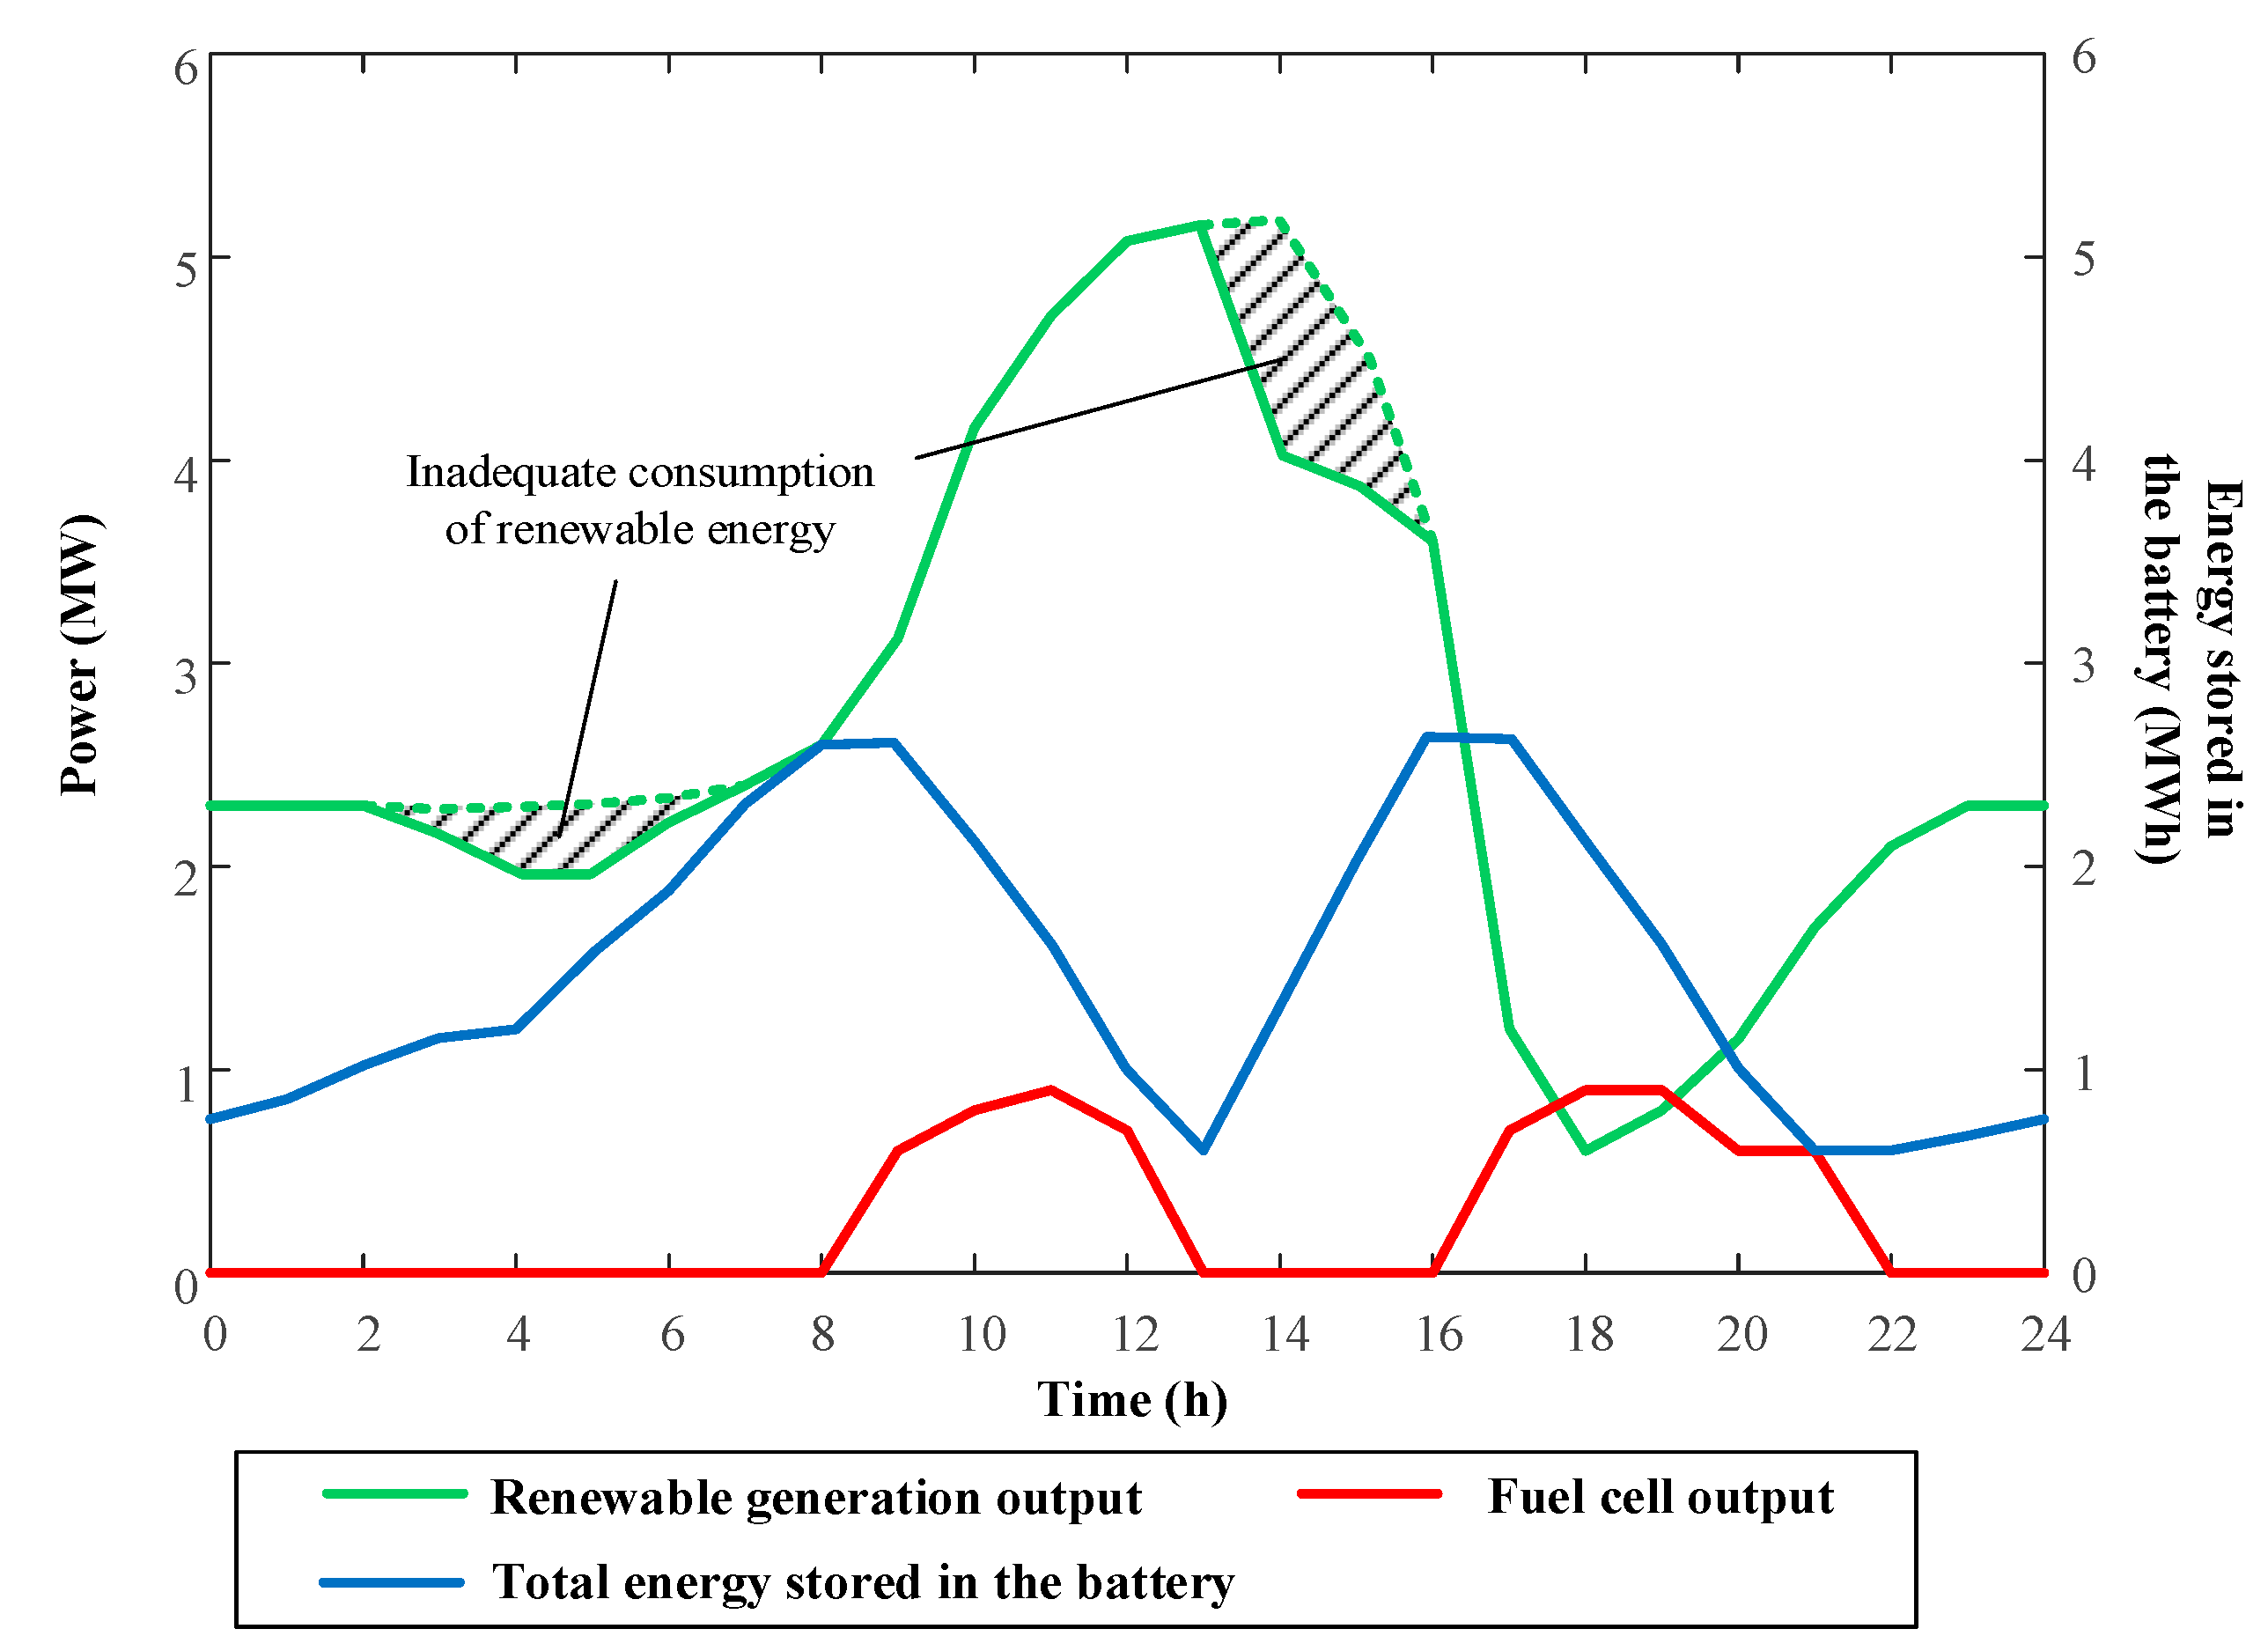
5.3. Optimal Load-Scheduling Results with Considering Comfort Level and Renewable Consummation Rate

To avoid the serious impacts of load-scheduling on user comfort levels and avoid the reduction of renewable energy consumption rate caused by large-scale installation of renewable energy sources, this part demonstrates system optimal operation results under the conditions of φTL < 15, φIL < 0.17 and 90% < γ < 95%. Figure 6 shows the optimal scheduling results of transferable loads and interruptible loads under the aforementioned constraints.
It can be concluded from Figure 6 that compared with the optimization results of Figure 4a (only considering energy costs), the demands of transferable loads, shown in this part, increase about 2.93 MWh during the period of low renewable energy consumption rate (2:00–7:00 and 13:00–16:00). In addition, during the period of the maximum renewable generation (13:00–14:00), the demands of transferable loads are the highest, which are 1.54 MWh. In this situation, the coefficients of user comfort level relating to transferable loads and interruptible loads are 14.8 and 0.165, which is 48.1% and 9.3% reduction compared with results of Figure 4a. Figure 7 shows the output power of all generators and the operation states of the energy storage system taking user comfort levels and renewable energy accommodation rate into account.
As can be seen from Figure 7, the fuel cell, working as a backup power source, generates 6.79 MWh electricity during the periods of 8:00–13:00 and 16:00–22:00, which accounts for 8.2% of the total electrical demands. In addition, the energy storage system has two complete charge/discharge cycles in a day and the operation range of battery of SOC is between 20% and 86.8%. To be specific, the SOC of energy storage system starts at 25%, and reaches its maximum value of 86.8% from 16:00–17:00. Moreover, from 2:00–7:00 and 13:00–16:00 (shadows in Figure 7), renewable energy generation is not sufficiently consumed by the smart community. Optimization results shows that the optimal daily energy costs of the community are $9023.10 when the renewable energy consumption rate reaches 91%. Compared to Case 1 of Section 5.1, the renewable energy generation rate increases by 10.3%, with only a small cost of 1.4% of energy costs increase. It should be noted that the energy storage system is in charging state when the renewable energy consumption is insufficient, because the loads are less than the renewable power generation in these periods. To ensure that more than 90% of the renewable generation is consumed by community, it is necessary to make full use of the energy storage system to store redundant electricity.

6. Conclusions

To further improve the renewable energy consumption rate and save energy costs in smart communities, this paper proposes a novel load-scheduling method for optimizing a smart community’s daily energy costs while taking user comfort level and the renewable energy consumption rate into consideration. Then, by implementing the PSO algorithm, the proposed strategy schedules the transferable loads and interruptible loads, optimizes the output of each renewable generator and controls the state of energy storage system. Finally, a case study is developed to validate the effects of improving user comfort levels and the renewable energy consumption rate on daily energy costs. Meanwhile, mathematical optimization results are analyzed in detail. Three main findings of this paper can be concluded as follows:
(1) To reduce daily energy costs in a smart community, it must increase the coefficients of user comfort level relating to transferable loads and interruptible loads, and this will lead to a decrease in user comfort. Therefore, it is important to consider user comfort level when scheduling loads.
(2) Compared with the case of 95% of renewable energy consumption, fully consuming renewable energy can increase daily energy costs, the coefficient of user comfort level relating to transferable loads, and the coefficient of user comfort level relating to interruptible loads by as much as 3.16%, 15.9%, and 10.4%, respectively. This proves that the excessive increase of renewable energy consumption rate will result in the increase of electricity cost and the decrease of user comfort.
(3) For the given constraints of renewable energy consumption rate and user comfort levels, a smart community can acquire minimum operation costs if the system renewable energy consumption rate, the coefficient of user comfort level relating to transferable loads, and the coefficient of user comfort level relating to interruptible loads are 91%, 14.8%, and 0.165%, respectively. In this case, user comfort level and renewable energy consumption rate increase significantly while the community’s daily energy costs only increase by 1.4%.

Author Contributions

Conceptualization, Y.S.; Methodology, M.D.; Validation, F.G.; Formal Analysis, D.L.; Writing-Original Draft Preparation, Y.S.; Writing-Review & Editing, T.G.; Funding Acquisition, K.S.

Funding

This research was funded by the project of “research and validation on multi-user energy supply and demand interactive simulation model in smart community” of CEPRI, grant number “YD83-18-002”.

Conflicts of Interest

The authors declare no conflict of interest.

Nomenclature

NomenclatureMeaningNomenclatureMeaning
PpvActual output power of PV generationPSTCMaximum output power under the standard test condition
GsActual solar radiation intensityGSTCSolar radiation intensity under the standard test condition
kA coefficient of temperatureTcCell temperature
T0Reference ambient temperaturePwActual output power of a wind turbine system
P0Rated power of a wind turbine systemvciCut-in speed of a wind turbine system
vrRated wind speed of a wind turbine systemvcoCut-out speed of a wind turbine system
vActual wind speed of a wind turbine systema, bPower coefficients of a wind turbine system
PfcOutput power of a fuel cell generatorPfcinInput power of a fuel cell generator
ηfcPower generation efficiency of a fuel cell generatorSOCes (t)Energy storage system state of charge at time t
δSelf-discharge efficiency of an energy storage systemPes (t)Charging/discharging power of an energy storage system at time t
ηes (t)Energy storage system charging/discharging efficiency at time t△tTime interval
EesInstallation capacity of an energy storage systemHTLN (t)Net transferable loads at time t
HTLC (t)Original transferable loads at time period tHTLI (t)Transferable loads shifted into current time period t
HTLO (t)Transferable loads shifted out to next period at time tNTotal number of transferable loads
PTLCi (t)The ith transferable load’s original electrical demands at time tJTotal number of transferable loads shifted into current time t
PTLIm (t)The mth transferable load’s power shifted into current time tKTotal number of loads shifted out to next period at time t
PTLOn (t)The nth transferable load’s power shifted out to next period at time tHIL (t)Total electrical loads need to be cut off at time t
△Pr_d (t)Difference between predicted and actual renewable power generation at time tfsr_u (t)System up spinning reserve capacity
φTLCoefficient of user comfort level relating to the transferable loadstsActual start time of the transferable loads
tαExpected start timetβExpected end time
φILCoefficient of user comfort level relating to the interruptible loadsTILNumber of time periods existing interruption loads
PILiActual interruption power in the ith time periodUILTotal amount of actual interruption energy
CDaily energy costs of a smart communityTTotal number of time period
MNumber of distributed power generatorsCiEnergy costs of the ith renewable generation
Pi (t)Output power of the ith renewable generator at time t△TScheduling time period
CfcEnergy costs of a fuel cell generatorCfuelFuel costs
CopMaintenance costsYTotal types of pollutant
CyenPenalty costs of the yth pollutantPpv (t)Actual output power of PV generation at time t
Pw (t)Actual output power of a wind turbine system at time tPfc (t)Actual output power of a fuel cell generator at time t
Ploads (t)Total amount of loads of a smart community at time tPfcminMinimum output power of a fuel cell generator
PfcmaxMaximum output power of a fuel cell generator△PfcdmaxMaximum fuel cell down ramp rate
△PfcumaxMaximum fuel cell up ramp ratePescmaxMaximum charging power of an energy storage system
PesdmaxMaximum discharging power of an energy storage systemSOCesminLower limit of energy storage SOC
SOCesmaxUpper limit of energy storage SOCφILmaxMaximum coefficient of user comfort level relating to the interruptible loads
φTLmaxMaximum coefficient of user comfort level relating to the transferable loadsγRenewable energy consumption rate
γminMinimum renewable energy consumption rateγmaxMaximum renewable energy consumption rate

References

  1. Li, X.; Lu, R.; Liang, X.; Shen, X.; Chen, J.; Lin, X. Smart community: An internet of things application. IEEE Commun. Mag. 2011, 49, 68–75. [Google Scholar] [CrossRef]
  2. China Industrial Research Network. 2018 Development Investigation and Development Trend Analysis Report of China Smart Community. Available online: https://www.cir.cn/R_ITTongXun/25/ZhiHuiYuanQuDeXianZhuangHeFaZhanQuShi.html (accessed on 26 January 2019).
  3. Dewit, A. Chapter 21—Japanese Smart Communities as Industrial Policy. In Sustainable Cities & Communities Design Handbook; Elsevier: Amsterdam, The Netherlands, 2018. [Google Scholar]
  4. Smart and Connected Communities Framework 2015. Available online: https://www.nitrd.gov/sccc/materials/scccframework.pdf (accessed on 26 January 2019).
  5. Liang, Y.; Yu, B.; Wang, L. Costs and benefits of renewable energy development in China’s power industry. Renew. Energy 2019, 131, 700–712. [Google Scholar] [CrossRef]
  6. Sullivan, J.L.; Lewis, G.M.; Keoleian, G.A. Effect of mass on multimodal fuel consumption in moving people and freight in the U.S. Transp. Res. Part D Transp. Environ. 2018, 63, 786–808. [Google Scholar] [CrossRef]
  7. Khuong, P.M.; McKenna, R.; Fichtner, W. Analyzing drivers of renewable energy development in Southeast Asia countries with correlation and decomposition methods. J. Clean. Prod. 2019, 213, 710–722. [Google Scholar] [CrossRef]
  8. Zhong, S.; Niu, S.; Wang, Y. Research on Potential Evaluation and Sustainable Development of Rural Biomass Energy in Gansu Province of China. Sustainability 2018, 10, 3800. [Google Scholar] [CrossRef]
  9. Liu, Y.; Hu, S. Renewable Energy Pricing Driven Scheduling in Distributed Smart Community Systems. IEEE Trans. Parallel Distrib. Syst. 2017, 28, 1445–1456. [Google Scholar] [CrossRef]
  10. Huang, Z. Evaluating intelligent residential communities using multi-strategic weighting method in China. Energy Build. 2014, 69, 144–153. [Google Scholar] [CrossRef]
  11. Barone, G.; Brusco, G.; Burgio, A.; Menniti, D.; Pinnarelli, A.; Motta, M.; Sorrentino, N.; Vizza, P. A Real-Life Application of a Smart User Network. Energies 2018, 11, 3504. [Google Scholar] [CrossRef]
  12. Mohsenian-Rad, A.H.; Leon-Garcia, A. Optimal Residential Load Control with Price Prediction in Real-Time Electricity Pricing Environments. IEEE Trans. Smart Grid 2010, 1, 120–133. [Google Scholar] [CrossRef]
  13. Chavali, P.; Yang, P.; Nehorai, A. A Distributed Algorithm of Appliance Scheduling for Home Energy Management System. IEEE Trans. Smart Grid 2014, 5, 282–290. [Google Scholar] [CrossRef]
  14. Nguyen, D.T.; Le, L.B. Joint Optimization of Electric Vehicle and Home Energy Scheduling Considering User Comfort Preference. IEEE Trans. Smart Grid 2014, 5, 188–199. [Google Scholar] [CrossRef]
  15. Zhang, H.; Zhang, Q.; Gong, T.; Sun, H.; Su, X. Peak Load Regulation and Cost Optimization for Microgrids by Installing a Heat Storage Tank and a Portable Energy System. Appl. Sci. 2018, 8, 567. [Google Scholar] [CrossRef]
  16. Wu, X.; Liang, K.; Han, X. Renewable Energy Output Tracking Control Algorithm Based on the Temperature Control Load State-Queuing Model. Appl. Sci. 2018, 8, 1099. [Google Scholar] [CrossRef]
  17. Talavera, D.L.; Muñoz-Rodriguez, F.J.; Jimenez-Castillo, G.; Rus-Casas, C. A new approach to sizing the photovoltaic generator in self-consumption systems based on cost–competitiveness, maximizing direct self-consumption. Renew. Energy 2018, 130, 1021–1035. [Google Scholar] [CrossRef]
  18. Yang, J.; Zhang, W.; Zhang, Z. Impacts of urbanization on renewable energy consumption in China. J. Clean. Prod. 2015, 114, 443–451. [Google Scholar] [CrossRef]
  19. Materassi, D.; Bolognani, S.; Roozbehani, M.; Dahleh, M.A. Optimal Consumption Policies for Power-Constrained Flexible Loads Under Dynamic Pricing. IEEE Trans. Smart Grid 2015, 6, 1884–1892. [Google Scholar] [CrossRef]
  20. Xu, Z.; Callaway, D.S.; Hu, Z.; Song, Y. Hierarchical Coordination of Heterogeneous Flexible Loads. IEEE Trans. Power Syst. 2016, 31, 4206–4216. [Google Scholar] [CrossRef]
  21. Yu, D.; Liu, H.; Bresser, C. Peak load management based on hybrid power generation and demand response. Energy 2018, 163, 969–985. [Google Scholar] [CrossRef]
  22. Nojavan, S.; Ghesmati, H.; Zare, K. Robust optimal offering strategy of large consumer using IGDT considering demand response programs. Electr. Power Syst. Res. 2016, 130, 46–58. [Google Scholar] [CrossRef]
  23. Dubey, A.; Santoso, S. Electric Vehicle Charging on Residential Distribution Systems: Impacts and Mitigations. IEEE Access 2015, 3, 1871–1893. [Google Scholar] [CrossRef]
  24. Wang, D.D.; Toshiyuki, S. Climate change mitigation targets set by global firms: Overview and implications for renewable energy. Renew. Sustain. Energy Rev. 2018, 94, 386–398. [Google Scholar] [CrossRef]
  25. Abdelsamad, S.F.; Morsi, W.G.; Sidhu, T.S. Probabilistic Impact of Transportation Electrification on the Loss-of-Life of Distribution Transformers in the Presence of Rooftop Solar Photovoltaic. IEEE Trans. Sustain. Energy 2015, 6, 1565–1573. [Google Scholar] [CrossRef]
  26. Mathew, D.; Rani, C.; Rajesh Kumar, M.; Wang, Y.; Binns, R.; Busawon, K. Wind-Driven Optimization Technique for Estimation of Solar Photovoltaic Parameters. IEEE J. Photovolt. 2018, 8, 248–256. [Google Scholar] [CrossRef]
  27. Wang, G.; Tan, Z.; Tan, Q.; Yang, S.; Lin, H.; Ji, X.; Gejirifu, D.; Song, X. Multi-Objective Robust Scheduling Optimization Model of Wind, Photovoltaic Power, and BESS Based on the Pareto Principle. Sustainability 2019, 11, 305. [Google Scholar] [CrossRef]
  28. Lindahl, P.A.; Shaw, S.R.; Leeb, S.B. Fuel Cell Stack Emulation for Cell and Hardware-in-the-Loop Testing. IEEE Trans. Instrum. Meas. 2018, 67, 214–2152. [Google Scholar] [CrossRef]
  29. Ma, H.; Wang, B.; Gao, W.; Liu, D.; Sun, Y.; Liu, Z. Optimal Scheduling of an Regional Integrated Energy System with Energy Storage Systems for Service Regulation. Energies 2018, 11, 195. [Google Scholar] [CrossRef]
  30. Mavrotas, G.; Karmellos, M. Multi-objective optimization and comparison framework for the design of Distributed Energy Systems. Energy Convers. Manag. 2019, 180, 473–495. [Google Scholar]
  31. Vahidi, A.; Kolmanovsky, I.; Stefanopoulou, A. Constraint Handling in a Fuel Cell System: A Fast Reference Governor Approach. IEEE Trans. Control Syst. Technol. 2007, 15, 86–98. [Google Scholar] [CrossRef]
  32. Li, K.; Yan, H.; He, G.; Zhu, C.; Liu, K.; Liu, Y. Seasonal Operation Strategy Optimization for Integrated Energy Systems with Considering System Cooling Loads Independently. Processes 2018, 6, 202. [Google Scholar] [CrossRef]
  33. Liu, H.; Li, D.; Liu, Y.; Dong, M.; Liu, X.; Zhang, H. Sizing Hybrid Energy Storage Systems for Distributed Power Systems under Multi-Time Scales. Appl. Sci. 2018, 8, 1453. [Google Scholar] [CrossRef]
Figure 1. A typical structure of a smart community.
Processes 07 00063 g001
Figure 2. The flow diagram of the proposed operation model.
Processes 07 00063 g002
Figure 3. Daily load curve and the output curves of photovoltaic and wind turbine power.
Processes 07 00063 g003
Figure 4. Optimal load-scheduling results under different comfort levels. (IL represents interruptible loads; TLa, TLb, and TLc represent three types of transferable loads; positive power represents the amount of active power shifted out/cut off and negative power represents the amount of active power shifted in).
Processes 07 00063 g004
Figure 5. Optimal daily load curves of the proposed community under different renewable energy consumption rates.
Processes 07 00063 g005
Figure 6. Optimal load-scheduling results of transferable and interruptible loads given φTL < 15, φIL < 0.17 and 90% < γ < 95%.
Processes 07 00063 g006
Figure 7. Optimization results of renewable generation, fuel cell generation, and operation state of battery.
Processes 07 00063 g007
Table 1. Rated parameters of the fuel cell and energy storage system.
Distributed GeneratorsRated ParametersValue
Fuel cellRamp-up rate (MW/h)1.5
Energy storageMaximum discharge power (MW)2
Maximum charging power (MW)1.5
Overall efficiency 80%
SOC20~90%
Table 2. Daily time-of-use gas price.
Natural Gas Price ($/m3)Time Period
0.4523:00–05:00; 13:00–15:00
0.605:00–09:00; 15:00–17:00; 20:00–23:00
0.7509:00–13:00; 17:00–20:00
Table 3. Optimization results of system operating parameters.
Renewable Energy Consumption RateAverage Daily Energy Costs ($)User Comfort LevelEnergy Storage System
φTLφIL Range of SOC Total Energy Interaction (MWh)
82.5%8894.928.50.18220%–88.7%3.92
85%8915.428.50.18420%–88.1%3.98
90%8944.7290.18720%–87.3%4.11
95%9010.531.50.19320%–85.9%4.37
100%9295.236.50.21320%–80.2%5.31

