Long-Term Stability of Thin-Film Pd-Based Supported Membranes


 ,
,  ,
, 

Abstract
:1. Introduction
2. Materials and Methods
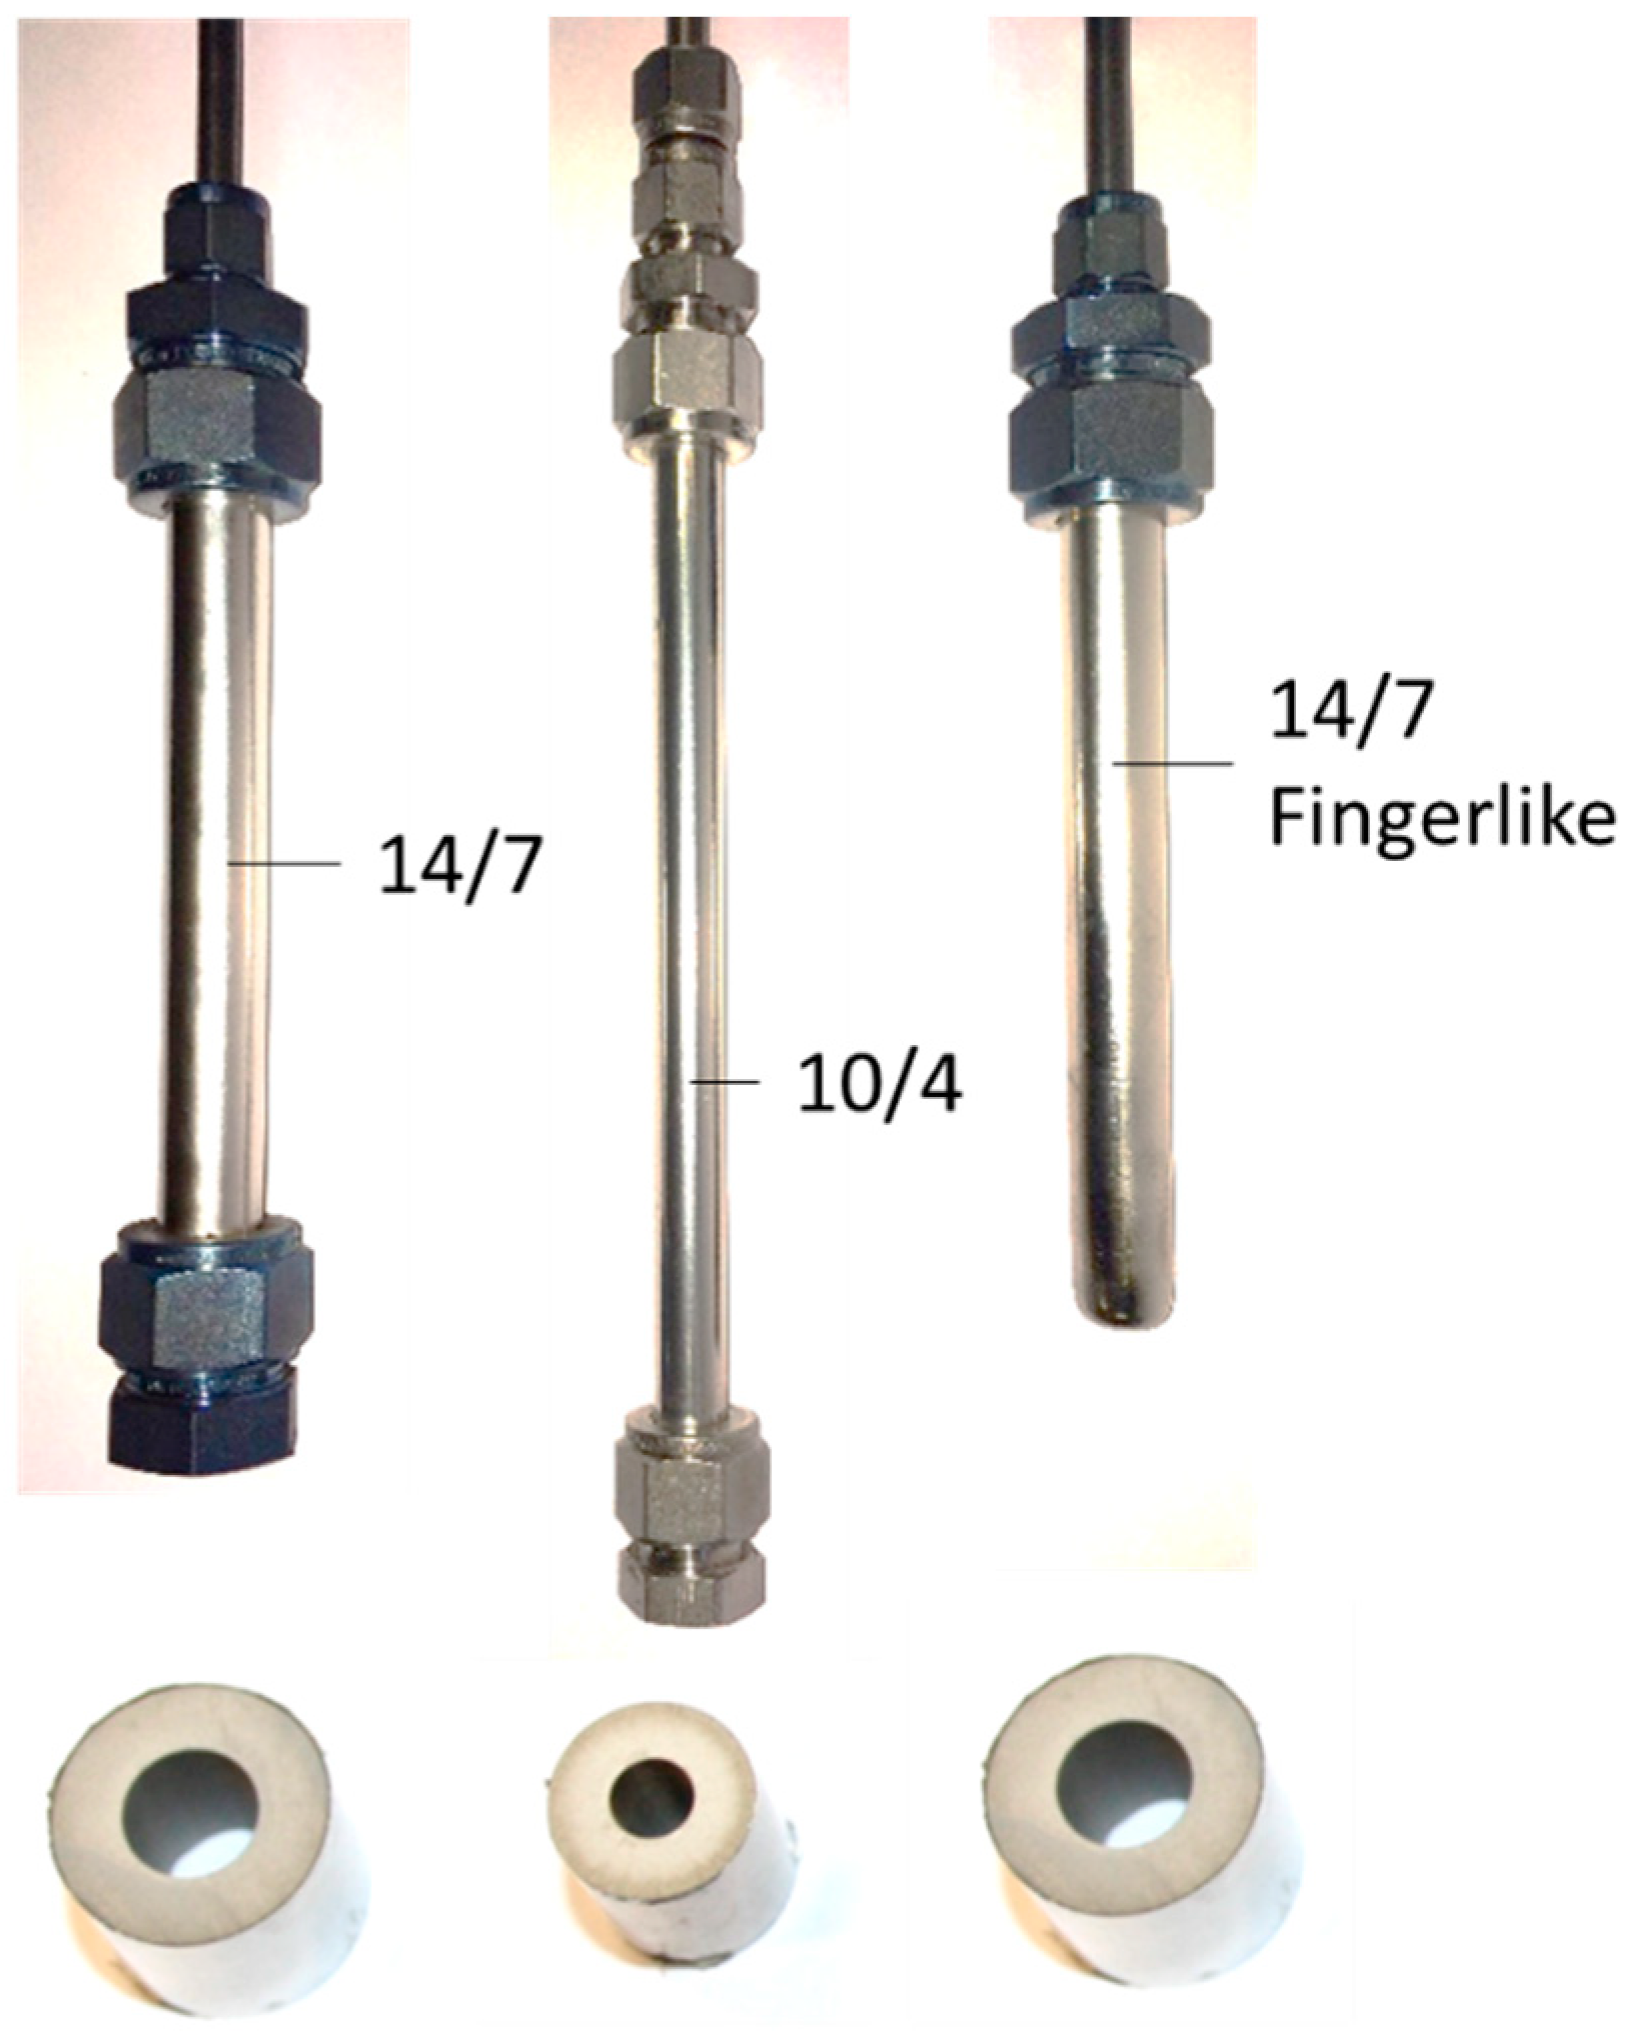
2.1. Membrane Preparation
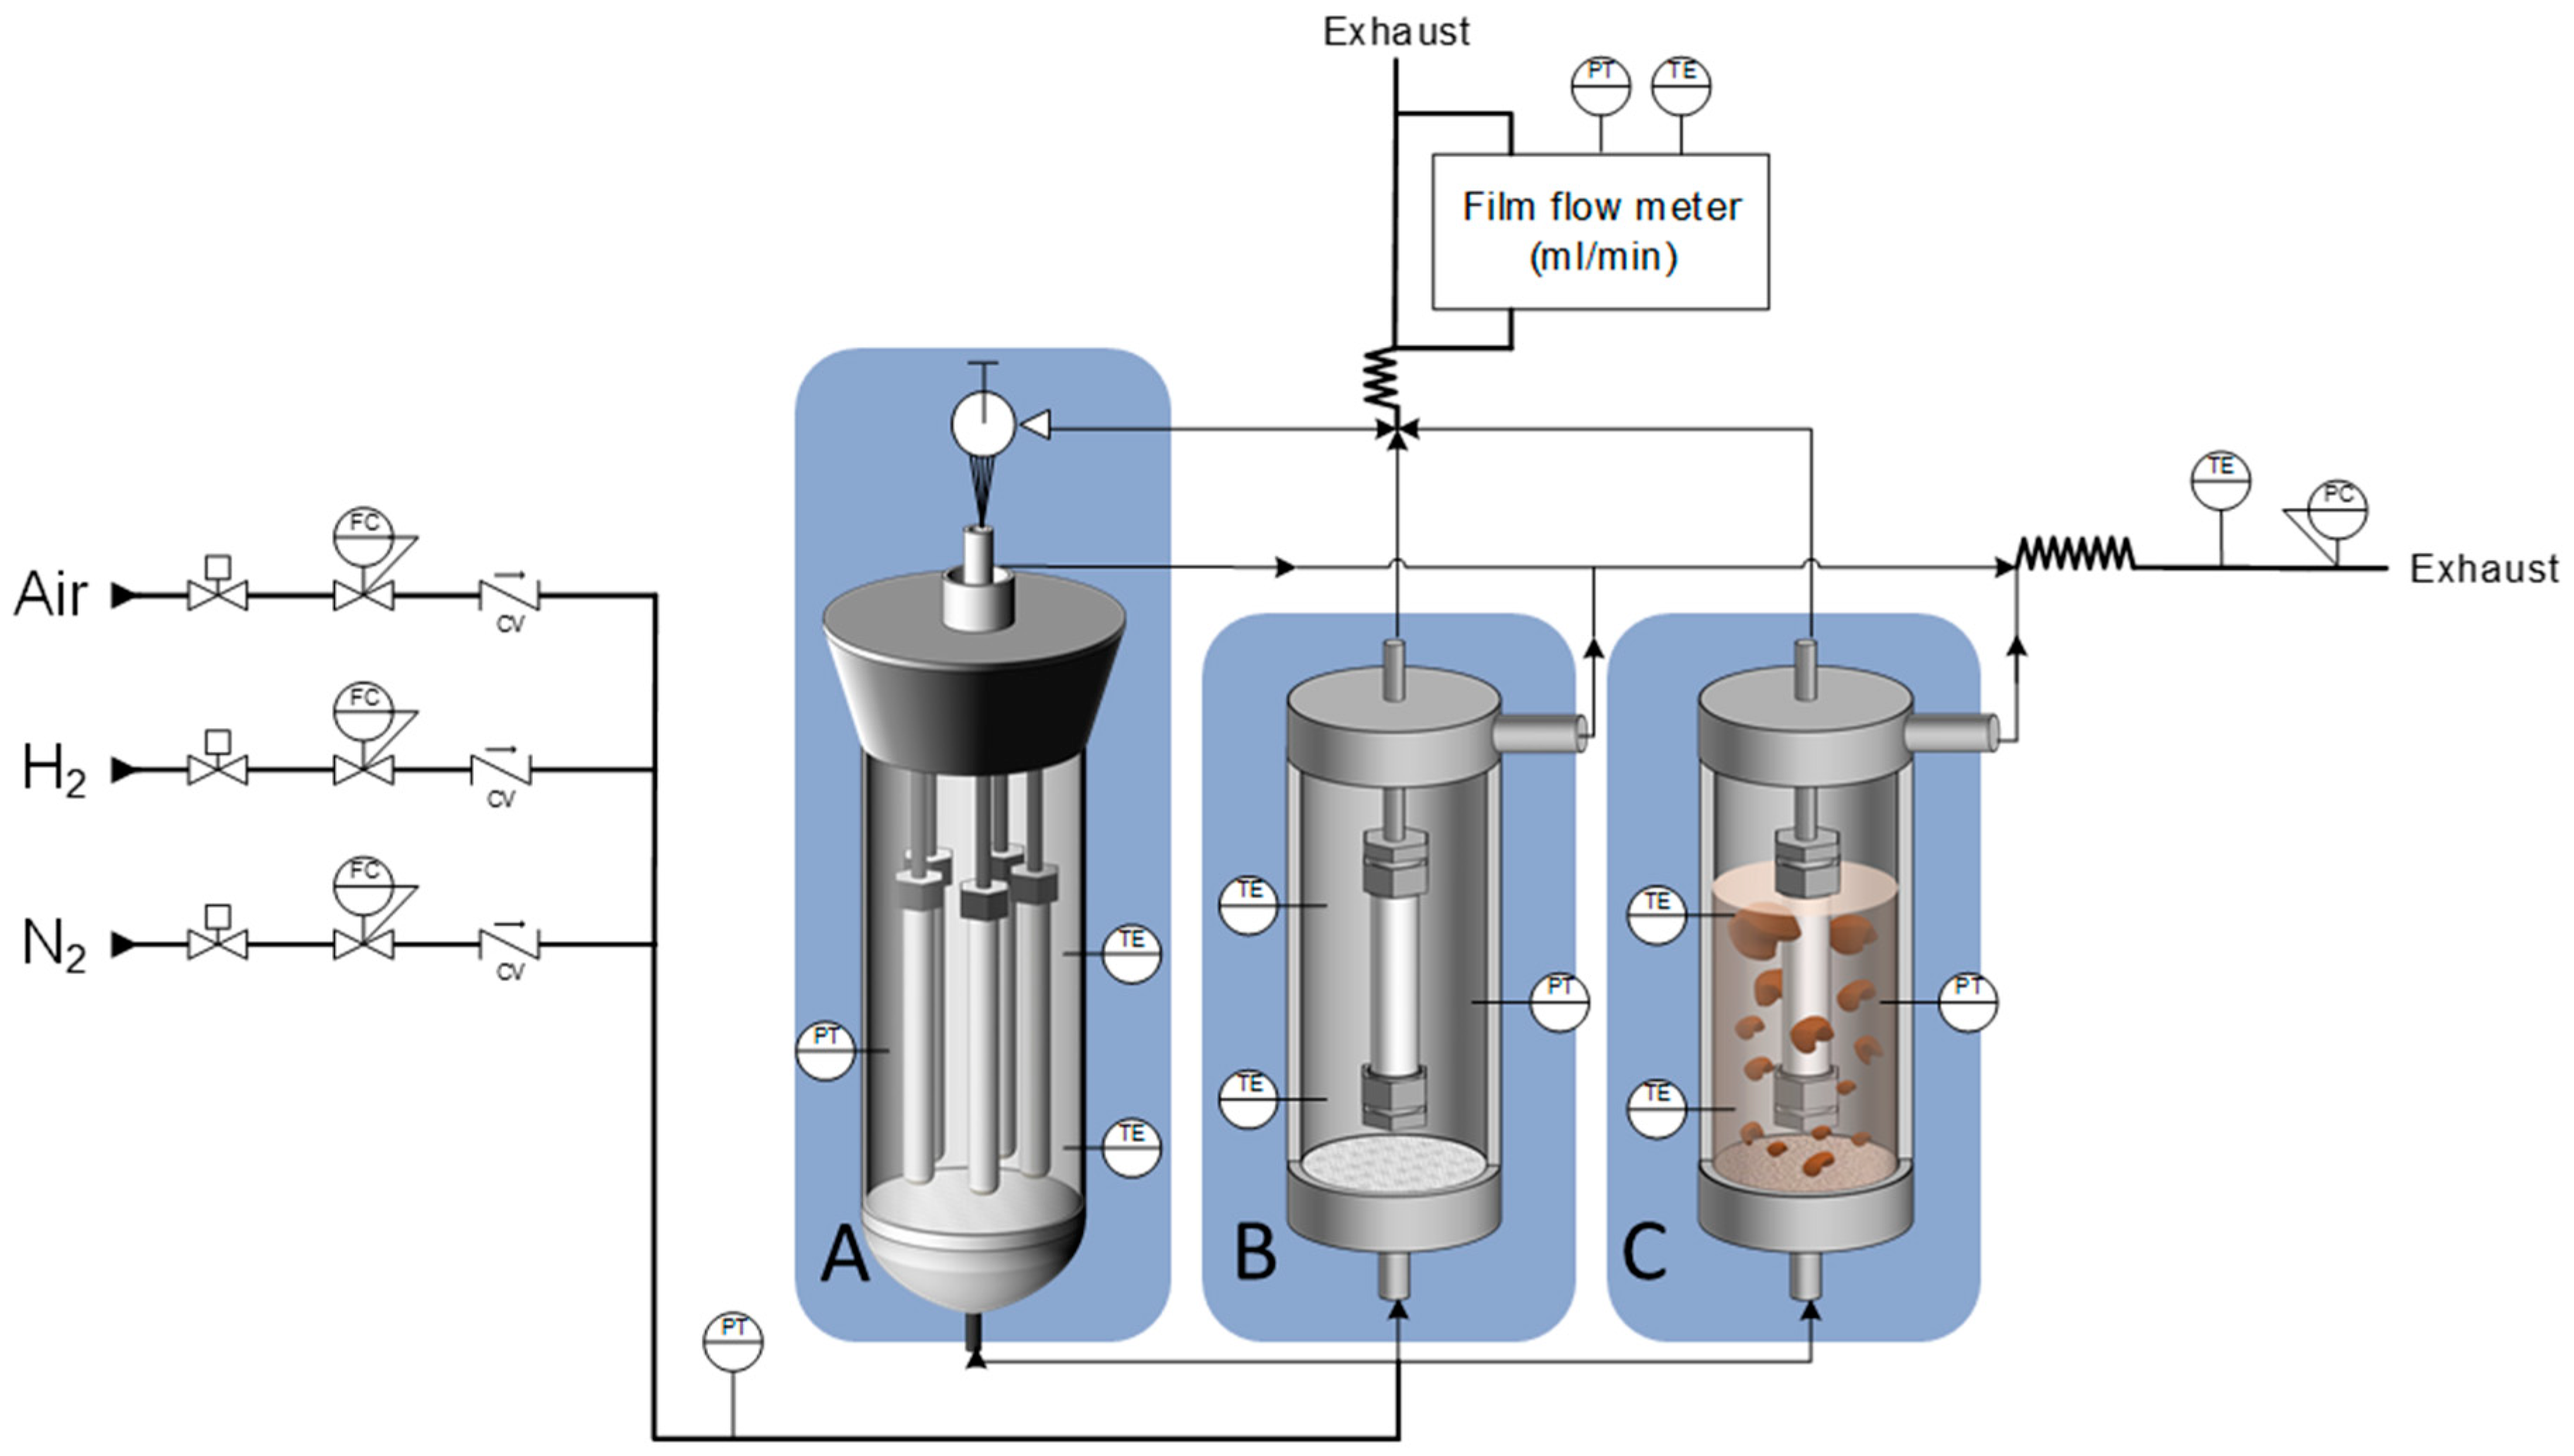
2.2. Permeation Modules
2.3. Long-Term Stability Tests
2.4. Membrane Characterization
2.5. Post Mortem Characterization
3. Results and Discussion
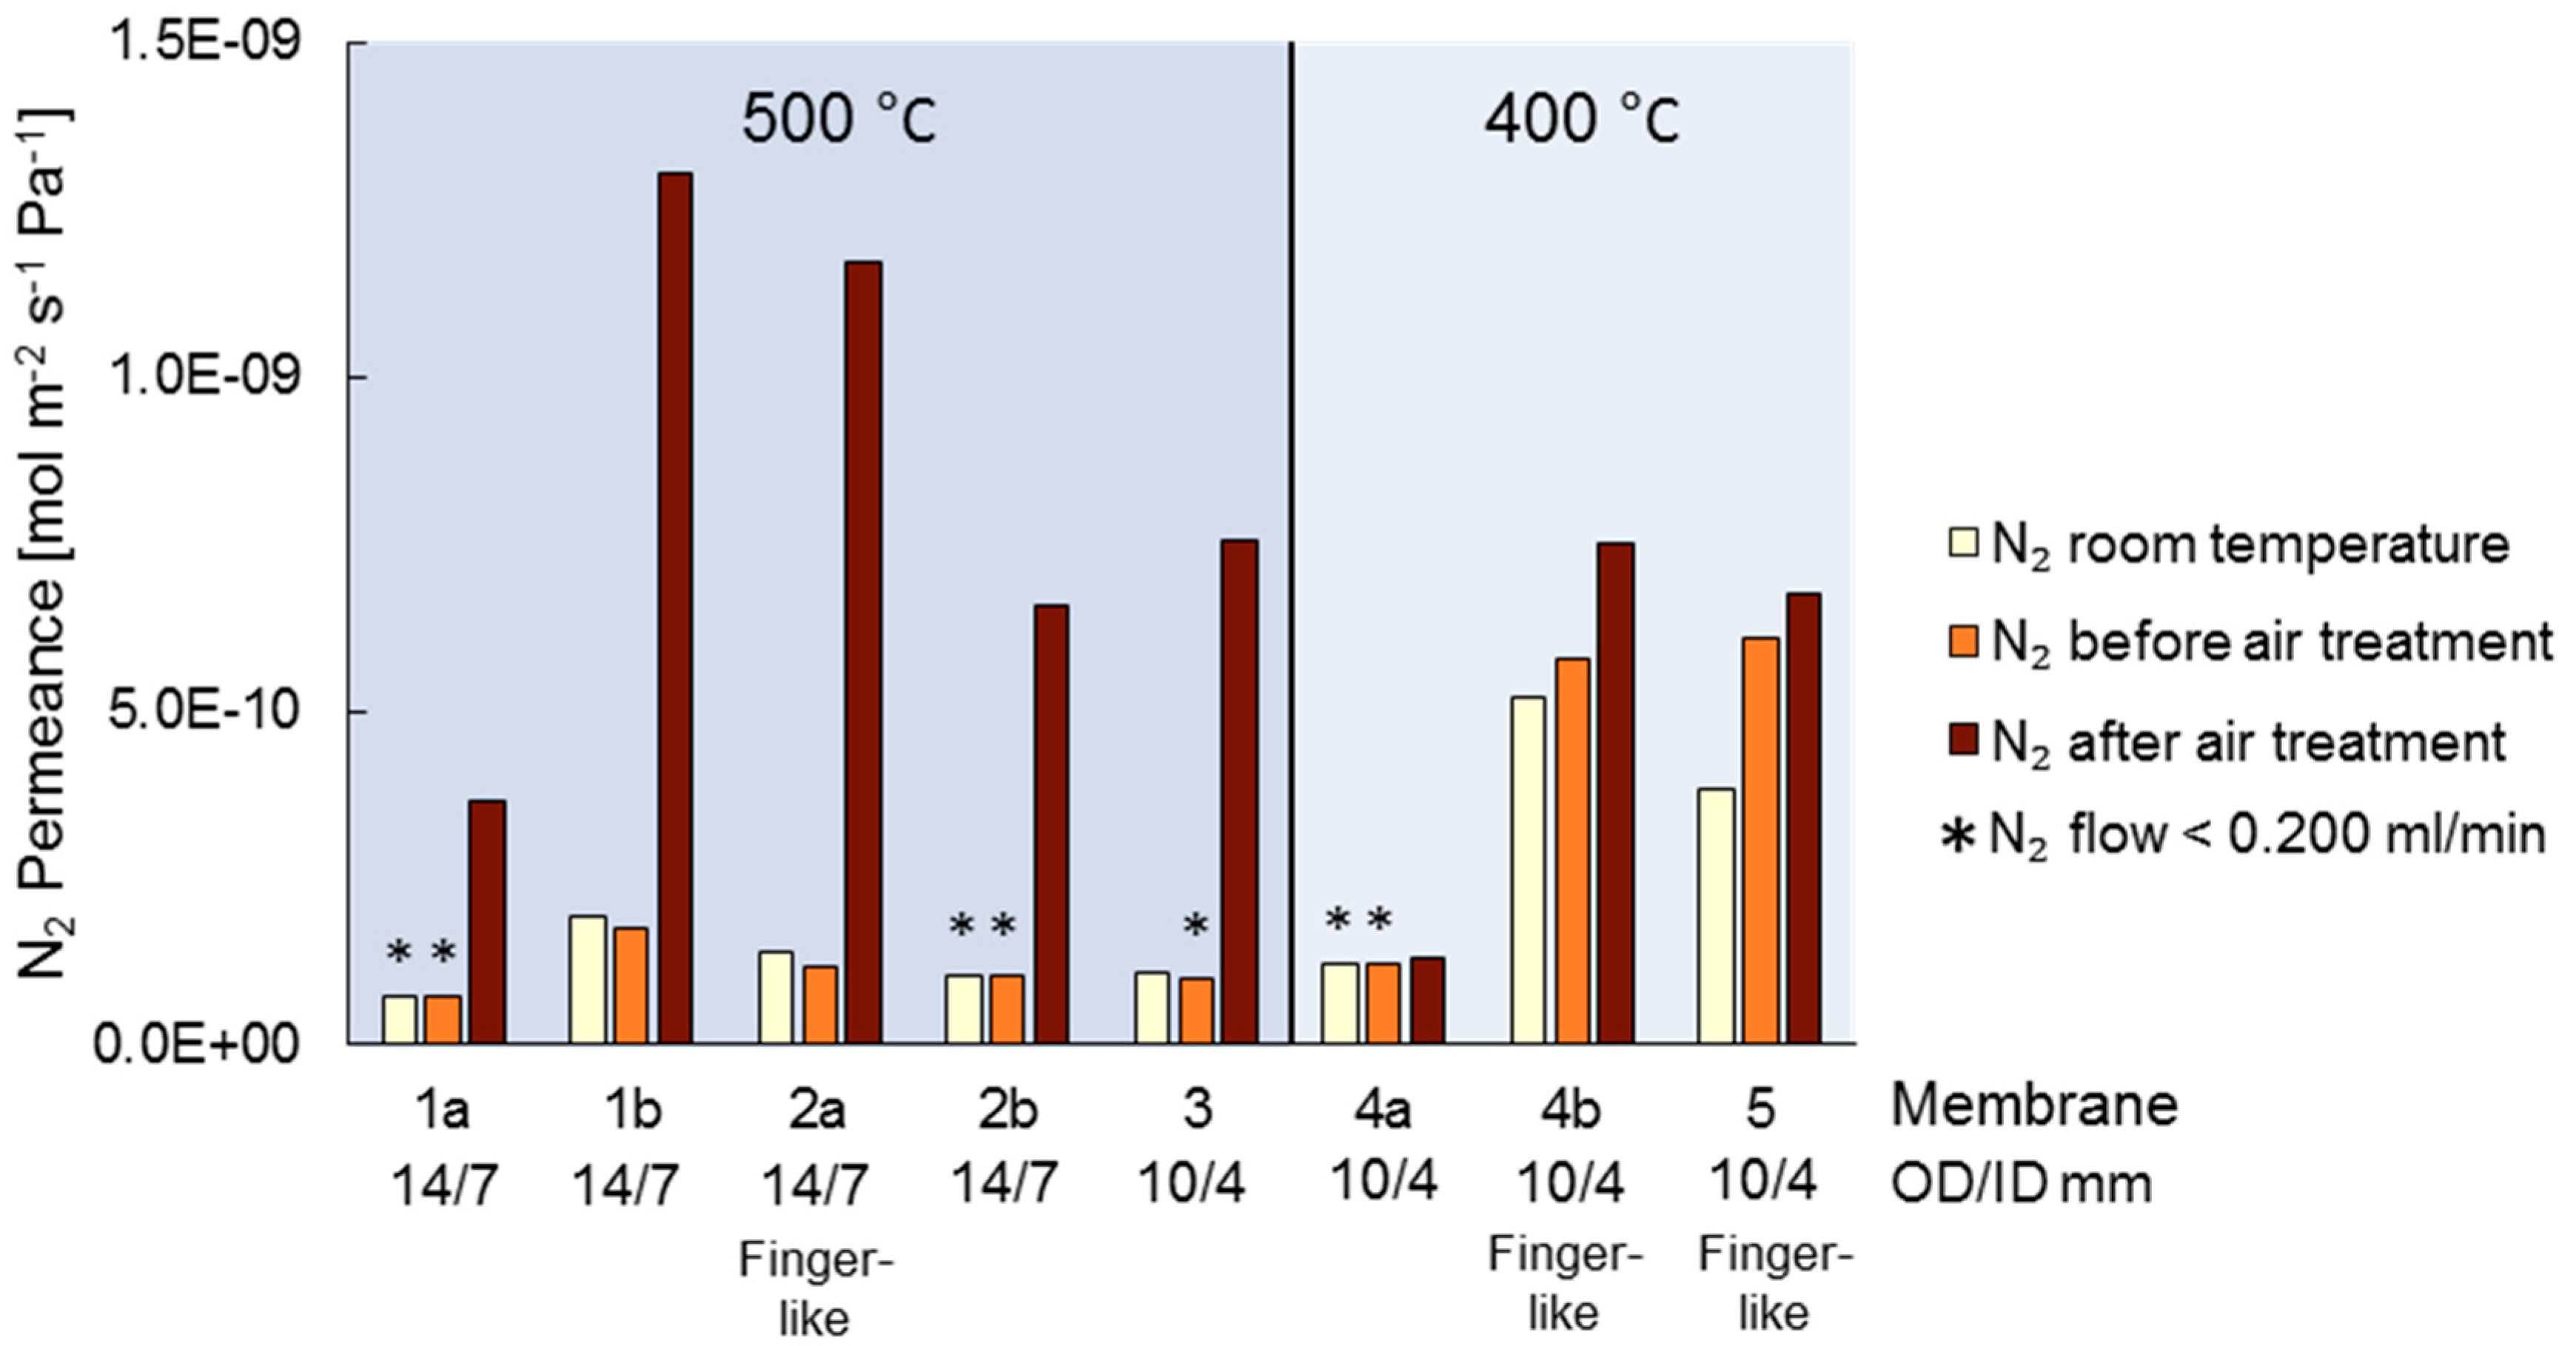
3.1. Air Treatment and Initial Conditions
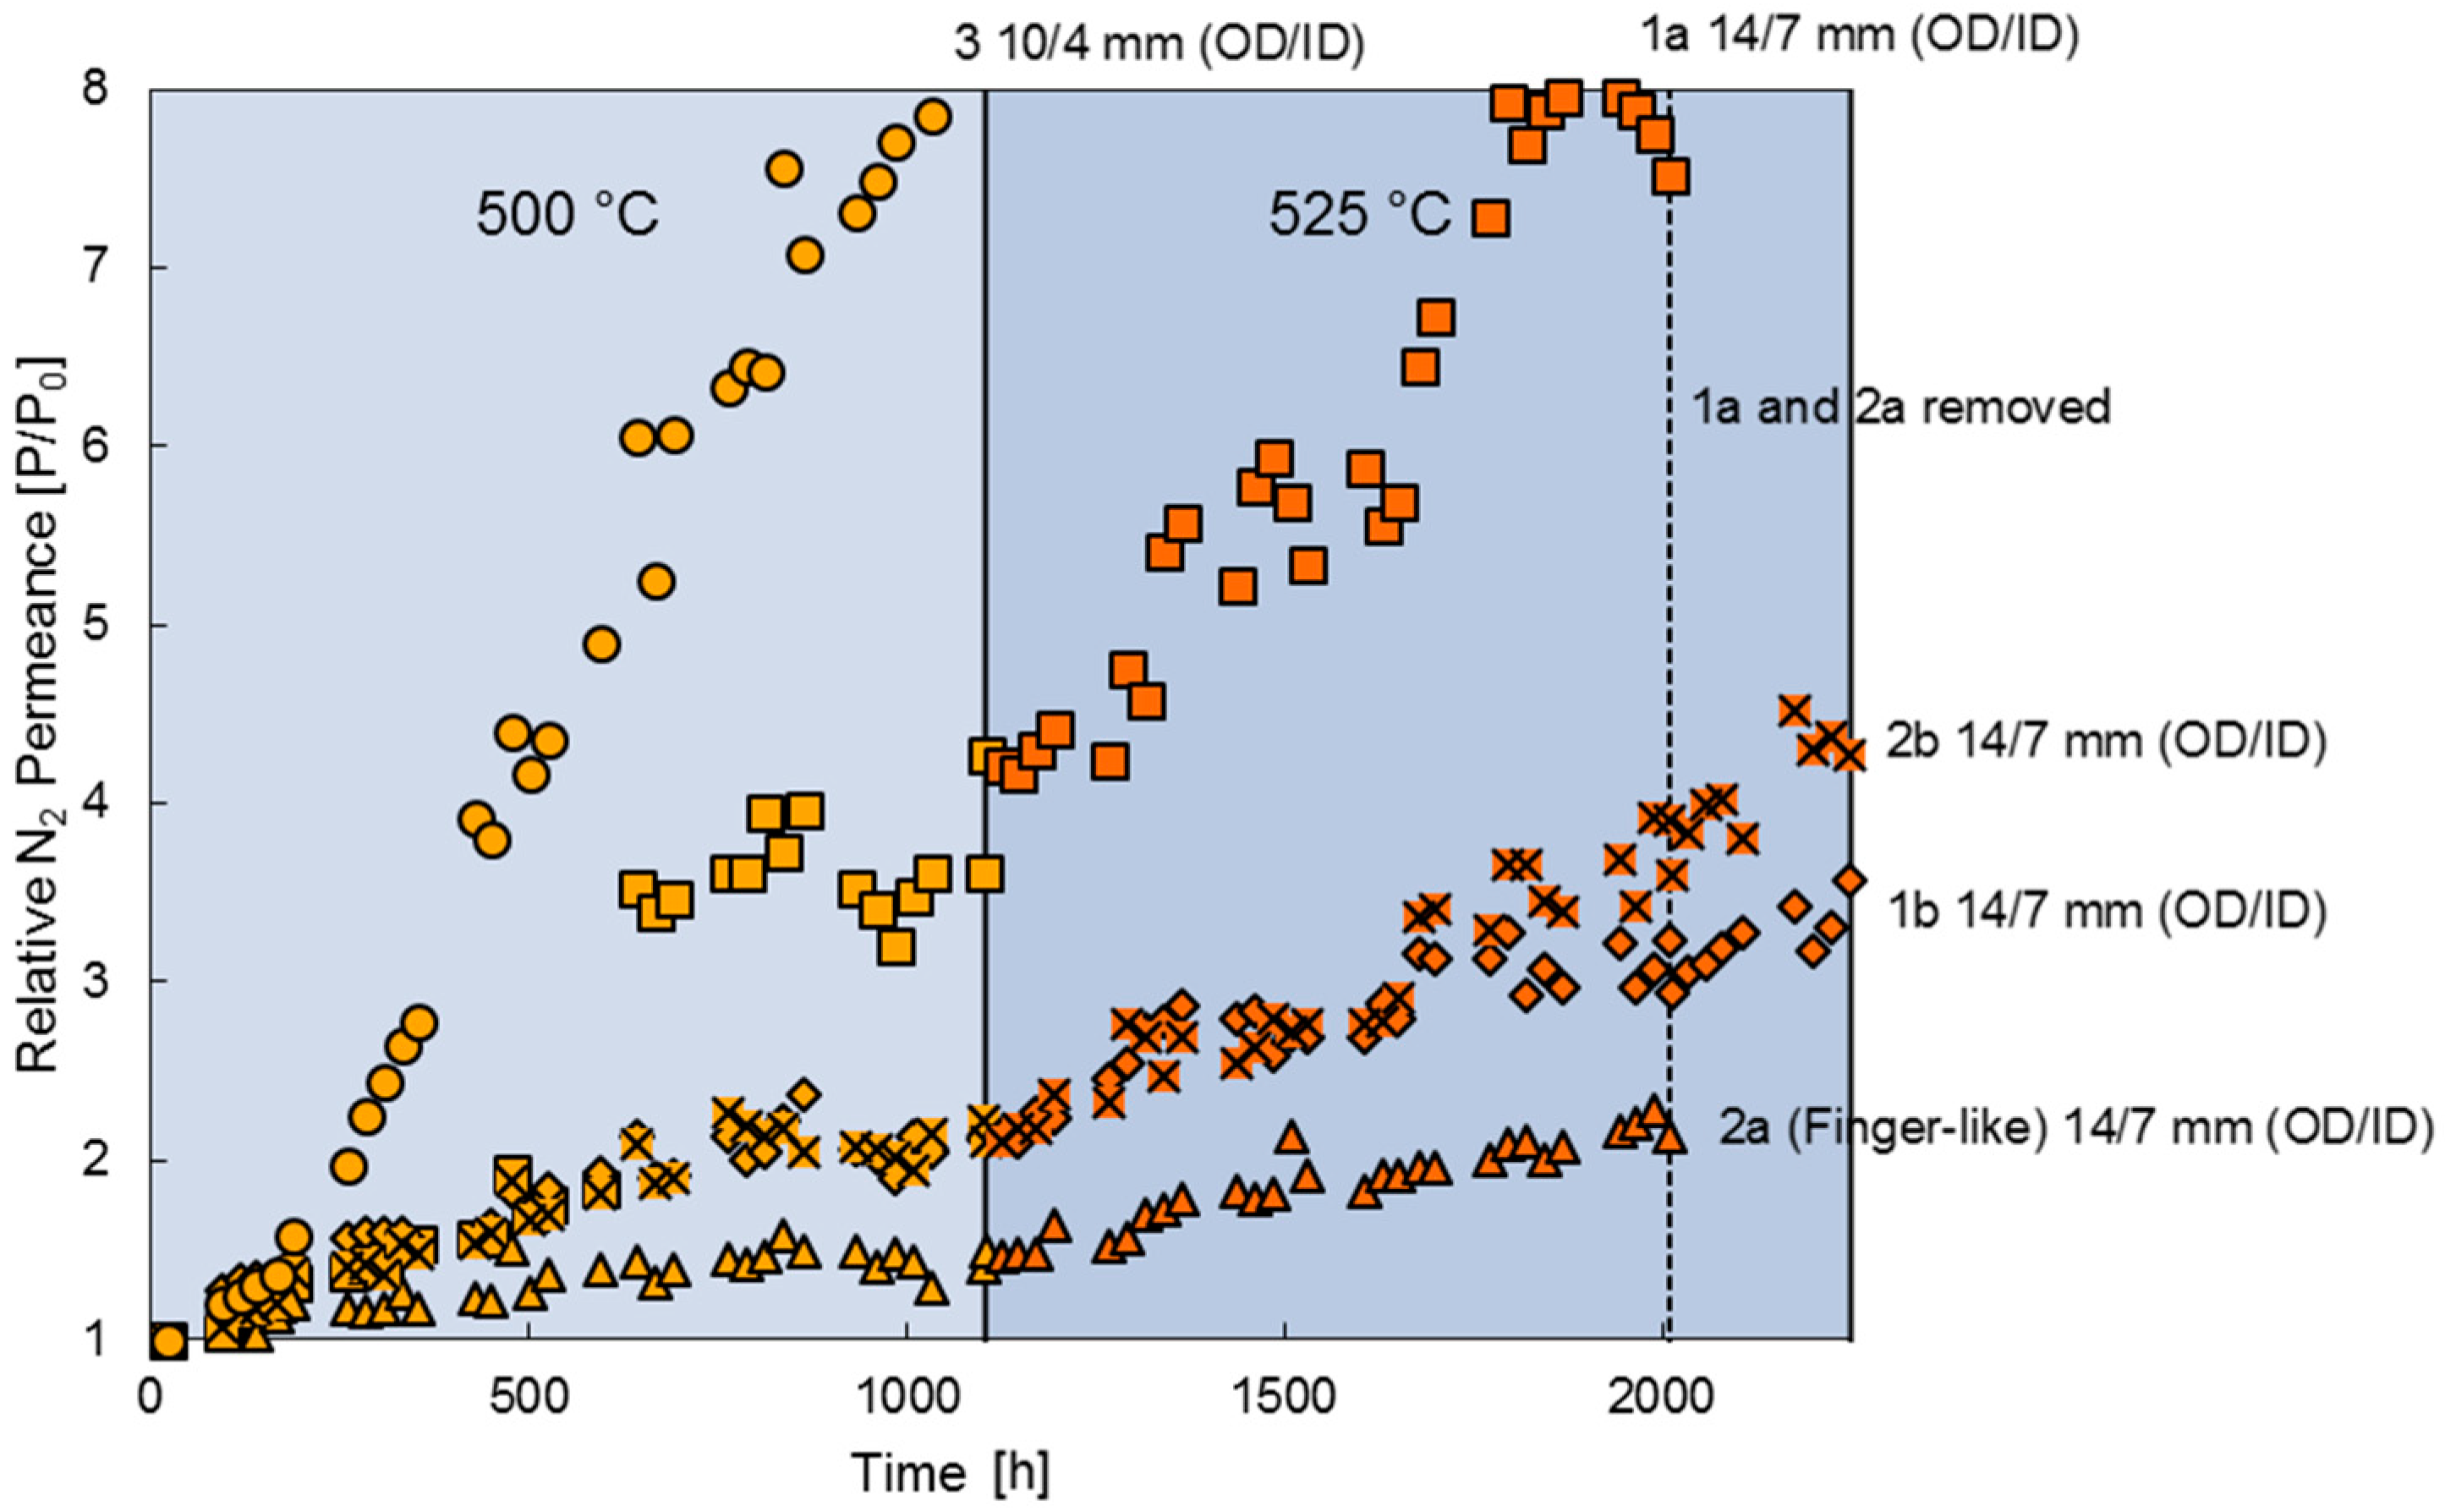
3.2. Long-Term Stability
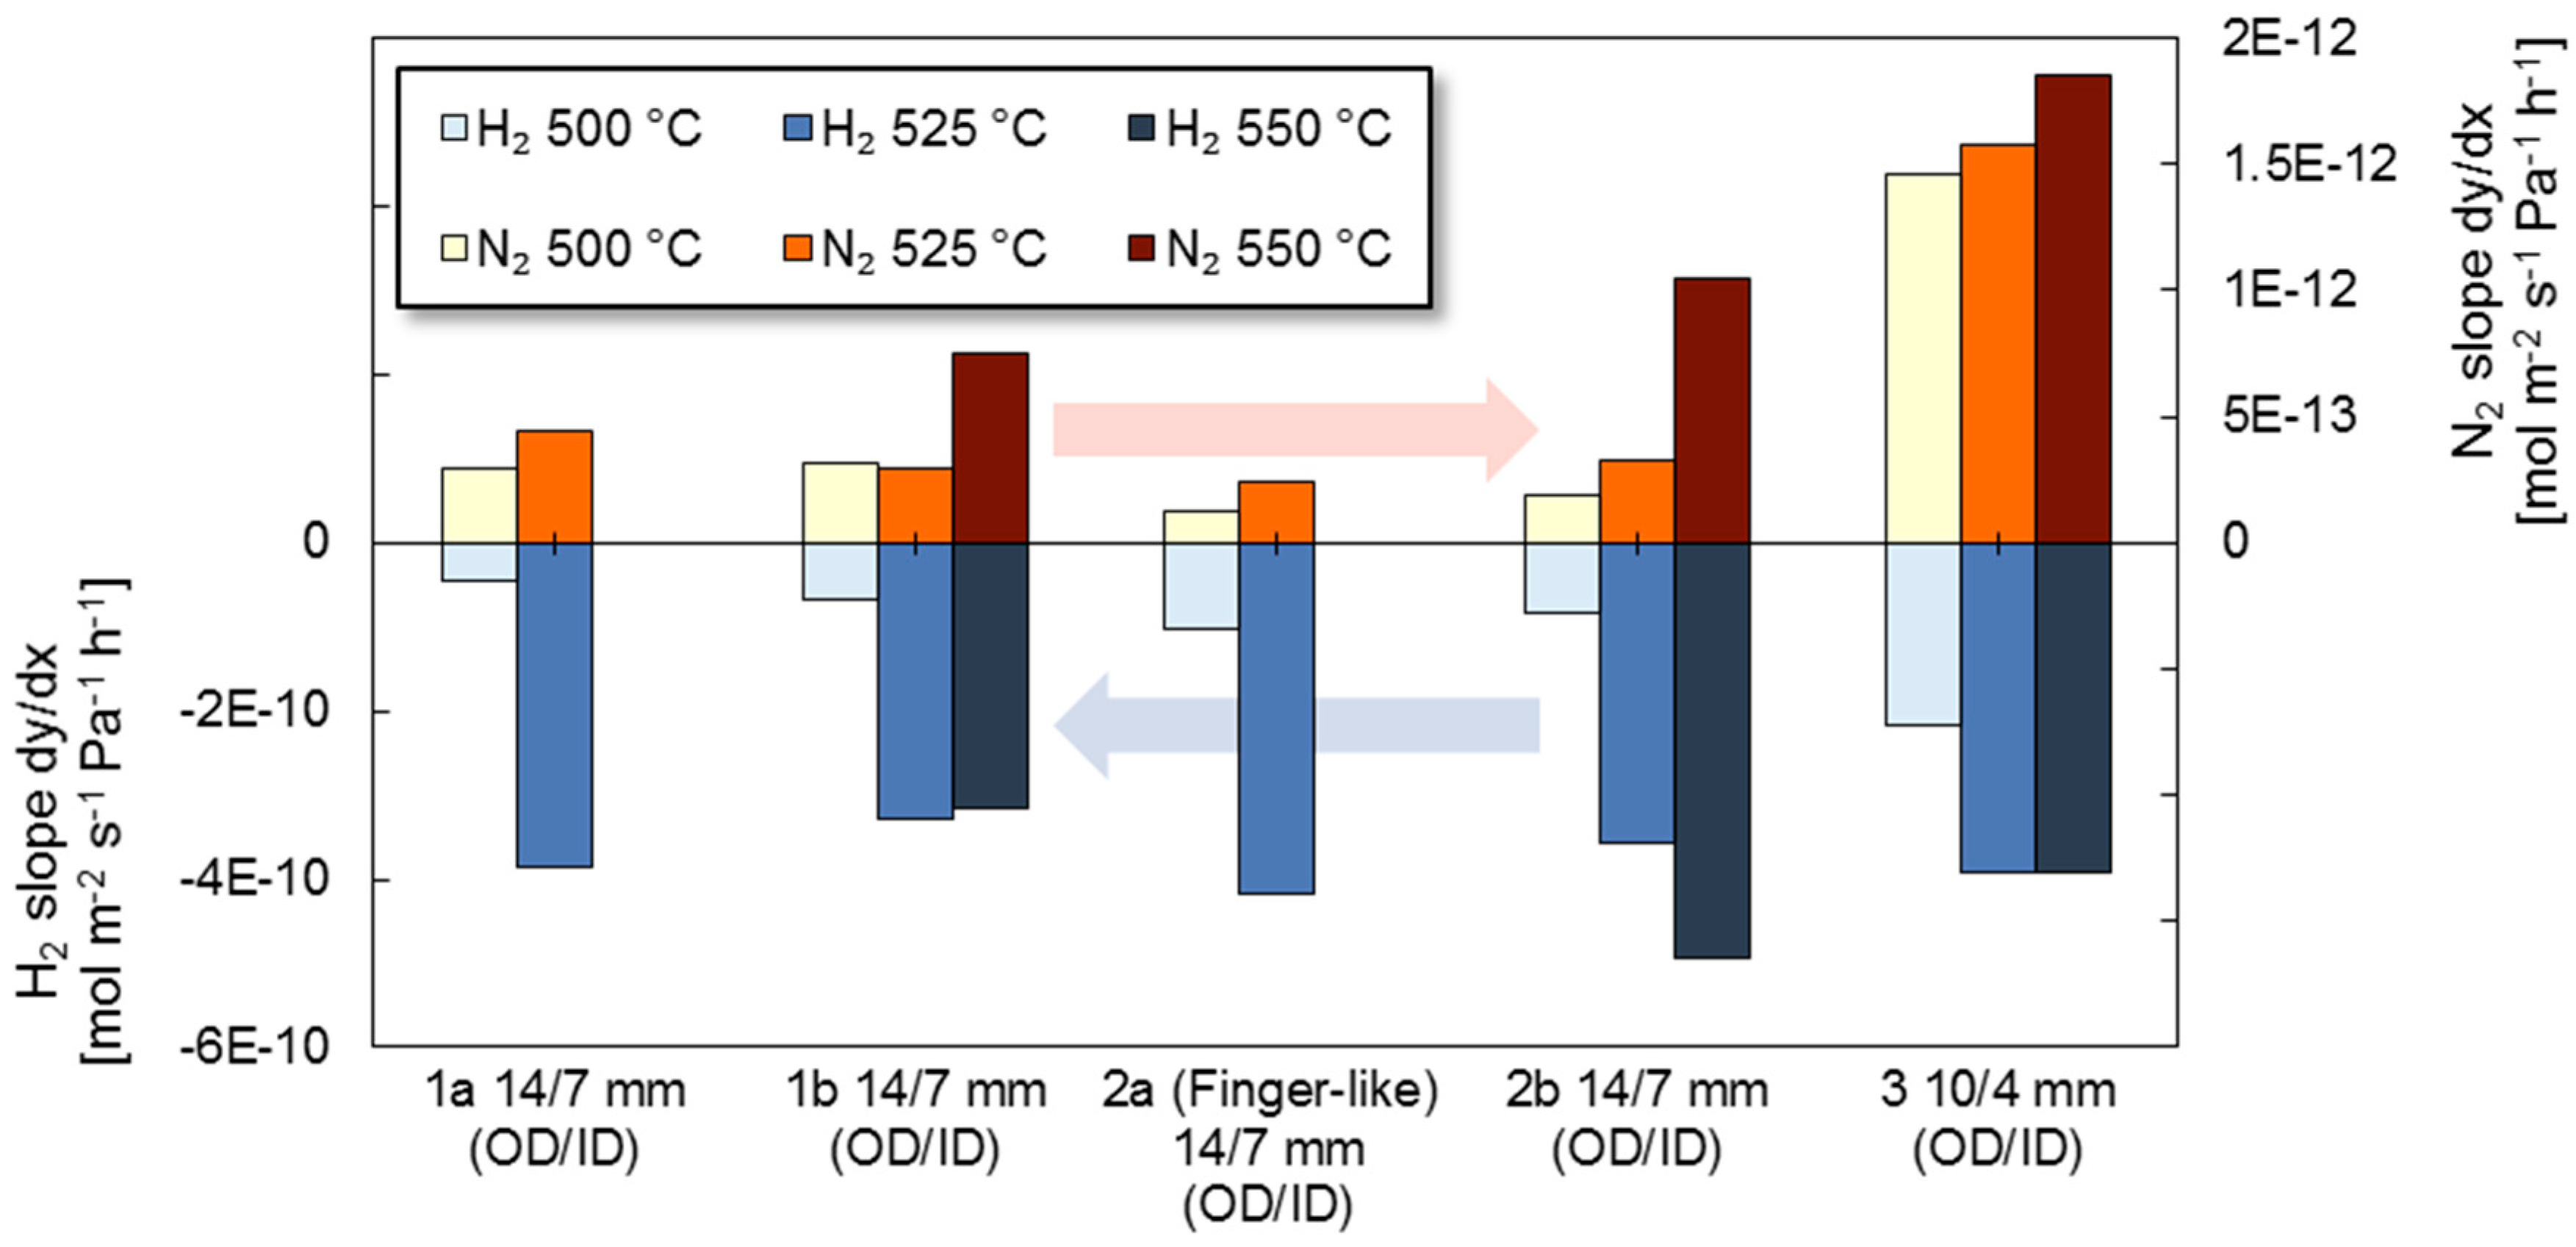
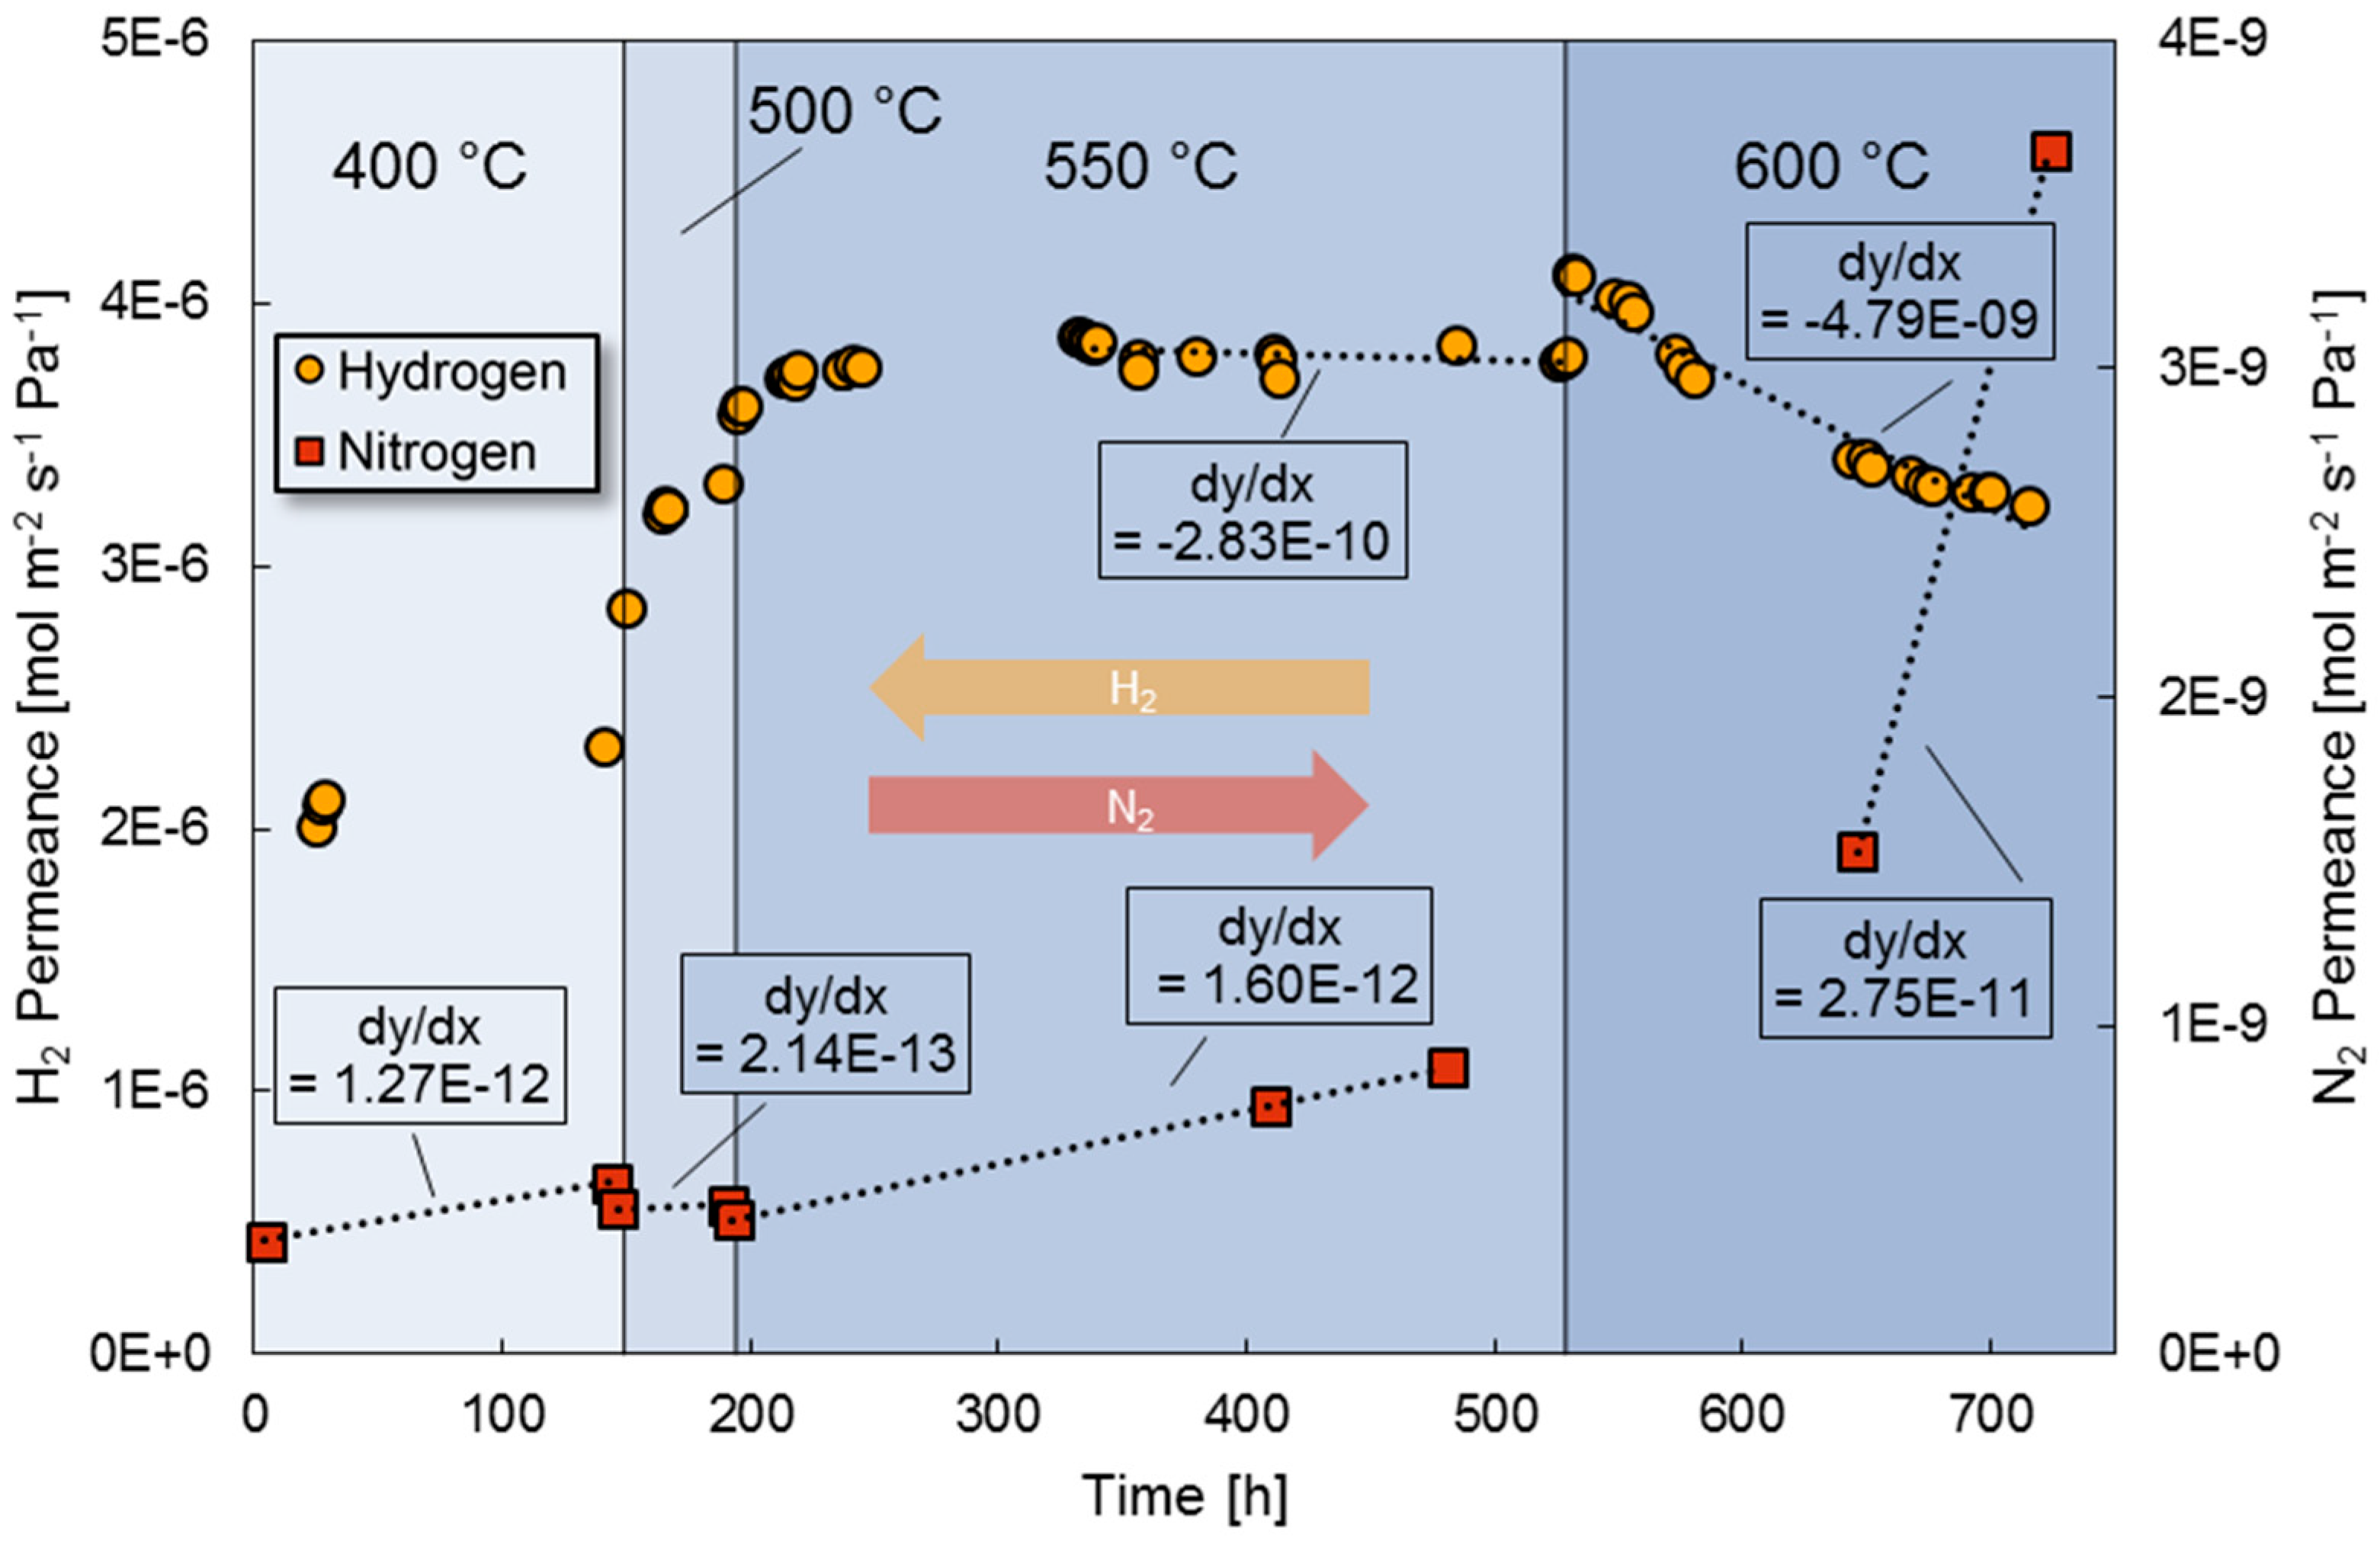
3.3. High Temperature Stability
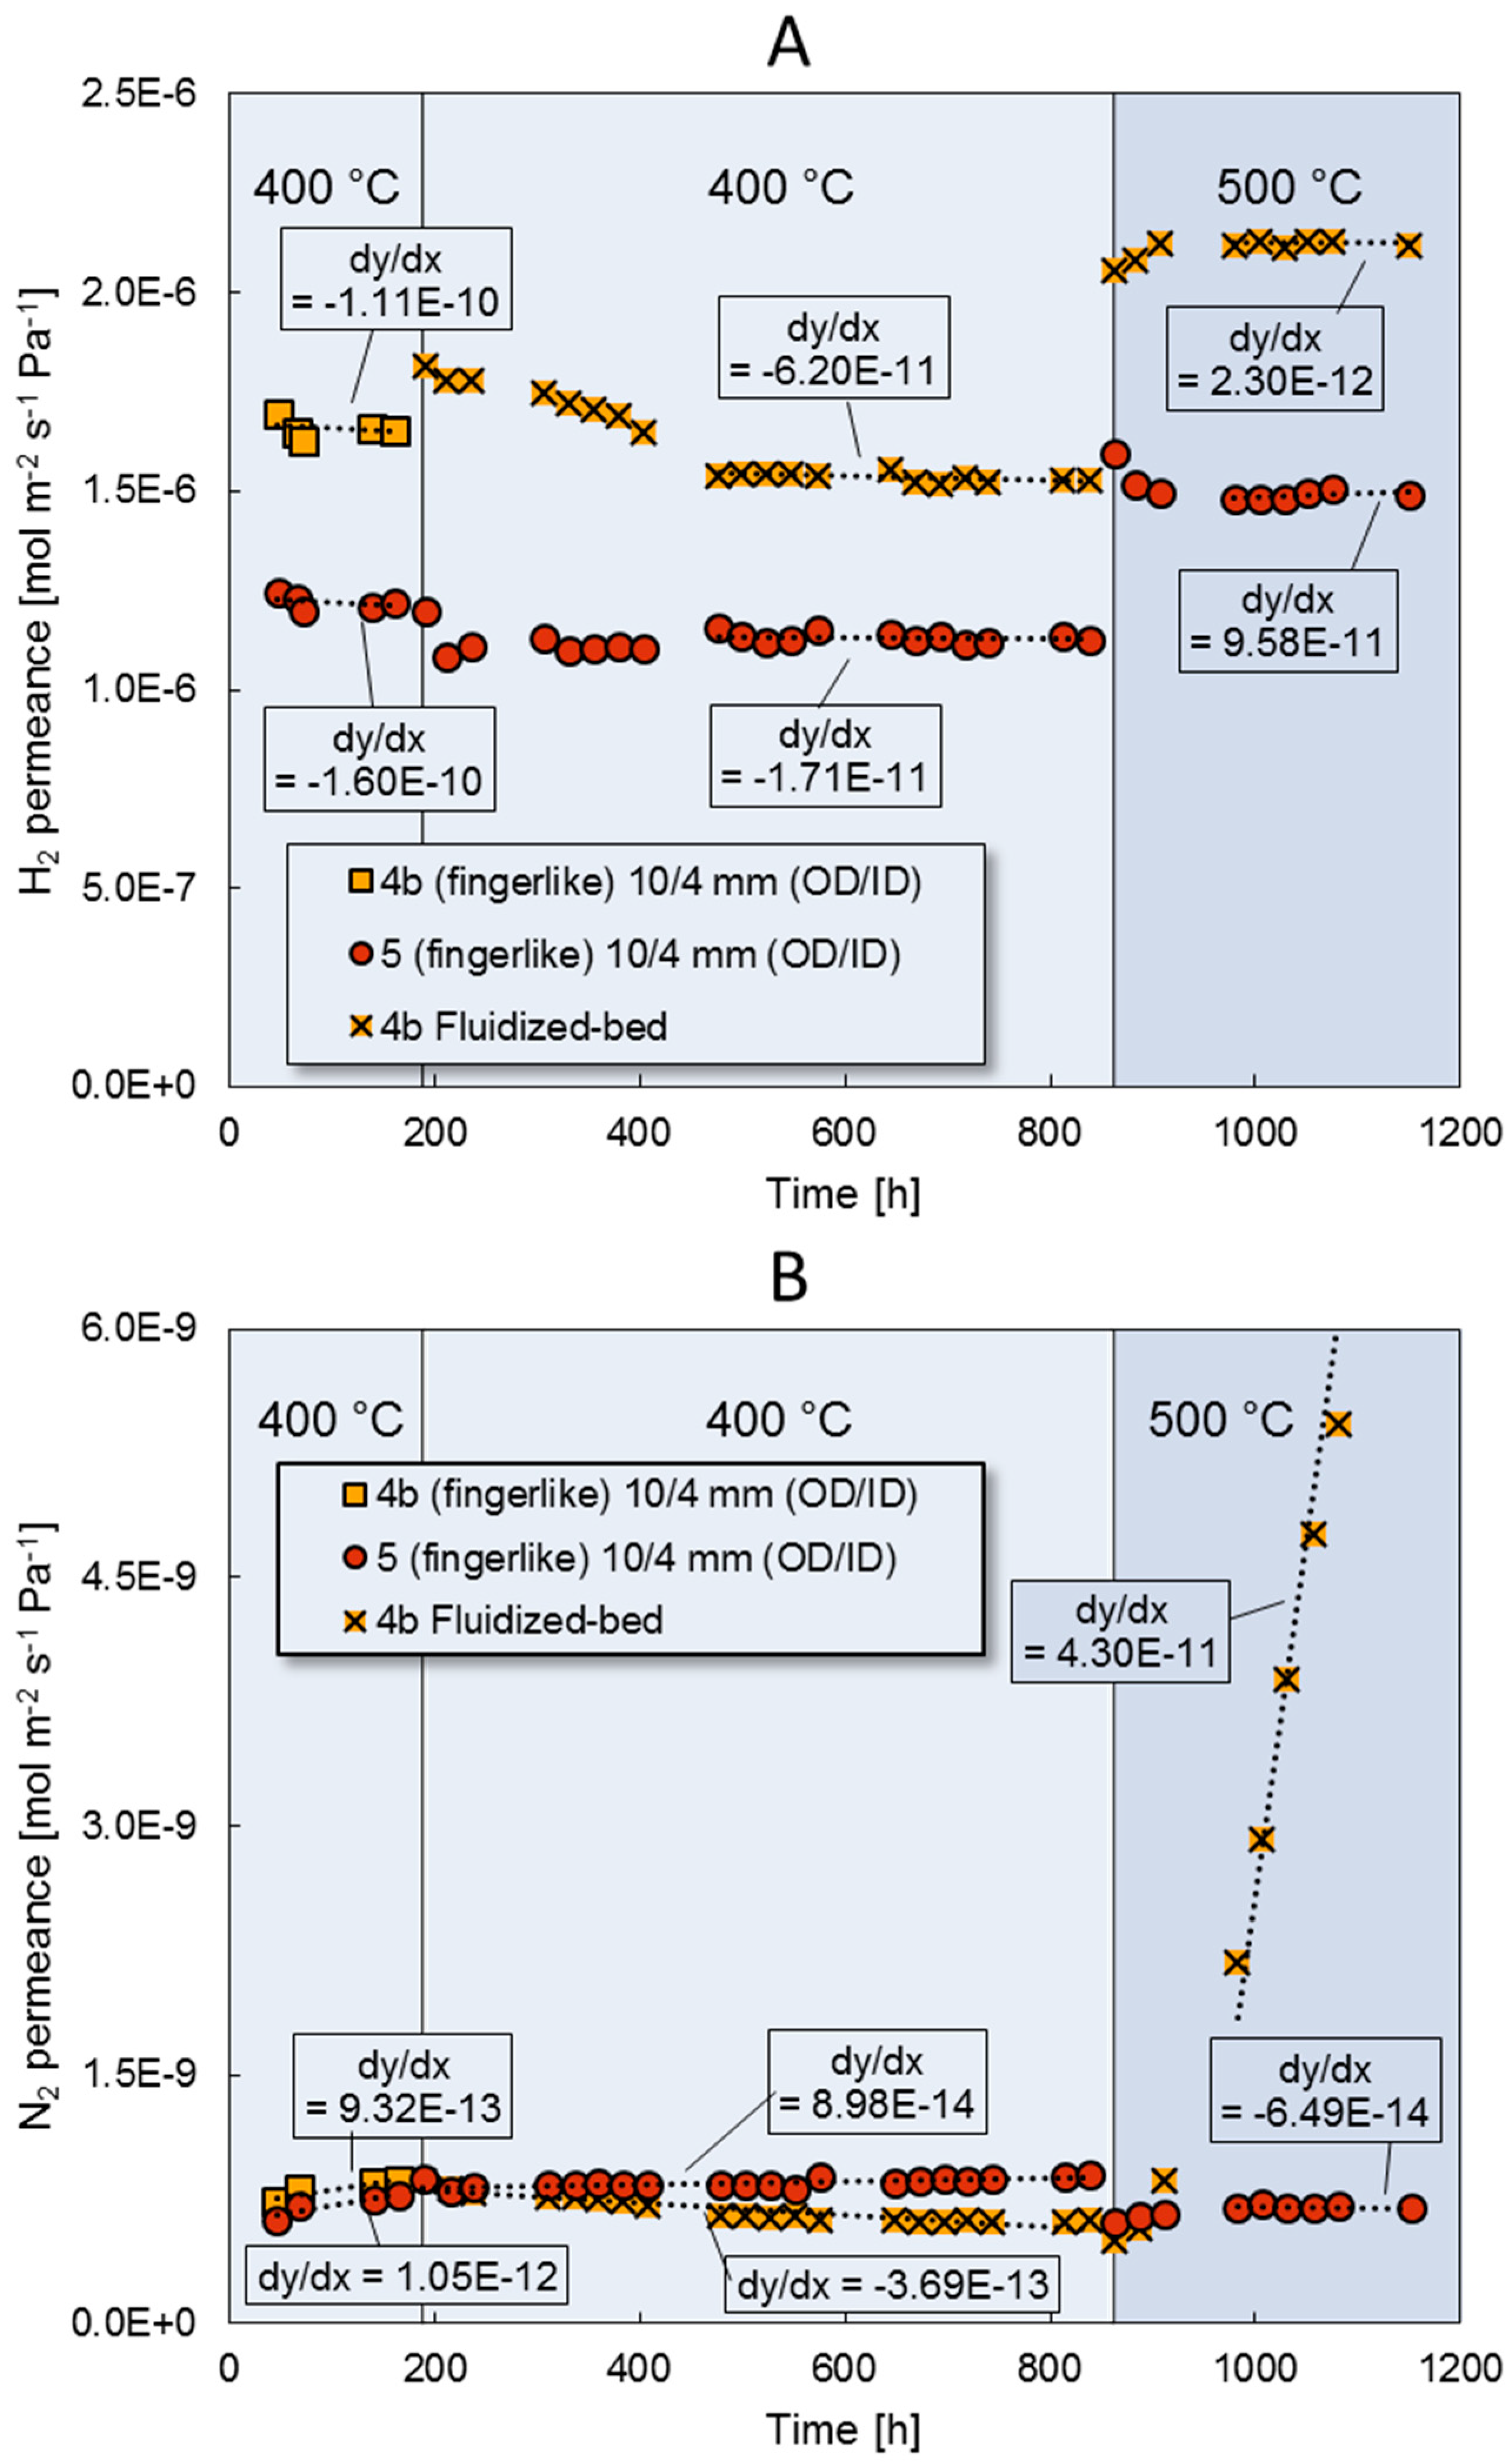
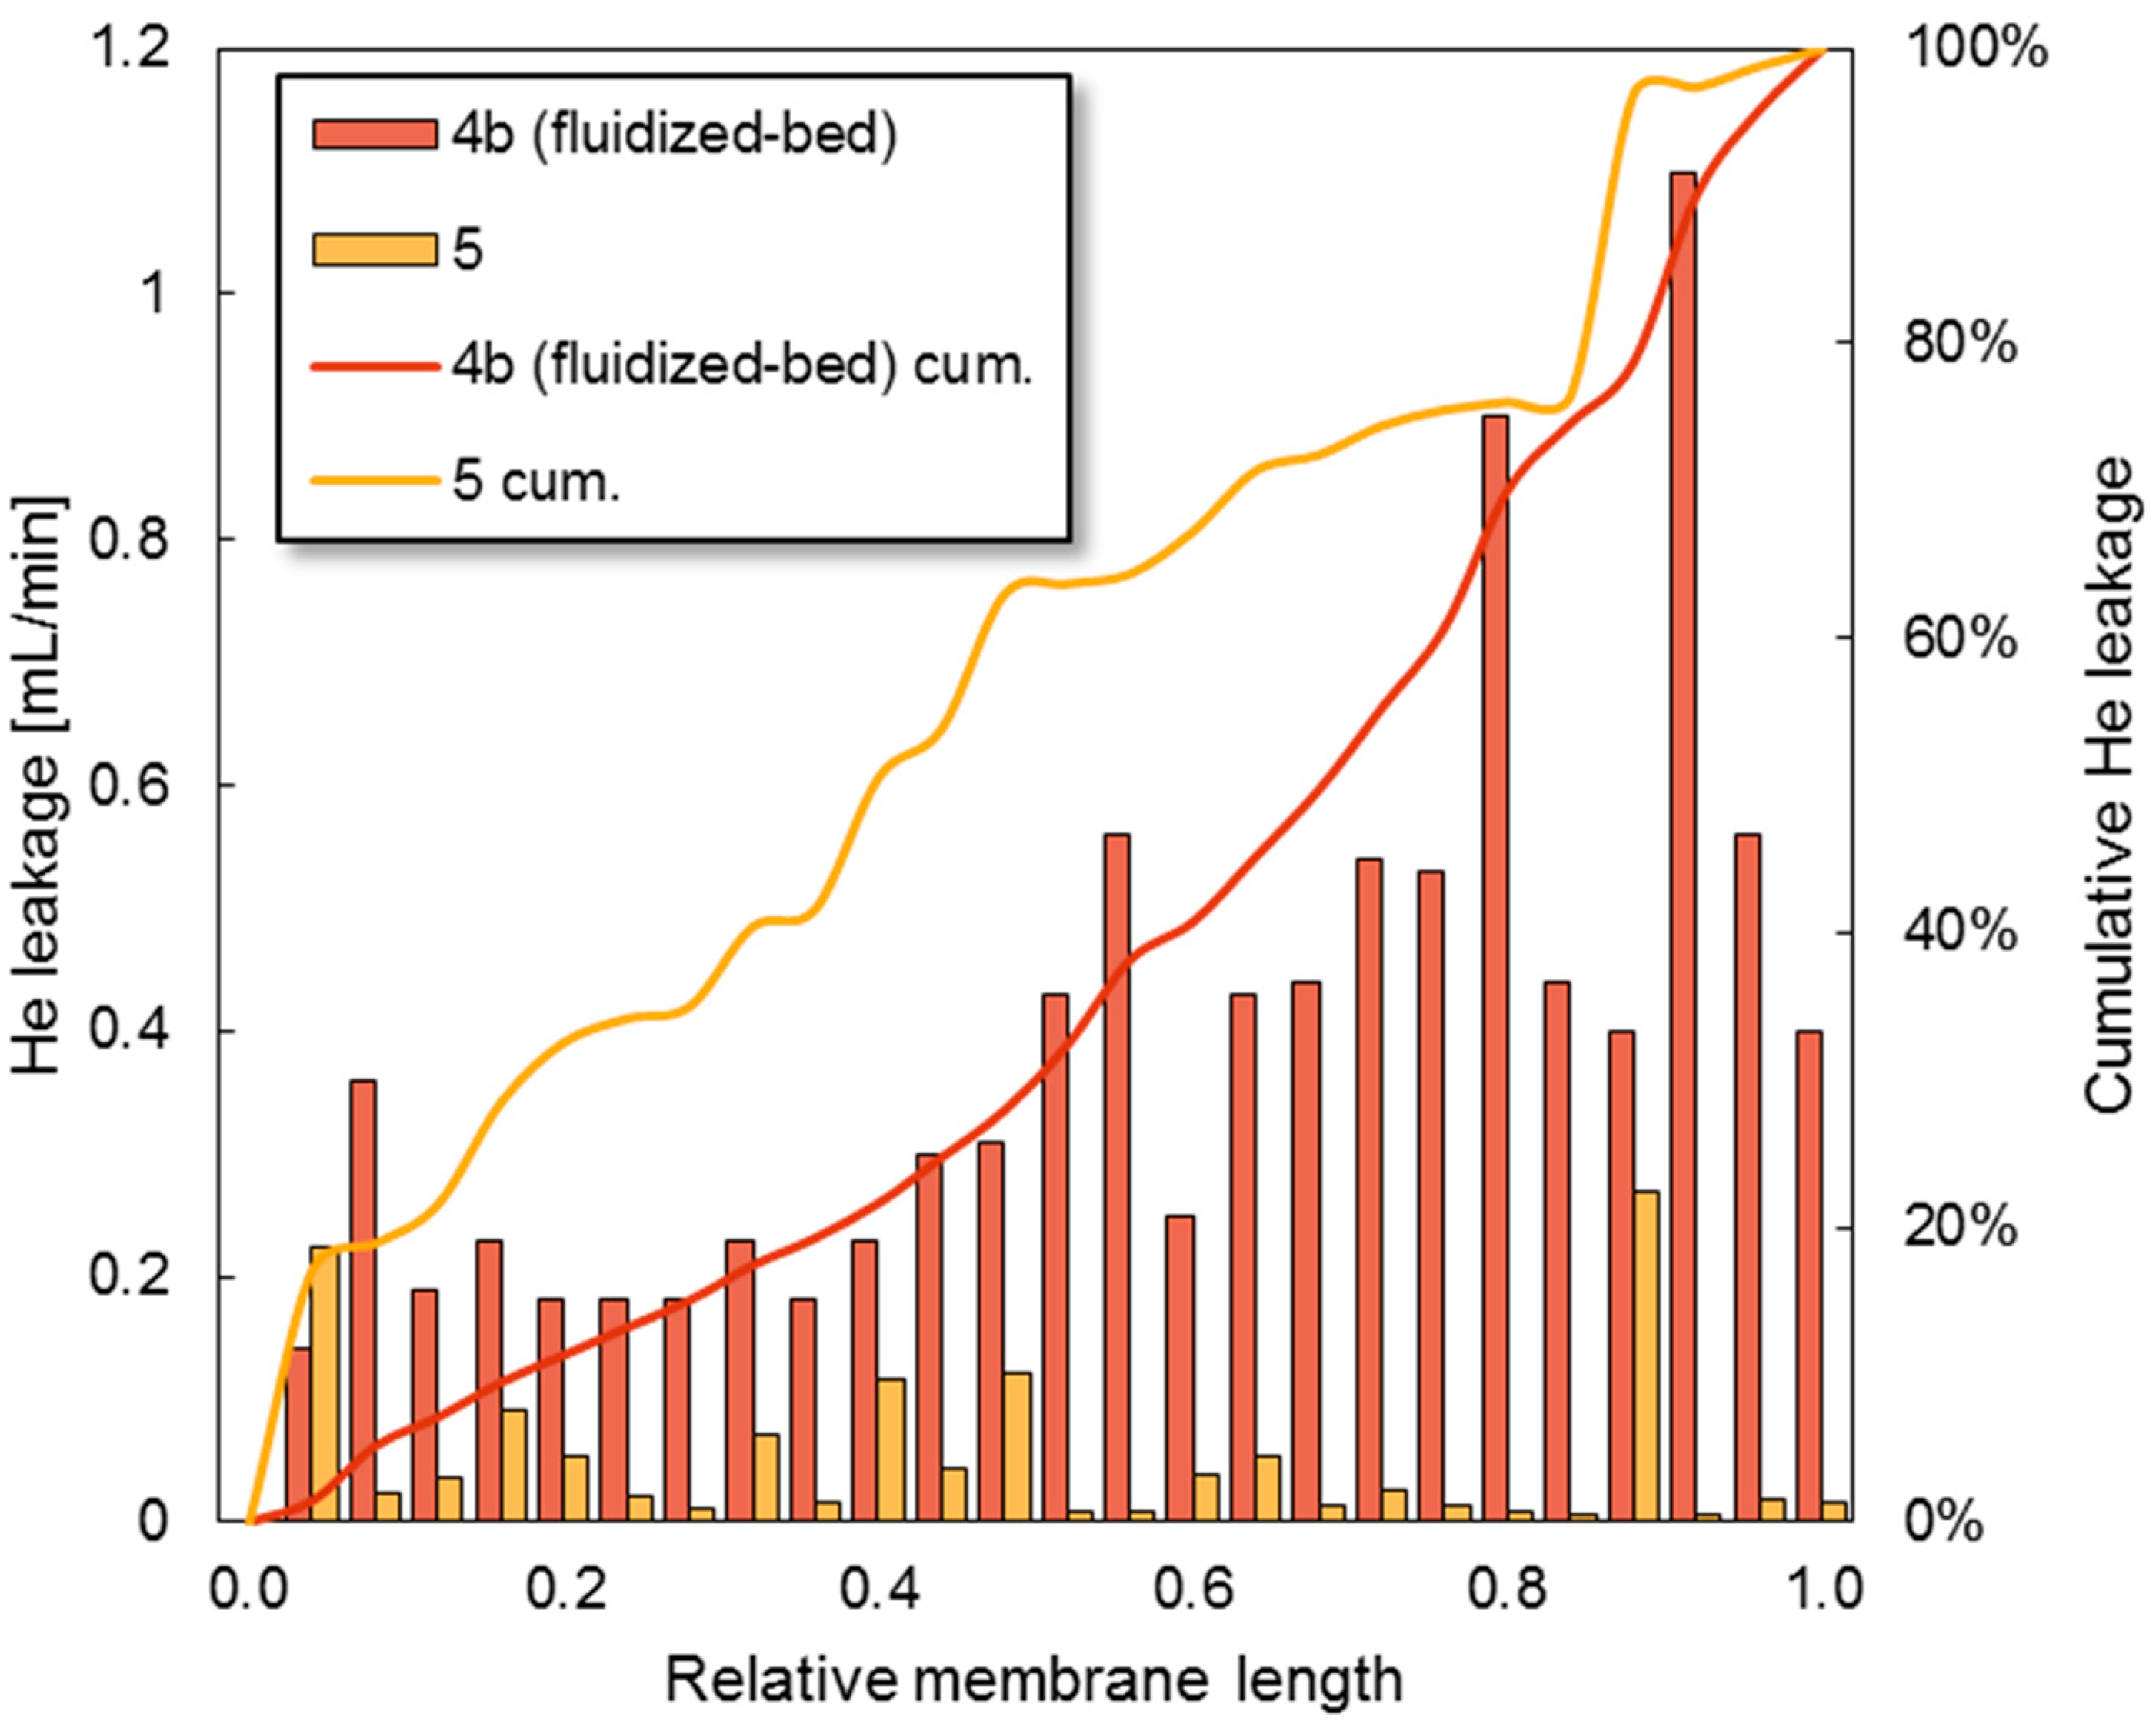
3.4. Fluidization Bed Conditions
3.5. Post Characterization
3.6. Post Mortem Characterization
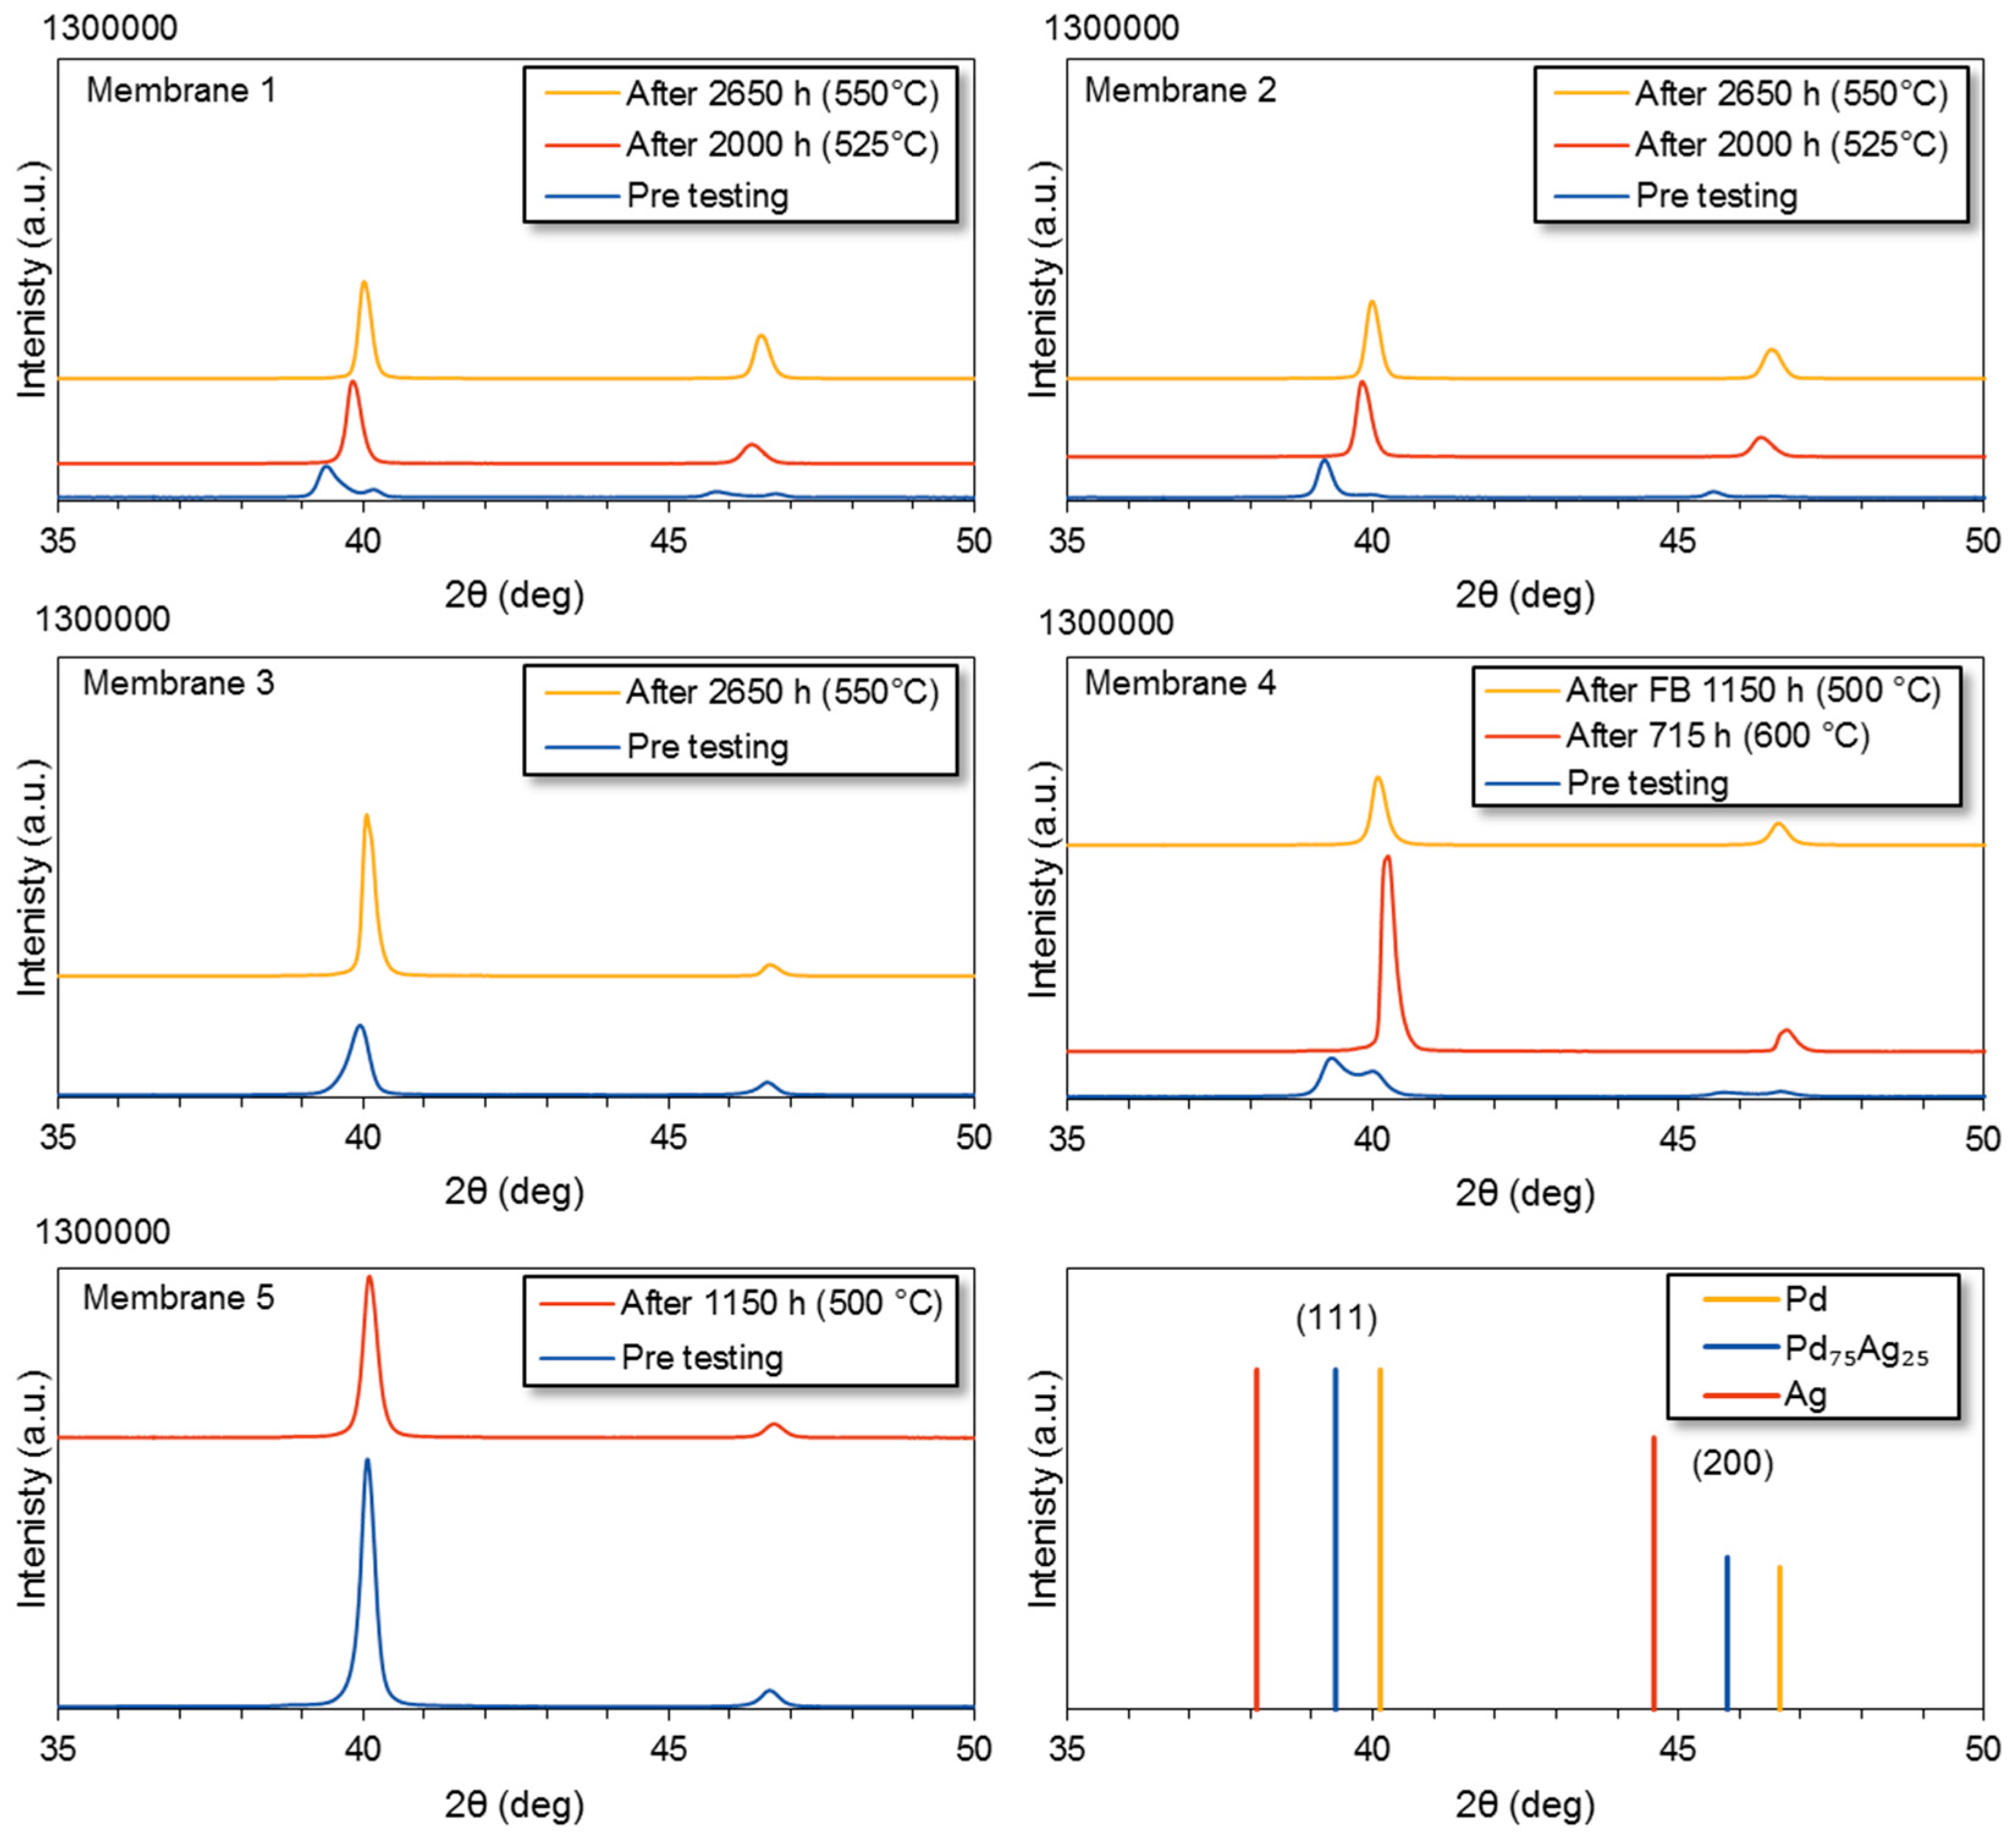
3.6.1. XRD
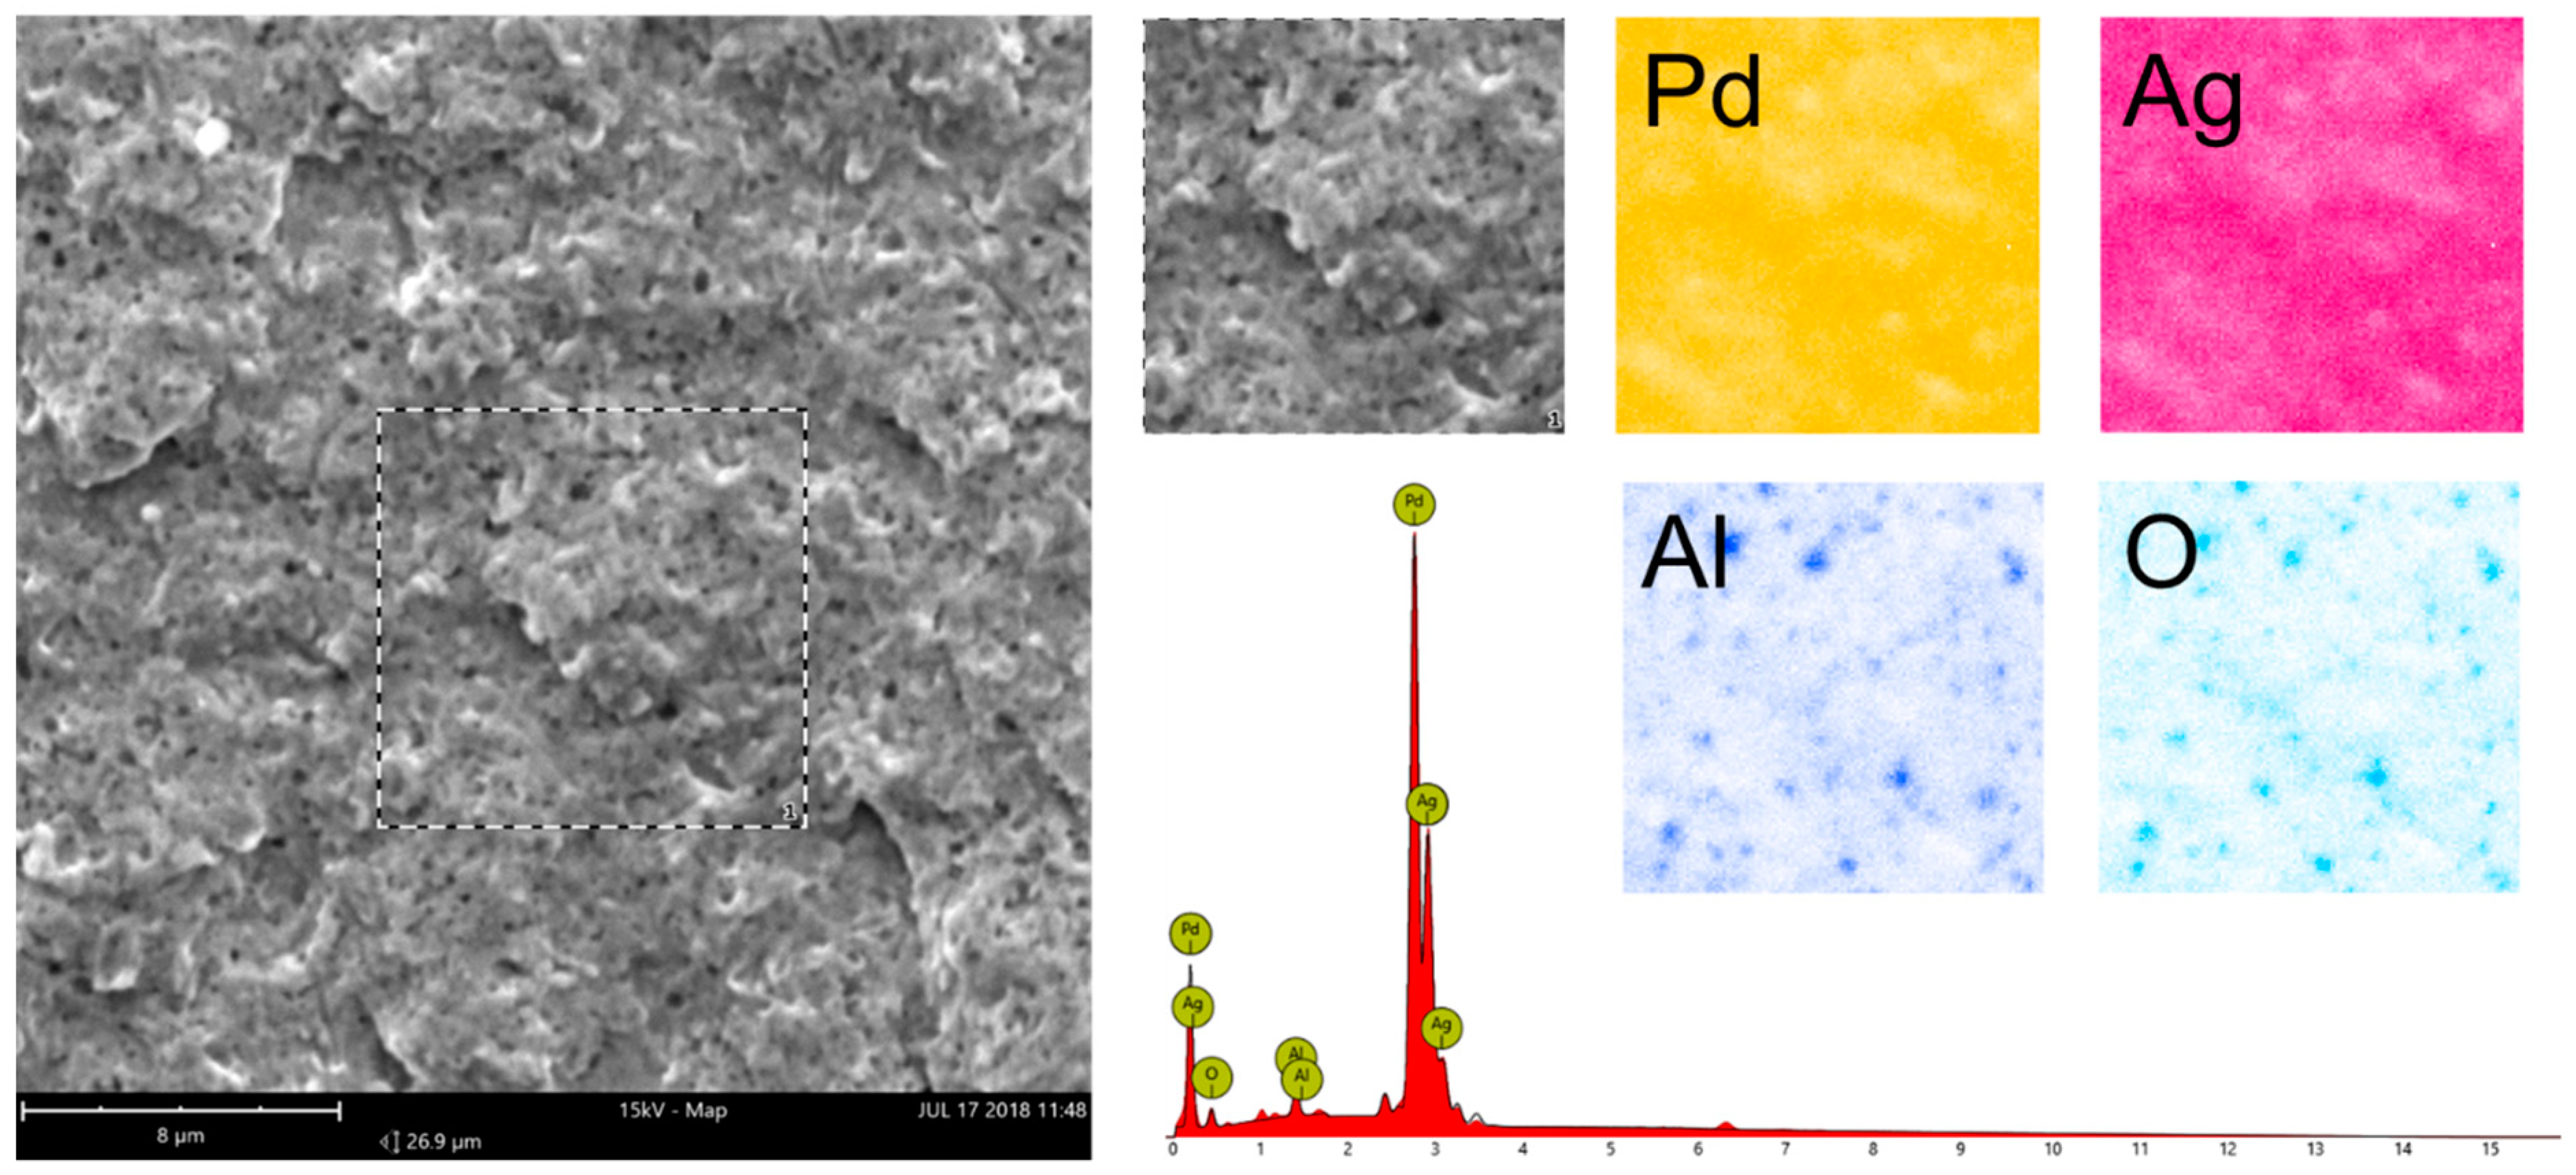
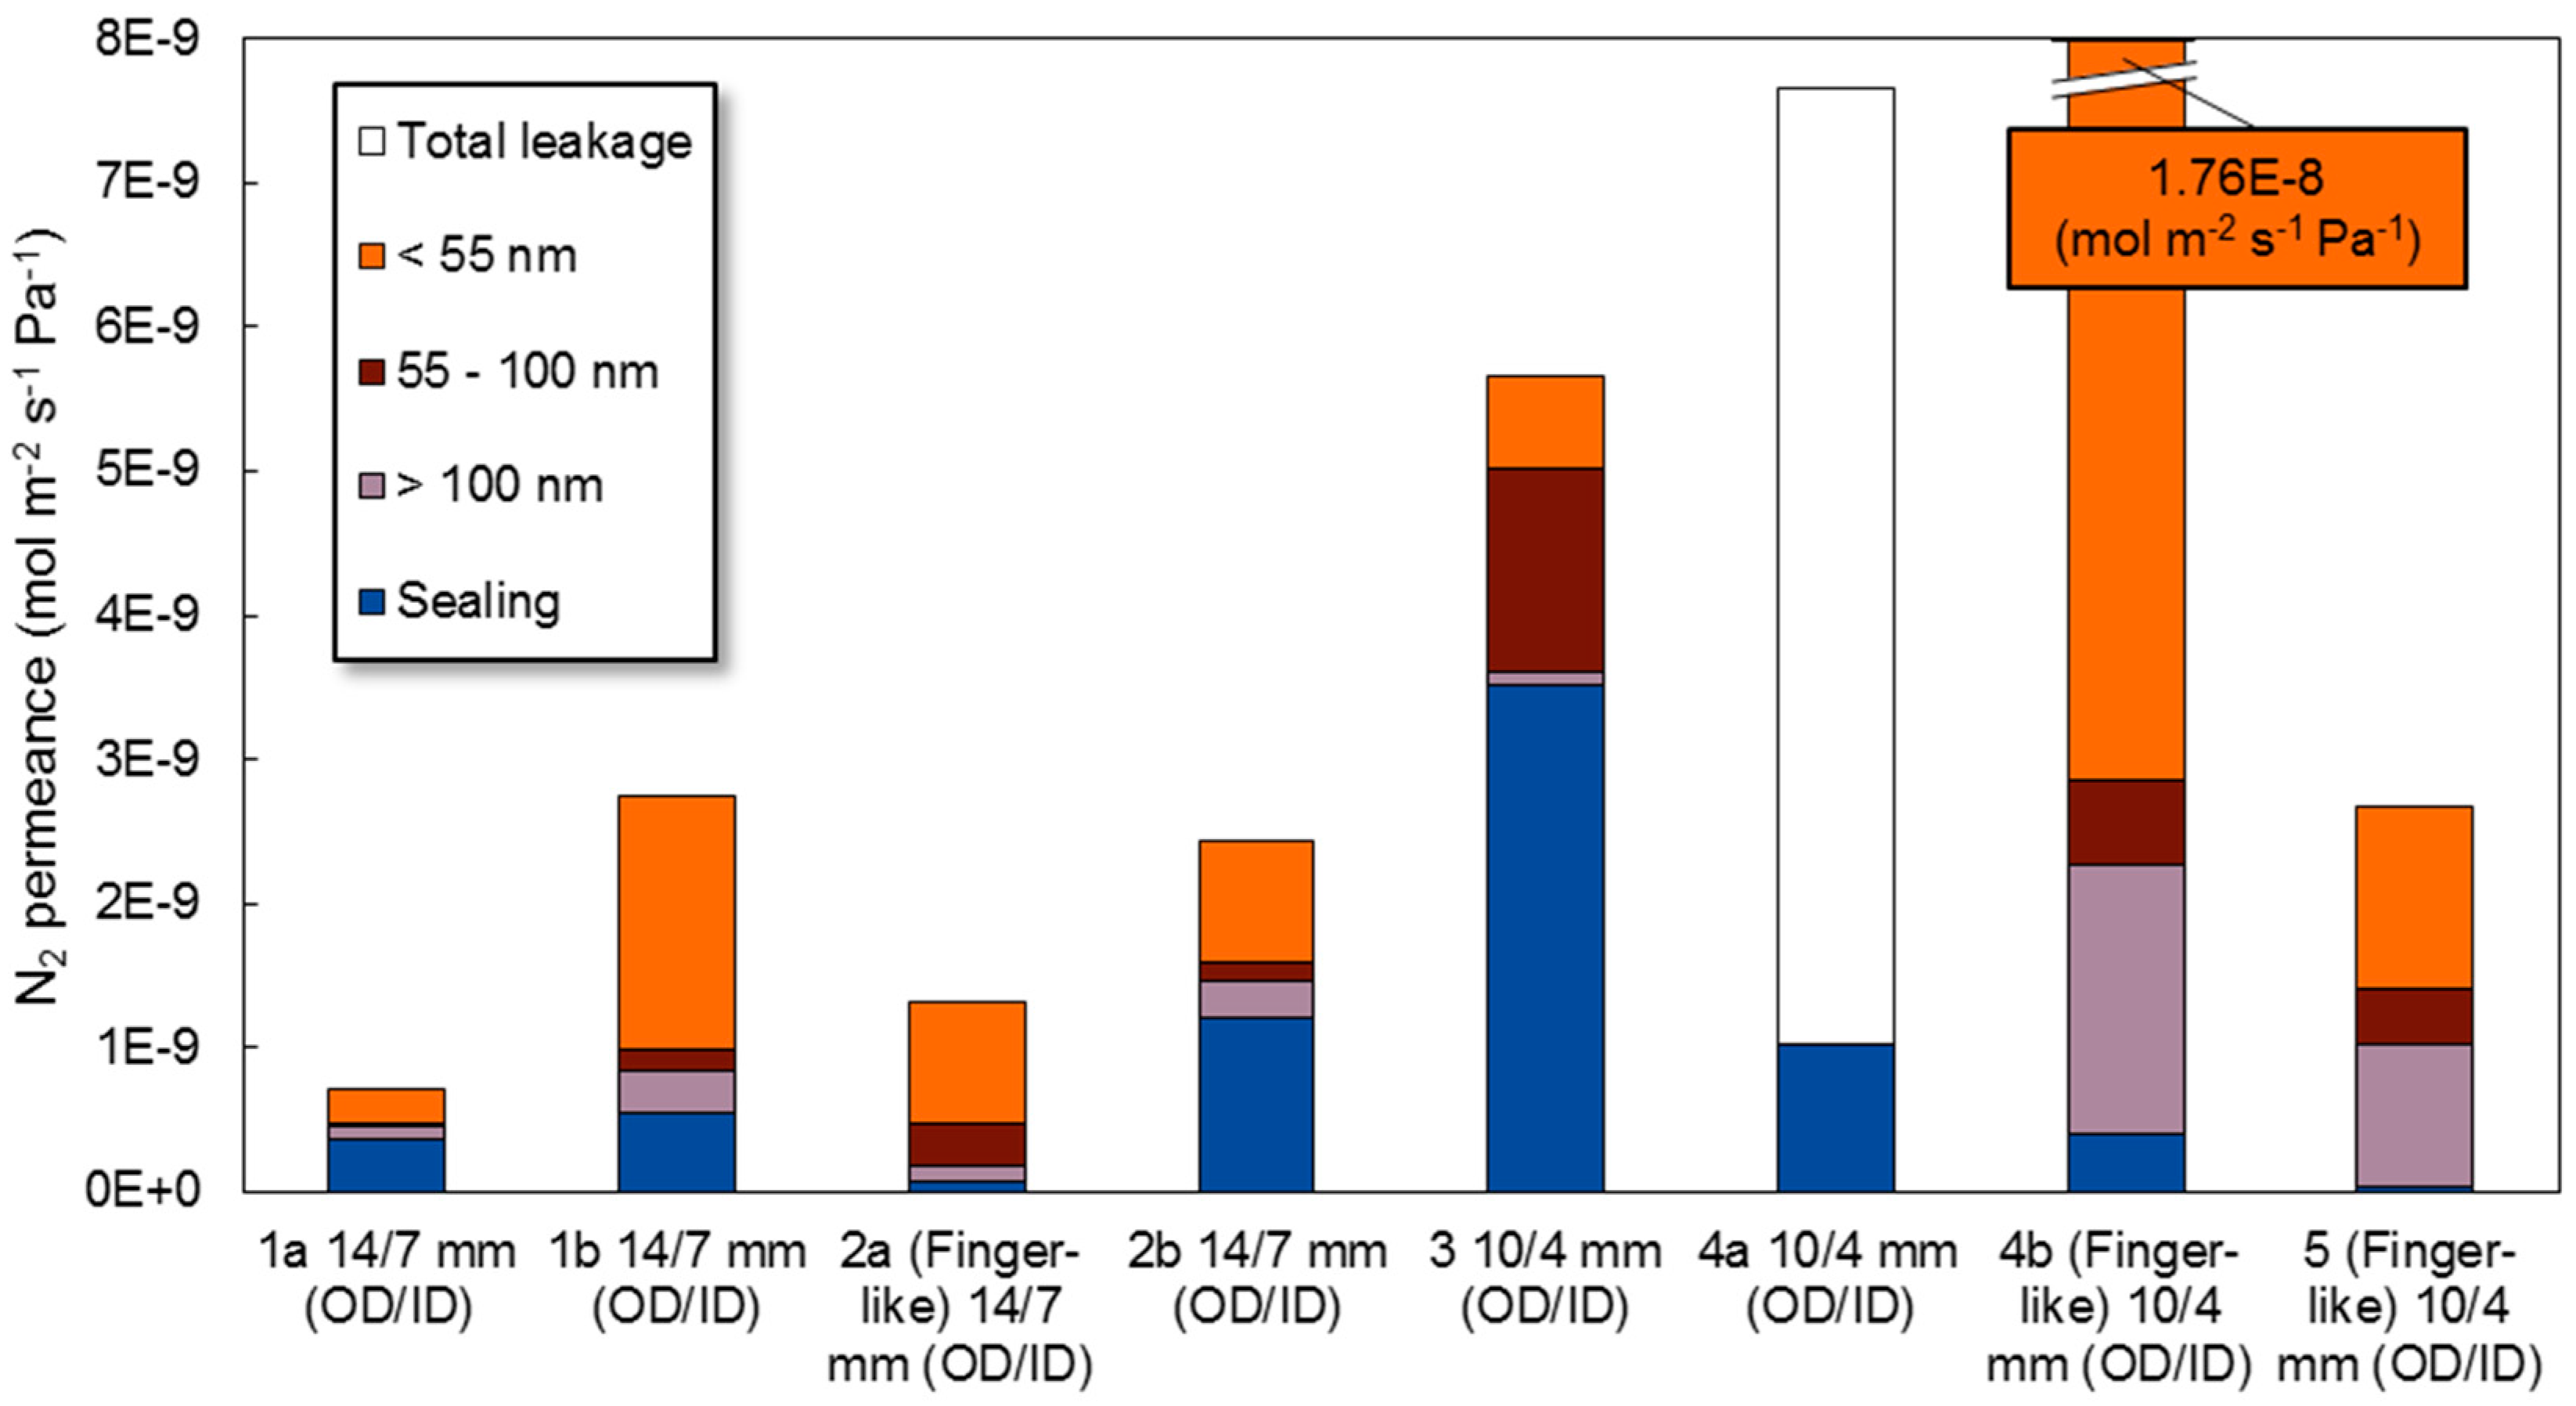
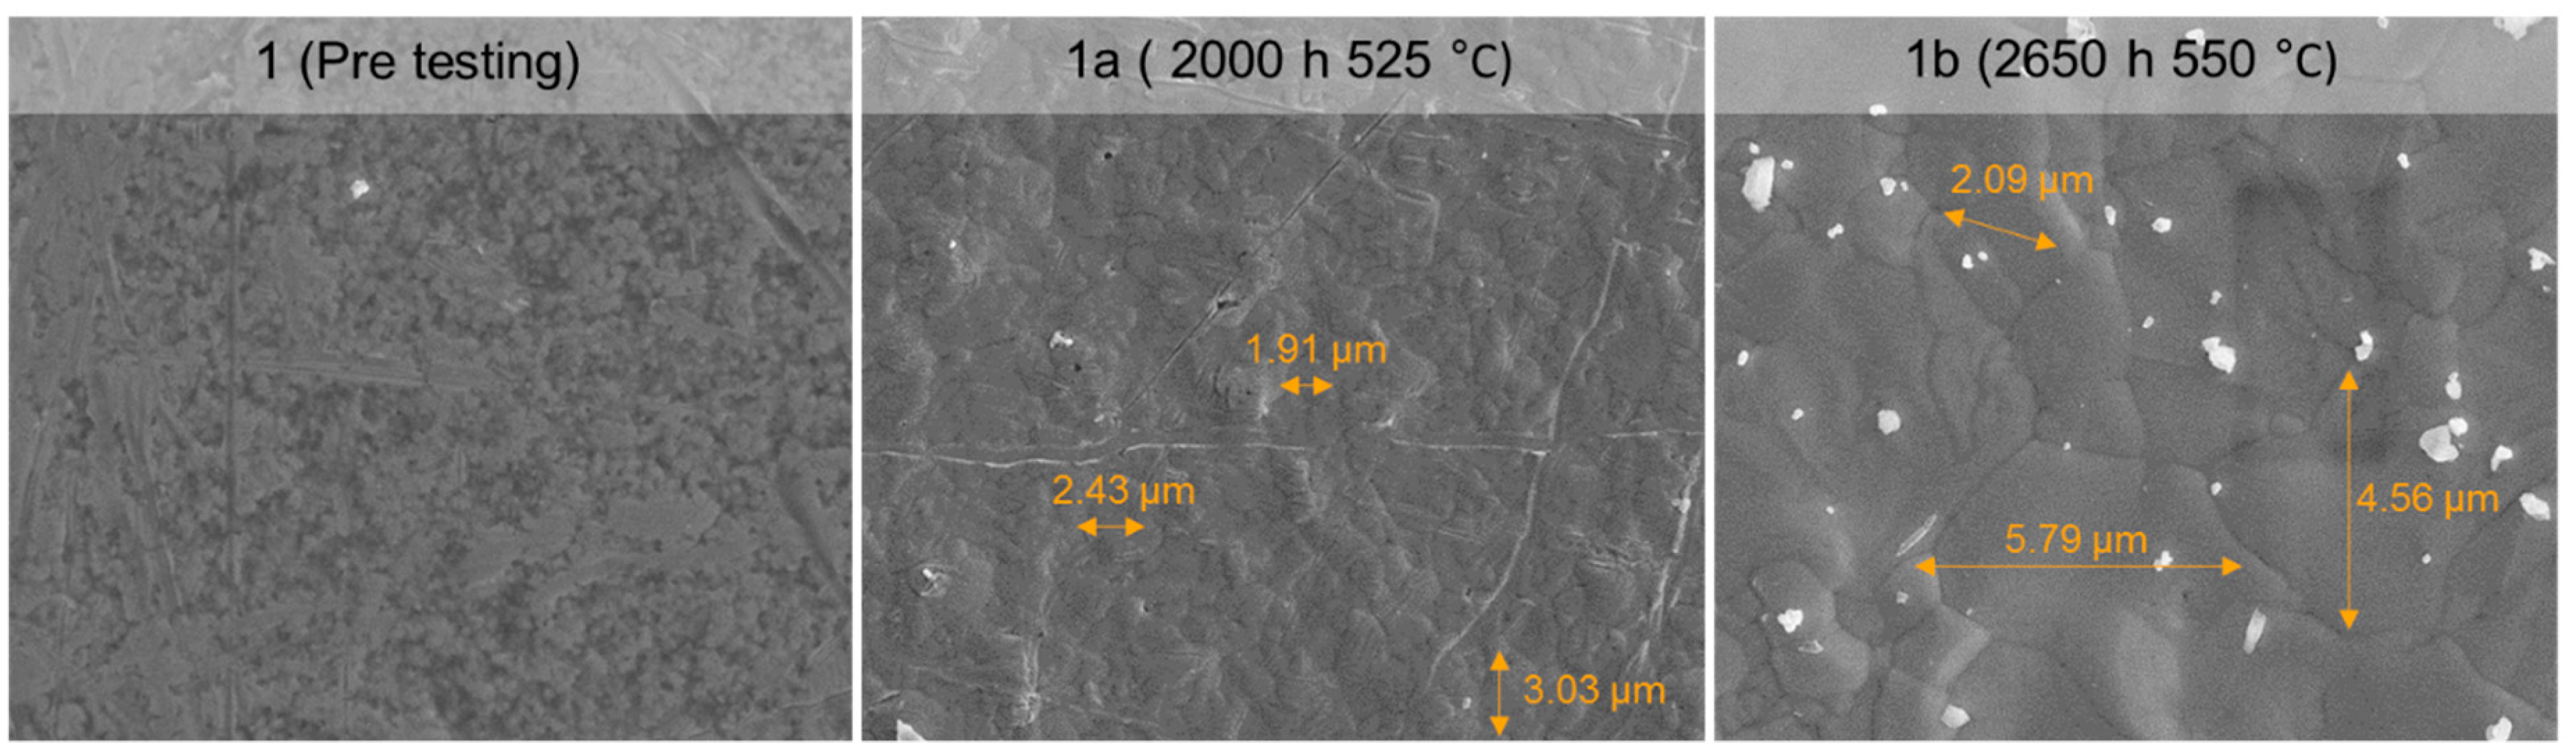
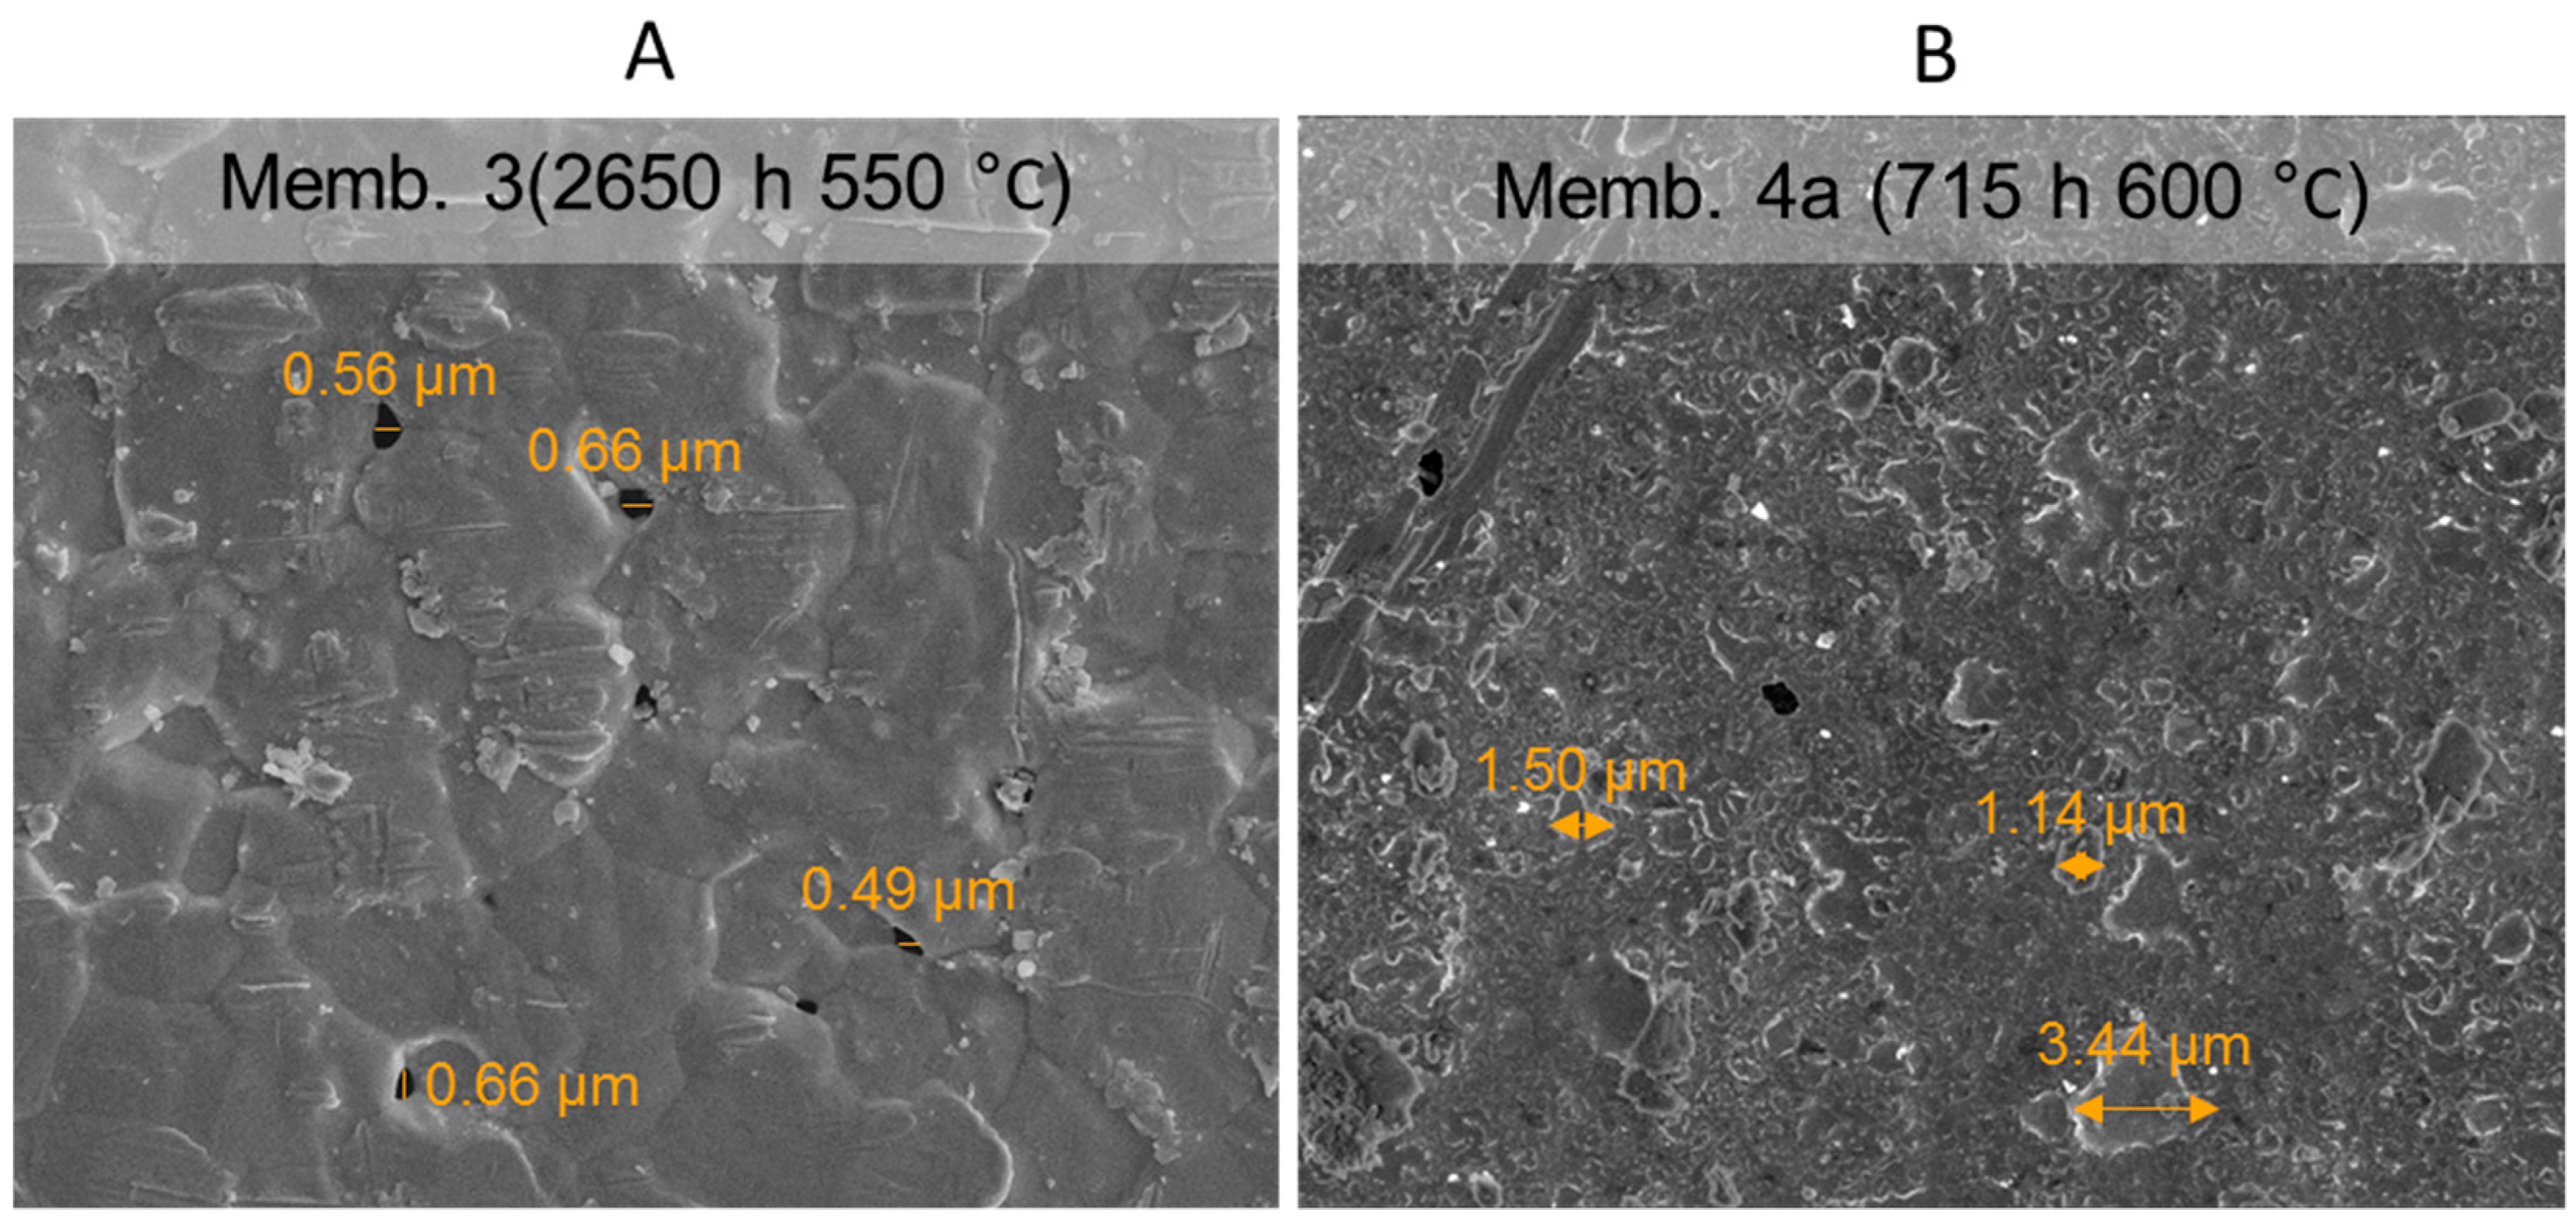
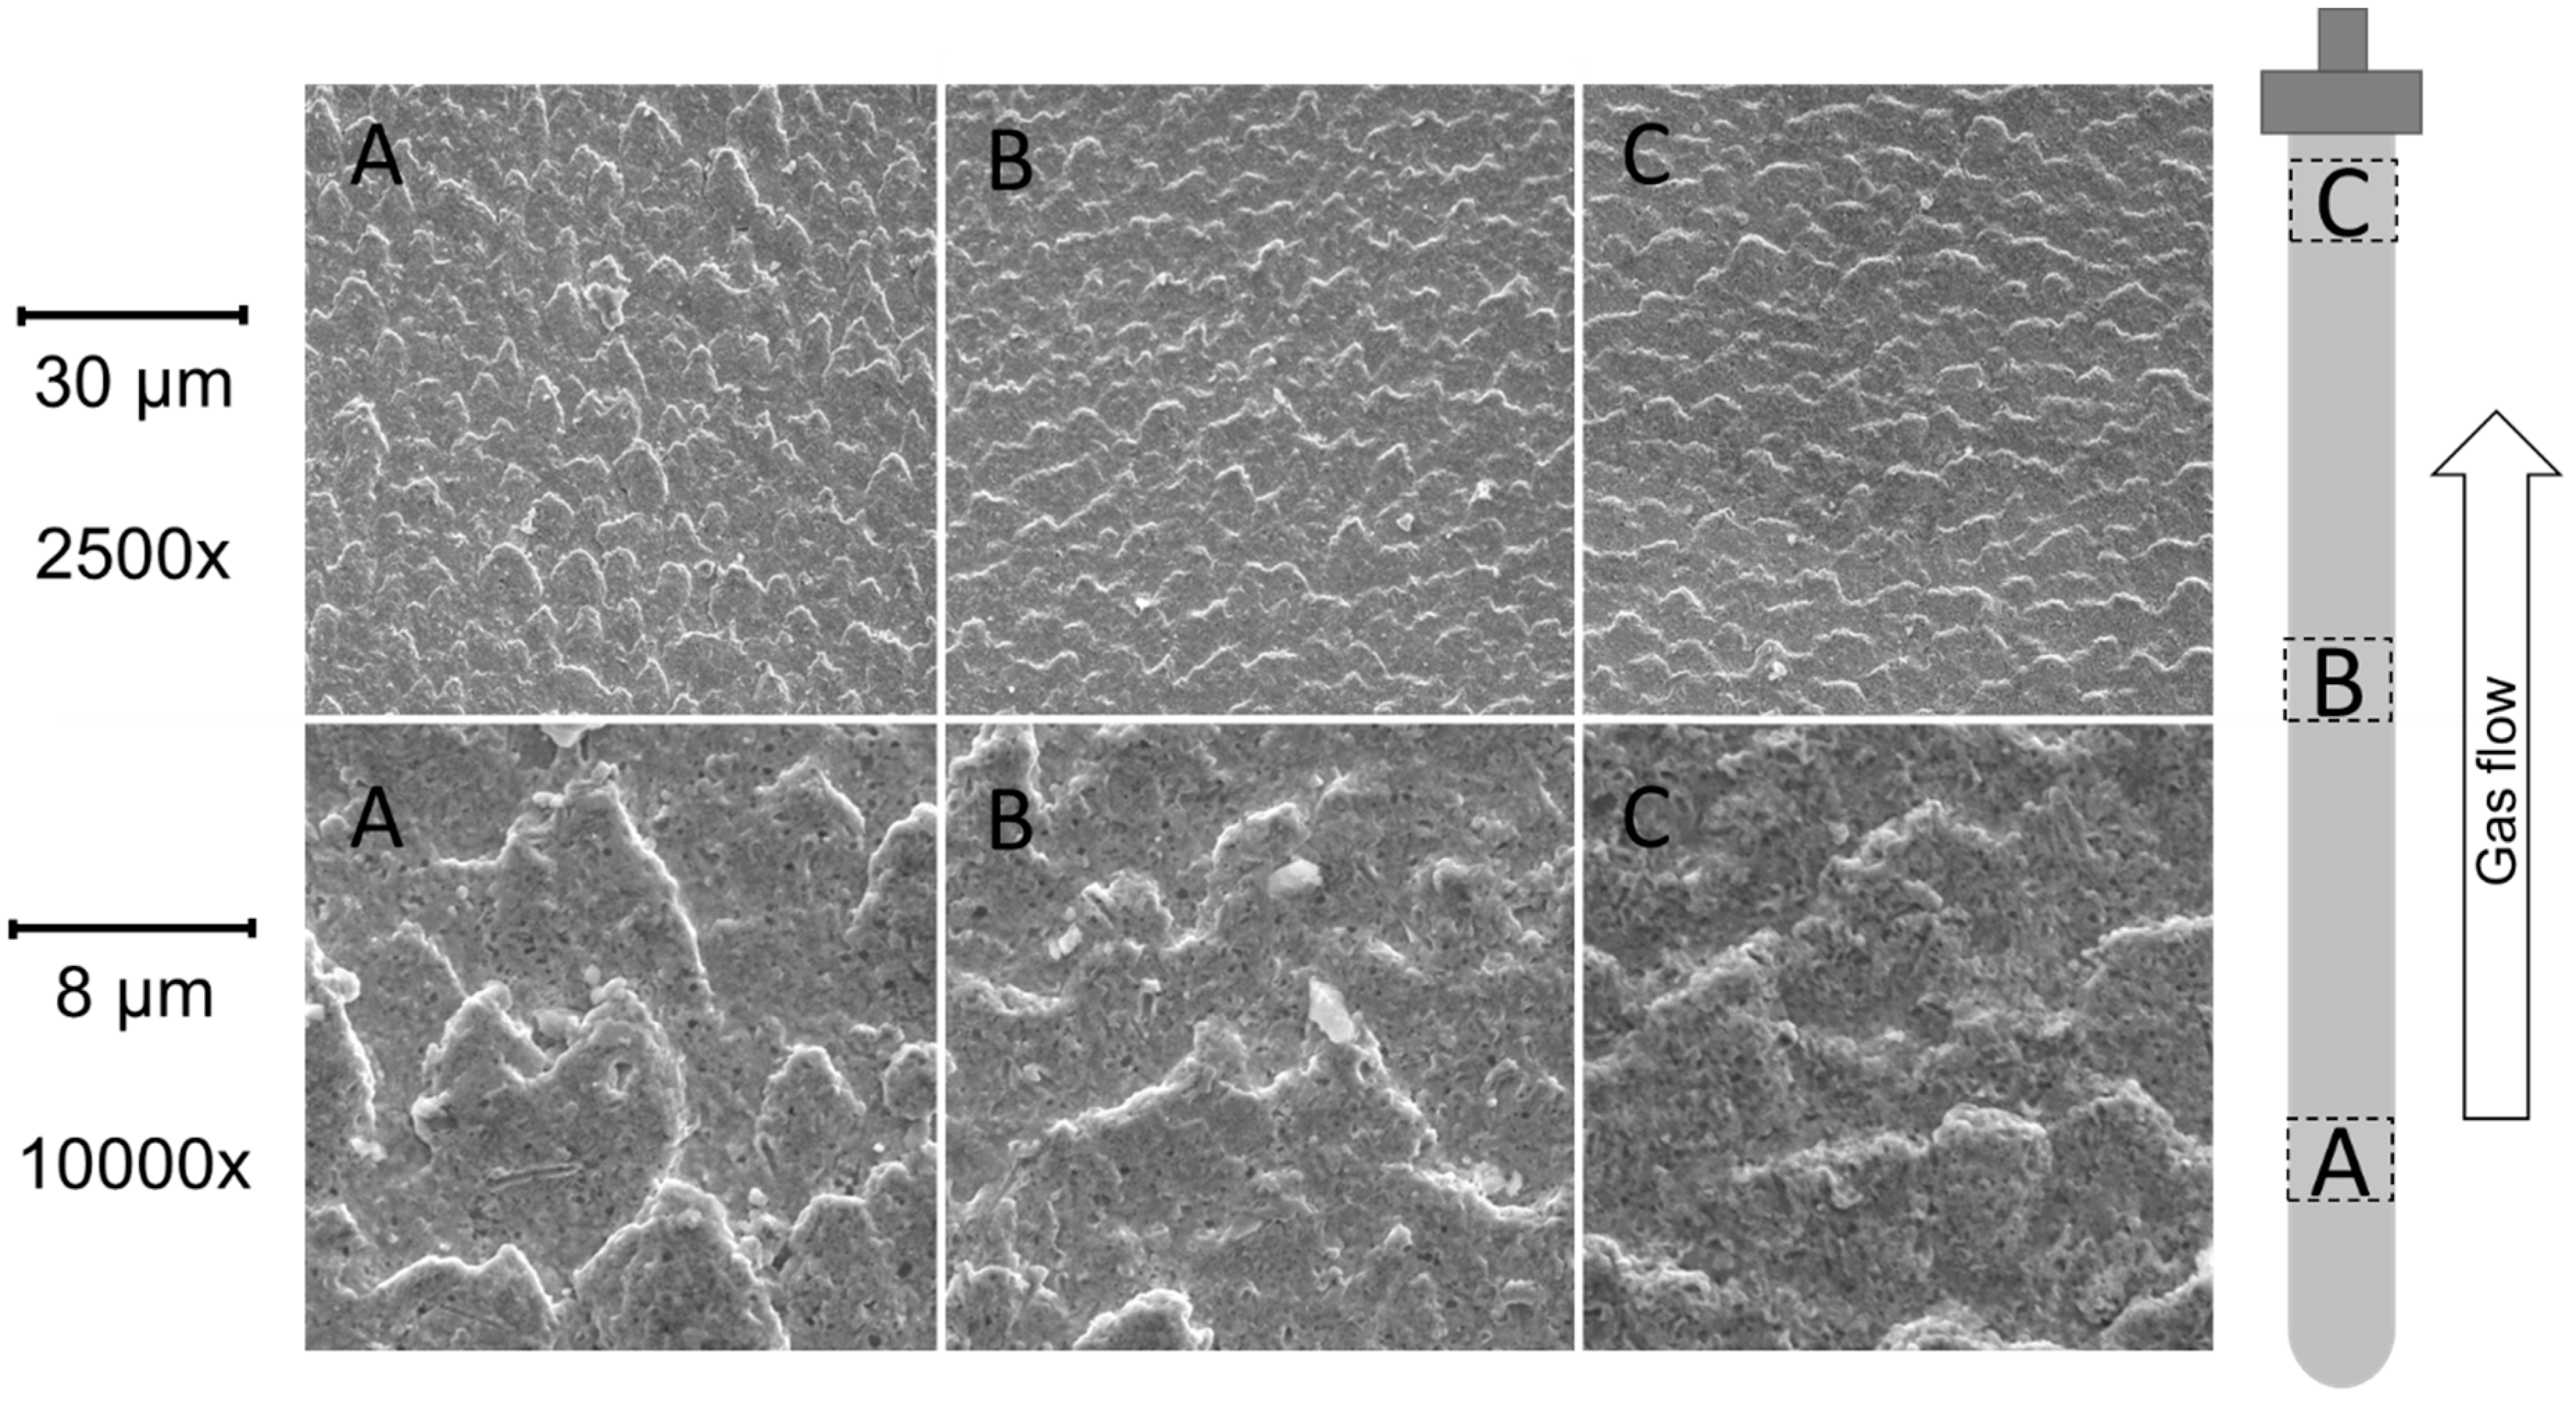
3.6.2. SEM Analysis
4. Conclusions
Author Contributions
Funding
Conflicts of Interest
Appendix A

| Membranes | Ideal H2/N2 Perm-Selectivity ∆P 1 bar/Total Time on Tream +- (h) | |||||||||||||
|---|---|---|---|---|---|---|---|---|---|---|---|---|---|---|
| 400 °C | 400 °C | 400 °C | 500 °C | 500 °C | 500 °C | 500 °C | 525 °C | 525 °C | 525 °C | 550 °C | 550 °C | 600 °C | 600 °C | |
| 1a 14/7 mm (OD/ID) | - | - | - | 9021 */0 | 10,083 */50 | 10,088 */300 | 8228/1060 | 9727/1060 | 4802/1960 | - | - | - | - | - |
| 1b 14/7 mm (OD/ID) | - | - | - | 7405/0 | 8928/50 | 7402/300 | 4687/1060 | 4521/1060 | 3162/1960 | 3178/2210 | 3263/2210 | 2391/2750 | - | - |
| 2a (Finger-like) 14/7 mm (OD/ID) | - | - | - | 8151/0 | 10,767/50 | 9403/300 | 8344/1060 | 6963/1060 | 4915/1960 | - | - | - | - | - |
| 2b 14/7 mm (OD/ID) | - | - | - | 7197 */0 | 7738 */50 | 7566 */300 | 7219 */1060 | 7654 */1060 | 5305/1960 | 4593/2210 | 4863/2210 | 3107/2750 | - | - |
| 3 10/4 mm (OD/ID) | - | - | - | 9301 */0 | 9547 */50 | 7061/300 | 2114/1060 | 2290/1060 | 1029/1960 | 887/2210 | 933/2210 | 755/2750 | - | - |
| 4a 10/7 mm (OD/ID) | 4125 */0 | 4745 */150 | - | 5826 */150 | 6788 */200 | - | - | - | - | - | 7319 */200 | 5066/480 | 4349/480 | 480/715 |
| 4b (Finger-like) 10/7 mm (OD/ID) | 3047/0 | 2498/150 | 2967 **/850 | 4921 **/850 | 2793 **/900 | 248 **/1150 | - | - | - | - | - | - | - | - |
| 5 (Finger-like) 10/7 mm (OD/ID) | 2746/0 | 2253/150 | 1762/850 | 3586/850 | 3047/900 | 2950/1150 | - | - | - | - | - | - | - | - |
References
- Yang, L.; Ge, X.; Wan, C.; Yu, F.; Li, Y. Progress and perspectives in converting biogas to transportation fuels. Renew. Sustain. Energy Rev. 2014, 40, 1133–1152. [Google Scholar] [CrossRef]
- Gallucci, F.; Fernandez, E.; Corengia, P.; van Sint, M.; Annaland, M.V.; van Sint, M. Recent advances on membranes and membrane reactors for hydrogen production. Chem. Eng. Sci. 2013, 92, 40–66. [Google Scholar] [CrossRef]
- Plazaola, A.A.; Tanaka, D.A.P.; Annaland, M.v.; Gallucci, F. Recent Advances in Pd-Based Membranes for Membrane Reactors. Molecules 2017, 22, 51. [Google Scholar] [CrossRef] [PubMed]
- Uemiya, S.; Sato, N.; Ando, H.; Matsuda, T. Steam reforming of methane in a hydrogen-permeable membrane reactor. Appl. Catal. 1991, 67, 223–230. [Google Scholar] [CrossRef]
- Seelam, P.K.; Liguori, S.; Iulianelli, A.; Pinacci, P.; Calabrò, V.; Huuhtanen, M.; Keiski, R.; Piemonte, V.; Tosti, S.; De Falco, M.; et al. Hydrogen production from bio-ethanol steam reforming reaction in a Pd/PSS membrane reactor. Catal. Today 2012, 193, 42–48. [Google Scholar] [CrossRef]
- Islam, M.A.; Ilias, S. Steam Reforming of Methanol in a Pd-Composite Membrane Reactor Steam Reforming of Methanol in a Pd-Composite Membrane Reactor. Sep. Sci. Technol. 2012, 47, 2177–2185. [Google Scholar] [CrossRef]
- Yun, S.; Lim, H.; Oyama, S.T. Experimental and kinetic studies of the ethanol steam reforming reaction equipped with ultrathin Pd and Pd-Cu membranes for improved conversion and hydrogen yield. J. Memb. Sci. 2012. [Google Scholar] [CrossRef]
- Okazaki, J.; Ikeda, T.; Pacheco, D.A.; Sato, K.; Suzuki, T.M.; Mizukami, F. An investigation of thermal stability of thin palladium-silver alloy membranes for high temperature hydrogen separation. J. Memb. Sci. 2011, 366, 212–219. [Google Scholar] [CrossRef]
- Fernandez, E.; Helmi, A.; Coenen, K.; Melendez, J.; Viviente, J.L.; Tanaka, D.A.P.; Sint Annaland, M.; Gallucci, F. Development of thin Pd-Ag supported membranes for fluidized bed membrane reactors including WGS related gases. Int. J. Hydrogen Energy 2015, 40, 3506–3519. [Google Scholar] [CrossRef]
- Mejdell, A.L.; Jøndahl, M.; Peters, T.A.; Bredesen, R.; Venvik, H.J. Experimental investigation of a microchannel membrane configuration with a 1.4 μm Pd/Ag23 wt.% membrane-Effects of flow and pressure. J. Memb. Sci. 2009, 327, 6–10. [Google Scholar] [CrossRef]
- Liguori, S.; Iulianelli, A.; Dalena, F.; Piemonte, V.; Huang, Y.; Basile, A. Methanol steam reforming in an Al 2 O 3 supported thin Pd-layer membrane reactor over Cu/ZnO/Al2O3 catalyst. Int. J. Hydrogen Energy 2013, 39, 18702–18710. [Google Scholar] [CrossRef]
- Abu, H.W.; Hawa, E.; Paglieri, S.N.; Morris, C.C.; Harale, A.; Way, J.D. Application of a Pd–Ru composite membrane to hydrogen production in a high temperature membrane reactor. Sep. Purif. Technol. 2015, 147, 388–397. [Google Scholar] [CrossRef]
- Iulianelli, A.; Liguori, S.; Huang, Y.; Basile, A. Model biogas steam reforming in a thin Pd-supported membrane reactor to generate clean hydrogen for fuel cells. J. Power Sources 2015, 273, 25–32. [Google Scholar] [CrossRef]
- Van Delft, Y.C.; Sumbharaju, R.; Meyer, D.F.; de Groot, A.; Sari, M. Steam reforming of methane in a bench-scale membrane reactor at realistic working conditions. Catal. Today 2012, 193, 74–80. [Google Scholar] [CrossRef]
- Shirasaki, Y.; Tsuneki, T.; Ota, Y.; Yasuda, I.; Tachibana, S.; Nakajima, H.; Kobayashi, K. Development of membrane reformer system for highly efficient hydrogen production from natural gas. Int. J. Hydrogen Energy 2009, 34, 4482–4487. [Google Scholar] [CrossRef]
- Roses, L.; Gallucci, F.; Manzolini, G.; Annaland, M.v.; van Sint, M. Experimental study of steam methane reforming in a Pd-based fluidized bed membrane reactor. Chem. Eng. J. 2013, 222, 307–320. [Google Scholar] [CrossRef]
- Spallina, V.; Matturro, G.; Ruocco, C.; Meloni, E.; Palma, V.; Fernandez, E.; Melendez, J.; Tanaka, P.; Viviente Sole, J.L.; Sint Annaland, M.; et al. Direct route from ethanol to pure hydrogen through autothermal reforming in a membrane reactor: Experimental demonstration, reactor modelling and design. Energy 2018, 143, 666–681. [Google Scholar] [CrossRef] [Green Version]
- Tanaka, D.A.P.; Tanco, M.A.L.; Niwa, S.I.; Wakui, Y.; Mizukami, F.; Namba, T.; Suzuki, T.M. Preparation of palladium and silver alloy membrane on a porous α-alumina tube via simultaneous electroless plating. J. Memb. Sci. 2005. [Google Scholar] [CrossRef]
- De Nooijer, N.; Gallucci, F.; Pellizzari, E.; Melendez, J.; Tanaka, D.A.P.; Manzolini, G.; Sint Annaland, M. On concentration polarisation in a fluidized bed membrane reactor for biogas steam reforming: Modelling and experimental validation. Chem. Eng. J. 2018, 348, 232–243. [Google Scholar] [CrossRef]
- ASTM International. ASTM F316-03—Standard Test Methods for Pore Size Characteristics of Membrane Filters by Bubble Point and Mean Flow Pore Test; ASTM International: West Conshohocken, PA, USA, 2014. [Google Scholar] [CrossRef]
- Günther, C.; Prehn, V.; Wölfel, T. New Membrane Applications in Liquid and Gas Seperation. In Proceedings of the 15th International Conference Inorganic Membranes, Dresden, Germany, 18–22 June 2018. [Google Scholar]
- Peters, T.A.; Stange, M.; Bredesen, R. On the high pressure performance of thin supported Pd-23%Ag membranes-Evidence of ultrahigh hydrogen flux after air treatment. J. Memb. Sci. 2011, 378, 28–34. [Google Scholar] [CrossRef]
- Mejdell, A.L.; Klette, H.; Ramachandran, A.; Borg, A.; Bredesen, R. Hydrogen permeation of thin, free-standing Pd/Ag23% membranes before and after heat treatment in air. J. Memb. Sci. 2008, 307, 96–104. [Google Scholar] [CrossRef]
- Yang, L.; Zhang, Z.; Gao, X.; Guo, Y.; Wang, B. Changes in hydrogen permeability and surface state of Pd–Ag/ceramic composite membranes after thermal treatment. J. Membr. Sci. 2005, 252, 145–154. [Google Scholar] [CrossRef]
- Roa, F.; Way, J.D. The effect of air exposure on palladium–copper composite membranes. Appl. Surf. Sci. 2005, 240, 85–104. [Google Scholar] [CrossRef]
- Zemlyanov, D.; Klötzer, B.; Gabasch, H.; Smeltz, A. Kinetics of Palladium Oxidation in the mbar Pressure Range: Ambient Pressure XPS Study. Topics Catal. 2013, 56. [Google Scholar] [CrossRef]
- Rollett, A.; Humphreys, F.; Rohrer, G.S.; Hatherly, M. Recrystallization and Related Annealing Phenomena, 2nd ed.; Pergamon Press: Oxford, UK, 2004. [Google Scholar] [CrossRef]
- Abu, H.W.; Hawa, E.; Paglieri, S.N.; Morris, C.C.; Harale, A.; Way, J.D. Identi fi cation of thermally stable Pd-alloy composite membranes for high temperature applications. J. Memb. Sci. 2014, 466, 151–160. [Google Scholar] [CrossRef]
- Melendez, J.; de Nooijer, N.; Coenen, K.; Fernandez, E.; Viviente, J.L.; Annaland, M.V.; Arias, P.L.; PachecoTanaka, D.A.; Gallucci, F. Effect of Au addition on hydrogen permeation and the resistance to H2S on Pd-Ag alloy membranes. J. Memb. Sci. 2017, 542, 329–341. [Google Scholar] [CrossRef]
- Peters, T.A.; Carvalho, P.A.; van Wees, J.F.; Overbeek, J.P.; Sagvolden, E.; van Berkel, F.P.F.; Løvvik, O.M.; Bredesen, R. Leakage evolution and atomic-scale changes in Pd-based membranes induced by long-term hydrogen permeation. J. Memb. Sci. 2018, 563, 398–404. [Google Scholar] [CrossRef]
- Kunii, D.; Levenspiel, O. Bubbling Fluidized Beds. In Fluidization Engineering; Elsevier: Amsterdam, The Netherlands, 1991. [Google Scholar] [CrossRef]
- Stuhr, U.; Striffler, T.; Wipf, H.; Natter, H.; Wettmann, B.; Janssen, S.; Hempelmann, R.; Hahn, H. An investigation of hydrogen diffusion in nanocrystalline Pd by neutron spectroscopy. J. Alloys Compd. 1997, 254, 393–396. [Google Scholar] [CrossRef]
- Bryden, K.J.; Ying, J.Y. Nanostructured palladium–iron membranes for hydrogen separation and membrane hydrogenation reactions. J. Membr. Sci. 2002, 203, 29–42. [Google Scholar] [CrossRef]
- Guazzone, F.; Ma, Y.H. Leak Growth Mechanism in Composite Pd Membranes Prepared by the Electroless Deposition Method. AIChE J. 2008, 54, 487–494. [Google Scholar] [CrossRef]
- Peters, T.A.; Tucho, W.M.; Ramachandran, A.; Stange, M.; Walmsley, J.C.; Holmestad, R.; Borg, A.; Bredesen, R. Thin Pd-23%Ag/stainless steel composite membranes: Long-term stability, life-time estimation and post-process characterisation. J. Memb. Sci. 2009, 326, 572–581. [Google Scholar] [CrossRef]
- Haslam, A.J.; Phillpot, S.R.; Wolf, D.; Moldovan, D.; Gleiter, H. Mechanisms of grain growth in nanocrystalline fcc metals by molecular-dynamics simulation. Mater. Sci. Eng. A 2001, 318, 293–312. [Google Scholar] [CrossRef]
- Helmi, A.; Fernandez, E.; Melendez, J.; Alfredo, D.; Tanaka, P.; Gallucci, F.; van Sint Annaland, M. Fluidized bed membrane reactors for ultra pure H2 production—A step forward towards commercialization. Molecules 2016, 21, 376. [Google Scholar] [CrossRef] [PubMed]
- Arratibel, A.; Tanaka, A.P.; Laso, I.; Annaland, M.v.; Gallucci, F.; Pacheco, A. Development of Pd-based double-skinned membranes for hydrogen production in fluidized bed membrane reactors. J. Memb. Sci. 2018, 550, 536–544. [Google Scholar] [CrossRef]


| Reactor Configuration | Feed | Membrane | Membrane Thickness (µm) | Temperature (°C) | Pressure (bar) | Time (h) | Stability Results | H2 Purity (%) | Source |
|---|---|---|---|---|---|---|---|---|---|
| PB | CH4 | Pd glass support | 20 | 350−500 | 1–9 | 10 |
| - | [4] |
| PB | Ethanol | Pd and PdCu | 1.3 and 2 | 280–360 | 1 | 45 |
| 100 | [7] |
| PB | methanol | Pd/Al2O3 | ~7 | 280–330 | 1.5–2.5 | 1000 |
| ~100 | [11] |
| PB | Methanol | Pd (support not specified) | 24.3 | 200–300 | 1–3.44 | 36 |
| - | [6] |
| PB | CH4 | PdRu (PSS/YSZ) | 5 | ~580 | 29 | 1000 |
| >93 | [12] |
| PB | CH4/CO2 | Pd/Al2O3 | ~10 | 380–450 | 2.5–3.5 | 1000 |
| 96–70 | [13] |
| PB | CH4 | Pd/Al2O3 | ~3.8 | 580 | 28 | 1100 |
| 92–86 | [14] |
| PB | NG | Pd stainless steel supported | 20 | 495–540 | 9 | 3310 |
| >99.99 | [15] |
| FB | CH4 | PdAg (Inconel) | 3 + 1.5 out + in | 500–630 | 2.0–5.3 | 260 |
| - | [16] |
| FB | EtOH | PdAg/Al2O3 | ~3–4 | 450–550 | 2–4 | 50 |
| - | [17] |
| Membrane | ELP Time (h) | Pd% | Ag% |
|---|---|---|---|
| 1 | 5 | 94.7 | 5.3 |
| 2 | 5 | 94.8 | 5.2 |
| 3 | 5 | 95.1 | 4.9 |
| 4 | 5 | 95.1 | 4.9 |
| 5 | 6 | 92.4 | 7.6 |
| Membrane | Reactor Configuration | Support | Sealing | Length (mm) | Temperature (°C) | Time Tested (h) | On Stream 1 | ||
|---|---|---|---|---|---|---|---|---|---|
| Number | Material | Size Ø Outer/Inner (mm) | Top | Bottom | |||||
| 1a | 5 membranes Empty tube | Pd-Ag Al2O3 100 nm | 14/7 | Swagelok 12 Nm | Swagelok 12 Nm | 105 | 400–525 | 2000 | H2 |
| 1b | 5 membranes Empty tube | Pd-Ag Al2O3 100 nm | 14/7 | Swagelok 12 Nm | Swagelok 12 Nm | 90.5 | 400–550 | 2650 | H2 |
| 2a | 5 membranes Empty tube | Pd-Ag Al2O3 100 nm | 14/7 | Swagelok 12 Nm | Finger-like | 112 | 400–525 | 2000 | H2 |
| 2b | 5 membranes Empty tube | Pd-Ag Al2O3 100 nm | 14/7 | Swagelok 14 Nm | Swagelok 14 Nm | 75 | 400–550 | 2650 | H2 |
| 3 | 5 membranes Empty tube | Pd-Ag Al2O3 100 nm | 10/4 | Swagelok 7 Nm | Swagelok 7 Nm | 107.5 | 400–550 | 2650 | H2 |
| 4a | Single membrane Empty tube | Pd-Ag Al2O3 100 nm | 10/4 | Swagelok 6 Nm | Swagelok 6 Nm | 87.98 | 400–600 | 715 | H2 |
| 4b | Single membrane Fluidized bed | Pd-Ag Al2O3 100 nm | 10/4 | Swagelok 6 Nm | Finger-like | 265 | 400–500 | 1150 | H2/N2 (50:50) |
| 5 | Single membrane Empty tube | Pd-Ag Al2O3 100 nm | 10/4 | Swagelok 6 Nm | Finger-like | 265 | 400–500 | 1150 | H2/N2 (50:50) |
| Membrane | Peak 111 | Peak 200 | |
|---|---|---|---|
| Crystal Size (nm) | Crystal Size (nm) | ||
| 1 | Pre testing | 44 | 34 |
| 1a | used 2000 h | 59 | 41 |
| 1b | used 2650 h | 72 | 54 |
| 2 | Pre testing | 59 | 53 |
| 2a | used 2000 h | 64 | 41 |
| 2b | used 2650 h | 64 | 46 |
| 3 | Pre testing | 44 | 46 |
| used 2650 h | 72 | 54 | |
| 4 | Pre testing | 17 | 11 |
| 4a | after 715 h (600 °C) | 64 | 51 |
| 4b | after FB 1150 h (500 °C) | 64 | 48 |
| 5 | Pre testing | 61 | 46 |
| used 1150 h (500 °C) | 59 | 48 | |
© 2019 by the authors. Licensee MDPI, Basel, Switzerland. This article is an open access article distributed under the terms and conditions of the Creative Commons Attribution (CC BY) license (http://creativecommons.org/licenses/by/4.0/).
Share and Cite
Nooijer, N.d.; Arratibel Plazaola, A.; Meléndez Rey, J.; Fernandez, E.; Pacheco Tanaka, D.A.; Sint Annaland, M.v.; Gallucci, F. Long-Term Stability of Thin-Film Pd-Based Supported Membranes. Processes 2019, 7, 106. https://doi.org/10.3390/pr7020106
Nooijer Nd, Arratibel Plazaola A, Meléndez Rey J, Fernandez E, Pacheco Tanaka DA, Sint Annaland Mv, Gallucci F. Long-Term Stability of Thin-Film Pd-Based Supported Membranes. Processes. 2019; 7(2):106. https://doi.org/10.3390/pr7020106
Chicago/Turabian StyleNooijer, Niek de, Alba Arratibel Plazaola, Jon Meléndez Rey, Ekain Fernandez, David Alfredo Pacheco Tanaka, Martin van Sint Annaland, and Fausto Gallucci. 2019. "Long-Term Stability of Thin-Film Pd-Based Supported Membranes" Processes 7, no. 2: 106. https://doi.org/10.3390/pr7020106
APA StyleNooijer, N. d., Arratibel Plazaola, A., Meléndez Rey, J., Fernandez, E., Pacheco Tanaka, D. A., Sint Annaland, M. v., & Gallucci, F. (2019). Long-Term Stability of Thin-Film Pd-Based Supported Membranes. Processes, 7(2), 106. https://doi.org/10.3390/pr7020106