Dynamics of Water Quality: Impact Assessment Process for Water Resource Management


Abstract
:1. Introduction
2. Materials and Methods
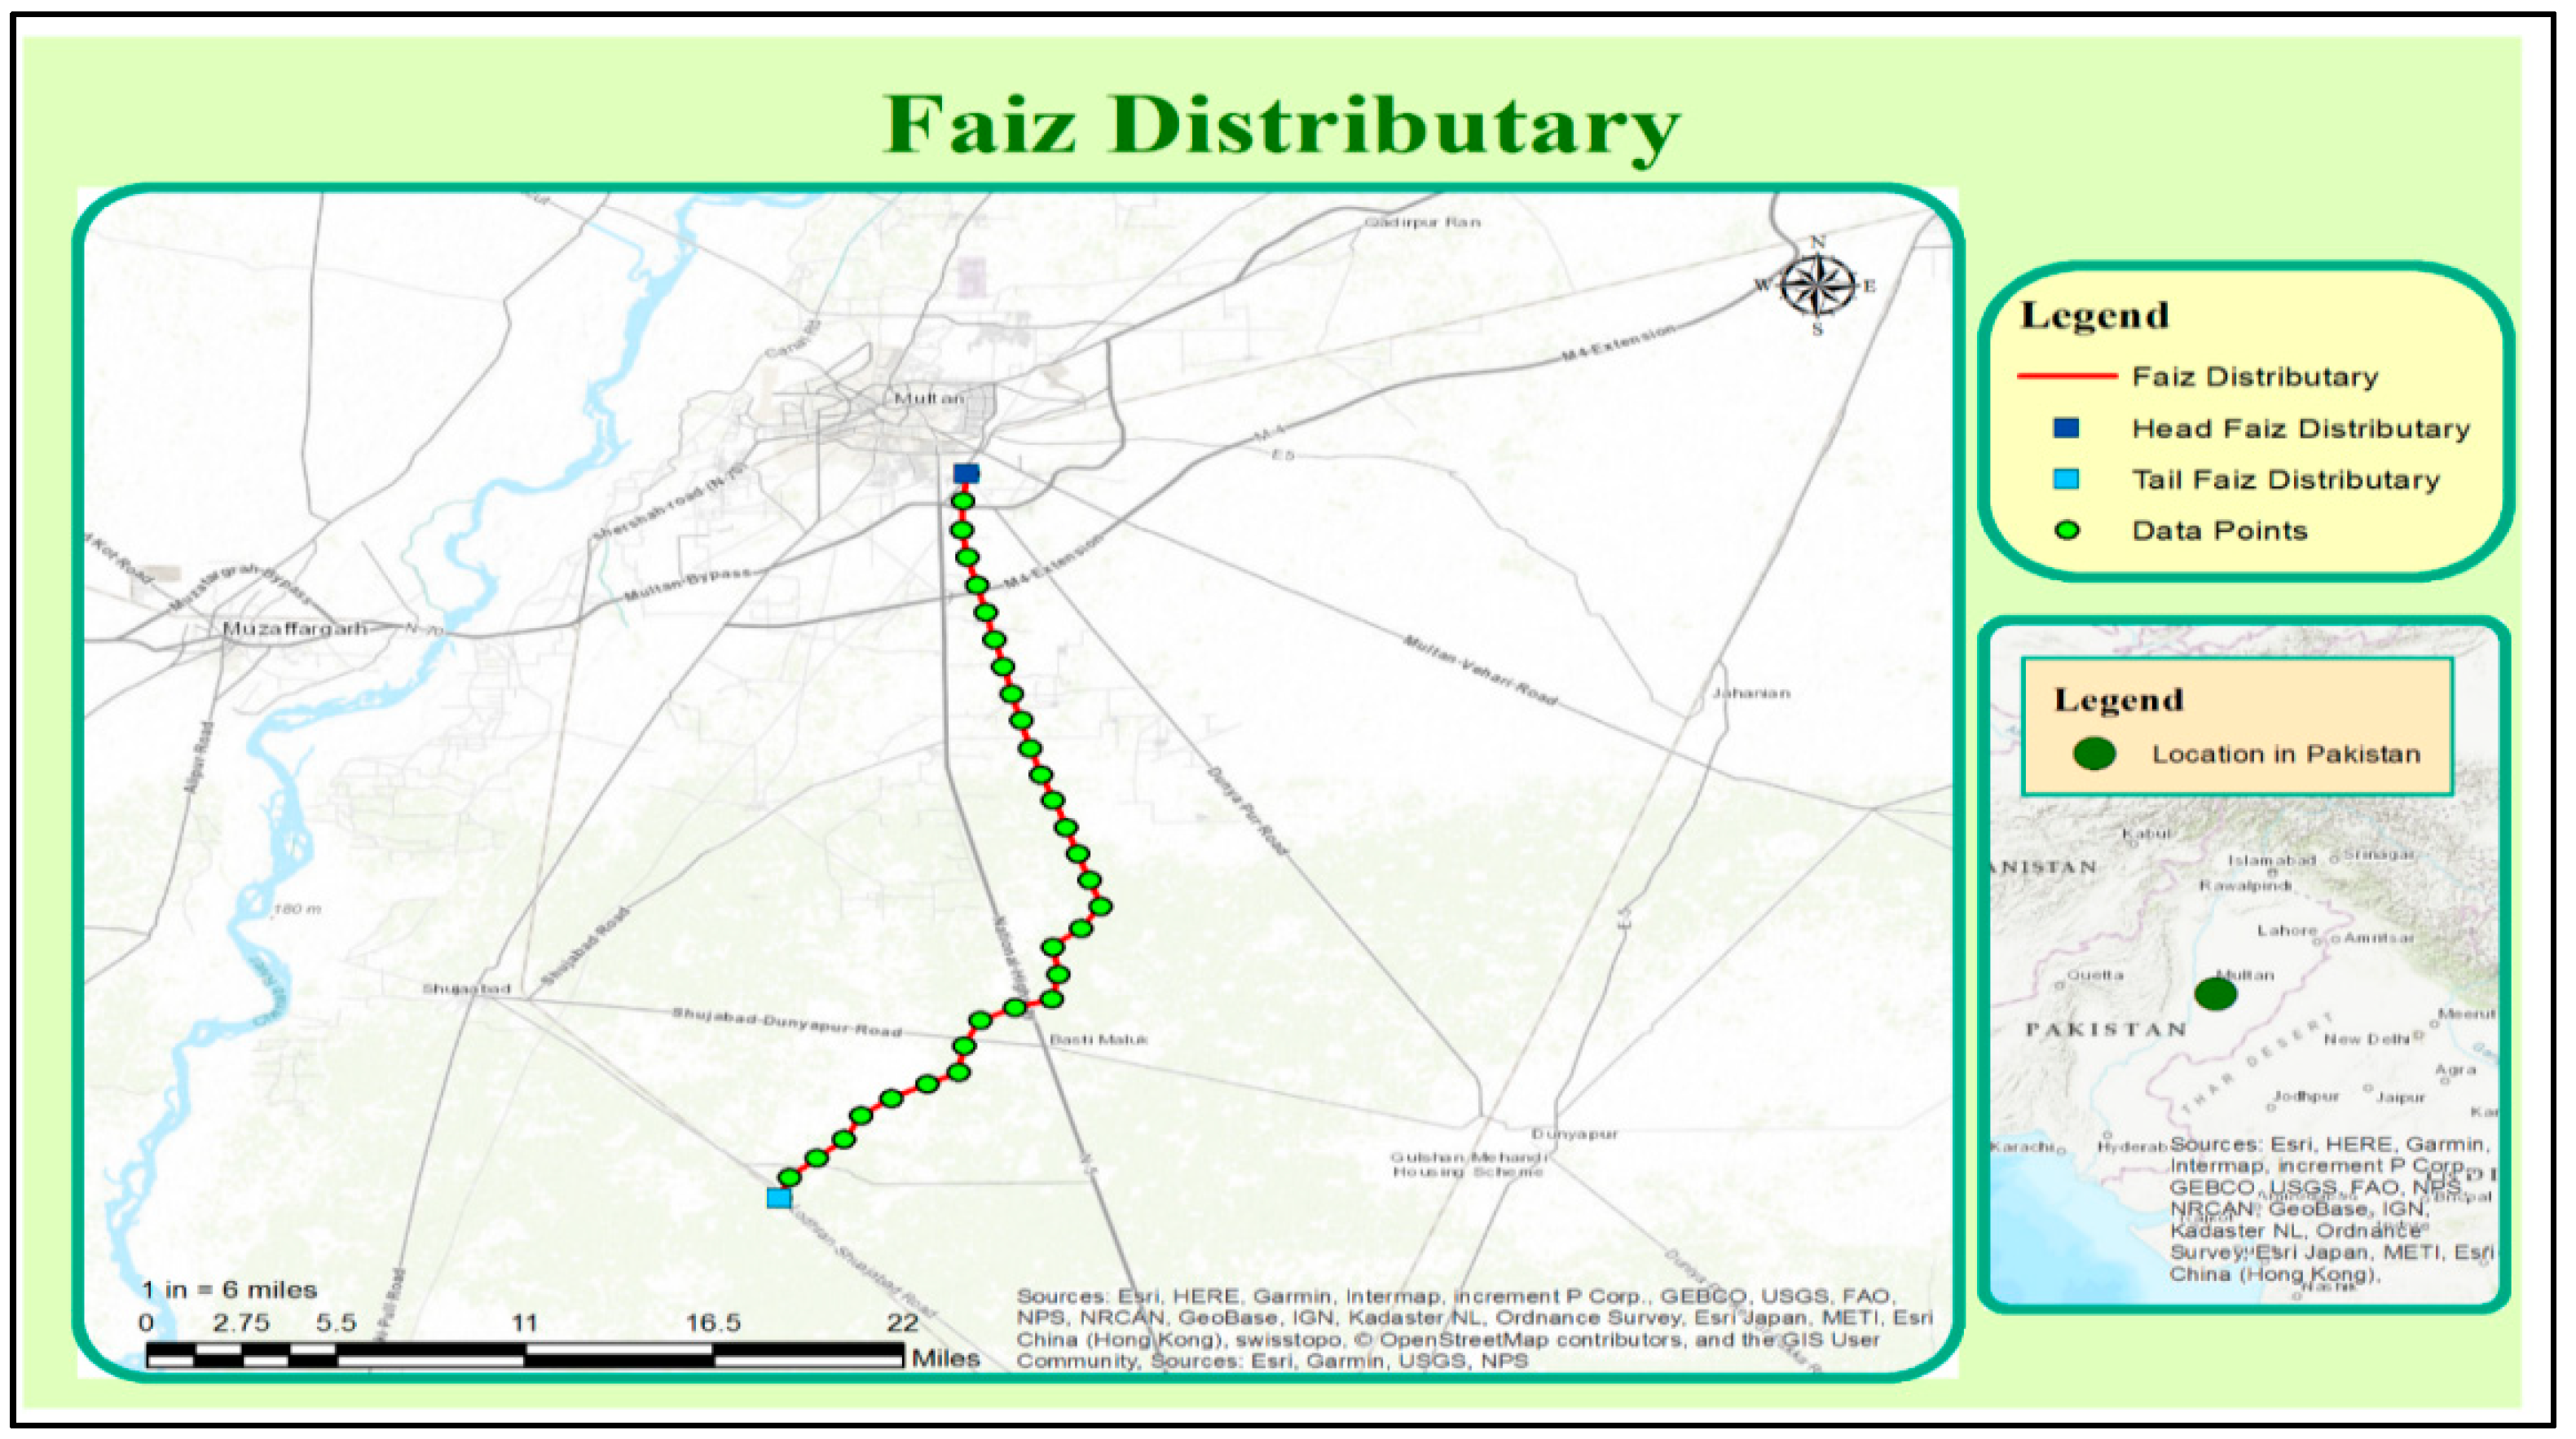
2.1. Study Area
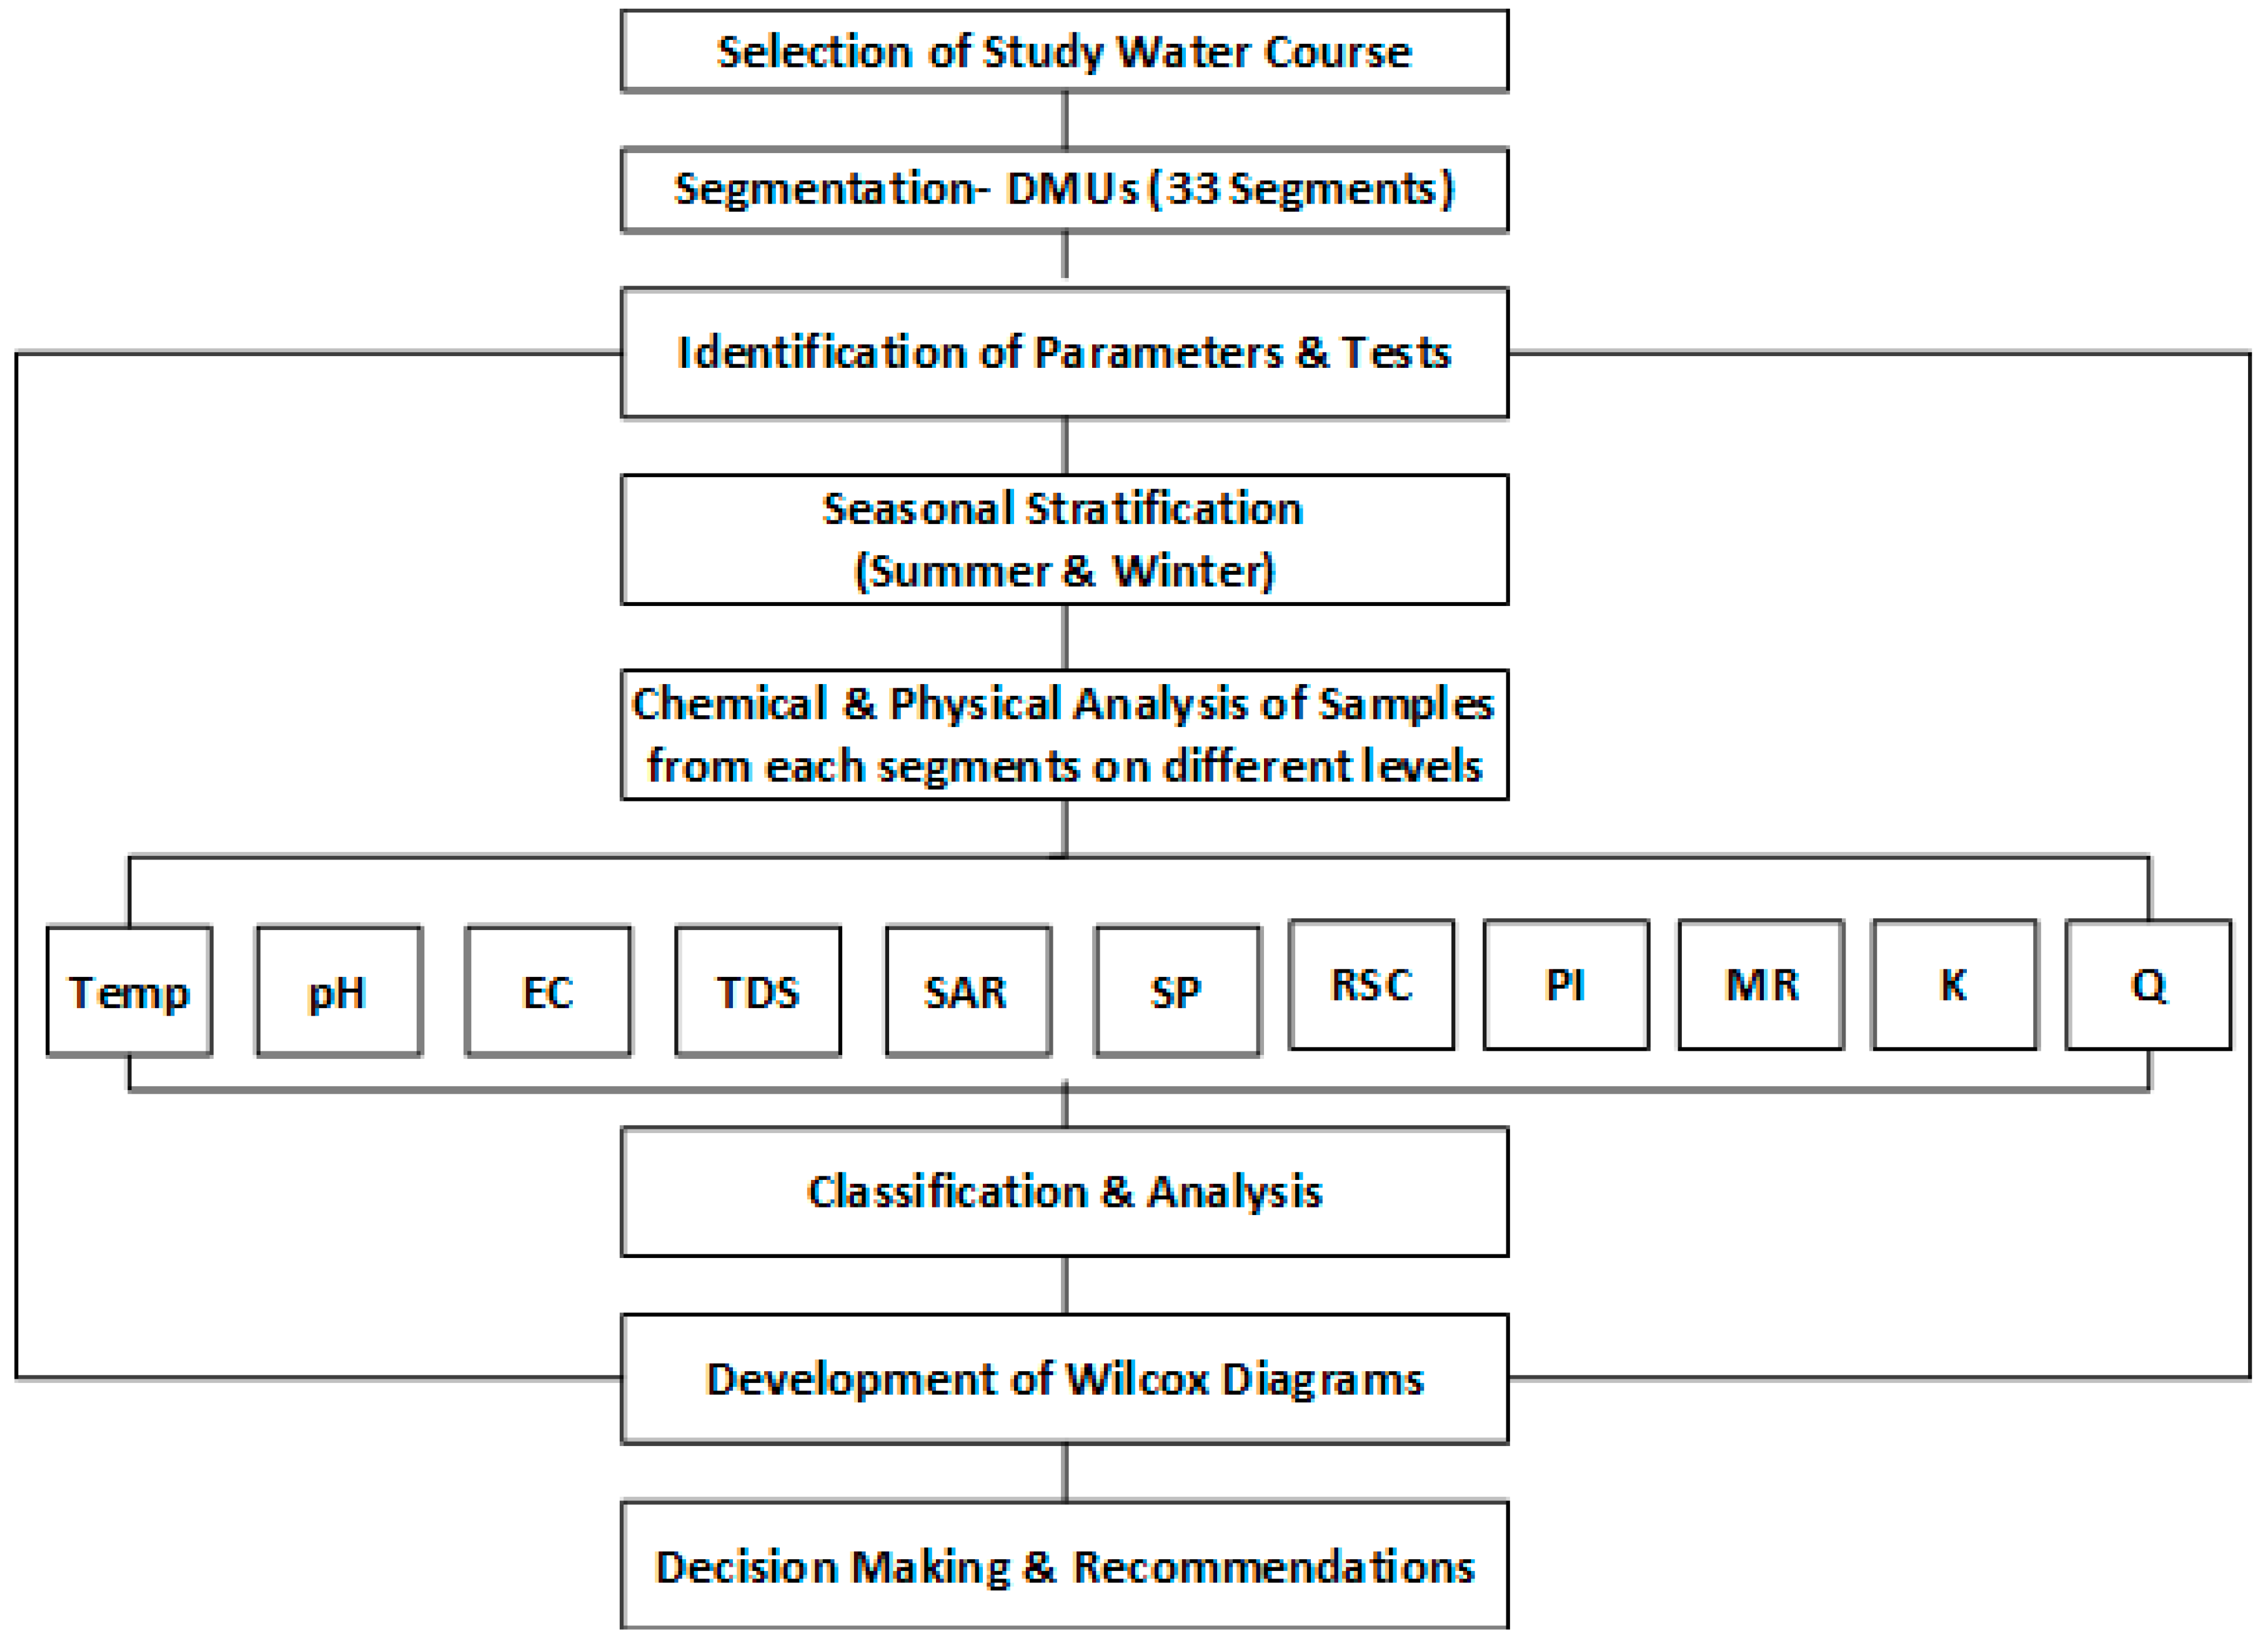
2.2. Study Framework
- Step.1: Selection of distributary/water course as study area.
- Step.2: Adaptation of water sampling technique.
- Step.3: Segmentation of distributary/water course with equal intervals.
- Step.4: Collection of water sample of each segment of water course in two seasons (Winter/Summer).
- Step.5: Selection of critical parameters for water quality analysis.
- Step.6: Physical and Chemical analysis of each sample.
- Step.7: Comparison of salinity parameters with FAO-UN guidelines for knowing the level of restriction in using irrigation water.
- Step.8: Wilcox diagram and Richard’s approach in predicting and evaluating water class.
- Step.9: Doneen’s approach in identifying infiltration problem.
- Step.10: Water Resource Management and Policy Implications according to identified problems.
2.3. Sampling and Selection of the Parameters
2.4. Wilcox, Richards and Doneen’s Diagram Development
3. Results
3.1. pH Value
3.2. Concentration of Ions
3.3. Salinity Hazard
3.4. Sodium Hazard
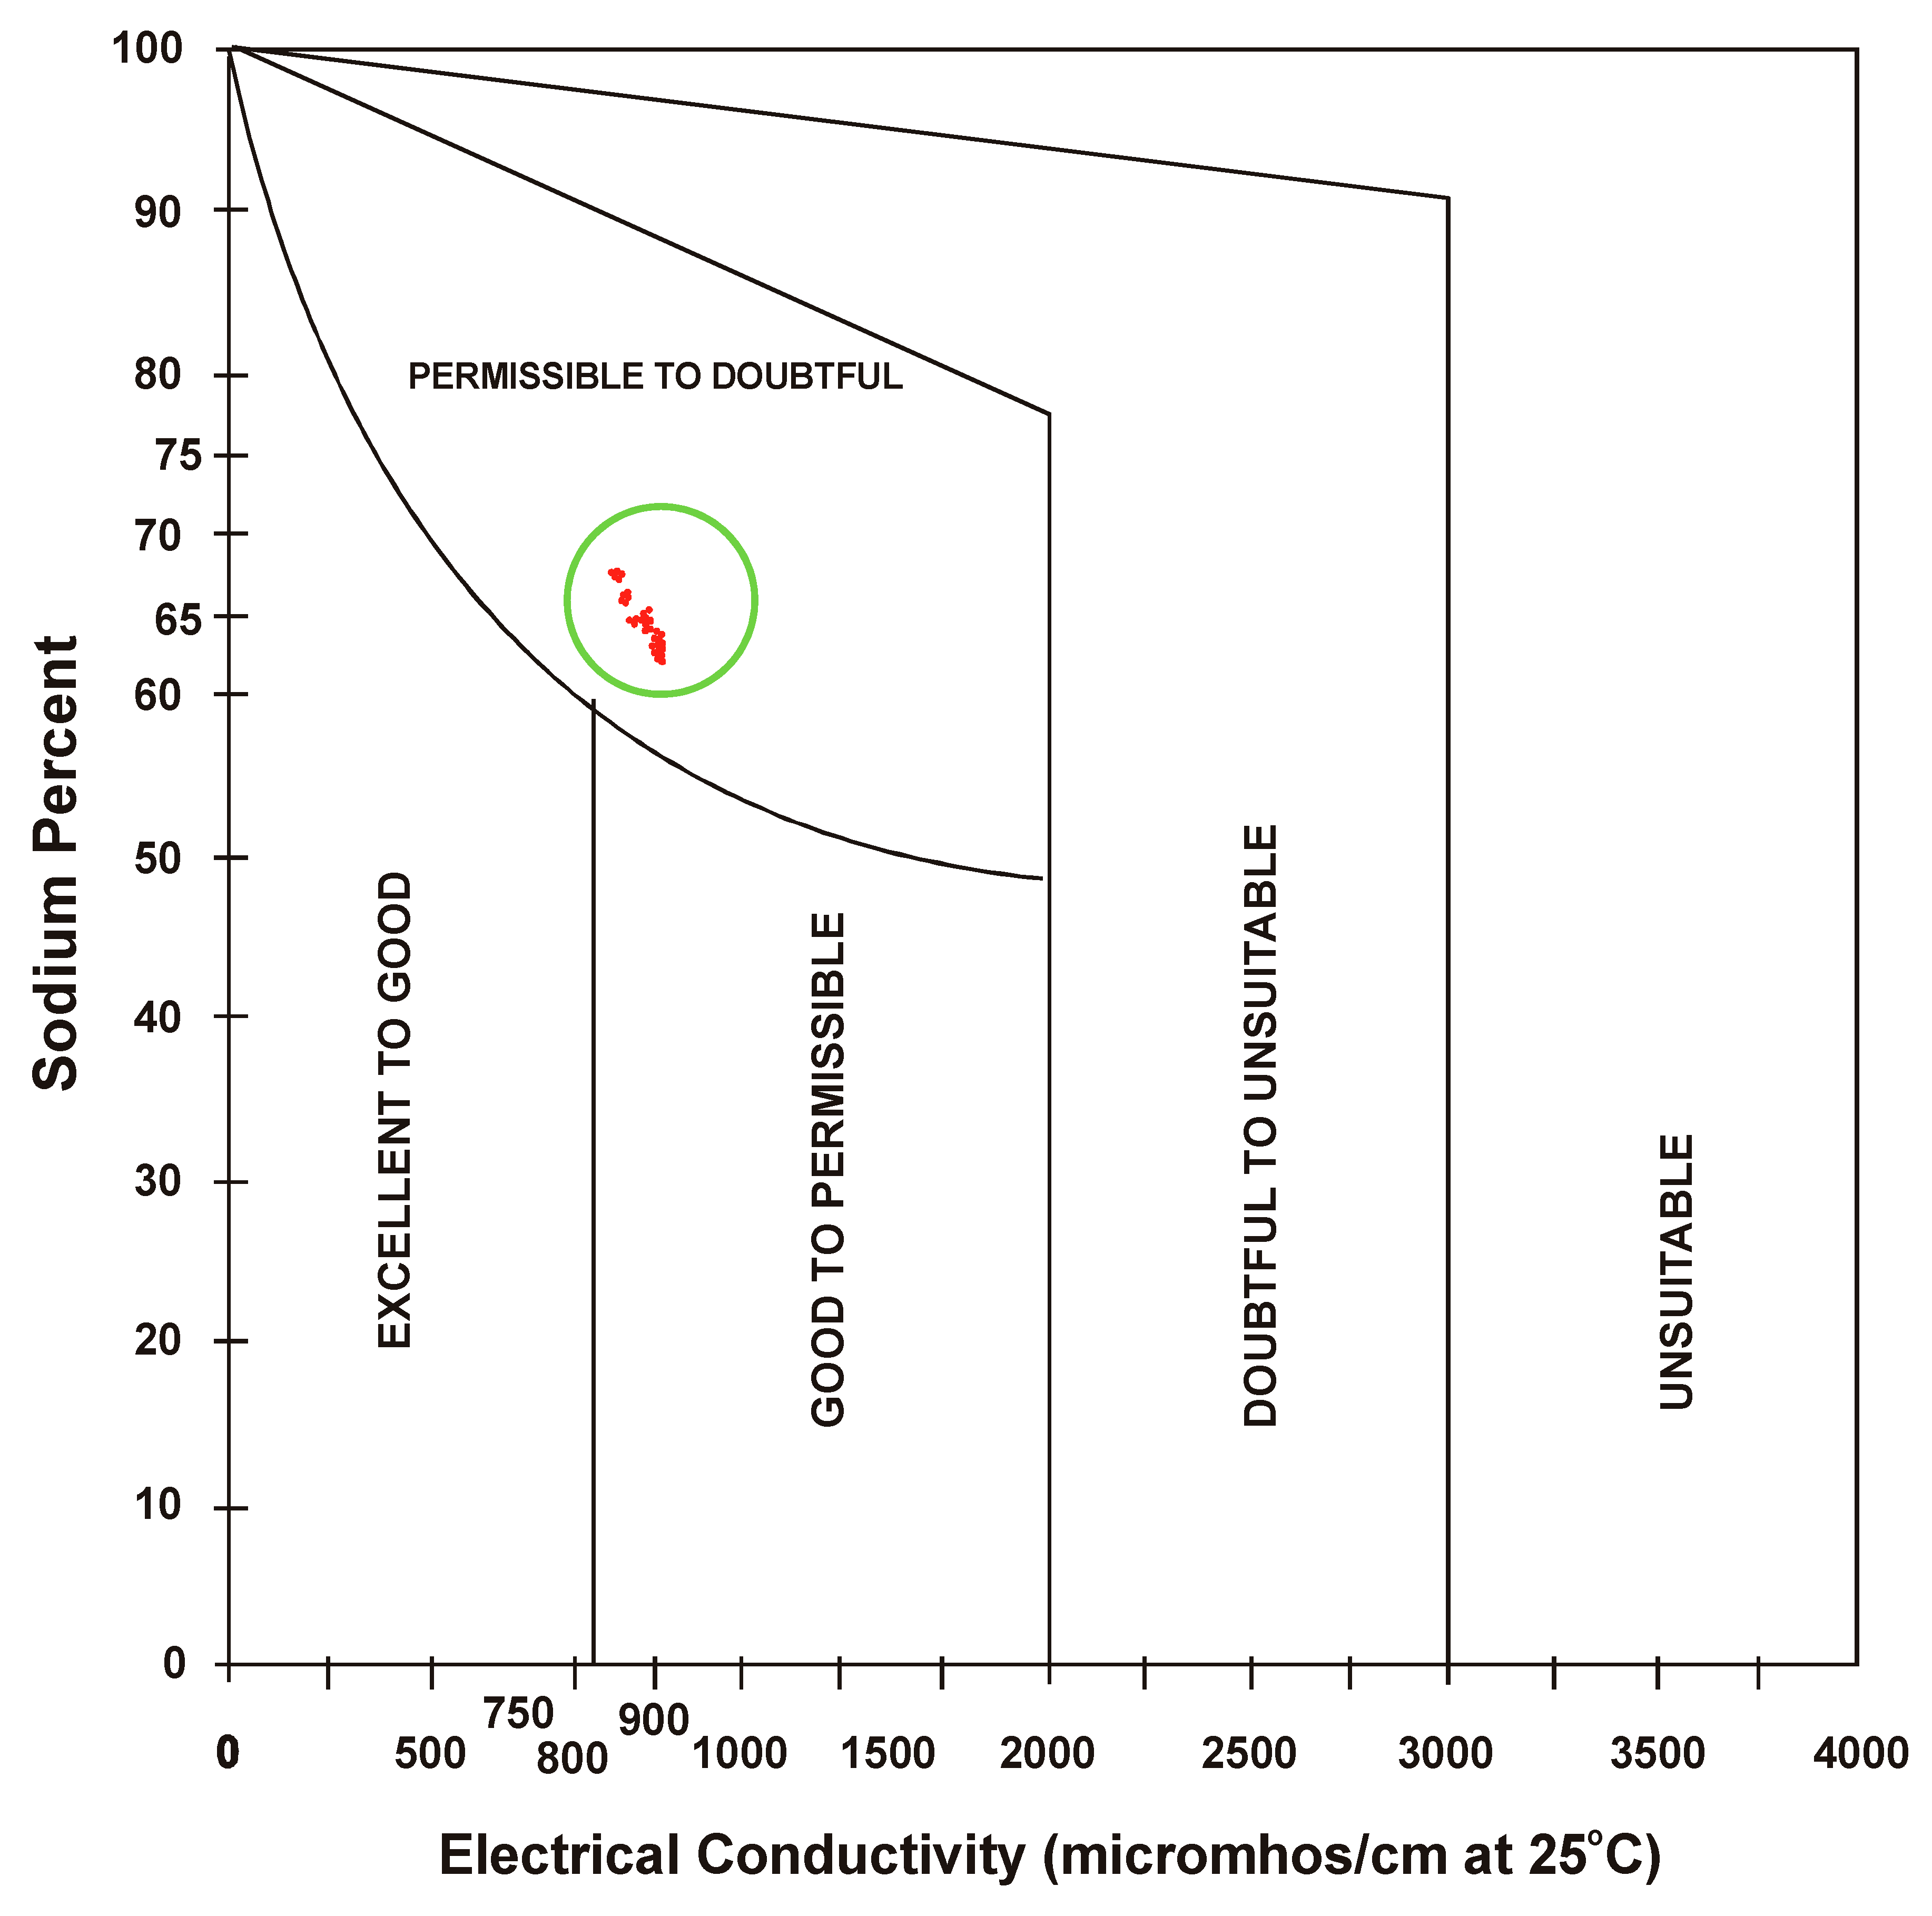
3.5. Sodium Percent
3.6. Alkalinity Hazard
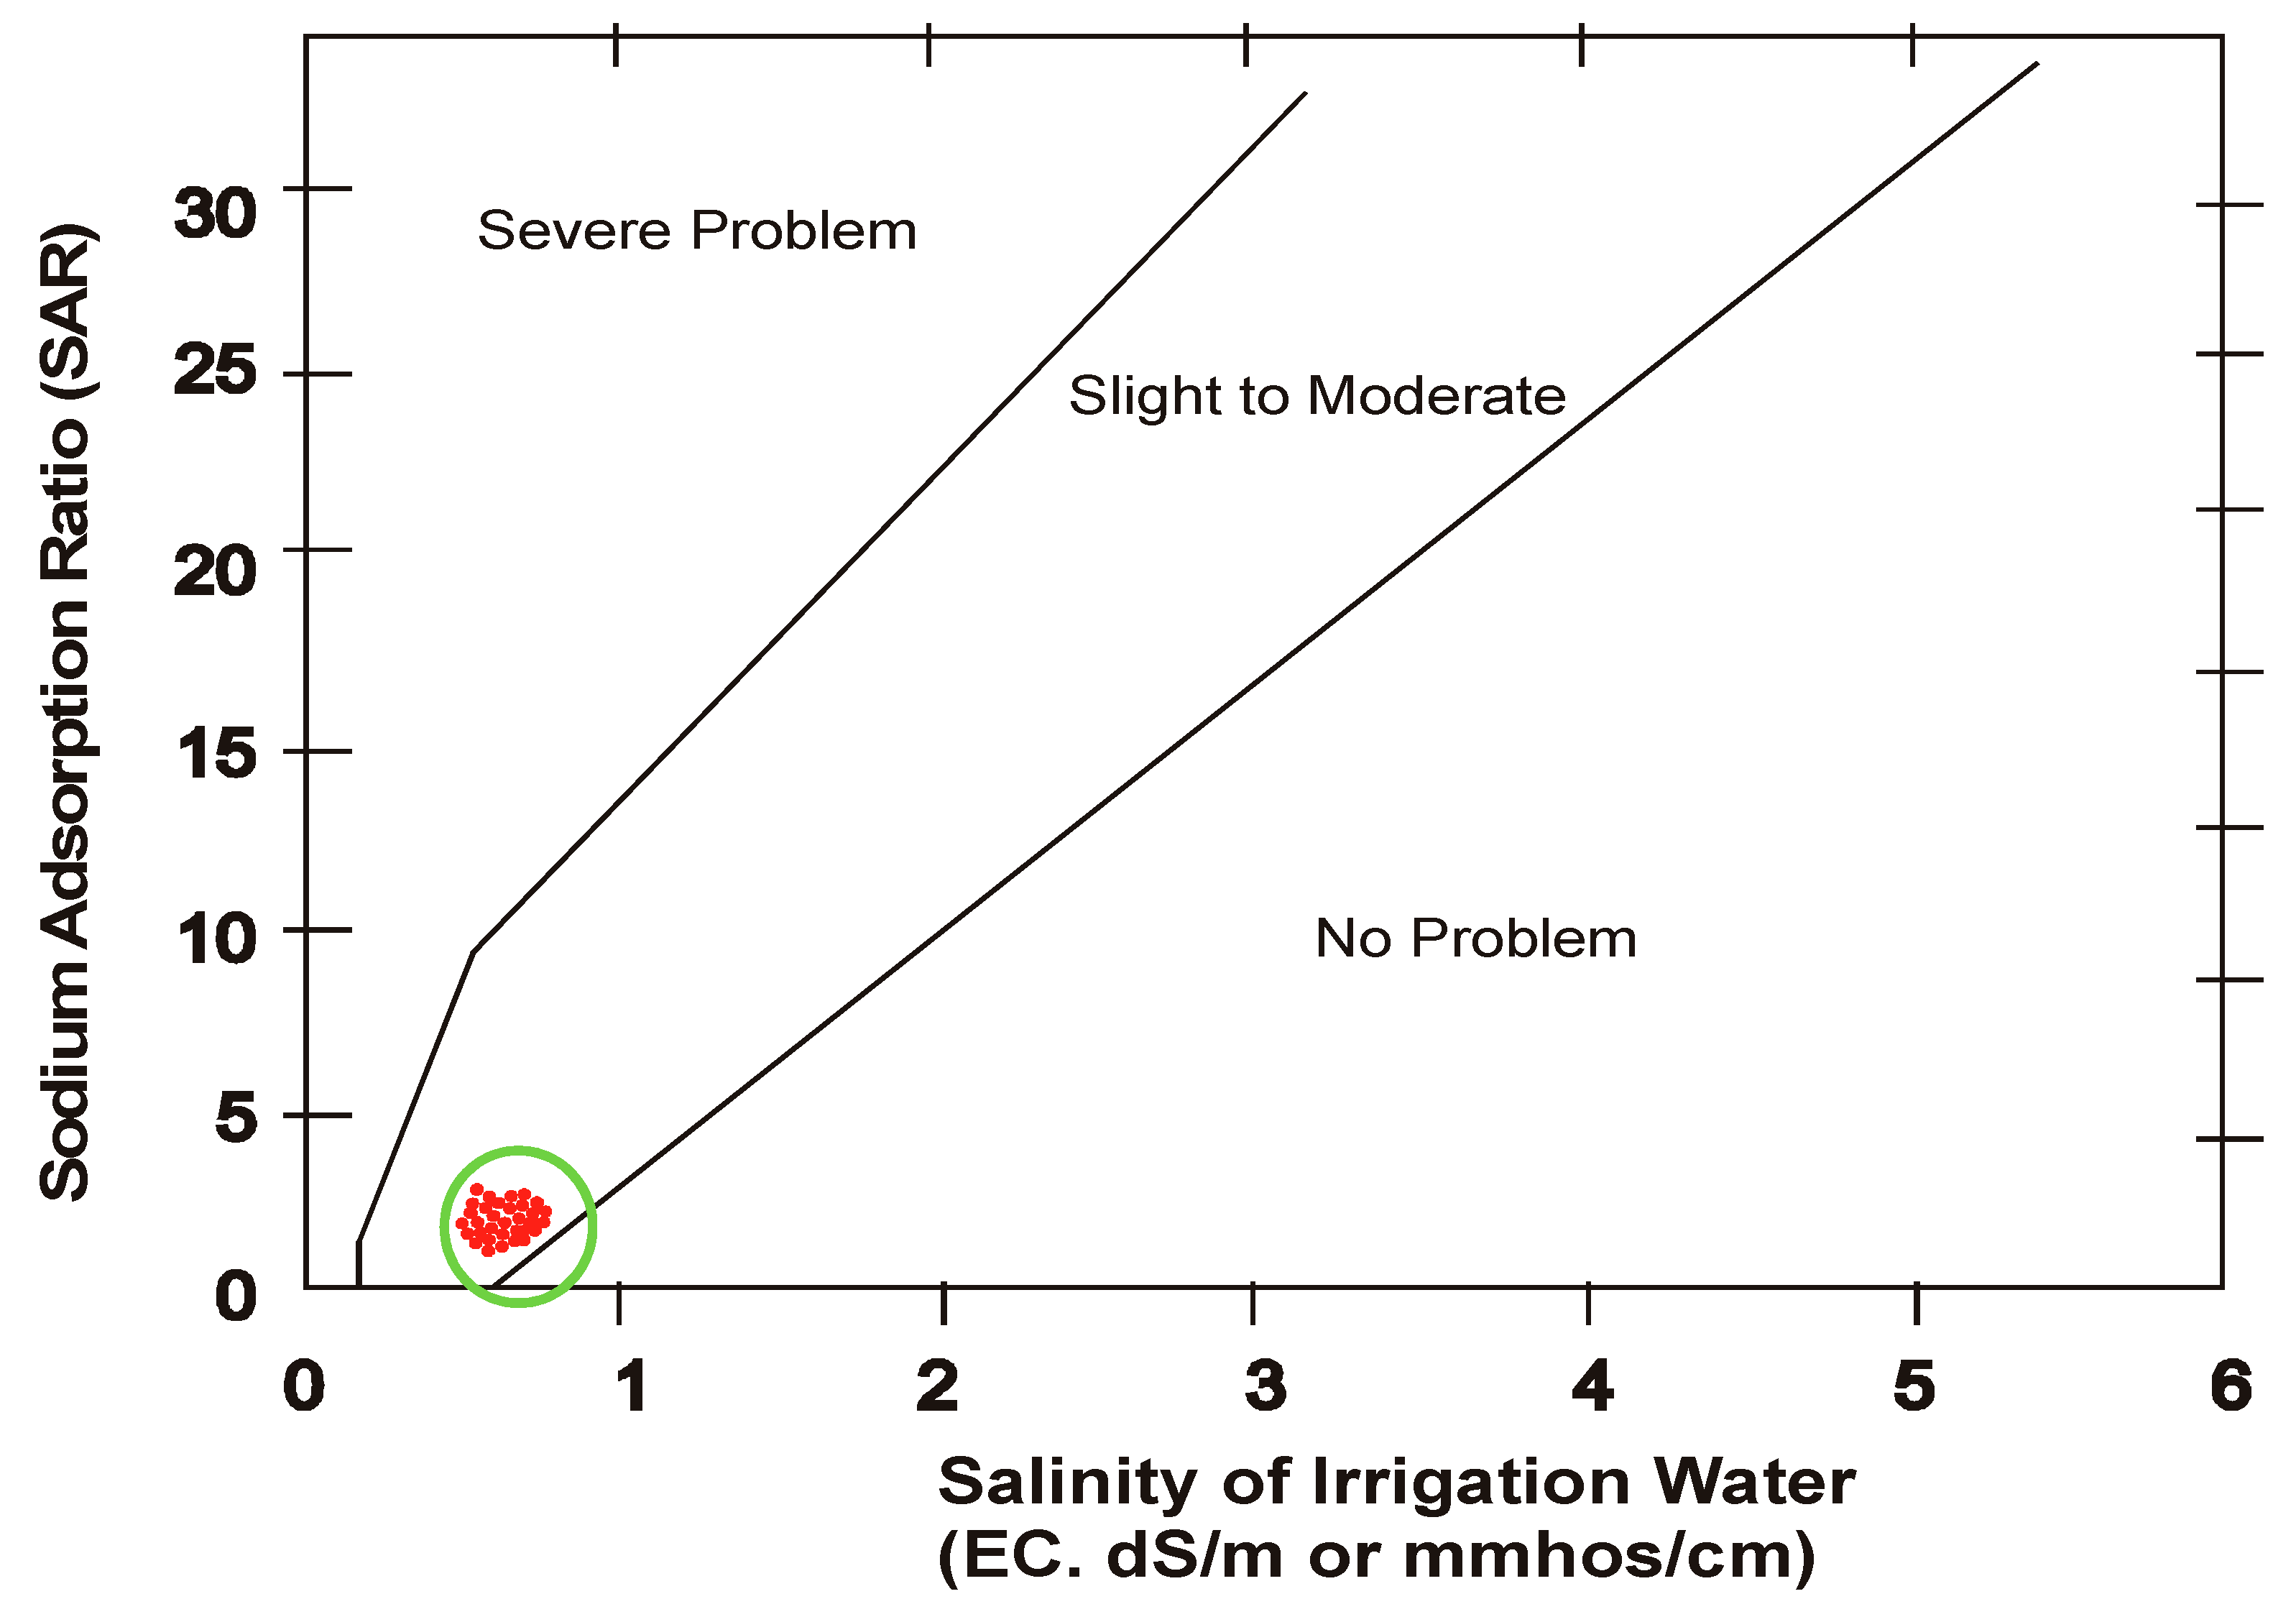
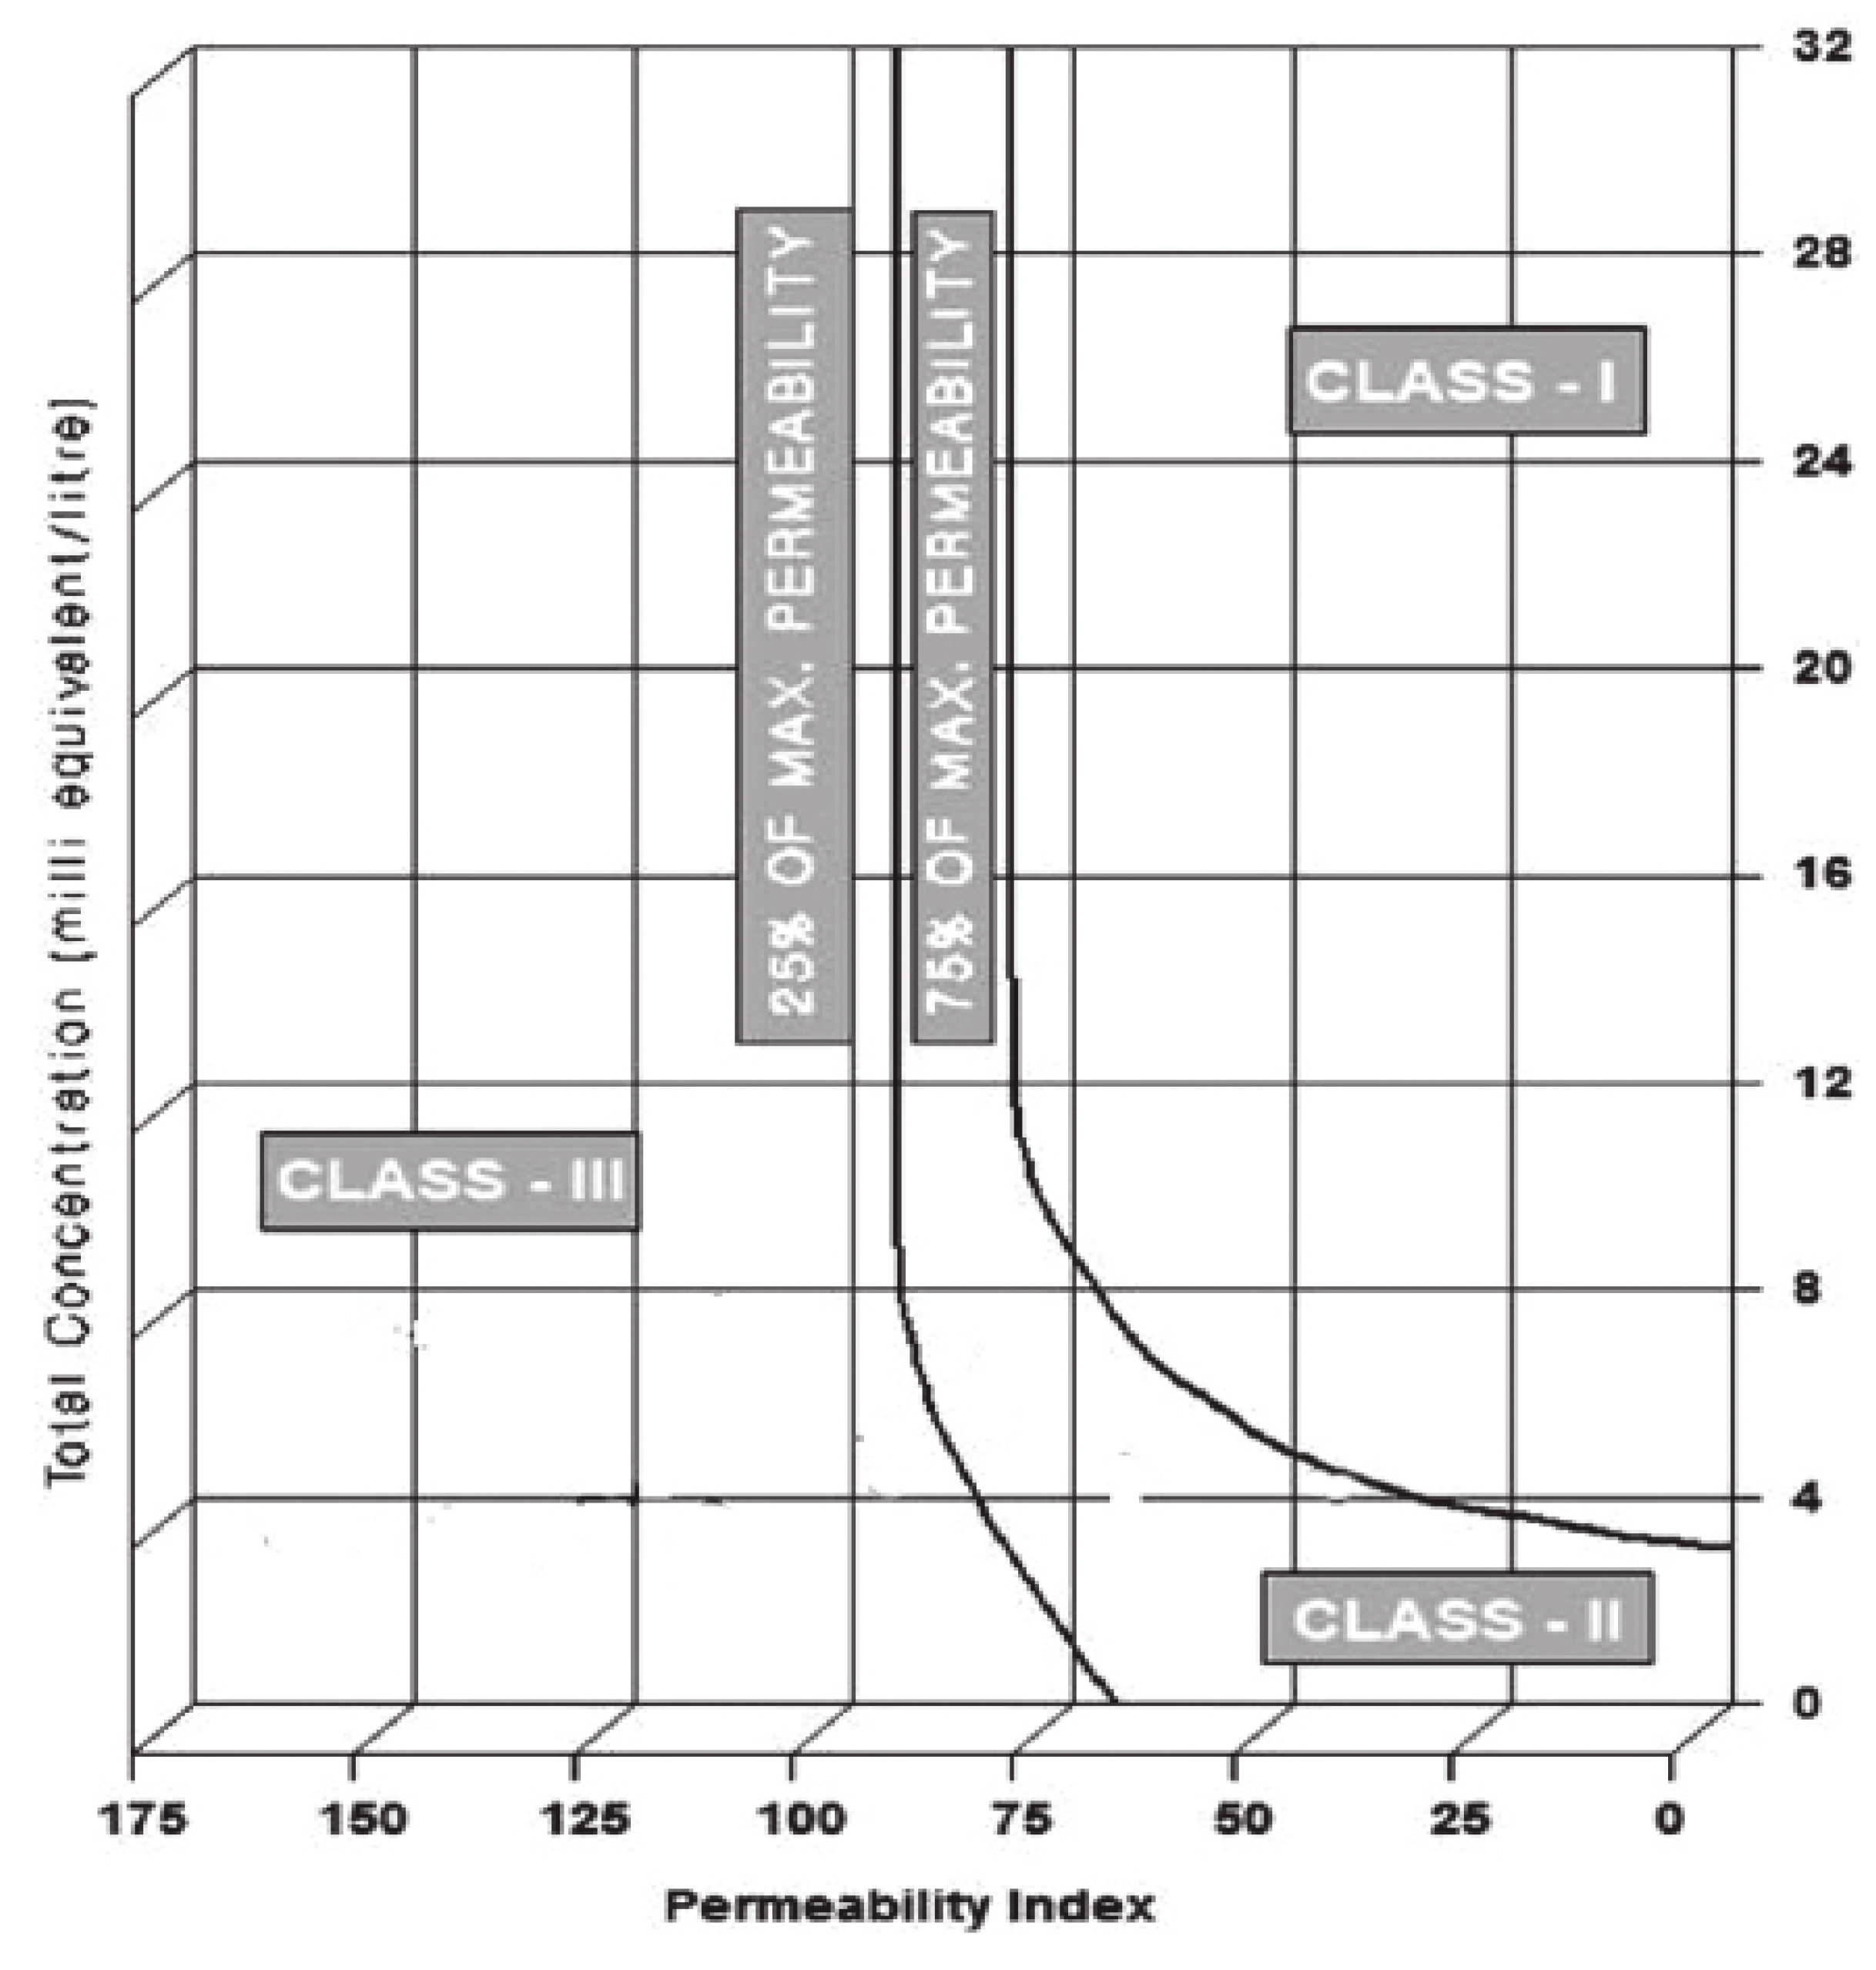
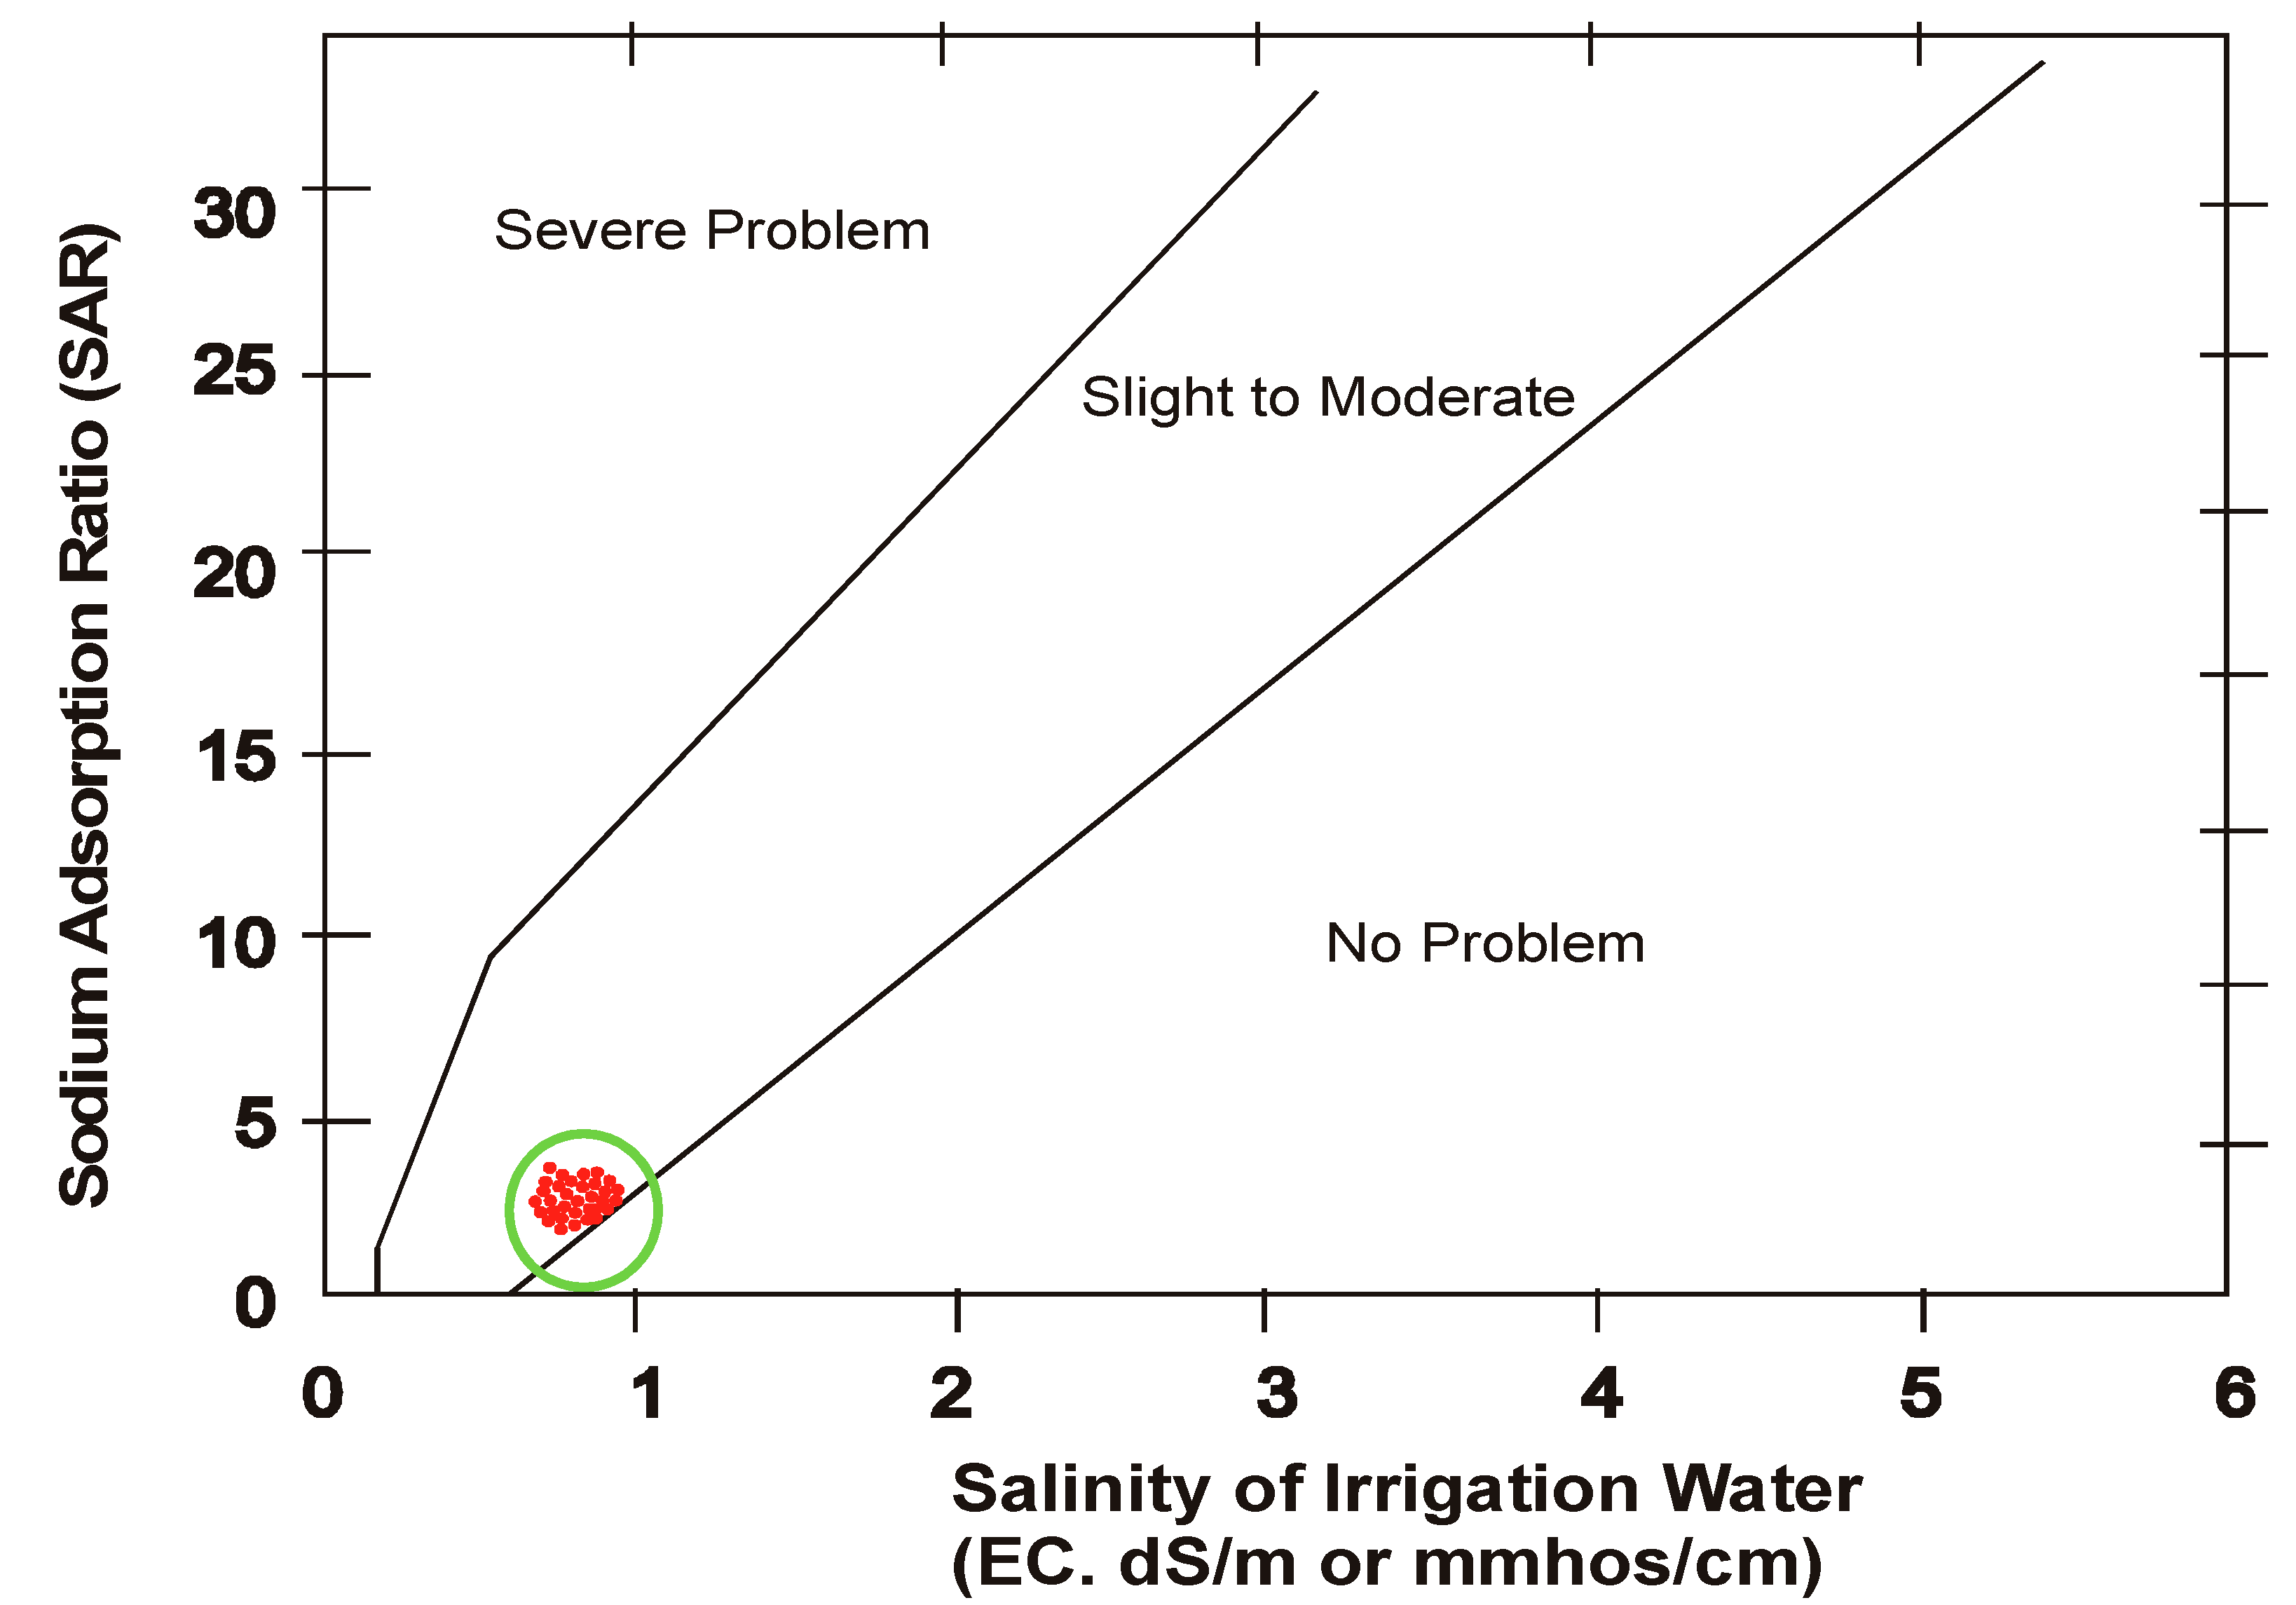
3.7. Infiltration of Water
3.8. Magnesium Ratio (Magnesium Hazard)
3.9. Policy Implications
4. Conclusions
- (1)
- The concerned aspect of this study was to address total salinity of irrigation water. After analysis and comparing with FAO-UN guideline [19], the study revealed that the water is “slightly saline” concluded on the basis of electrical conductivity. It was further apprehended that salinity level, depending on EC values, decreased along the flow till the tail reached. According to the FAO-UN guidelines, being nature of water as slightly saline, the restriction on using this water is “slight to moderate”.
- (2)
- The water was also tested to judge its extent of basicity which showed its nature as alkaline. The other parameters pertaining to salinity were also analyzed to ascertain concentration of water and its classification based on different approaches. Sodium absorption ratio is also an important parameter which indicates the extent of sodium hazard when sodium is in excess. SAR is reduced when magnesium present in water is enough. In the analysis it was found that SAR reduced along the course of flow towards tail in both the seasons and the restriction of using this water is “Slight to moderate” and the water is designated as “Low sodium water” based on FAO-UN guidelines.
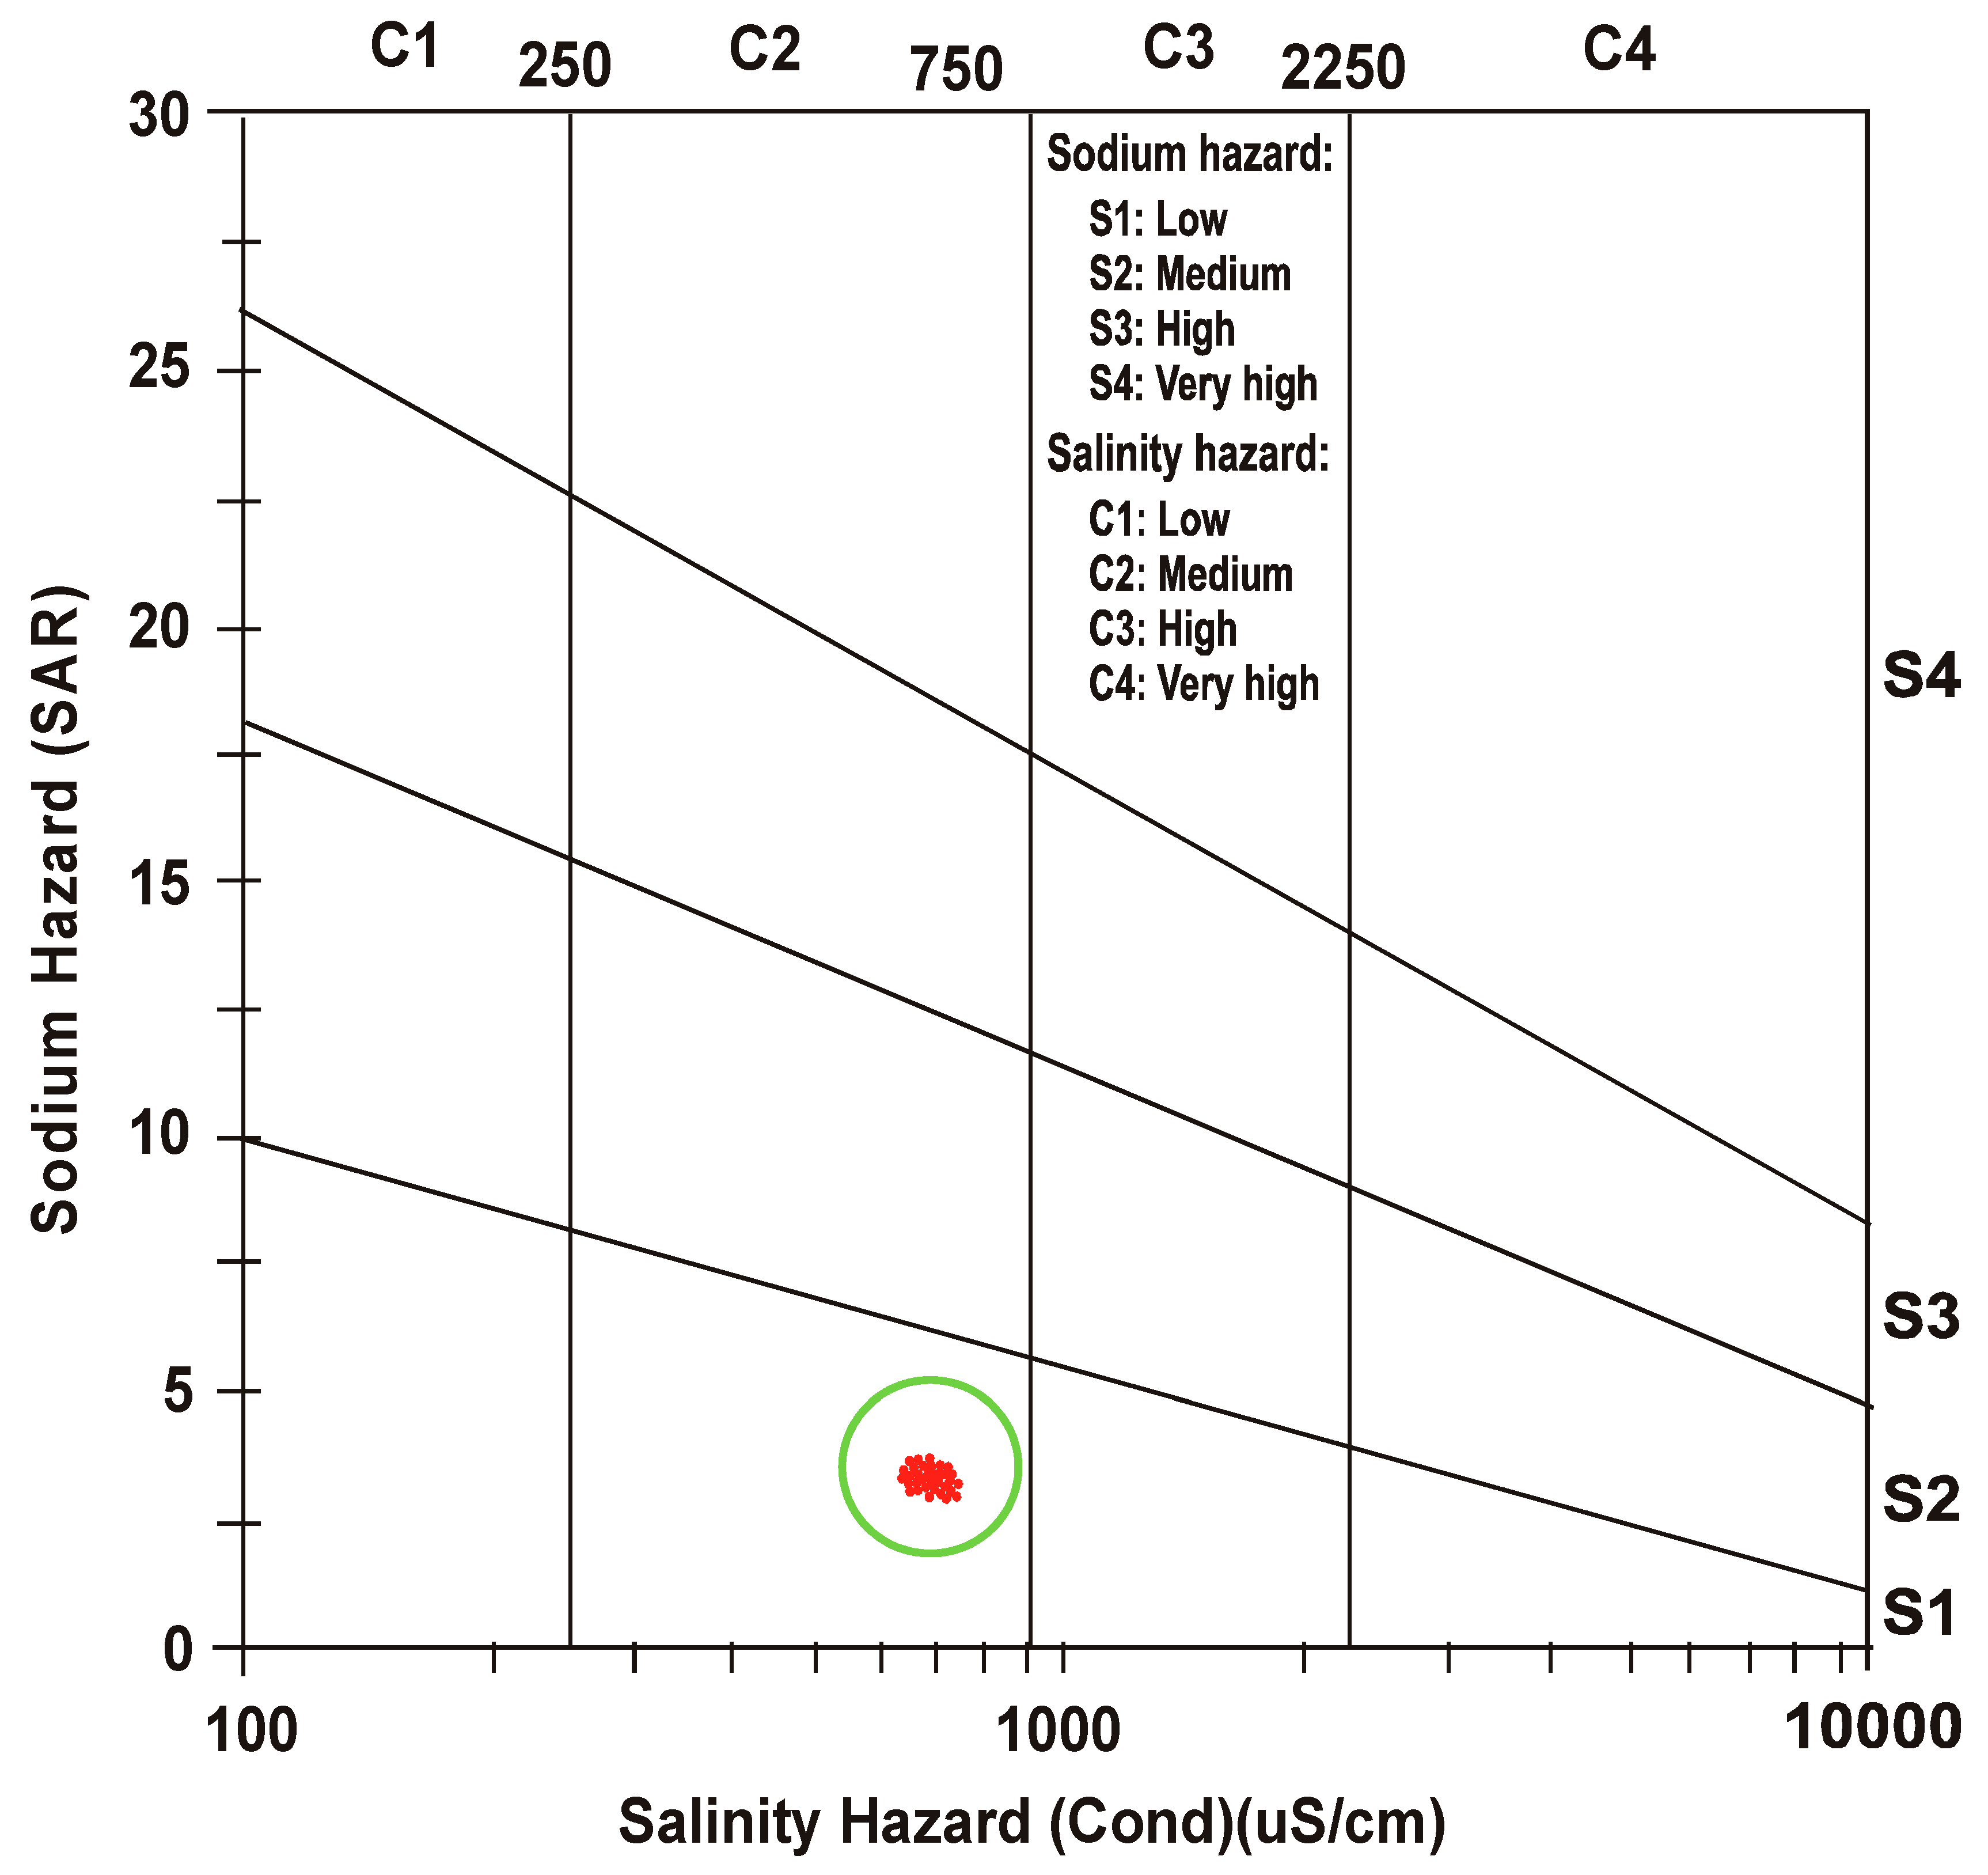
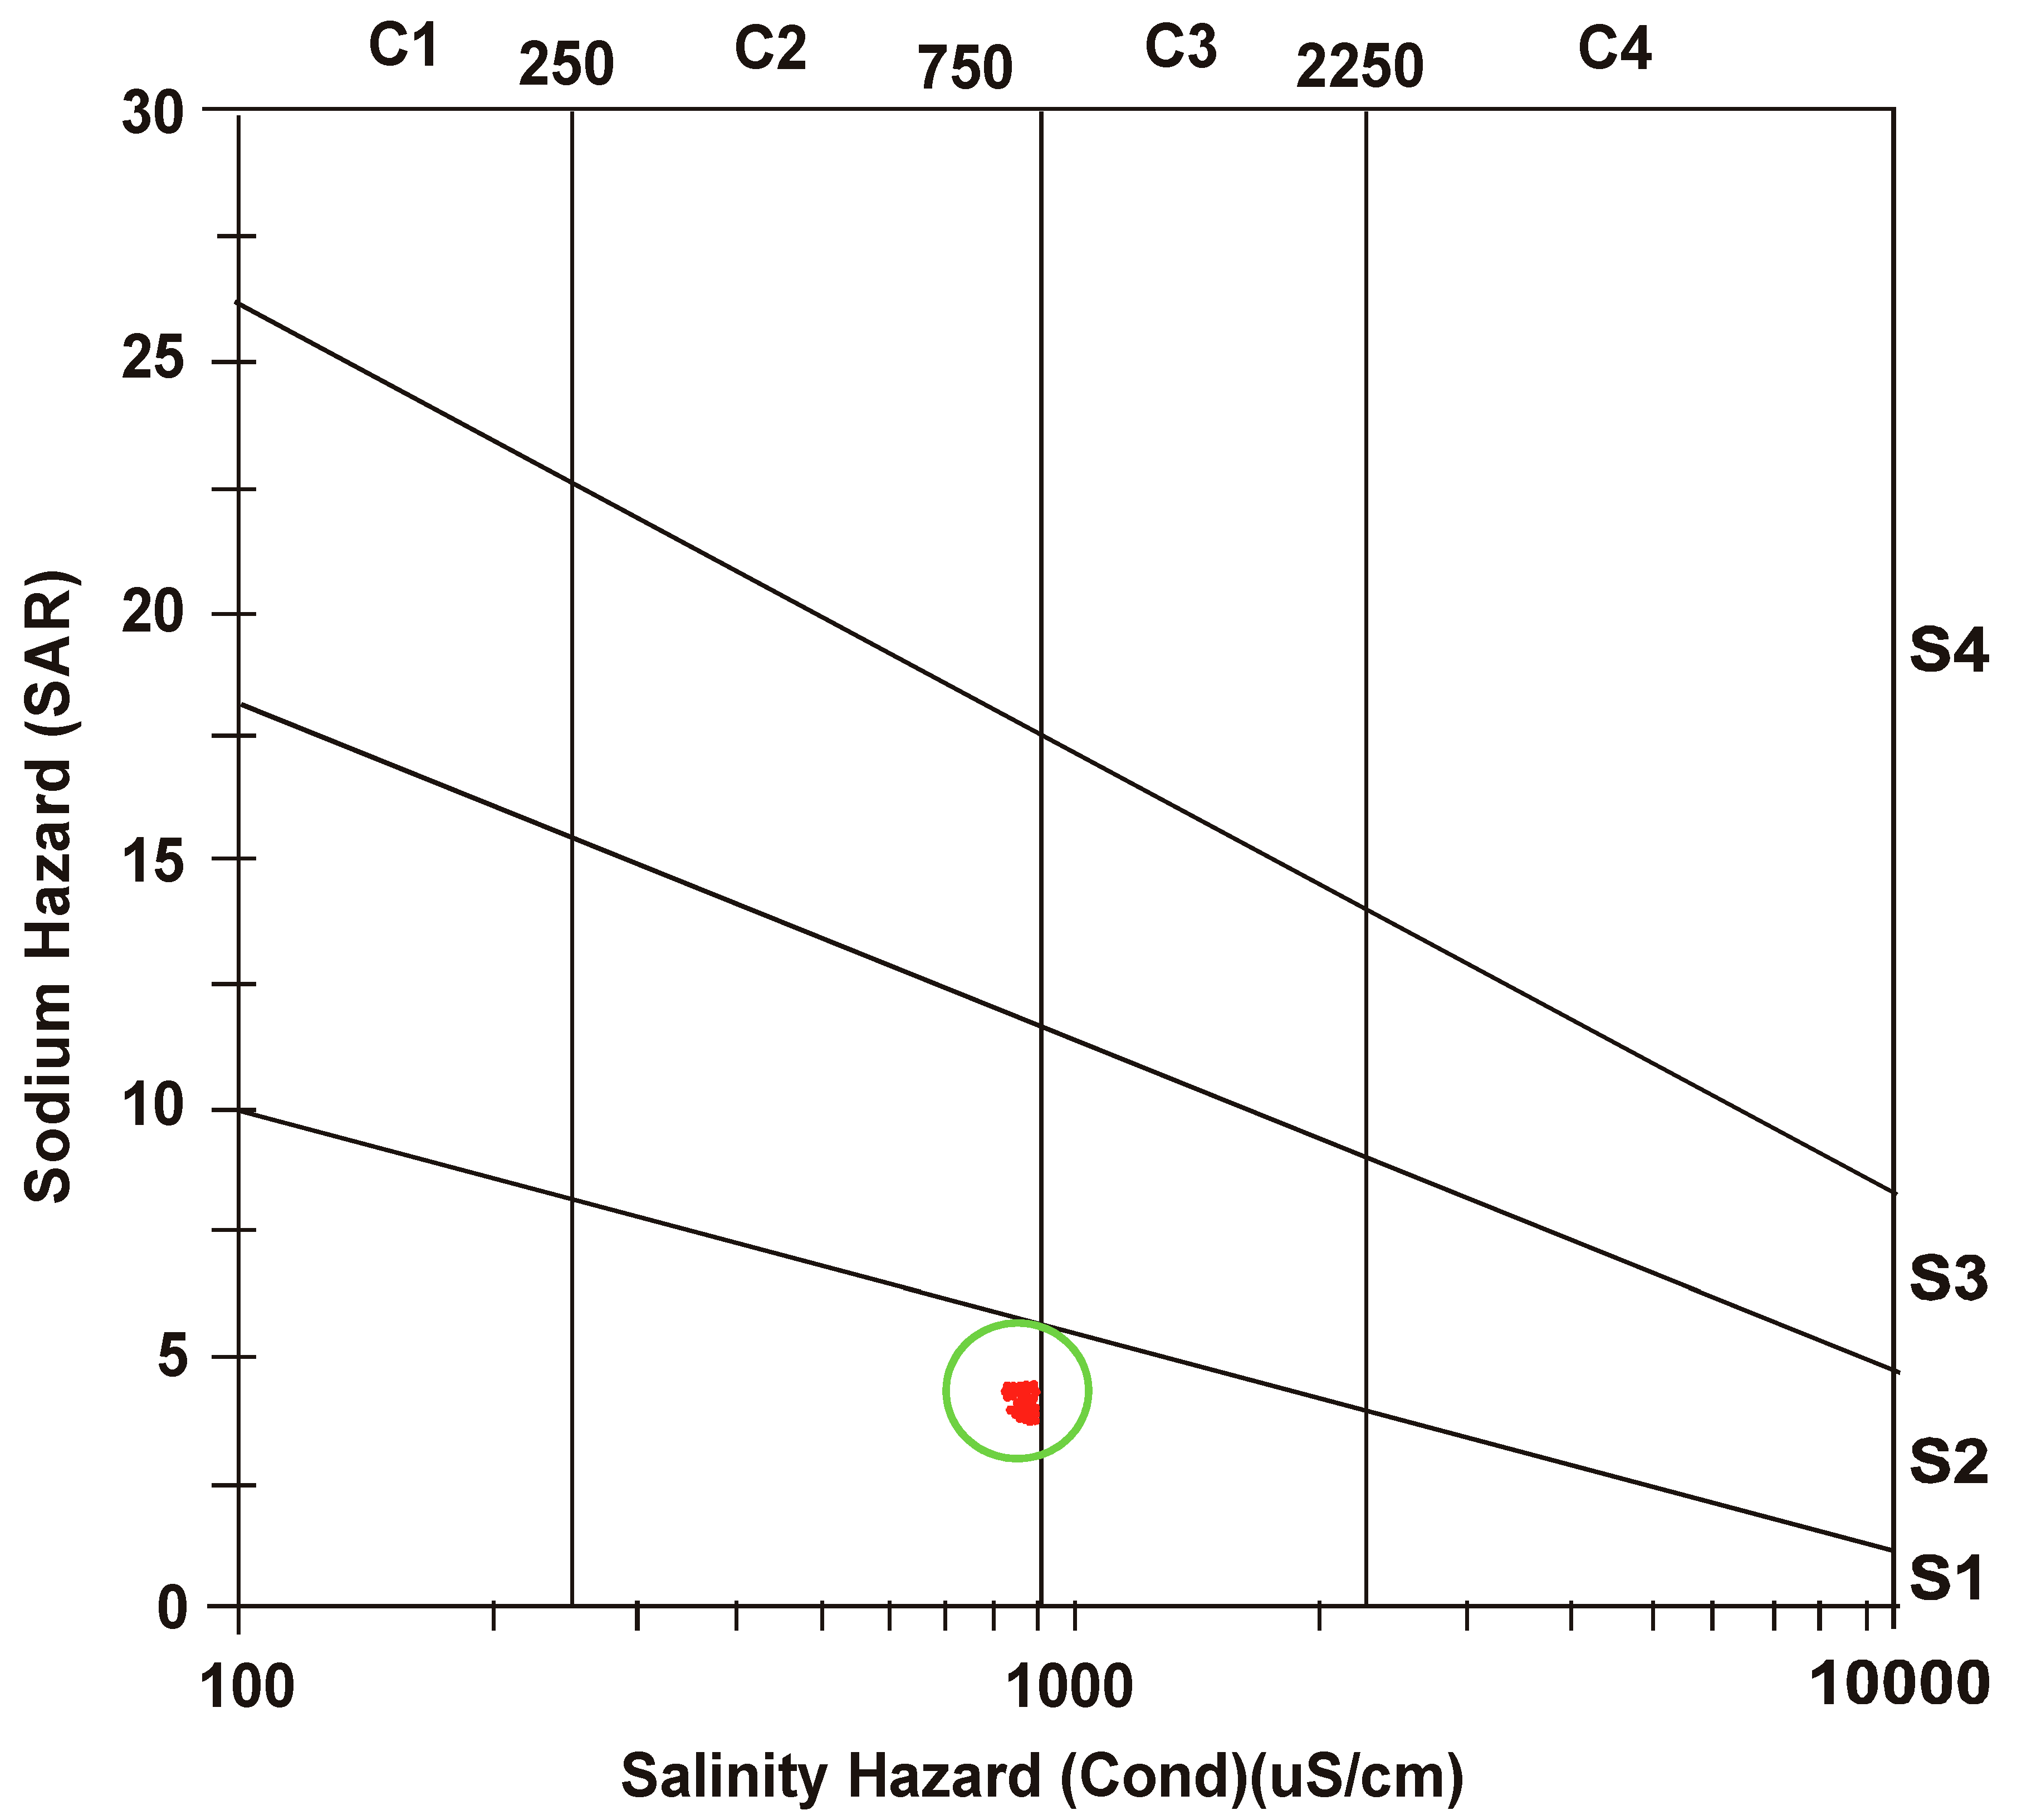
- (3)
- After defining a correlation between EC and SAR, United States Salinity Laboratory (USSL) determined water class as “medium salinity with low sodium” (C2 S1) for both the seasons.
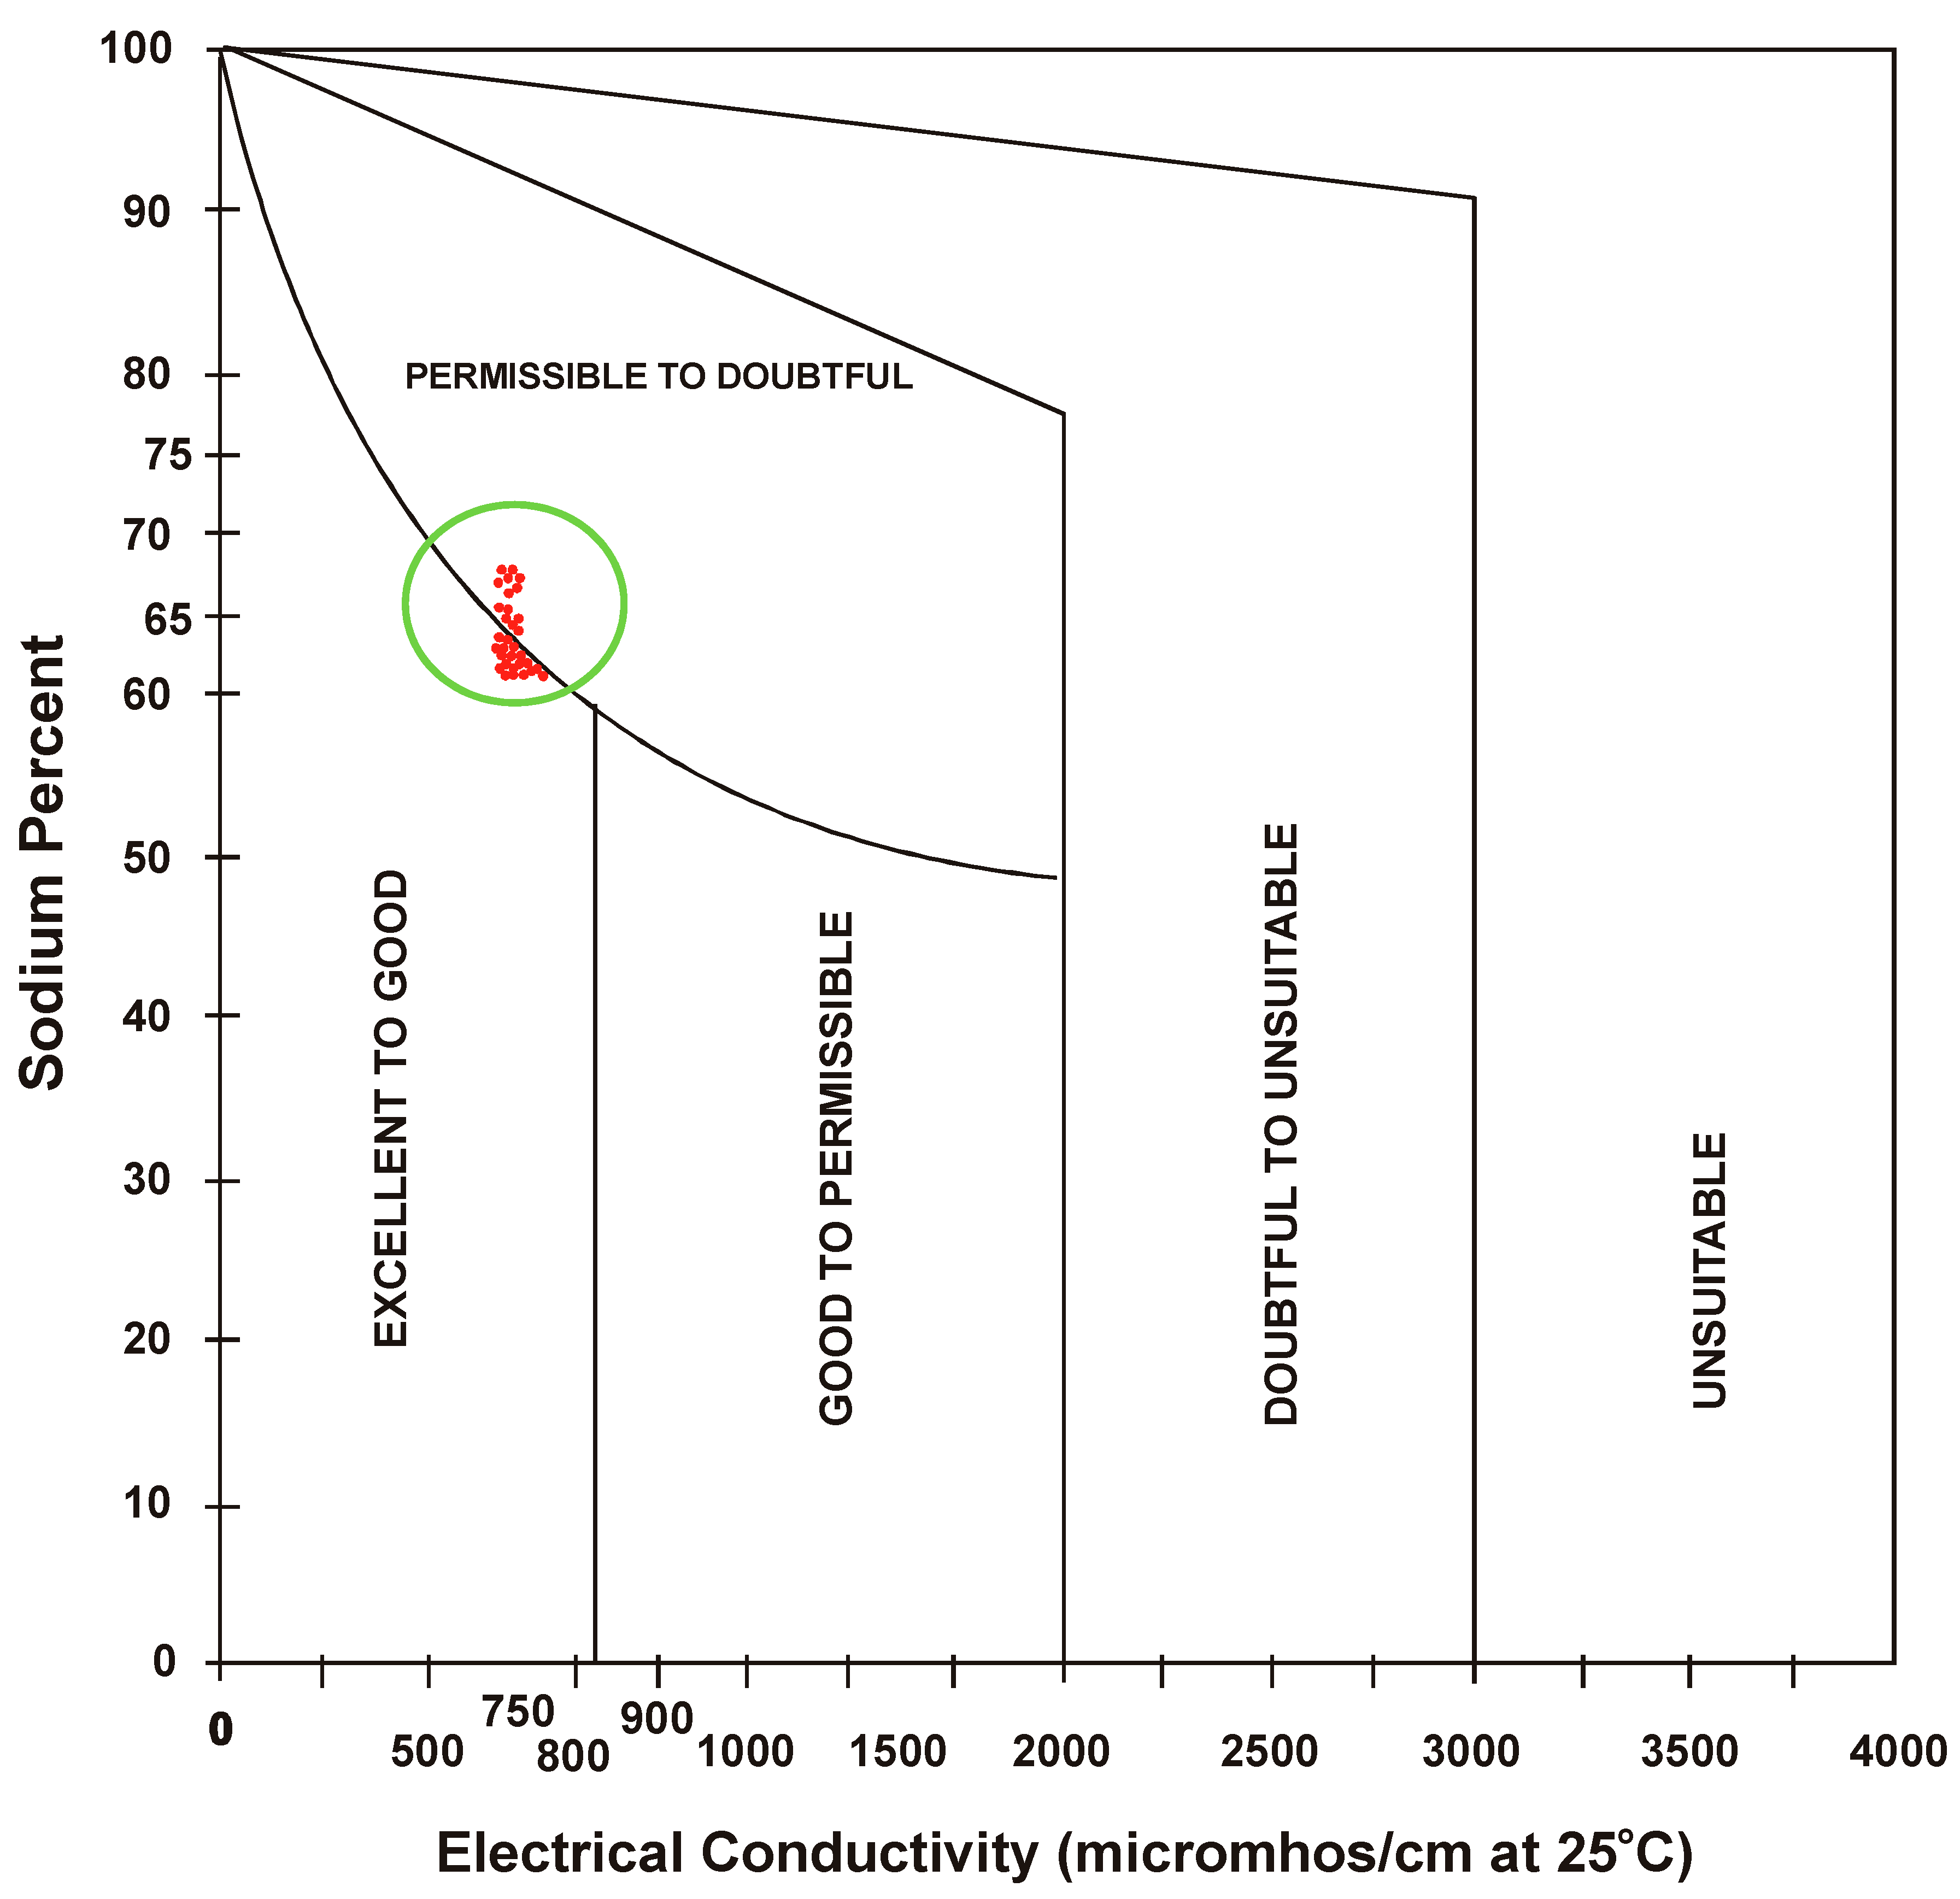
- (4)
- Sodium percent (SP) not only predicts the concentration of sodium but also causes sodium hazard when found in excess. Plot of sodium percent (SP) and electrical conductivity established water quality as “permissible to doubt full in summer and gradually converted from “excellent to good” to “permissible to doubtful”. The condition of water indicates that the sodium percent is slightly higher, thus, affecting water quality.
- (5)
- Alkalinity level was found well below threshold level; therefore, no alkalinity hazard exists. The water for irrigation is Good.
- (6)
- Up take capacity of water by plant is considerably affected in the presence of accumulated salts which reduce rate of infiltration. The analysis found that this problem has occurred and is “slight to moderate.” Rate of infiltration is also governed by permeability index (PI) which indicates the degree of infiltration suggested by Doneen. It was concluded that water in summer transitionally changed from class I to Class II along the course of flow and is good for irrigation purpose, while in winter it pertains to class I.
- (7)
- The water was also analyzed based on magnesium ratio (MR) that indicates magnesium hazard if it is greater than 50%. The results indicate that no magnesium hazard exists in both the seasons and the water can be used for irrigation purpose.
- (8)
- Chloride toxicity was also apprehended based on FAO-UN guidelines and it was found that restriction on using this water is “slight to moderate.”
Author Contributions
Funding
Conflicts of Interest
References
- Zahedi, S. Modification of expected conflicts between drinking water quality index and irrigation water quality index in water quality ranking of shared extraction wells using multi criteria decision making techniques. Ecol. Indic. 2017, 83, 368–379. [Google Scholar] [CrossRef]
- Dede, O.T.; Telci, I.T.; Aral, M.M. The use of water quality index models for the evaluation of surface water quality: A case study for Kirmir Basin, Ankara, Turkey. Water Qual. Expos. Health 2013, 5, 41–56. [Google Scholar]
- Ewaid, S.H.; Abed, S.A. Water quality index for Al-Gharraf River, southern Iraq. Egypt. J. Aquat. Res. 2017, 43, 117–122. [Google Scholar] [CrossRef]
- Akkoyunlu, A.; Akiner, M.E. Pollution evaluation in streams using water quality indices: A case study from Turkey’s Sapanca Lake Basin. Ecol. Indic. 2012, 18, 501–511. [Google Scholar] [CrossRef]
- Mohebbi, M.R.; Saeedi, R.; Montazeri, A.; Vaghefi, K.A.; Labbafi, S.; Oktaie, S.; Abtahi, M.; Mohagheghian, A. Assessment of water quality in groundwater resources of Iran using a modified drinking water quality index (DWQI). Ecol. Indic. 2013, 30, 28–34. [Google Scholar] [CrossRef]
- Gharibi, H.; Mahvi, A.H.; Nabizadeh, R.; Arabalibeik, H.; Yunesian, M.; Sowlat, M.H. A novel approach in water quality assessment based on fuzzy logic. J. Environ. Manag. 2012, 112, 87–95. [Google Scholar] [CrossRef] [PubMed]
- Layhee, M.; Sepulveda, A.; Ray, A.; Mladenka, G.; Van Every, L. Ecological relevance of current water quality assessment unit designations in impaired rivers. Sci. Total Environ. 2015, 536, 198–205. [Google Scholar] [CrossRef] [PubMed]
- Wang, X.; Yin, Z.-Y. Using GIS to assess the relationship between land use and water quality at a watershed level. Environ. Int. 1997, 23, 103–114. [Google Scholar] [CrossRef]
- Nikoo, M.R.; Kerachian, R.; Malakpour-Estalaki, S.; Bashi-Azghadi, S.N.; Azimi-Ghadikolaee, M.M. A probabilistic water quality index for river water quality assessment: A case study. Environ. Monit. Assess. 2011, 181, 465–478. [Google Scholar] [CrossRef] [PubMed]
- Wilcox, L.V. The Quality of Water for Irrigation Use. In Technical Bulletin No. 962, 1948; United States Department of Agriculture, Economic Research Service: Washington, DC, USA, 1948. [Google Scholar]
- Richards, L. Diagnosis and Improvement of Saline and Alkali Soils; United States Salinity Laboratory: Washington, DC, USA, 1954; 160p.
- Doneen, L. Water Quality for Agriculture; Department of Irrigation, University of California: Davis, CA, USA, 1964; p. 48. [Google Scholar]
- Rahman, M.; Das, R.; Hassan, N.; Roy, K.; Haque, F.; Akber, M.A. Environmental study on water quality of Mayur River with reference to suitability for irrigation. Int. J. Environ. Sci. 2014, 4, 1150. [Google Scholar]
- Somay, M.A.; Filiz, S. Hydrology, hydrogeology and hydrochemistry of wetlands: A case study in Izmir Bird Paradise, Turkey. Environ. Geol. 2003, 43, 825–835. [Google Scholar] [CrossRef]
- Abdel-Satar, A.M.; Ali, M.H.; Goher, M.E. Indices of water quality and metal pollution of Nile River, Egypt. Egypt. J. Aquat. Res. 2017, 43, 21–29. [Google Scholar] [CrossRef]
- Ogunfowokan, A.; Obisanya, J.; Ogunkoya, O. Salinity and sodium hazards of three streams of different agricultural land use systems in Ile-Ife, Nigeria. Appl. Water Sci. 2013, 3, 19–28. [Google Scholar] [CrossRef]
- Nagaraju, A.; Kumar, K.S.; Thejaswi, A. Assessment of groundwater quality for irrigation: A case study from Bandalamottu lead mining area, Guntur District, Andhra Pradesh, South India. Appl. Water Sci. 2014, 4, 385–396. [Google Scholar] [CrossRef]
- Salifu, M.; Aidoo, F.; Hayford, M.S.; Adomako, D.; Asare, E. Evaluating the suitability of groundwater for irrigational purposes in some selected districts of the Upper West region of Ghana. Appl. Water Sci. 2017, 7, 653–662. [Google Scholar] [CrossRef]
- FAO-UN. Water Quality for Agriculture; Food and Agriculture Organization of the United Nations (FAO-UN): Rome, Italy, 1985; Volume 29. [Google Scholar]
- Fipps, G. Irrigation Water Quality Standards and Salinity Management Strategies; Texas Agricultural Extension Service, Texas A&M University System: College Station, TX, USA, 2003; Volume B-1667, pp. 1–19. [Google Scholar]
- Camberato, J.J.; Peterson, P.D.; Bruce Martin, S. Salinity and salinity tolerance alter rapid blight in Kentucky bluegrass, perennial ryegrass, and slender creeping red fescue. Appl. Turfgrass Sci. 2006, 3. [Google Scholar] [CrossRef]
- Arveti, N.; Sarma, M.R.; Aitkenhead-Peterson, J.A.; Sunil, K. Fluoride incidence in groundwater: a case study from Talupula, Andhra Pradesh, India. Environ. Monit. Assess. 2011, 172, 427–443. [Google Scholar] [CrossRef] [PubMed]
- Silva, E. Quality of irrigation water in Sri Lanka–status and trends. Asian J. Water Environ. Pollut. 2004, 1, 5–12. [Google Scholar]
- Richards, L.A. Diagnosis and Improvement of Saline and Alkali Soils; United States Department of Agriculture: Washington, DC, USA, 1969.
- Wilcox, L.V. Classification and Use of Irrigation Waters; US Department of Agriculture Circular 969: Washington, DC, USA, 1955.
- Joshi, D.M.; Kumar, A.; Agrawal, N. Assessment of the irrigation water quality of river Ganga in Haridwar District. Rasayan J. Chem. 2009, 2, 285–292. [Google Scholar]
- Paliwal, K.V. Irrigation with Saline Water; Monogram No. 2 (New Series); IARI: New Delhi, India, 1972; p. 198. [Google Scholar]


| Variable | Description | Mean | SD | Min. | Max. | Med. | Q1 | Q3 |
|---|---|---|---|---|---|---|---|---|
| Q | Discharge (Cusec) | 188.1 | 108.6 | 5 | 374 | 194.5 | 97.8 | 280.3 |
| pH | pH Value (1–14) | 7.65 | 0.1739 | 7.4 | 8 | 7.6 | 7.5 | 7.8 |
| EC | Electrical Conductivity (dS/m) | 0.7849 | 0.0934 | 0.632 | 0.916 | 0.7975 | 0.6967 | 0.877 |
| TDS | Total Dissolved Solids. (mg/L) | 506.92 | 64.94 | 405 | 728 | 526.5 | 448.5 | 562.25 |
| Na | Sodium. (meq/L) | 4.841 | 1.143 | 2.95 | 6.88 | 4.825 | 3.822 | 5.645 |
| Ca | Calcium (meq/L) | 1.6139 | 0.4236 | 0.83 | 2.4 | 1.66 | 1.27 | 1.93 |
| Mg | Magnesium. (meq/L) | 1.3203 | 0.3174 | 0.75 | 1.94 | 1.32 | 1.0975 | 1.5375 |
| Cl | Chloride. (meq/L) | 3.045 | 0.7437 | 1.57 | 4.29 | 3.165 | 2.42 | 3.6475 |
| HCO3 | Bicarbonate. (meq/L) | 1.0274 | 0.3847 | 0.3 | 1.72 | 1.055 | 0.7 | 1.37 |
| SAR | Sodium Absorption Ratio. | 3.9688 | 0.5011 | 3.33 | 4.72 | 3.97 | 3.44 | 4.3975 |
| SP % | Sodium Percentage. | 64.45 | 2.309 | 60.7 | 68.57 | 64.71 | 62.12 | 66.535 |
| PI % | Permeability Index. | 75.409 | 3.38 | 71.37 | 82.76 | 73.99 | 73.067 | 77.515 |
| Mg Ratio % | Magnesium Ratio | 45.054 | 1.221 | 42.23 | 47.73 | 44.755 | 44.248 | 45.81 |
| K | Potassium. (meq/L) | 16.936 | 3.123 | 13.23 | 20.81 | 16.8 | 13.88 | 19.935 |
| Distance | Segments (Miles) | 0 | 32 | |||||
| Season | S-Summer, W-Winter | S | W |
| Potential Irrigation Problem | Parameters | Degree of Restriction on Use | |||
|---|---|---|---|---|---|
| None | Slight to Moderate | Severe | |||
| Salinity | Electrical Conductivity dS/m | <0.7 | 0.7–3.0 | >3.0 | |
| Total Dissolved Solids | <450 | 450–2000 | >2000 | ||
| Infiltration based on SAR and EC | SAR | Electrical Conductivity (dS/m) | |||
| 0–3 | >0.7 | 0.7–0.2 | <0.2 | ||
| 3–6 | >1.2 | 1.2–0.3 | <0.3 | ||
| 6–12 | >1.9 | 1.9–0.5 | <0.5 | ||
| Toxicity | Sodium (Na) meq/L | <3 | 3–9 | >9 | |
| Chloride (Cl) meq/L | <4 | 4–10 | >10 | ||
| Miscellaneous Effects | Bicarbonate (HCO3) meq/L | <1.5 | 1.5–8.5 | >8.5 | |
| Potassium (K) mg/L | 0–2 | ||||
| pH | 6.5–8.4 | ||||
| Water Class | Electrical Conductivity dS/m | Salt Concentration mg/L |
|---|---|---|
| Non-Saline | <0.7 | <500 |
| Slightly Saline | 0.7–2 | 500–1500 |
| Moderately Saline | 2–10 | 1500–7000 |
| Highly Saline | 10–25 | 7000–15,000 |
| Very highly Saline | 25–45 | 15,000–35,000 |
| Brine | >45 | >45,000 |
| Permeability Index (PI) | Salinity in Terms of Cations and Anions (meq/L) | Irrigation Water Class | |||||||
|---|---|---|---|---|---|---|---|---|---|
| Summer season | Na | Ca | Mg | Cl | HCO3 | K | Total | ||
| Minimum | 72.37% | 4.94 | 1.96 | 1.61 | 3.33 | 1.49 | 0.37 | 13.7 | Class I |
| Maximum | 82.76% | 3.19 | 0.92 | 0.83 | 1.88 | 0.8 | 0.16 | 7.78 | Class II |
| Winter season | |||||||||
| Minimum | 71.37% | 5.62 | 1.88 | 1.47 | 3.64 | 0.84 | 0.51 | 13.96 | Class I |
| Maximum | 74.65% | 4.86 | 1.4 | 1.13 | 3.08 | 0.42 | 0.5 | 11.39 | Class I |
| Potential Irrigation Problem | Parameters | Degree of Restriction on Use [FAO-UN] | Quality of Water |
|---|---|---|---|
| Salinity | EC | Slight to Moderate | Slightly Saline |
| Sodium Hazard | SAR | Slight to Moderate | Low Sodium Water |
| SP and EC (Wilcox diagram) | - | In summer “permissible to doubt” and in winter transitional state from “excellent to good” to “permissible to doubtful” | |
| SAR and EC (Richard’s Diagram) | - | Medium Salinity with Low Sodium | |
| Toxicity | Na | Slight to Moderate | - |
| Cl | Slight to Moderate | - | |
| Alkalinity Hazard | RSC | None | Good |
| Infiltration Problem | SAR and EC | Slight to Moderate | - |
| PI and Total Salinity | - | Class I and II in Summer and Class I in Winter (Good) | |
| Magnesium Ratio | MR | - | Suitable for Irrigation. |
| Decision: Water cannot be used for irrigation purpose-based FAO guideline without recommended treatments. | |||
© 2019 by the authors. Licensee MDPI, Basel, Switzerland. This article is an open access article distributed under the terms and conditions of the Creative Commons Attribution (CC BY) license (http://creativecommons.org/licenses/by/4.0/).
Share and Cite
Bhatti, E.-u.-H.; Khan, M.M.; Shah, S.A.R.; Raza, S.S.; Shoaib, M.; Adnan, M. Dynamics of Water Quality: Impact Assessment Process for Water Resource Management. Processes 2019, 7, 102. https://doi.org/10.3390/pr7020102
Bhatti E-u-H, Khan MM, Shah SAR, Raza SS, Shoaib M, Adnan M. Dynamics of Water Quality: Impact Assessment Process for Water Resource Management. Processes. 2019; 7(2):102. https://doi.org/10.3390/pr7020102
Chicago/Turabian StyleBhatti, Ejaz-ul-Hassan, Mudasser Muneer Khan, Syyed Adnan Raheel Shah, Syed Safdar Raza, Muhammad Shoaib, and Muhammad Adnan. 2019. "Dynamics of Water Quality: Impact Assessment Process for Water Resource Management" Processes 7, no. 2: 102. https://doi.org/10.3390/pr7020102
APA StyleBhatti, E.-u.-H., Khan, M. M., Shah, S. A. R., Raza, S. S., Shoaib, M., & Adnan, M. (2019). Dynamics of Water Quality: Impact Assessment Process for Water Resource Management. Processes, 7(2), 102. https://doi.org/10.3390/pr7020102