Article

Numerical Simulation of a Wall-Flow Particulate Filter Made of Biomorphic Silicon Carbide Able to Fit Different Fuel/Biofuel Inputs

by
M. Pilar Orihuela
1,*,
Onoufrios Haralampous
2,
Ricardo Chacartegui
1,
Miguel Torres García
1 and
Julián Martínez-Fernández
3
1
Departamento de Ingeniería Energética, Universidad de Sevilla, Avenida de los Descubrimientos s/n, 41092 Sevilla, Spain
2
University of Thessaly, Geopolis, 41500 Larissa, Greece
3
Departamento de Física de la Materia Condensada, Universidad de Sevilla, Avenida Reina Mercedes s/n, 41012 Sevilla, Spain
*
Author to whom correspondence should be addressed.
Processes 2019, 7(12), 945; https://doi.org/10.3390/pr7120945
Submission received: 12 November 2019 / Revised: 28 November 2019 / Accepted: 4 December 2019 / Published: 11 December 2019

Abstract

:
To meet the increasingly strict emission limits imposed by regulations, internal combustion engines for transport applications require the urgent development of novel emission abatement systems. The introduction of biodiesel or other biofuels in the engine operation is considered to reduce greenhouse gas emissions. However, these alternative fuels can affect the performance of the post-combustion systems due to the variability they introduce in the exhaust particle distribution and their particular physical properties. Bioceramic materials made from vegetal waste are characterized by having an orthotropic hierarchical microstructure, which can be tailored in some way to optimize the filtration mechanisms as a function of the particle distribution of the combustion gases. Consequently, they can be good candidates to cope with the variability that new biofuel blends introduce in the engine operation. The objective of this work is to predict the filtration performance of a wall-flow particulate filter (DPF) made of biomorphic silicon carbide (bioSiC) with a systematic procedure that allows to eventually fit different fuel inputs. For this purpose; a well-validated DPF model available as commercial software has been chosen and adapted to the specific microstructural features of bioSiC. Fitting the specific filtration and permeability parameters of this biomaterial into the model; the filtration efficiency and pressure drop of the filter are predicted with sufficient accuracy during the loading test. The results obtained through this study show the potential of this novel DPF substrate; the material/microstructural design of which can be adapted through the selection of an optimum precursor.

1. Introduction

Emission levels for automotive engines are submitted to increasingly stringent limits. From September 2015, all new European diesel cars must be compliant with the Euro 6 emissions standards, which set a particle number emission limit of 6 × 10¹¹ particles km−1 and a limit of 4.5 mg km−1 for the mass of particulate [1]. In the United States, the phase-in period of Tier 3 (2017–2025) applies at a federal level, and requires automakers in the US to certify an increasing percentage of their fleet are complying with the new emissions standard (3 mg/mi of particulate matter) [2]. US standards are led by the California low emission vehicle (LEV) legislation, which sets stricter emission limits to cope with its exceptional smog problems [3]. In the near future, new standards will likely be developed for even stricter emissions. In 2017, a new worldwide harmonized light-vehicle test procedure (WLTP) came into force, and it is compulsory for all new car registrations from September 2018 [4]. Also, for non-road mobile machinery, the Stage V of the EU Regulation 2016/1628 will be effective from 1 January 2019, reducing the particles mass limit for all the engines above 19 kW, and introducing a new limit for particle number emissions [5].
Different strategies to control emissions are developed by different manufacturers. New designs on combustion chamber, injection and supercharging systems, and control are introduced in new engines to reduce particle emissions, but they are not enough to ensure the compliance with current regulation thresholds [6]. Switching to cleaner alternative fuels can be also an effective way to reduce pollutant emissions in internal combustion engines (ICEs). The introduction of biofuels in the automotive sector provide an all-inclusive solution to the dependence on fossil fuels, and the associated environmental impact [7]. Although there are multiple biofuel formulations and many different studies on the emissions derived from their application to ICEs [8,9,10], there is a general agreement in their contribution to reduce gas emissions (CH, CO) and particulate matter (PM) [11,12,13] and overall life cycle carbon dioxide (CO2) [14]. Some research suggests, nonetheless, that increasing the blending rate of biofuel in an engine may increase particulate emissions depending on the engine design [15], on the biofuel properties [16], on the engine operating conditions [17], and even on the measurement method [18]. Despite the progress in the engine technology and the development of new biofuels, complying with the current emissions standards requires highly effective aftertreatment systems in the abatement of soot particles [6,19]. Nowadays, the most popular aftertreatment system for the abatement of particulate emissions in ICEs is the wall-flow diesel particulate filter (DPF). The requirements for the proper performance of a DPF are, mainly, high filtration efficiency, low pressure drop [20], and high capacity to resist the regeneration processes [21]. With an appropriate design, and a suitable substrate, the wall-flow DPF is able to comply with the current PM legislation [20]. The challenge for a DPF is the correct balance between filtration efficiency and pressure drop for an adequate engine performance. These parameters are generally closely related, an increase in filtration efficiency brings an increase in pressure drop, and vice versa. Also, the quick saturation of the filter, and the thermal stress produced by the regeneration cycles leads, in many cases, to the cracking and collapse of the DPF structure [22], increasing engine backpressure and penalizing the engine operation.
The introduction of biodiesel or other alternative fuels in the engine operation brings a new variable to the post-combustion systems. Biofuels alter the particle size distribution in the exhaust gases [23,24], and this affects in turn the performance of the DPF [25]. The combustion of biodiesel reduces the primary particle diameter [26] and shifts the distribution curve towards smaller particles [24,27]. The behavior of a wall-flow DPF is given by its geometry (diameter, length, wall thickness, cell density) at the macroscopic scale [28], and by the properties of the material used as substrate (permeability, porosity, pore size, tortuosity) at the microscopic scale [29]. For a given geometry, the microstructural properties of the substrate define the filtration efficiency and the pressure drop of the filter. The soot size has a significant influence on the initial deep-bed loading process [30]. The search for new materials that improve DPFs permeability, thermal properties, and filtration performance is a recurrent research topic today. The alterations that new biofuel blends introduce in vehicular PM emissions should be also taken into account when designing or developing new substrates for DPFs.
Recent studies have presented biomorphic silicon carbide (bioSiC) as a viable candidate for use as a substrate in hot gas filtration applications [31,32] and, specifically, as a substrate in DPFs for automotive diesel engines [33]. BioSiC is a porous bioceramic material characterized by preserving the hierarchical biological microstructure of the wood precursor from which it was made [34] so it is considered a bio waste or biomass. In this sense, the microstructure of this material can be tailored, to some extent, by the choice of the precursor to fit any application [35]. As opposed to traditional ceramic granular media, bioSiC can be good candidate to optimize the pressure drop/efficiency balance of DPFs while coping with the variability that new biofuel blends introduce in the engine operation. BioSiC can be manufactured from a wide variety of plant species or precursors, including vegetal waste or biomass. Each precursor leads to a different microstructure. If the microstructural characterization of a precursor is known, numerical simulation techniques can be applied to predict the performance of the global filtration system and to identify the potential for its use at real scale with different fuel inputs.
Mathematical and physical models used for internal combustion engine particulates filter performance prediction, evolve from the pioneering work of Bissett and Shadman [36,37], published in 1985. The original approach proposed by Bissett was one-dimensional model with two channels, based on the basic principles of fluid-mechanics, and the application of an energy balance in the solid wall and gas phase. A transient filtration model was implemented later by Konstandopoulos et al. [38], who used exhaust conditions, including particle size distribution and wall microstructure properties, to calculate filtration efficiency in discretized wall slabs. These models have been further refined by Tandon et al. [29] who gave emphasis on the efficiency evolution during transition to cake filtration, and Bollerhof et al. [39], who studied filtration in inhomogeneous wall structures. The latter model and several variations are available in the commercial software package, named Axisuite [40], which is employed in this work. A comprehensive review of DPF modeling is given in references [41,42]. In this work, a numerical model of wall-flow DPFs has been adapted to the experimental microstructural features of the bioSiC material, in order to establish a starting point in the generalized analysis of different precursors, used for bioSiC generation. The objective is to predict the filtration performance of a bioSiC wall-flow DPF with a systematic procedure that allows to eventually improve the system performance and to fit different fuel/biofuel inputs through the identification of optimum precursors. In this study, the experimental microstructural features of bioSiC made from medium density fiberboard (MDF) were used. The validation of the model was made in a small prototype of bioSiC wall-flow DPF. It was designed, manufactured, and tested under controlled conditions, with the aid of a soot generator [33]. The resulting experimental measurements of filtration efficiency and pressure drop were then used to calibrate the real scale model, with the adjusted microstructural parameters to simulate the performance under NEDC driving cycle conditions. The same procedure might be used in the future to fit the microstructure of any other non-granular substrate.
This paper is structured in four sections. In Section 1, the motivations and objectives of the work are presented, and the general background of the model is introduced. Section 2 summarizes the main aspects and equations of the numerical model. It will describe the calibration-validation process and how the results of a small prototype were extrapolated to a full-size system. In Section 3, the main results are reported and a prediction about the performance of the filter, compared to that of other commercial systems, is presented. Finally, Section 4 summarizes the main results and conclusions.

2. Materials and Methods

The numerical model used for this work is applicable to any wall-flow DPF with constant cross-section and straight channels. A large part of the governing equations in the model act at the macroscopic scale and do not depend on the material the filter is made of, so these could be applicable to any DPF with the same geometry regardless of the composition of its substrate. There is a group of equations that model the walls of the filter and the passage of the gas through them, and here is where the microstructural characteristics of the substrate may have an effect. This group of equations depend on features of the porous material such as porosity, pore size, and permeability. Thus, to apply this latter group of equations, a previous knowledge of the biomorphic substrate is needed.

2.1. Model Description

The numerical model used in this study is built in two levels. The first level is the ‘single channel problem’. In the ‘single channel problem’, the spatial discretization is comprised of one inlet channel and four quarters of outlet channels. Figure 1 presents the frontal area of the control volume, which is marked with a dashed red line. The background image is a SEM micrograph of the MDF bioSiC filter used for the calibration and validation of the model, as explained in Section 2.2. At this level, all the equations for a single channel are solved. The second level is the ‘multi-channel problem’, which extrapolates the results of the single channel to the whole system, including the additional phenomena associated with the physics of the complete monolith.
The evolution of pressure and velocity in each single channel is described mainly through two interrelated groups of equations. On the one hand, along the free path of the inlet or the outlet channels, the behavior of the flux is governed by the mass and momentum conservation equations of fluid dynamics. On the other hand, across the porous mediums, such as the walls of the filter or the soot layer, the behavior of the flux is governed by Darcy’s law and the inertial effects (Forchheimer). Table 1 summarizes these equations. The full model is described in detail in [43].
In these equations, the subscript i is the identifier of the channel: 1 for inlet channels, and 2 for outlet channels. N is the number of walls of the channel, 4 in this case, and d is their width. The pressure drop through the substrate wall is set considering that the flow velocity v w is constant. The result is the direct application of Darcy’s law with the Forchheimer’s extension. On the contrary, the pressure drop through the soot layer is calculated, considering that the gas velocity varies along the soot layer, due to changes in gas density and flow area. Taking into account the geometrical definitions shown in Figure 2, the pressure drop through the soot layer is calculated by expressing v and ρ as a function of the coordinate w , and integrating along the thickness of the soot layer [43]. The result depends on the permeability of the particulate deposit k p , and on the soot layer thickness w p , the value of which is recalculated in every successive step with the accumulated amount.
Equations for the porous medium summarized in Table 1 depend on permeability values that must be calibrated based on experimental results. The pressure drop across the soot layer depends on the permeability of the particulate deposit k p , while the pressure drop across the substrate walls depends on the permeability of the substrate wall k w . The permeability of the particulate deposit may be expressed as a function of the local temperature and pressure, using the correlation of Pulkrabek [44]
k p = k p , 0 ( 1 + C 4 p 0 p ¯ μ T M g )
The local pressure p depends initially on the position w , but introducing this variable in the analytical approach would extremely complicate the solution. Instead, a mean value of the pressure p ¯ is considered, calculated as the average between the inlet and the outlet pressure. C 4 and k p , 0 are characteristic parameters of the porous media and must be estimated based on experimental data.
Similarly, the permeability of the wall may be expressed as
k w = 1 1 k w , 0 + C 1 ρ p + C 2 ρ p 2 · ( 1 + C 4 p 0 p ¯ μ T M g )
The permeability of the clean wall k w , 0 is the permeability of the clean bioSiC for each particular precursor under consideration. For calibration and validation purposes, this study has used a real MDF-bioSiC DPF as a model, the main features of which are summarized in Section 2.2 including its permeability in the clean stage. C 1 and C 2 are also characteristic parameters of the porous substrate but they govern the behaviour of the medium as it becomes loaded with particles. The permeability of the loaded wall is a function of the amount of soot trapped in the wall, ρ p is the instantaneous concentration of soot in the wall. Therefore, the values of C 1 and C 2 must also be estimated, based on experimental data. In the next section, the calibration procedure is explained for both the soot layer permeability and the wall permeability. With regard to the filtration model, the filtration efficiency of a porous medium is the result of the behavior of its unit collectors at the micro-scale. In this work, the model was specifically prepared to be applied to a bioSiC filter made from MDF. Thus, to model the filtration efficiency, the fiber microstructure of bioSiC made from MDF was taken into account. The filtration efficiency of a clean fiber unit collector by diffusion and interception exposed to aggregate particles is summarized in Table 2 [43,45].

2.2. Experimental Validation and Model Calibration for a bioSiC DPF

In order to determine the value of the empirical parameters included in the model, calibrate it, and validate it, the results of a previous experimental study were used. In that study, two small prototypes of bioSiC wall-flow filters were manufactured from MDF, and tested under controlled conditions in a laboratory test rig, with a soot laden gas stream. The description of the samples, the test rig, and the experimental procedure, can be found in [33]. Here, only the parameters relevant to the model are reported.
The prototypes of bioSiC wall-flow filters, with a square cross section of 9.2 × 9.2 mm and a length of 31 mm, had a cell density of 57.59 cells cm−2 (371.6 cpsi). A soot generator (PALAS GFG 1000) was used to create a gas stream laden with a particulate distribution similar to that of an ICE fueled either with fossil or biodiesel. In setting a pressure of 1.2 bar, and a spark frequency of 200 sparks s−1 at the soot generator, an argon flow rate of 5 L min−1 is obtained with a soot production of 4 mg h−1. The experimental study performed by Rodríguez-Fernández et al. with one fossil fuel, two paraffinic biofuels: an hydrotreated vegetable oil (HVO) and a gas-to-liquid biofuel (GTL) and one biodiesel [48] was taken as a reference for the identification of a standard particle size distribution. Figure 3 reproduces the particle size distributions obtained in this study; Table 3 summarizes the composition and properties of the corresponding fuels.
As mentioned before, the numerical model used in this study was solved with the aid of the commercial software Axisuite [40]. The settings for the gas inlet and the DPF in the theoretical model (Table 4) were established taking into account the real conditions under which the tests were carried out. The soot particle size distribution, characterized by the mean particle diameter and the standard deviation, was directly observed from the experimental particle size distribution curve of the soot generator, as shown in Figure 4. The soot aggregate structure of the aerosol produced by the soot generator, can be characterized by the following parameters [33]: fractal dimension D f = 2.1 [49], soot primary particle radius r 0 = 6 × 10 9   m [50], and soot primary particle density ρ 0 = 1700   kg / m 3 [51].
For the resolution of the problem, a one-dimensional discretisation of the DPF domain was used. As a result, a representative pair of channels, inlet and outlet, is used, instead of the complete square cross-section. The substrate of the DPF was modeled according to the microstructural characteristics of biomorphic silicon carbide made from MDF. For the porosity and the mean pore diameter, the values reported by Gomez-Martin et al. [31], were considered. For the initial permeability of the clean substrate, which may be dependent on the relative orientation of the wood fibers, with respect to the direction of the gas flow, the value 4·10−14 m2 was taken, calculated in a previous experimental study [33]. For the remaining physical or chemical parameters of the substrate, standard values for silicon carbide, with 44% porosity, and 9   μ m mean pore size, were selected [43].
To calibrate the empirical parameters of the model, mentioned previously, the following sequence was followed:
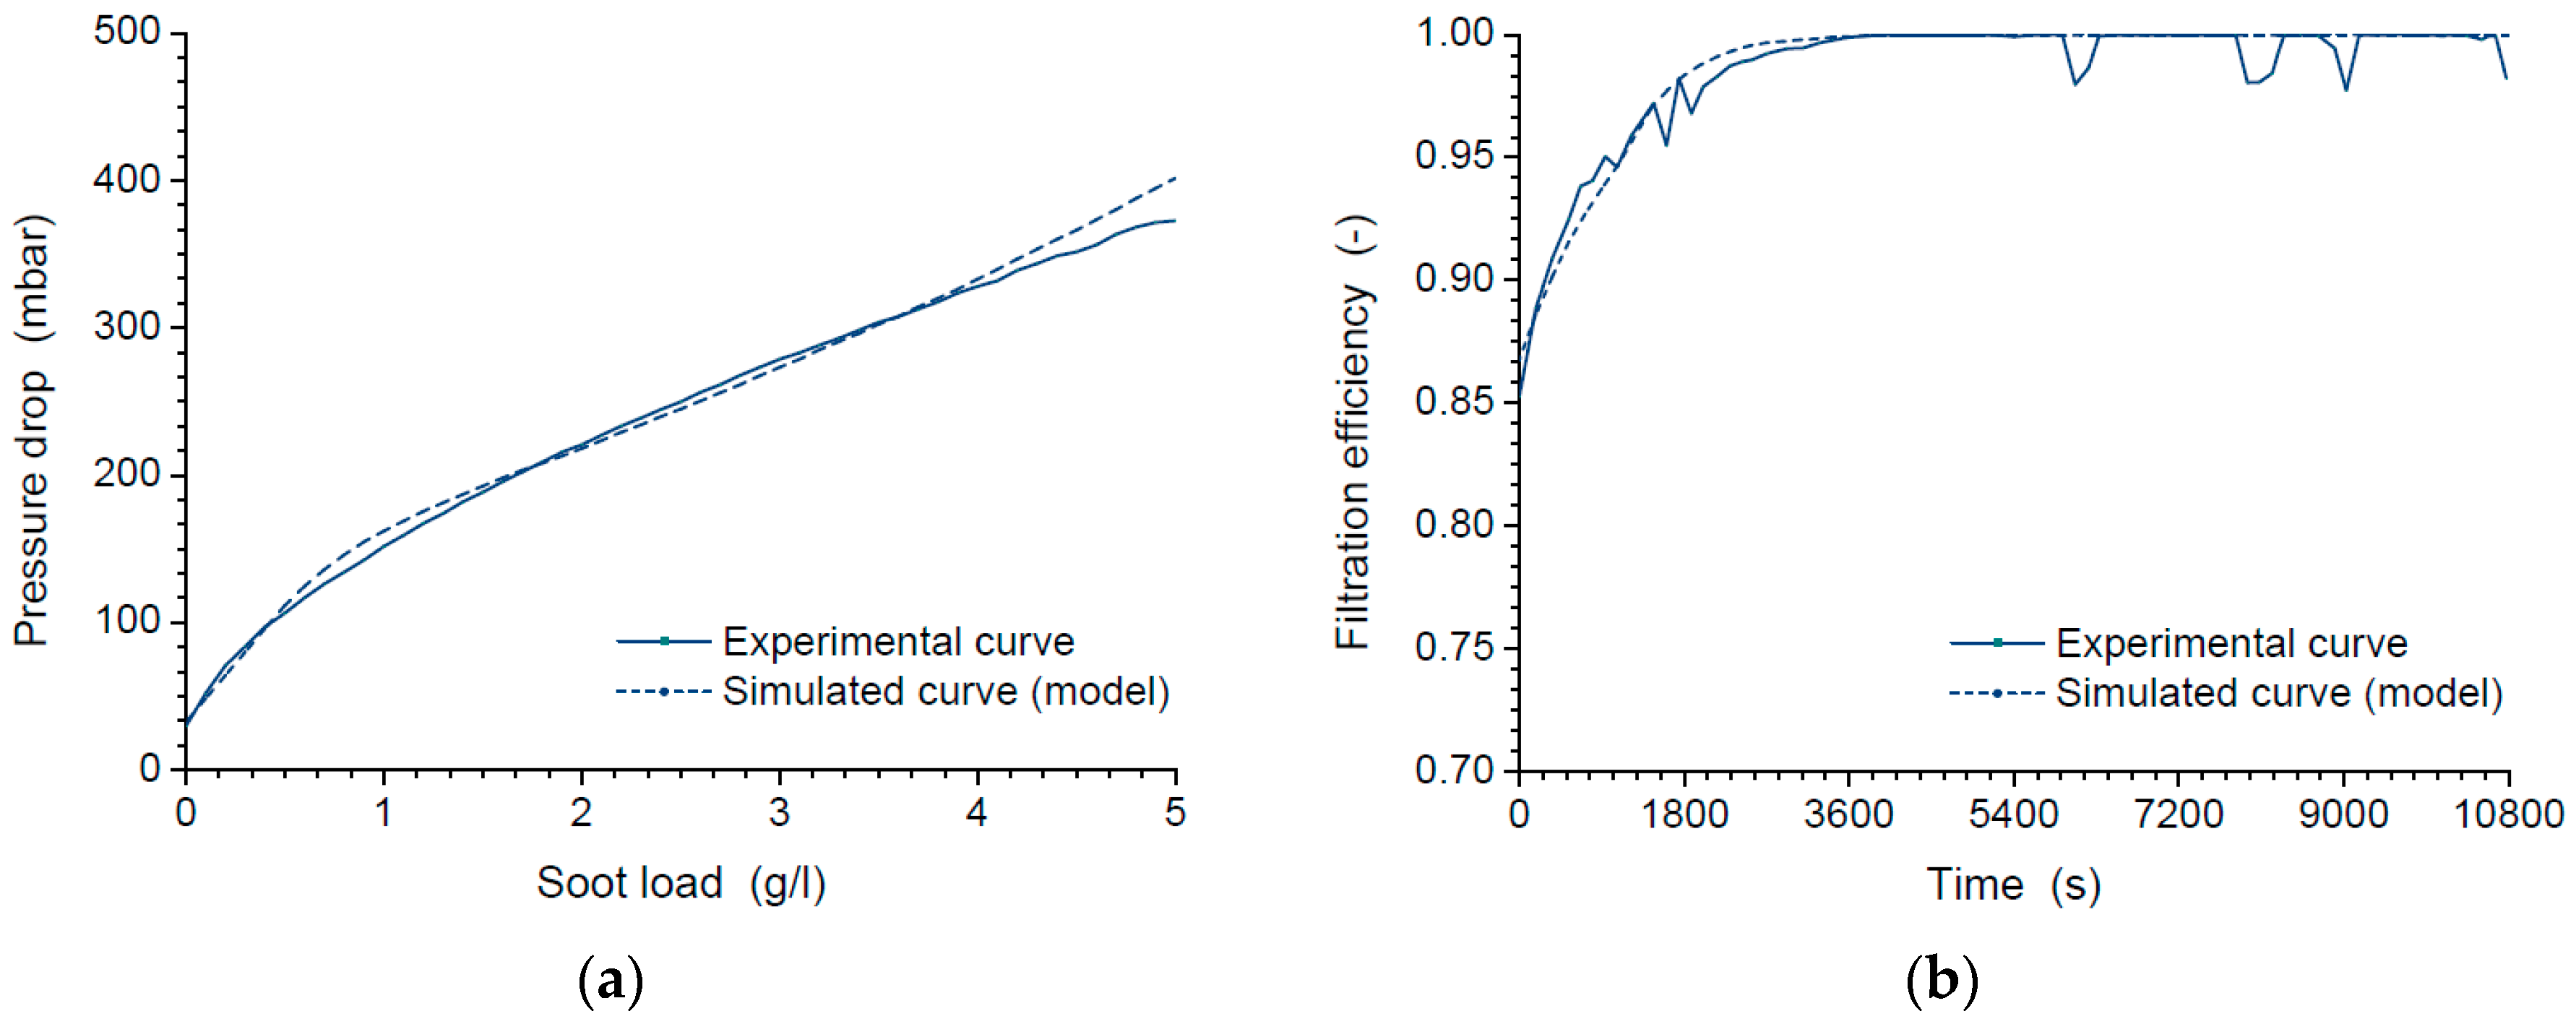
  • The parameters related to the filtration efficiency are calibrated. The initial diffusion and interception collection efficiencies ( η c l e a n , D and η c l e a n , R ), as well as the diffusion mechanism exponent of the Peclet number ( n P e ), are adjusted by matching up the initial filtration efficiency of the real filter, with the initial filtration efficiency of the modeled filter, for the different ranges of particle diameters. The filtration of small particles is mainly governed by the diffusion mechanism, while the filtration of larger particles is mainly governed by the interception mechanism. The exponent of the Peclet number affects the gradient of the efficiency curve on the right-hand side of the curve (from 10 to 100 nm). Then, the growth rate of the efficiency curve is adjusted by changing the gradient parameter in wall filtration efficiency ( η l o a d ). Calibrating these parameters, the overlap between the theoretical evolution curve of the filtration efficiency and the real curve is achieved.
  • The parameters related to the pressure drop are calibrated. If the permeability of the clean substrate is correct, the initial pressure drop resulting from the simulation should match with the real drop. From then on, there are two consecutive filtration stages. The first stage, the wall filtration stage, allows the calibration of the permeability of the loaded substrate ( k w ). Its value is adjusted by matching up the pressure drop of the real filter with the pressure drop of the modeled filter in the first growing part of the curves up to the transition phase. The second stage, the cake filtration stage, allows calibrating the soot permeability ( k p ). The soot permeability directly affects the gradient of the pressure drop during cake filtration, so the estimated value can be obtained by matching the experimental curve’s slope. Calibrating these parameters, the overlap between the theoretical evolution curve of the pressure drop and the experimental is achieved.
After calibrating the empirical parameters in the numerical model of the small 30-mm-long bioSiC prototypes, the model is validated, and an extrapolation of the model to a real-size DPF can be made.

2.3. Extrapolation to a Real-Size Automotive DPF

The extrapolation to a real-size automotive DPF affected: (i) the external dimensions of the DPF; (ii) the gas inlet conditions, corresponding in this case to the exhaust pipe of a real light-duty diesel engine (gas composition, volume flow rate, soot concentration and properties, particle size distribution, etc.); and, (iii) the thermal conditions (initial and boundary conditions of the DPF).
A standard Ø5.66” × L6” (Ø0.144 × L0.152 m) long monolith was considered as target DPF, representative of a commercial DPF. The same cell density (370 cpsi) and wall thickness (0.38 mm) of the pilot-scale prototype were maintained. Table 5 shows the DPF settings in this case.
Simulating the real exhaust conditions of a light-duty diesel engine (passenger car) with the following assumptions implied:
-
A standard concentration of species (78% N2, 10% O2, 5% CO2, 6% H2O, 0.1% CO) was introduced
-
The volume flow rate was 175 m3 h−1 (0.035 kg s−1.) accordingly to the size of the new DPF. The estimation of the mass flow rate was derived from the engine map of a four-cylinder 1997 cc diesel engine (PSA DW10ATED) operating at 1800 rpm and 100 Nm [52].
-
The initial particle size distribution and concentration was set to the standard values of a commercial automotive, light-duty diesel engine. The parameters used to characterize the distribution curve were taken from a 90 CV four-cylinder 1248 cc diesel engine (General Motors Z13DTH), belonging to the Department of Applied Science and Technology (DISAT) of the Politecnico di Torino. Its particulate (PM) emissions were measured with a scanning mobility particle sizer (SMPS), showing a log-normal distribution with mean particle diameter equal to 80 nm and standard deviation equal to 1.41. From this distribution, multiplying by the effective density of the particles in each size range, a soot production of 4.15 g h−1 was calculated. The effective density was calculated with an empirical correlation [55]: ρ ( d ) = 7543.9   d 0.56 .
-
The soot aggregate structure was defined through the following parameters: the primary particle radius was set to 12 nm according to [54]; the fractal dimension was set to 2.07 [53]; and, for the primary particle density, the default value 2000 kg m−3 was left.
Table 5 also summarizes all these parameters used to simulate the real exhaust gases of a diesel engine.
There are three fixed parameters throughout the whole study. These are the three microstructural characteristics of the bioSiC substrate: permeability, porosity, and mean pore size. Also, the calibrated parameters shown in the Results section for the filtration and pressure drop performance of the filter were left unaltered, except for the soot permeability, as the permeability of real diesel soot may differ from that of the graphite soot produced artificially in a soot generator. In the extrapolation process to simulate a real-scale bioSiC DPF, the last step was to adapt the gas inlet temperature to simulate the real operating conditions of the DPF in the engine. Although the regeneration process was not studied in this work, the thermal equations and the reaction scheme were activated in the model, so the temperature of the gas raises the temperature of the substrate, slightly affecting the early stages of soot oxidation. The temperature of the inlet gas was set to 200 °C.

3. Results

Equations presented in Table 1 and Table 2 summarize the numerical model used to simulate the performance of a bioSiC wall-flow filter. The validation of the model is achieved through the calibration of the empirical parameters discussed in Section 2.2 based on experimental tests. Table 6 shows all the resulting values.
In adjusting these parameters, an overlap between the calculated (model) and the experimental curves of filtration efficiency and pressure drop is sought. Figure 5 shows how these curves look after the calibration process.
The real evolution of the pressure drop in the filter follows a very slow transition, from the deep-bed filtration stage to the soot-cake filtration stage. Biomorphic silicon carbide has a high soot storage capacity, so that the permeability of the loaded wall almost reaches (diminishing) the permeability of the soot, in the last loading stages, before the cake starts forming. In the simulation, this transition is a little sharper, as can be seen in Figure 5a. The filtration efficiency is high from the beginning, at the clean stage, but the growing trend is slower. The gradient parameter in wall filtration efficiency ( η l o a d ) is small, compared to a typical SiC substrate. The model shows a small gradient change at the transition from the deep bed filtration to the soot cake filtration. The late transition time point is a result of the high soot storage capacity of the substrate. In any case, after one hour of soot load, the filtration efficiency reaches a value close to 100% (Figure 5b). All simulations were performed in Axitrap [43].
The maximum deviation between the experimental pressure drop curve and the modeled curve is 8.7% and occurs in the transition point from deep-bed filtration to cake filtration (Figure 5a). For the rest of the points, the deviation remains below this limit, although a diverging trend can be noticed in the last part of the curve (soot load > 4 mg). In Figure 5b, the maximum error between the experimental filtration efficiency and that modeled, in averaged trends, is 4%. Higher local deviations (up to 9%) are observed at some points, due to oscillations in the experimental curves. The authors attribute these oscillations in the measured concentration of particles to the sudden release of particle agglomerations from the filter substrate due to the dragging effect of the gas flow.

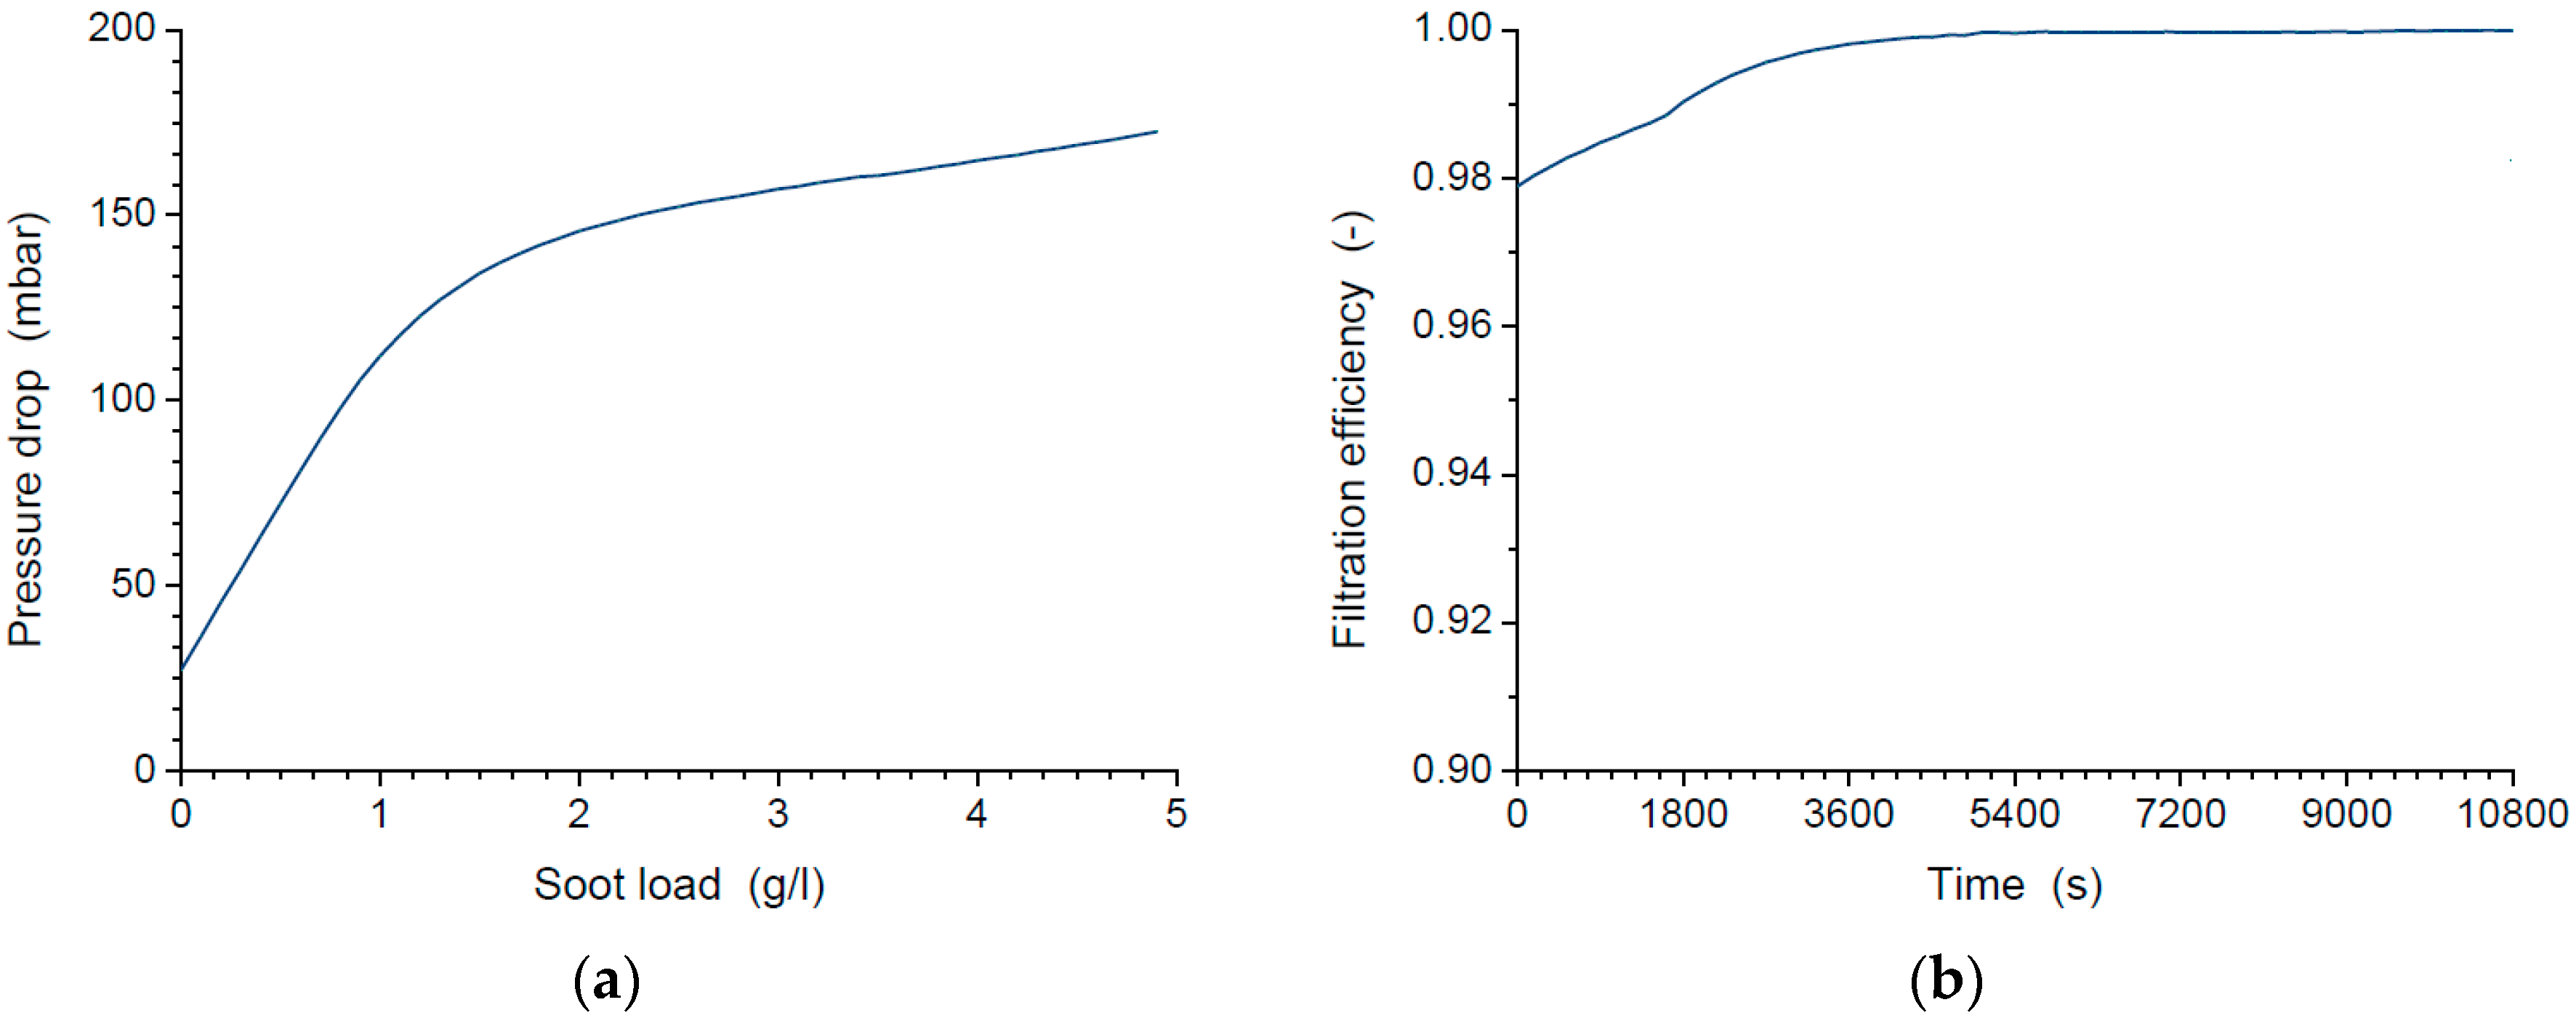
Filtration Efficiency and Pressure Drop of a Full-Size bioSiC DPF

Next, the results of simulating the model for the full-size DPF are presented. Figure 6 shows the evolution of the pressure drop with the soot load, and the evolution of the filtration efficiency with time, both for the Ø5.66” × L6.0” (Ø0.144 × L0.152 m) bioSiC DPF with 370 cpsi and 0.38 mm wall thickness.
When the full-size filter is simulated, the resulting filtration efficiency is higher than that of the original prototype. This may be explained based on the different particle size distributions at the inlet and the dependence of the filtration efficiency on the particle diameter [56]. From 50 nm, the filtration efficiency of an MDF-bioSiC DPF increases with the particle size. It may vary between 0.55 and 0.85 for particles smaller than 100 nm, and between 0.7 and 0.95, for particles larger than 100 nm [33]. The soot generator used for the laboratory tests had a mean particle diameter of 144 nm, while a standard diesel engine has a mean particle diameter of 80 nm. Hence, when exposed to the particle distribution used in the laboratory tests, the bioSiC DPF has lower filtration efficiency than in the case of using the particle distribution of an engine.

4. Discussion

Results presented in Figure 6 cannot be directly compared to other published studies, due to differences in the boundary conditions and filter design. For example, gas flow rate, temperature, cell density, and wall thickness can significantly affect the results. In order to evaluate the performance of the bioSiC DPF compared to other options available in the market, a comparative study was carried out, adapting the bioSiC DPF geometrical features and test conditions to those reported in the literature.

4.1. Comparison with Commercial DPFs

In order to assess the performance of the bioSiC DPF as a particulate filter, and to compare it with other reported specimens, a set of reference cases from the literature were selected. They are summarized in Table 7 and Table 8. Those values not given in the reference case were left unaltered as in Table 5.
For each reference case, the specific characteristics of the DPF and the test conditions were maintained but leaving the microstructural features of a biomorphic substrate. When some data were not provided in the reference, the value for the specific variable was estimated or approximated, based on similar cases. The resulting filtration efficiency and pressure drop are then compared with those presented in each reference for each DPF example.
The comparative study has focused both on the initial clean-state performance of the DPF, as well as on the evolution during loading. The performance at clean state depends only on the characteristics of the substrate, while the evolution also depends on the soot and its interaction with the microstructure of the porous medium. Table 9 shows the results of the comparison study in terms of pressure drop at the clean stage. It summarizes the initial pressure drop of a number of commercial DPFs found in the literature, and, for each case, the calculated pressure drop that a bioSiC DPF would have if it had the same geometrical features, and were tested under the same conditions.
The permeability of bioSiC made from MDF depends on the flow direction. When the gas flows in the compression direction of the panel (perpendicular to the fibres), the Darcian permeability is around 1·10−12 m2 [31]. When the gas flows perpendicular to the compression direction (in the same plane of the fibers), the Darcian permeability is around 4 × 10⁻¹⁴ m2 [33]. This latter permeability better characterizes the substrate of the real DPF prototype, and is used in this work. This permeability is relatively low compared to other commercial substrates for DPFs. As a result, the pressure drop of a bioSiC filter is, for the reference cases, in general, higher than the pressure drop of the majority of the other filters used for comparison. Only cordierite filters may have similar or higher pressure drops.
A similar comparison can be made with the initial filtration efficiency of the filters. Table 10 summarizes the initial efficiency of a number of commercial DPFs found in the literature, and, for each case, the calculated efficiency that a bioSiC DPF would have if it had the same geometrical features and were tested under the same conditions. The filtration efficiency of the bioSiC DPF is, in all the cases, higher than the values obtained for the reference cases, with values always above 90%. They are considerably high, taking into account that this represents only the clean stage, and that it will increase as the DPF gets loaded with particles.

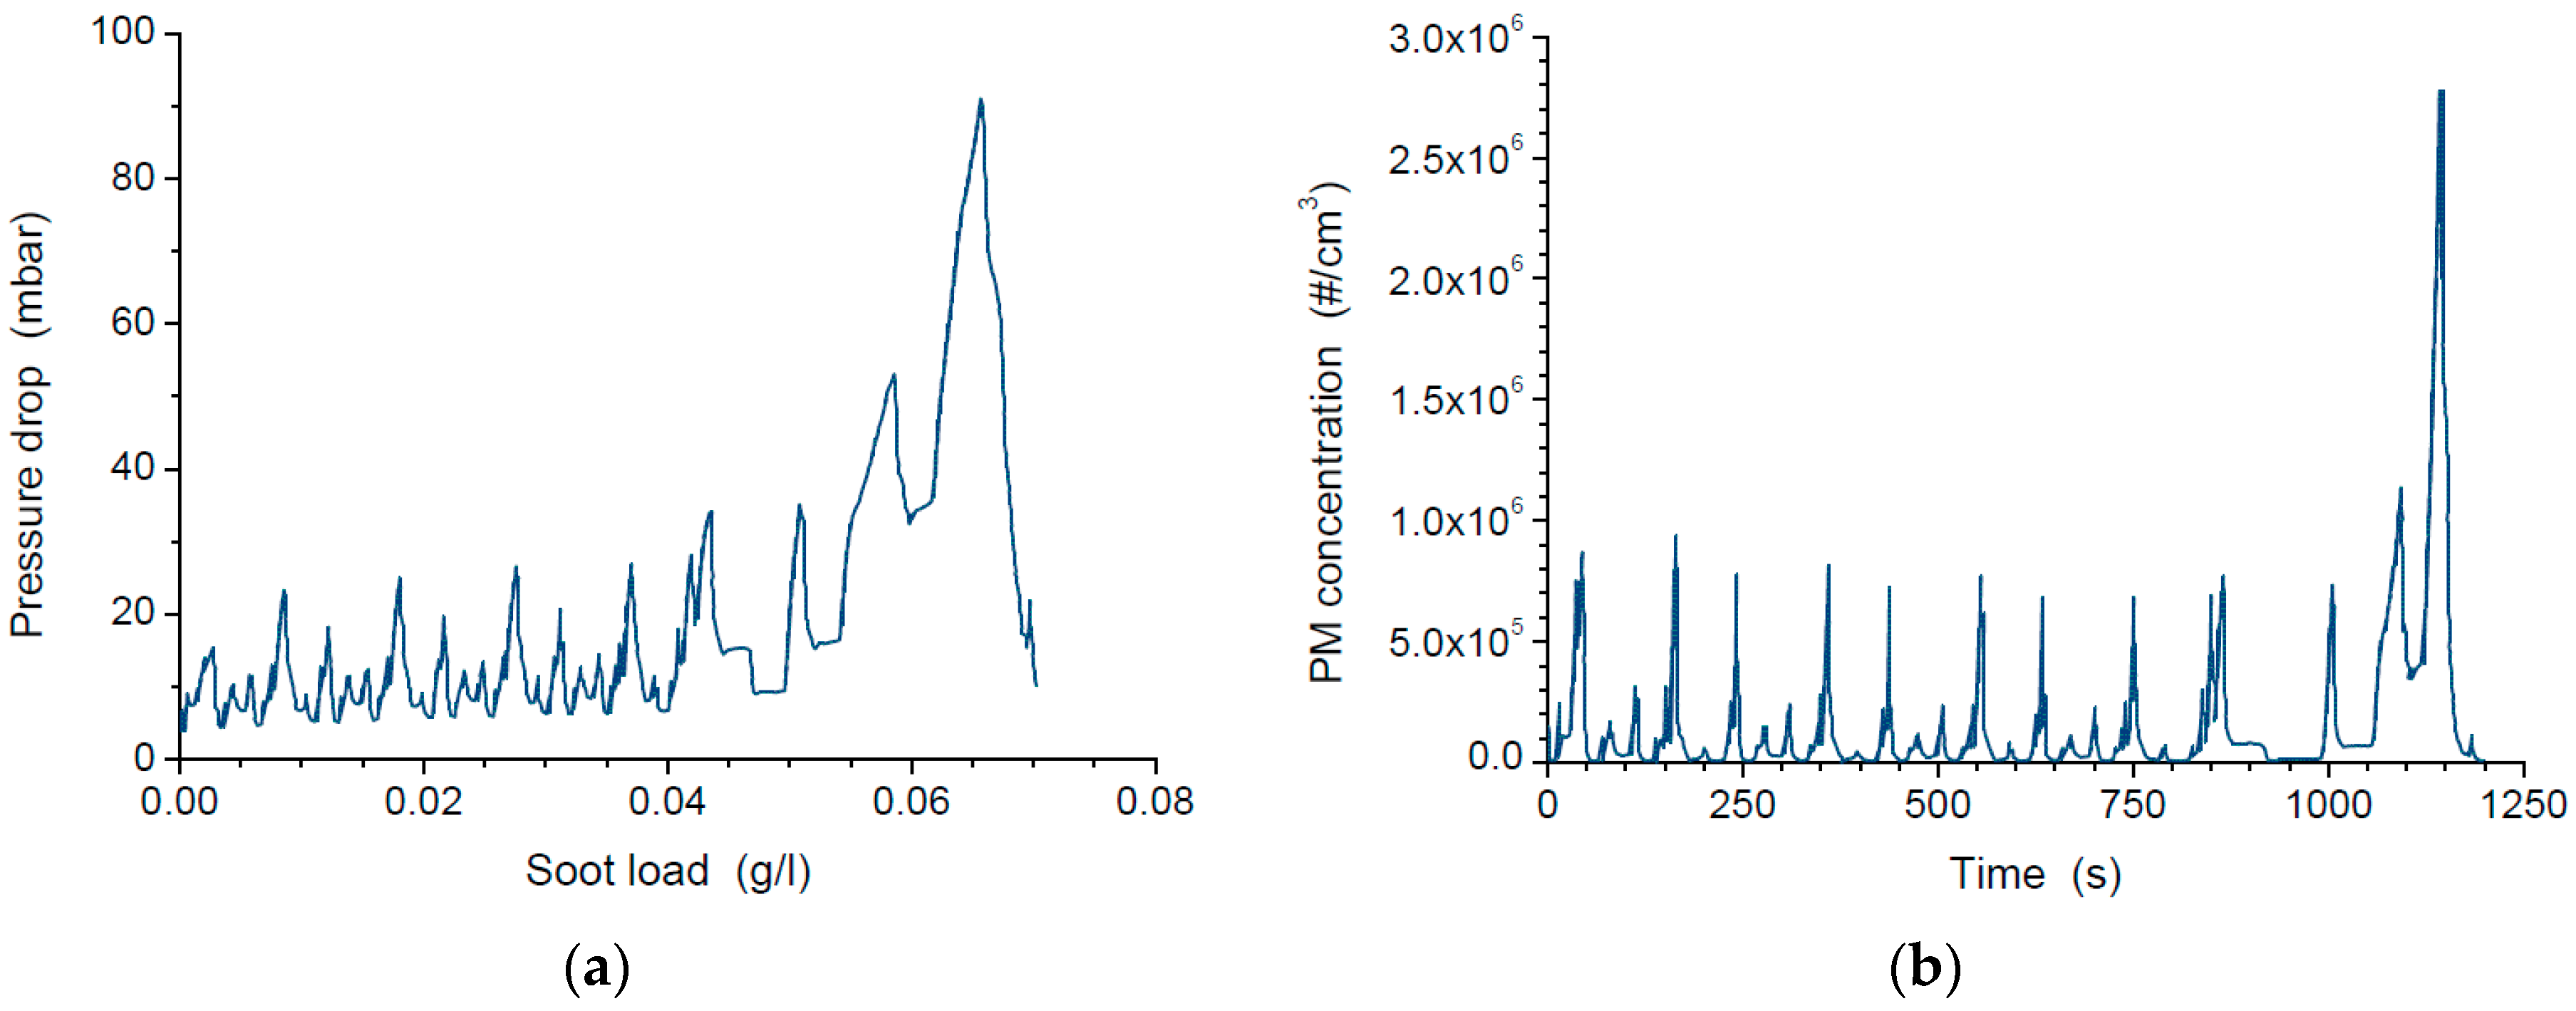
4.2. Behavior under a New European Driving Cycle (NEDC)

In order to evaluate the performance under transient conditions and assess its potential to fulfil current regulation, the bioSiC wall-flow DPF was simulated under a standard driving cycle. A pre-set NEDC (New European Driving Cycle) 2.2 L diesel Euro 4 scenario was used, which includes data acquired from a Honda Accord, 2.2 i-CTDi, Euro 4 CI engine, tested on a roller bench. The NEDC is established by the current European regulation for the homologation of passenger cars [64] and comprises four identical ECE segments (urban cycles), followed by one EUDC segment (extra urban cycle). The total distance of the combined cycle is 11,023 m, the total test time is 1180 s, and the average speed is 33.6 km h−1. The NEDC standard has been recently replaced by the WLTP at experimental level, but it is still necessary for computer model simulations [65].
In this scenario, soot emissions are automatically set as a log-normal distribution with µ = 60·10-9 m and σ = 1.8. The soot inlet concentration was set at 9.4·10-6 kg soot/kg exhaust, according to [66], where an amount of soot of 16 mg km−1 of PM in a 2.2 L Euro 4 diesel vehicle without DPF, for the NEDC cycle, is reported. The geometrical definition of the DPF was left as in Table 5: Ø5.66” × L6” (Ø0.144 × L0.152 m) with 370 cpsi and 0.38 mm wall thickness. The substrate was characterized as biomorphic silicon carbide in microstructural terms: porosity, pore diameter, and permeability. The NEDC cycle was simulated with a time step of 1 s. The total particulate emissions produced during the cycle were calculated summing up the PM concentration along the whole period. The simulation of the MDF bioSiC wall-flow DPF under the NEDC cycle yields the graphs shown in Figure 7.
In this case, the PM concentration at the outlet has been presented instead of the efficiency. Focusing the attention on the first four ECE segments (urban), a gradual increase in pressure drop and a gradual decrease in the particles release, can be observed. While the pressure drop peak in the first cycle is around 23.5 mbar, the peaks in the fourth cycle are around 27 mbar. The maximum pressure drop occurs in the extra-urban driving segment, due to the more severe operating conditions in this segment. This segment accounts for the majority of accumulated soot, but also for the majority of released particles. This is not only because the particles production in this segment is greater, but also because the filtration efficiency at this point has grown, due to the soot accumulated within the substrate in previous stages.
Summing up all the released PM emissions in the NEDC cycle, 8.75·108 particles km−1 and 0.129 mg km−1 are obtained. These values are significantly below the thresholds imposed by current regulation: 6·1011 particles km−1 for the number of particles, and 4.5 mg km−1 for the mass. Although Euro 4 engines are no longer in production in Europe, there are car markets (e.g., India) where this technology can prove its efficiency regarding the pollutant emissions reduction. These results have been obtained with a non-optimized precursor/geometry integration. In this work, a bioSiC made from MDF has been used. It is characterized not only by having very good filtration efficiency, but also by having lower permeability than other tested substrates. There is potential to optimize it to maintain high filtration efficiency, reducing pressure drop, by choosing different precursors.

5. Conclusions

Internal combustion engines for transport applications require the urgent development of novel emission abatement systems. In this work, the potential of bioSiC wall-flow DPFs as aftertreatment systems in automotive engines is studied. These filters take advantage of the advanced microstructural features of the substrate, which can be tailored through the selection of the initial precursors, to reduce the pressure drop, and to optimize the filtration mechanisms as a function of the particle distribution of the combustion gases. By using bioceramic substrates with tailored microstructure, the trade-off between filtration efficiency and pressure drop may be overcome, and a better adaptation to new biofuel particulate emissions may be achieved. Biomorphic ceramics offer this chance of choosing from among a wide range of different microstructures: different combinations of porosity and pore size distribution with an orthotropic behavior. Different plant precursors or wood wastes can be used for generating the ceramic material, resulting in different microstructures and performance.
This work addresses, for the first time, the adaptation of a generic numerical model of wall-flow DPFs to specific microstructural parameters of the biomorphic ceramic substrate, with the aim of establishing a starting point in the generalized analysis of bioceramic precursors as automotive diesel particulate filters. A numerical model has been adapted and used to simulate a real-scale wall-flow particulate filter, made of biomorphic silicon carbide, and to predict its performance under different scenarios. The model relies on specific microstructural features of MDF-bioSiC.
It has been validated upon experimental data with a small-scale real prototype and a gas stream, laden with a distribution of laboratory generated particles with high accuracy.
Once calibrated and validated, the model was extrapolated to a real-scale DPF, in which the operating conditions of a real engine exhaust were simulated. An exhaustive analysis was then carried out to compare the predicted/modeled performance of the MDF-bioSiC DPF, and a number of DPF reference cases reported in the literature. The bioSiC DPF with a MDF substrate shows improvements in the filtration efficiencies in all cases. MDF-bioSiC DPFs show significantly high filtration efficiency, always above the efficiency of any other reported DPF, with the same geometry, and under the same testing conditions. The efficiency is around 95% at the clean stage in all the cases, and close to 100%, after a short period of time.
The model was simulated under the New European Driving Cycle (NEDC) test to evaluate the performance under transient and real driving conditions. The simulation of the bioSiC DPF under the NEDC shows that particulate emissions can be achieved, with this aftertreatment system, that are well below the regulation limits. In particular, the simulation predicts the release of 0.13 mg of soot per km, which is only 3% of the maximum mass of particles allowed by the Euro 6 standard. This shows the high interest of advancing in the development of these systems.
The pressure drop introduced by the MDF-bioSiC DPF is typically high. It is usually higher than the pressure drop introduced by other reference commercial DPFs, albeit not in all cases. This is due to the low permeability of the chosen precursor. In future works, optimization of system design/substrate integration with the engine will be developed, to improve pressure drop performance maintaining very high performance.

Author Contributions

Conceptualization, R.C.; Methodology, M.P.O. and O.H.; Software, O.H.; Validation, M.P.O.; Formal analysis, M.P.O.; Investigation, R.C., M.P.O., and O.H.; Resources, O.H.; Data curation, M.P.O.; Writing—original draft preparation, M.P.O.; Writing—review and editing, O.H., R.C., and M.T.G.; Visualization, M.T.G.; Supervision, R.C., O.H., and M.T.G.; Project administration, J.M.-F. and R.C.; Funding acquisition, J.M.-F. and R.C.

Funding

This research was funded by the Spanish Ministry of Economy and Competitiveness (MINECO), grant numbers MAT2013-41233-R, BES-2014-069023, and EEBB-I-17-12338.

Acknowledgments

This work was supported by the Spanish Ministry of Economy and Competitiveness (MINECO) (grant no. MAT2013-41233-R). M. Pilar Orihuela is very grateful to the MINECO for her pre-doctoral contract (grant no. BES-2014-069023), and for the mobility scholarship which allowed her to undertake the research stay at the Technological Educational Institute of Thessaly (grant no. EEBB-I-17-12338). The authors want to acknowledge the members of Exothermia SA for their technical support and for providing a free academic license for Axisuite. The experimental campaign was carried out with the support of Fino’s research group, at the Department of Applied Science and Technology at the Politecnico di Torino.

Conflicts of Interest

The authors declare no conflict of interest. The funders had no role in the design of the study; in the collection, analyses, or interpretation of data; in the writing of the manuscript, or in the decision to publish the results.

Nomenclature

C 1 Parameter for wall permeability correction (m kg−1)
C 2 Parameter for wall permeability correction (m4 kg−2)
C 4 Slip correction factor (m s (kg mole K)−0.5)
C E Ergun coefficient (-)
C d Parameter in the diffusional efficiency (-)
C r Parameter in the direct interception efficiency (-)
d Channel width (m)
d f i b Fiber diameter (m)
D f Fractal dimension (-)
D p a r t Particle diffusion coefficient (m2 s−1)
k Permeability (m−2)
K n Knudsen number (-)
K u Kubawara hydrodynamic factor (-)
M g Molecular weight (kg mole−1)
N Number of walls (-)
n P e Exponent of the Peclet number for the diffusion mechanism (-)
p Pressure (Pa)
P e Peclet number (-)
r 0 Soot primary particle radius (m)
R Interception parameter
Gas constant (J mole−1 K−1)
R c Maximum radius of aggregate cluster (m)
T Temperature (K)
v Velocity (m s−1)
w Thickness (m)
z Axial dimension
α 1 Constant in the channel pressure drop correlation (-)
ε p o r e Porosity (-)
μ Dynamic viscosity (Pa s)
η Filtration efficiency (-)
ρ Density (kg m−3)
ρ 0 Soot primary particle density (kg m−3)
Subscripts
0 Initial (clean) state
D Diffusion
i Identifier of the channel: 1 for inlet channels, and 2 for outlet channels
f i b Unit fiber
p Particles deposit
R Interception
s o o t Soot layer
w Wall

References

  1. Barroso, J.M. Regulation No 459/2012. Off. J. Eur. Comm. 2012, 142, 16–24. [Google Scholar]
  2. United States: Cars and Light-Duty Trucks: Tier 3. Available online: www.dieselnet.com/standards/us/ld_t3 (accessed on 26 June 2019).
  3. Hooftman, N.; Messagie, M.; Van Mierlo, J.; Coosemans, T. A review of the European passenger car regulations—Real driving emissions vs local air quality. Renew. Sustain. Energy Rev. 2018, 86, 1–21. [Google Scholar] [CrossRef]
  4. European Automobile Manufacturers’ Association. WLTP Facts. Available online: http://wltpfacts.eu (accessed on September 15, 2019).
  5. Regulation (EU) 2016/1628 of the European Parliament and the council, of 14 September 2016. Off. J. Eur. Union 2016, 252, 53–117.
  6. Reşitoğlu, İ.A.; Altinişik, K.; Keskin, A. The pollutant emissions from diesel-engine vehicles and exhaust aftertreatment systems. Clean Technol. Environ. Policy 2015, 17, 15–27. [Google Scholar] [CrossRef] [Green Version]
  7. The European Parliament and the Council Directive 2003/30/EC of the European Parliament and of the Council of 8 May 2003 on the promotion of the use of biofuels or other renewable fuels for transport. Off. J. Eur. Union 2003, L 123, 42–46.
  8. Wu, F.; Wang, J.; Chen, W.; Shuai, S. A study on emission performance of a diesel engine fueled with five typical methyl ester biodiesels. Atmos. Environ. 2009, 43, 1481–1485. [Google Scholar] [CrossRef]
  9. Tayari, S.; Abedi, R.; Rahi, A. Comparative assessment of engine performance and emissions fueled with three different biodiesel generations. Renew. Energy 2020, 147, 1058–1069. [Google Scholar] [CrossRef]
  10. Verma, P.; Stevanovic, S.; Zare, A.; Dwivedi, G.; Van, T.C.; Davidson, M.; Rainey, T.; Brown, R.J.; Ristovski, Z.D. An overview of the influence of biodiesel, alcohols, and various oxygenated additives on the particulate matter emissions from diesel engines. Energies 2019, 12, 1987. [Google Scholar] [CrossRef] [Green Version]
  11. Ogunkunle, O.; Ahmed, N.A. A review of global current scenario of biodiesel adoption and combustion in vehicular diesel engines. Energy Rep. 2019, 5, 1560–1580. [Google Scholar] [CrossRef]
  12. Mofijur, M.; Rasul, M.G.; Hyde, J.; Azad, A.K.; Mamat, R.; Bhuiya, M.M.K. Role of biofuel and their binary (diesel-biodiesel) and ternary (ethanol-biodiesel-diesel) blends on internal combustion engines emission reduction. Renew. Sustain. Energy Rev. 2016, 53, 265–278. [Google Scholar] [CrossRef] [Green Version]
  13. E, J.; Pham, M.; Zhao, D.; Deng, Y.; Le, D.H.; Zuo, W.; Zhu, H.; Liu, T.; Peng, Q.; Zhang, Z. Effect of different technologies on combustion and emissions of the diesel engine fueled with biodiesel: A review. Renew. Sustain. Energy Rev. 2017, 80, 620–647. [Google Scholar] [CrossRef]
  14. Karavalakis, G.; Bakeas, E.; Fontaras, G.; Stournas, S. Effect of biodiesel origin on regulated and particle-bound PAH (polycyclic aromatic hydrocarbon) emissions from a Euro 4 passenger car. Energy 2011, 36, 5328–5337. [Google Scholar] [CrossRef]
  15. Durbin, T.D.; Collins, J.R.; Norbeck, J.M.; Smith, M.R. Effects of Biodiesel, Biodiesel Blends, and a Synthetic Diesel on Emissions from Light Heavy-Duty Diesel Vehicles. Environ. Sci. Technol. 2000, 34, 349–355. [Google Scholar] [CrossRef]
  16. Kontses, A.; Dimaratos, A.; Keramidas, C.; Williams, R.; Hamje, H.; Ntziachristos, L.; Samaras, Z. Effects of fuel properties on particulate emissions of diesel cars equipped with diesel particulate filters. Fuel 2019, 255, 115879. [Google Scholar] [CrossRef]
  17. Fontaras, G.; Karavalakis, G.; Kousoulidou, M.; Tzamkiozis, T.; Ntziachristos, L.; Bakeas, E.; Stournas, S.; Samaras, Z. Effects of biodiesel on passenger car fuel consumption, regulated and non-regulated pollutant emissions over legislated and real-world driving cycles. Fuel 2009, 88, 1608–1617. [Google Scholar] [CrossRef]
  18. Szabados, G.; Bereczky, Á.; Ajtai, T.; Bozóki, Z. Evaluation analysis of particulate relevant emission of a diesel engine running on fossil diesel and different biofuels. Energy 2018, 161, 1139–1153. [Google Scholar] [CrossRef]
  19. Buono, D.; Senatore, A.; Prati, M.V. Particulate filter behaviour of a Diesel engine fueled with biodiesel. Appl. Therm. Eng. 2012, 49, 147–153. [Google Scholar] [CrossRef]
  20. Guan, B.; Zhan, R.; Lin, H.; Huang, Z. Review of the state-of-the-art of exhaust particulate filter technology in internal combustion engines. J. Environ. Manag. 2015, 154, 225–258. [Google Scholar] [CrossRef]
  21. Lupše, J.; Campolo, M.; Soldati, A. Modelling soot deposition and monolith regeneration for optimal design of automotive DPFs. Chem. Eng. Sci. 2016, 151, 36–50. [Google Scholar] [CrossRef]
  22. Martirosyan, K.S.; Chen, K.; Luss, D. Behavior features of soot combustion in diesel particulate filter. Chem. Eng. Sci. 2010, 65, 42–46. [Google Scholar] [CrossRef]
  23. Guo, Y.; Stevanovic, S.; Verma, P.; Jafari, M.; Jabbour, N.; Brown, R.; Cravigan, L.; Alroe, J.; Godday, C.; Brown, R.; et al. An experimental study of the role of biodiesel on the performance of diesel particulate filters. Fuel 2019, 247, 67–76. [Google Scholar] [CrossRef]
  24. Ajtai, T.; Pintér, M.; Utry, N.; Kiss-Albert, G.; Gulyás, G.; Pusztai, P.; Puskás, R.; Bereczky, A.; Szabados, G.; Szabó, G.; et al. Characterisation of diesel particulate emission from engines using commercial diesel and biofuels. Atmos. Environ. 2016, 134, 109–120. [Google Scholar] [CrossRef]
  25. Bermúdez, V.; Serrano, J.R.; Piqueras, P.; Sanchis, E.J. On the impact of particulate matter distribution on pressure drop of wall-flow particulate filters. Appl. Sci. 2017, 7, 234. [Google Scholar] [CrossRef] [Green Version]
  26. Savic, N.; Rahman, M.M.; Miljevic, B.; Saathoff, H.; Naumann, K.H.; Leisner, T.; Riches, J.; Gupta, B.; Motta, N.; Ristovski, Z.D. Influence of biodiesel fuel composition on the morphology and microstructure of particles emitted from diesel engines. Carbon 2016, 104, 179–189. [Google Scholar] [CrossRef] [Green Version]
  27. Nyström, R.; Sadiktsis, I.; Ahmed, T.M.; Westerholm, R.; Koegler, J.H.; Blomberg, A.; Sandström, T.; Boman, C. Physical and chemical properties of RME biodiesel exhaust particles without engine modifications. Fuel 2016, 186, 261–269. [Google Scholar] [CrossRef]
  28. Deng, Y.; Zheng, W.; Jiaqiang, E.; Zhang, B.; Zhao, X.; Zuo, Q. Influence of geometric characteristics of a diesel particulate filter on its behavior in equilibrium state. Appl. Therm. Eng. 2017, 123, 61–73. [Google Scholar] [CrossRef]
  29. Tandon, P.; Heibel, A.; Whitmore, J.; Kekre, N.; Chithapragada, K. Measurement and prediction of filtration efficiency evolution of soot loaded diesel particulate filters. Chem. Eng. Sci. 2010, 65, 4751–4760. [Google Scholar] [CrossRef]
  30. Chiavola, O.; Chiatti, G.; Sirhan, N. Impact of Particulate Size During Deep Loading on DPF Management. Appl. Sci. 2019, 9, 3075. [Google Scholar] [CrossRef] [Green Version]
  31. Gómez-Martín, A.; Orihuela, M.P.; Becerra-Villanueva, J.A.; Martínez-Fernández, J.; Ramírez-Rico, J. Permeability and mechanical integrity of porous biomorphic SiC ceramics for application as hot-gas filters. Mater. Des. 2016, 107, 450–460. [Google Scholar] [CrossRef]
  32. Orihuela, M.P.; Gómez-Martín, A.; Becerra-Villanueva, J.A.; Chacartegui, R.; Ramírez-Rico, J. Performance of biomorphic silicon carbide as particulate filter in diesel boilers. J. Environ. Manag. 2017, 203, 907–919. [Google Scholar] [CrossRef]
  33. Orihuela, M.P.; Gómez-Martín, A.; Miceli, P.; Becerra-Villanueva, J.A.; Chacartegui, R.; Fino, D.; Becerra, J.A.; Chacartegui, R.; Fino, D. Experimental measurement of the filtration efficiency and pressure drop of wall-flow Diesel Particulate Filters (DPF) made of biomorphic Silicon Carbide using laboratory generated particles. Appl. Therm. Eng. 2018, 131, 41–53. [Google Scholar] [CrossRef]
  34. Singh, M.; Martínez-Fernández, J.; Ramírez de Arellano-López, A. Environmentally conscious ceramics (ecoceramics) from natural wood precursors. Curr. Opin. Solid State Mater. Sci. 2003, 7, 247–254. [Google Scholar] [CrossRef]
  35. Ramírez de Arellano-López, A.; Martínez-Fernández, J.; González, P.; Domínguez, C.; Fernández-Quero, V.; Singh, M. Biomorphic SiC: A New Engineering Ceramic Material. Int. J. Appl. Ceram. Technol. 2005, 1, 56–67. [Google Scholar] [CrossRef]
  36. Bissett, E.J. Mathematical model of the thermal regeneration of a wall-flow monolith diesel particulate filter. Chem. Eng. Sci. 1984, 39, 1233–1244. [Google Scholar] [CrossRef]
  37. Bisset, E.J.; Shadman, F. Thermal regeneration of diesel-particulate monolithic filters. AIChE J. 1985, 31, 753–758. [Google Scholar] [CrossRef]
  38. Konstandopoulos, A.G.; Johnson, J.H. Wall-flow diesel particulate filters—Their pressure drop and collection efficiency. SAE Trans. 1989, 98, 625–647. [Google Scholar]
  39. Bollerhoff, T.; Markomanolakis, I.; Koltsakis, G. Filtration and regeneration modeling for particulate filters with inhomogeneous wall structure. Catal. Today 2012, 188, 24–31. [Google Scholar] [CrossRef]
  40. Exothermia SA. Available online: www.exothermia.com (accessed on 1 January 2017).
  41. Konstandopoulos, A.G.; Kostoglou, M.; Kladopoulou, E.; Vlachos, N. Advances in the science and technology of diesel particulate filter simulation. Adv. Chem. Eng. 2007, 33, 213–294. [Google Scholar]
  42. Koltsakis, G.; Haralampous, O.; Depcik, C.; Ragone, J.C. Catalyzed diesel particulate filter modeling. Rev. Chem. Eng. 2013, 29, 1–61. [Google Scholar] [CrossRef] [Green Version]
  43. Axisuite® Axitrap: Catalyzed Diesel Particulate Filter Simulation; Exothermia SA; 4.02.4.; Exothermia SA: Thessaloniki, Greece, 2015.
  44. Pulkrabek, W.W.; Ibele, W.E. The effect of temperature on the permeability a porous material. Int. J. Heat Mass Transf. 1987, 30, 1103–1109. [Google Scholar] [CrossRef]
  45. Steffens, J.; Coury, J.R. Collection efficiency of fiber filters operating on the removal of nano-sized aerosol particles: I—Homogeneous fibers. Sep. Purif. Technol. 2007, 58, 99–105. [Google Scholar] [CrossRef]
  46. Lee, K.W.; Liu, B.Y.H. Theoretical Study of Aerosol Filtration by Fibrous Filters. Aerosol Sci. Technol. 1982, 1, 147–161. [Google Scholar] [CrossRef]
  47. Liu, B.Y.H.; Rubow, K.L. Efficiency, pressure drop and figure of merit of high efficiency fibrous and membrane filter media. In Proceedings of the Fifth World Filtration Congress, Nice, France, 5–8 June 1990. [Google Scholar]
  48. Rodríguez-Fernández, J.; Lapuerta, M.; Sánchez-Valdepeñas, J. Regeneration of diesel particulate filters: Effect of renewable fuels. Renew. Energy 2017, 104, 30–39. [Google Scholar] [CrossRef]
  49. Schneider, J.; Weimer, S.; Drewnick, F.; Borrmann, S.; Helas, G.; Gwaze, P.; Schmid, O.; Andreae, M.O.; Kirchner, U. Mass spectrometric analysis and aerodynamic properties of various types of combustion-related aerosol particles. Int. J. Mass Spectrom. 2006, 258, 37–49. [Google Scholar] [CrossRef]
  50. Wentzel, M.; Gorzawski, H.; Naumann, K.H.; Saathoff, H.; Weinbruch, S. Transmission electron microscopical and aerosol dynamical characterization of soot aerosols. J. Aerosol Sci. 2003, 34, 1347–1370. [Google Scholar] [CrossRef]
  51. Gysel, M.; Laborde, M.; Mensah, A.A.; Corbin, J.C.; Keller, A.; Kim, J.; Petzold, A.; Sierau, B.; Sierau, B. Technical note: The single particle soot photometer fails to reliably detect PALAS soot nanoparticles. Atmos. Meas. Tech. 2012, 5, 3099–3107. [Google Scholar] [CrossRef] [Green Version]
  52. Stratakis, G.A.; Psarianos, D.L.; Stamatelos, A.M. Experimental investigation of the pressure drop in porous ceramic diesel particulate filters. Proc. Inst. Mech. Eng. D J. Automob. Eng. 2002, 216, 773–784. [Google Scholar] [CrossRef]
  53. Ma, Y.; Zhu, M.; Zhang, D. Effect of a homogeneous combustion catalyst on the characteristics of diesel soot emitted from a compression ignition engine. Appl. Energy 2014, 113, 751–757. [Google Scholar] [CrossRef]
  54. Lapuerta, M.; Martos, F.J.; Herreros, J.M. Effect of engine operating conditions on the size of primary particles composing diesel soot agglomerates. Aerosol Sci. 2007, 38, 455–466. [Google Scholar] [CrossRef]
  55. Haralampous, O.; Payne, S. Experimental testing and mathematical modelling of diesel particle collection in flow-through monoliths. Int. J. Engine Res. 2016, 17, 1045–1061. [Google Scholar] [CrossRef]
  56. Yang, J.; Stewart, M.; Maupin, G.; Herling, D.; Zelenyuk, A. Single wall diesel particulate filter (DPF) filtration efficiency studies using laboratory generated particles. Chem. Eng. Sci. 2009, 64, 1625–1634. [Google Scholar] [CrossRef]
  57. Mizutani, T.; Kaneda, A.; Ichikawa, S.; Miyairi, Y.; Ohara, E.; Takahashi, A.; Yuuki, K.; Matsuda, H.; Kurachi, H.; Toyoshima, T.; et al. Filtration Behavior of Diesel Particulate Filters (2). SAE Tech. Pap. 2007. [Google Scholar] [CrossRef]
  58. Dabhoiwala, R.H.; Johnson, J.H.; Naber, J.D.; Bagley, S.T. A Methodology to Estimate the Mass of Particulate Matter Retained in a Catalyzed Particulate Filter as Applied to Active Regeneration and On-Board Diagnostics to Detect Filter Failures. SAE Tech. Pap. Ser. 2008, 2008-01–0764, 1–23. [Google Scholar]
  59. Dabhoiwala, R.H.; Johnson, J.H.; Naber, J.D. Experimental Study Comparing Particle Size and Mass Concentration Data for a Cracked and Un-Cracked Diesel Particulate Filter. SAE Tech. Pap. Ser. 2009, 2009-01–0629, 1–12. [Google Scholar]
  60. Tsuneyoshi, K.; Takagi, O.; Yamamoto, K. Effects of Washcoat on Initial PM Filtration Efficiency and Pressure Drop in SiC DPF. SAE Tech. Pap. Ser. 2011, 2011-01–08, 1–10. [Google Scholar]
  61. www.testo.com Soot generator testo REXS–Reproducible EXhaust Simulator-Data sheet 1–2. Available online: https://static-int.testo.com/media/4d/22/d72019911546/testo-REXS-Datasheet-1981-9514.pdf (accessed on 10 December 2019).
  62. Haralampous, O.A.; Kandylas, I.; Koltsakis, G.C.; Samaras, Z. Diesel particulate filter pressure drop Part 1: Modelling and experimental validation. Int. J. Engine Res. 2004, 5, 149–162. [Google Scholar] [CrossRef]
  63. Wolff, T.; Friedrich, H.; Johannesen, L.; Hajizera, S. A New Approach to Design High Porosity Silicon Carbide Substrates; SAE Tech. Pap. 2010-01–0539; SAE International: Warrendale, PA, USA, 2010; pp. 1–11. [Google Scholar]
  64. Gil-Robles, J.M. Directive 98/69/EC. Off. J. Eur. Comm. 1998, 350, 1–56. [Google Scholar]
  65. Tucki, K.; Mruk, R.; Orynycz, O.; Wasiak, A.; Botwińska, K.; Gola, A. Simulation of the operation of a spark ignition engine fueled with various biofuels and its contribution to technology management. Sustainability 2019, 11, 2799. [Google Scholar] [CrossRef] [Green Version]
  66. Williams, R.; Hamje, H.; Zemroch, P.J.; Clark, R.; Samaras, Z.; Dimaratos, A.; Jansen, L.; Fittavolini, C. Effect of fuel properties on emissions from Euro 4 and Euro 5 diesel passenger cars. Transp. Res. Procedia 2016, 14, 3149–3158. [Google Scholar] [CrossRef] [Green Version]
Figure 1. Front area of the control volume in the ‘single channel problem’ represented over a SEM image of a real MDF-bioSiC filter.
Processes 07 00945 g001
Figure 2. Scheme of the channel with geometrical definitions used in the model [43].
Processes 07 00945 g002
Figure 3. Particle size distributions obtained by J. Rodríguez-Fernández, M. Lapuerta, and J. Sánchez-Valdepeñas from testing different biofuels in an internal combustion engine [48].
Processes 07 00945 g003
Figure 4. Real particle size distribution of the soot generator and modeled curve.
Processes 07 00945 g004
Figure 5. Comparison between the modeled and the experimental curves: (a) evolution of the pressure drop of the small wall-flow bioSiC DPF prototype with the soot load; (b) evolution of the filtration efficiency vs. time of the wall-flow bioSiC DPF prototype.
Processes 07 00945 g005
Figure 6. Expected performance of a full-size wall-flow bioSiC DPF (0.035 kg s−1, 473 K): pressure drop (a), and filtration efficiency (b).
Processes 07 00945 g006
Figure 7. Simulated pressure drop (a) and particulate emissions (b) during a NEDC cycle with an MDF bioSiC wall-flow DPF.
Processes 07 00945 g007
Table 1. Summary of the governing equations of the flux in the single channel control volume.
Control VolumeEquation
Along the free path of the channelsContinuity equation:
z ( ρ i v i ) = ( 1 ) i N d ρ w v w
Momentum conservation equation:
p i z + z ( ρ i v i 2 ) = α 1 μ v i d 2
Through porous mediaAcross the soot layer:
p s o o t =   T M g   p ¯   μ d ρ w v w 2 k p ( p ¯ ) l n ( d d 2 w p )
Across the substrate walls:
p w a l l = μ   w w k w v w + C E k w ρ w v w 2
Total pressure drop between the inlet and the outlet channel:
p 1 p 2 = p s o o t + p w a l l
Table 2. Single collector filtration efficiency by diffusion and interception for fiber unit collectors.
Filtration MechanismEquation
DiffusionDiffusional efficiency [46]:
η D = η c l e a n , D   1.6   ( ε p o r e , 0 K u ) 1 / 3 P e n P e C d
Peclet number:
P e = u w d f i b , 0 D p a r t
Parameter in the diffusional efficiency [47]:
C d = 1 + 0.388   K n f i b ( ε p o r e , 0 P e K u ) 1 / 3
Direct interceptionDirect interception efficiency [46]:
η R = η c l e a n , R   0.6   ( ε p o r e , 0 K u ) 1 / 3 R 2 ( 1 + R ) C r
Interception parameter:
R = 2 R c d f i b , 0
Parameter in the direct interception efficiency [47]:
C r = 1 + 1.996   K n f i b R
Table 3. Main properties and composition of the fuels tested by Rodríguez-Fernández et al. [48].
Properties and CompositionDieselHVO BiofuelGTL BiofuelBiodiesel
StandardUNE EN 590UNE EN 15940UNE EN 15940UNE EN 14214
Lower heating value (MJ/kg)43.0443.9644.0337.26
Sulfur (mg/kg)<10<10<10<10
Water (mg/kg)6019.220102
C (% w/w)85.7484.6884.8276.45
H (% w/w)14.2614.5315.1812.36
O (% w/w)00011.19
Density at 15 °C (kg/m3)811779.6774874.3
Viscosity at 40 °C (mm2/s)2.022.992.344.5
Table 4. Parameter settings in the theoretical model of the small prototypes.
Inlet SettingsValue
Composition of the gas streamPure Argon
Volume flow rate5 L min−1 (0.1365 × 10⁻³ kg s−1)
TemperatureRoom temperature: ~30 °C
Pressure-
Soot mass flow0.004 g h−1
Soot particle size distributionLog-Normal (µ = 140 × 10−9 m; σ = 1.7)
Soot aggregate structureFractal dimension: 2.1 [49]
Soot primary particle radius: 6.6 × 10⁻⁹ m
Soot primary particle density: 1700 kg m−3
DPF SettingsValue
Substrate length0.032 m
Plug length0.001 m
Substrate equivalent diameter0.00997 m
Cell density370 cpsi
Wall thickness0.00038 m (14.96 mil)
Substrate Properties Specific for bioSiCValue
Initial permeability (clean)4 × 10⁻¹⁴ m2
Substrate pore diameter15.7 × 10−6 m
Pore volume fraction0.49
Table 5. Parameter settings in the theoretical model of a real-scale bioSiC DPF filter.
Inlet Settings—Simulating the Exhaust of a Real Engine (Light Duty) Fueled with Either Diesel or Biodiesel
Composition of the gas stream78% N2, 10% O2, 5% CO2, 6% H2O, 0.1% CO
Volume flow rate175 m3h−1 (0.035 kg s−1) [52]
Temperature473 K (200 °C)
Pressure-
Soot mass flow4.15 g h−1
Soot particle size distributionLog-Normal (µ = 80 × 10−9 m; σ = 1.41)
Soot aggregate structureFractal dimension: 2.07 [53]
Soot primary particle radius: 12 × 10−9 m [54]
Soot primary particle density: 2000 kg m−3
DPF SettingsValue
Substrate length0.152 m (6″)
Plug length0.005 m
Substrate equivalent diameter0.144 m (5.66″)
Cell density370 cpsi
Wall thickness0.00038 m (14.96 mil)
Substrate Properties Specific for bioSiCValue
Initial permeability (clean)4 × 10⁻¹⁴ m2
Substrate pore diameter15.7 × 10−6 m
Pore volume fraction0.49
Table 6. Calibrated values of the empirical parameters of the numerical model.
Filtration Efficiency-Based ParametersPressure Drop-Based Parameters
η c l e a n , D = 0.72 k w ( ρ P ) = 0.7 × 10 14   m 2 ( 2.2 g / L )
η c l e a n , R = 11 k p ( p ¯ ) = 0.61 × 10 15   m 2
n P e = 0.57
η l o a d = 0.28
Table 7. DPF reference cases simulation parameters (part one).
ReferenceMizutani, 2007 [57]Dabhoiwala, 2008/09 [58,59]Tandon, 2010 [29]Tsuneyoshi, 2011 [60]
Case IdentificationStationary engine testInitial
ΔP test
Soot load
ΔP test
Heavy Duty, 20% loadHeavy Duty, 60% load275 cpsi
ε = 51% d50 ~21.8 μm
200 cpsi
ε = 49% d50 ~13.4 μm
300 cpsi
ε = 51% d50 ~14 μm
Engine testΔP test
Inlet settings
Composition of the gas streamExhaust gasAirExhaust gasExhaust gasExhaust gasExhaust gasAir
Volume/mass flow rate (m3/h–kg/s)2000 rpm
50 Nm
540–0.17485.8–0.0281469–0.2452455–0.32726.49–0.0121400 rpm
190 Nm
240–0.077
Temperature (K–°C) 298–25473–200563–290707–434298–25623–350298–25
Soot mass flow (g/h)0.6 15.4618.251.5 [61]
Soot part size distributionLog-Normal
Mean (µ) (m)
Std. deviation (σ) (-)
70
-
-Gas burner
Soot gen.
144
1.82
Gas burner
80
1.8
80
-
-
Soot aggregate structureFractal dimension
Primary part radius (m)
Primary part density (kg/m3)

20/35
DPF settings
Substrate materialSiCCordierite SiC
Substrate length (m–inch)0.152–60.3048–120.152–60.153–6
Plug length (m)
Substrate diameter (m–inch)0.144–5.660.2667–10.50.144–5.660.144–5.66
Cell density (cpsi–cpsc)300–46.5200–31275–42.6200–31300–46.5300–46.5
Wall thickness (mm–mil)0.3048–120.3048–120.3048–120.3048–120.33–130.25–10
Table 8. DPF reference cases simulation parameters (part two).
ReferenceHaralampous, 2004 [62]Wolff, 2010 [63]Bollerhoff, 2012 [39]
Case IdentificationTransient ΔP (200 °C)Transient ΔP (400 °C)Lab testEngine test
XP-SiC
Engine test
SiC
Initial
ΔP test
XP-SiC
Initial
ΔP test
SiC
Inlet settings
Composition of the gas streamExhaust gasesExhaust gasExhaust gasExhaust gasAirAirExhaust gas
Volume/mass flow rate (m3/h–kg/s)245–0.05
approx.
393–0.08
approx.
362–0.0694205–0.0417205–0.0417600–0.268600–0.268200–0.037
Temperature (K–°C)473–200673–400513–240473–200473–200298–25298–25523–250
Soot mass flow (g/h)0
(filtered gases)
9 2.4
Soot part size distributionLog-Normal
Mean (µ) (m)
Std. deviation (σ) (-)
-Soot gen 60
1.78
Soot aggregate structureFractal dimension
Primary part radius (m)
Primary part density (kg/m3)
-
DPF settings
Substrate materialSiCXP-SiCXP-SiCSiCXP-SiCSiCCordieriteImproved SiC
Substrate length (m–inch)0.152–60.177–70.152–6
Plug length (m)0.005
Substrate diameter (m–inch)0.144–5.660.144–5.660.144–5.66
Cell density (cpsi–cpsc)200–31300–46.5200–31
Wall thickness (mm–mil)0.38–150.33–130.33–130.3048–120.33–130.3048–120.3048–120.3556–14
Table 9. Initial pressure drop of a bioSiC DPF compared to a similar commercial DPF.
Bibliographic SourceCase from
Table 7
ΔP of the Reference
DPF (kPa)
ΔP of a Similar
bioSiC DPF (kPa)
Deviation
Mizutani, 2007 [57]Soot load ΔP test1.51.50%
Mizutani, 2007 [57]Initial ΔP test5.35.8+9.4%
Dabhoiwala, 2008 [58]Heavy Duty, 20% load4.33.4−20.9%
Dabhoiwala, 2008 [58]Heavy Duty, 60% load8.06.0−25.0%
Tsuneyoshi, 2011 [60]ΔP test1.92.0+5.3%
Wolff, 2010 [63]Lab test2.54.2+68.0%
Wolff, 2010 [63]Initial ΔP test SiC4.99.0+83.7%
Wolff, 2010 [63]Initial ΔP test XP-SiC4.59.2+104.4%
Table 10. Initial filtration efficiency of a bioSiC DPF compared to a number of commercial DPFs.
Bibliographic SourceCase from Table 7Initial Efficiency
of the Reference
DPF (%)
Initial Efficiency
of a Similar
bioSiC DPF (%)
Deviation
Tandon, 2010 [29]275 cpsi3898.5+159%
Tandon, 2010 [29]200 cpsi5098.2+96%
Tandon, 2010 [29]300 cpsi7798.9+28%
Mizutani, 2007 [57]Stationary engine test8696.8+13%
Wolff, 2010 [63]Engine test SiC5395.8+81%
Wolff, 2010 [63]Engine test XP-SiC6096.5+61%
Wolff, 2010 [63]Lab test9094.0+4%
Bollerhoff, 2012 [39]Cordierite6096.6+61%
Bollerhoff, 2012 [39]Improved SiC4597.8+117%
Tsuneyoshi, 2011 [60]Engine test5594.7+72%
Dabhoiwala, 2009 [59]Heavy Duty, 20% load5294.6+82%

