Abstract
Global warming due to the emission of carbon dioxide (CO2) has become a serious problem in recent times. Although diverse methods have been offered, adsorption using activated carbon (AC) from agriculture waste is regarded to be the most applicable one due to numerous advantages. In this paper, the preparation of AC from rubber-seed shell (RSS), an agriculture residue through chemical activation using potassium hydroxide (KOH), was investigated. The prepared AC was characterized by nitrogen adsorption–desorption isotherms measured in Micrometrices ASAP 2020 and FESEM. The optimal activation conditions were found at an impregnation ratio of 1:2 and carbonized at a temperature of 700 °C for 120 min. Sample A6 is found to yield the largest surface area of 1129.68 m2/g with a mesoporous pore diameter of 3.46 nm, respectively. Using the static volumetric technique evaluated at 25 °C and 1.25 bar, the maximum CO2 adsorption capacity is 43.509 cm3/g. The experimental data were analyzed using several isotherm and kinetic models. Owing to the closeness of regression coefficient (R2) to unity, the Freundlich isotherm and pseudo-second kinetic model provide the best fit to the experimental data suggesting that the RSS AC prepared is an attractive source for CO2 adsorption applications.
1. Introduction
With the fast escalation of the overall industrialization and population in many countries, the utilization of energy is exclusively expending. Presently over 85% of the international energy requirement is being financed by the burning of fossil fuels [1]. The reasons for this dependence on energy sources are a result of instinctive energy density, supply, and dependency of modern society on the procurement and exchange of these resources. Fossil fuels will still dominate in the predictable future, primarily in power production and industrial manufacturing. The utilization of these fossil fuels, especially in electricity generation, residentiary, transportation, and industrial area discharges massive amounts of carbon dioxide (CO2) into the atmosphere, and thus upsets the carbon balance of our planet, which has been stable over millions of years. Although anthropogenic emissions of CO2 can be considered comparatively limited related to the natural carbon changes such as photosynthetic fluxes, its escalation has distinct impacts on the global climate over a very short duration of time. The concentration of CO2 in the atmosphere recorded in December 2018 has increased from 280 to 408 ppm since the beginning of the industrial revolution [2]. The rise of CO2 concentration dominates the balance of incoming and outgoing energy in the earth’s atmosphere. Hence, CO2 has often been pointed out as the main anthropogenic greenhouse gas (GHG) as well as the leading offender in climate change. Due to this serious environmental problem, there is pressure all over the world to address this issue. International agreement known as the Kyoto protocol was reached and signed by 192 nations under the United Nations Framework Convention on Climate Change (UNFCC) to limit GHG emissions of industrialized nations by 5.2% [3]. Despite Malaysia contributing 0.2% in global greenhouse gases emissions [4], the increment of CO2 emission is not to be taken lightly, because the continuous increase of the CO2 rate to the surroundings can cause global warming as well as affect human health due to long term exposure to high concentrations of CO2 in the future.
Many CO2 capture technologies are proposed and being investigated these years, including chemical and physical adsorption, cryogenic separation, and membrane separation [5,6]. At the time being, chemical absorption (scrubbing), utilizing amine-based solvents, is the most considered technology used in industries. Although it is viewed as the most practical technology for CO2 capture in post-combustion processes and has been used for more than 60 years, its application brings some negative impact, such as equipment corrosion, it requires high absorber volume, and is harmful to human health. In addition, this method of CO2 separation is energy consuming and expensive as it requires large amounts of low-pressure steam for adsorbent regeneration [6,7]. Among the viable technologies for CO2 capture, adsorption using solid material is chosen due to low energy prerequisites, low essential and running cost, including controlled waste generation. Due to its diverse benefits, such as economical, accessible for regeneration, indifferent towards the moisture, high CO2 adsorption uptake at ambient situation, high specific surface area, high mechanical durability, sufficient pore size distribution, as well as low in energy needed, [8] activated carbon (AC) is one of the up-and-coming solid adsorbents that can be employed to capture CO2. Based on the advantages by AC, it has been extensively engaged in different utilizations including in gas and liquid phases. The capability of AC in CO2 occupation also depends on several criteria such as the nature of the activating method and the quality of starting materials, which in turn alters the surface chemistry and porosity and of the synthesized AC [8,9,10].
Many researchers have investigated the manufacture of low-cost adsorbents from inexhaustible and economical precursors, which are mainly industrial and agricultural derivatives ranging from palm kernel [11], banana peel [12], coconut shell [13], doum seed coat [14], walnut shell [15], etc., and their findings are quite conclusive. Meanwhile, rubber plantations in Malaysia have increased ever since the year 2010. The increase of rubber plantations have led to the increase in rubber production. Apart from producing latex, rubber seeds with hard shells were produced at the same time. It is estimated that about 800 to 1200 kg of rubber seed per ha per year is produced in a rubber plantation. The increase of rubber seed is causing significant environment and disposal problems [16]. To reduce the waste disposal issue, the rubber-seed shell (RSS) is proposed to be used as AC for CO2 capture, since there is limited research on its preparation, and to address the problems.
In this study, a chemical activation method by potassium hydroxide (KOH) was selected due to its numerous advantages over physical activation methods and favorable conditions compared to other chemical activating agents. The research study was set in the direction towards evaluating the potential of using RSS as AC material in the removal of CO2. Since chemical activation was adopted in this study, impregnation ratio (IR), temperature (Tact), and activation time (tact) would be the main factors affecting the extent of reaction. Therefore, these parameters were also investigated to evaluate the effects of operation conditions on pore advancement of AC prepared from RSS. Samples with the highest surface area are preferred to examine on the performance of CO2 adsorption at ambient pressure and temperature. In addition, the CO2 adsorption isotherm is evaluated through several models, such as Langmuir, Freundlich, and Temkin. Lastly, the kinetic property of the sample with the highest adsorption capacity of purified CO2 is evaluated using the pseudo-first order, pseudo-second order, and Elovich kinetic models.
2. Materials and Methods
2.1. Materials and Pre-Treatment
The raw RSS is collected from the Rubber Industry Smallholders Development Authority (RISDA) rubber plantation located at Chemor, Perak. It is then washed using distilled water to remove impurities and dried overnight in an oven at 110 °C to remove surplus water content. Once dried, the RSS is crushed and pulverized and then sieved into a particle size of 250 µm and stored in airtight plastic containers for further use. All chemicals were of industrial reagent grade and acquired from R & M Chemicals supplier located at Semenyih, Selangor.
2.2. Activation and Carbonization
The RSS prepared was impregnated by mixing it with a desired ratio (1:1, 1:2, and 1:3) of KOH based on the weight of the dry sample. The mixing and impregnation processes were allowed to sit for overnight to ensure complete reaction takes place between the chemical reagent and raw material. The impregnated material was then carbonized in a fixed bed activation unit with heating temperature ranging from 400, 500, 600, 700, 800 to 900 °C and activation time between 60 and 120 min. The one-factor-at-a-time (OFAT) method was adopted in this study so that reduction of sample is achievable; it is a method of designing experiments involving the testing of factors one at a time instead of all simultaneously. Throughout the process, N2 gas, which acts as the carrier gas and promotes the pore formation in RSS [17], was allowed to flow in the rotary kiln. After the heat treatment, the material was left to cool to room temperature and subsequently washed with distilled water to discard the excess KOH solution and ash. The AC sample produced was preserved in an oven for overnight at 90 °C and kept in a desiccator to prevent moisture.
2.3. Characterization
To investigate the best operating parameter for producing AC from RSS, several analytical equipments were employed. To investigate the morphology surface structure, a Zeiss EVO-50 Field Emission Scanning Electron Microscope (FESEM), model Supra 55 VP acquired from Zeiss Jena, Germany, is used to compare the structural images of RSS before and after activation by generating real space enhanced images of its surface. In addition to the standard electron microscope detectors, the instrument is also furnished with Energy Dispersive X-ray (EDX) Spectroscopy for elemental analysis investigation.
For specific surface and porosity analysis, Micrometrics ASAP 2020 is used to determine the surface area (SBET), pore size distribution (D), and the total pore volume (VT) through nitrogen adsorption–desorption isotherms analysis. N2 (99.9% purity) gas is applied as adsorbate and the condition was allowed to flow at 350 °C for 2.5 h [16]. The specific surface area of the AC samples is determined using the Brunauer–Emmett–Teller (BET) method using nitrogen adsorption isotherm data tabulated from a computer.
2.4. CO2 Adsorption Capacity Analysis
CO2 adsorption analysis were carried via purified CO2 (99.98% purity and supplied by Linde Malaysia Sdn. Bhd.) volumetric adsorption method using High Pressure Volumetric Analyzer (HPVA II) supplied by Particulate System. To ensure all impurities were removed from the samples, about 0.5 g of AC was inserted inside a 5 cm3 sample glass cylinder and degassed at 170 °C for 8 h under vacuum. A 60 µm filter gasket was then planted on top of the sample cylinder, to avoid the fine particles from entering the valve [17]. After completion of the degassing step, the samples were cooled to ambient temperature and prepared for adsorption studies. The CO2 adsorption process was started by introducing the gas adsorbate (CO2) into the system. This is accomplished by granting the valve between the loading and sample cylinder to open and allow the CO2 to interact with the AC material. To ensure equilibrium of the adsorption process, the holding time at each pressure interval was fixed at 45 min. By taking the differences between the amounts of dosed gas into and the amounts of gas staying in the system upon adsorption process, the volumetric CO2 sorption capacity during experimental run was calculated [18]. For isotherm studies, using the resulting points of volumes adsorbed at equilibrium pressures, several isotherm models such as Langmuir, Freundlich, and Temkin [19] were plotted and fitted to experimental data to find suitable representation of adsorption process of RSS based AC. The suitability of the above-mentioned models is assessed by R2 values that are close to unity. Table 1 outlines the non-linear and linear equations of these three models.

Table 1.
Model isotherm equations.
2.5. Kinetic Studies
CO2 adsorption kinetics of KOH impregnated RSS AC are desirable to evaluate the accomplishment of sorbents and to understand the overall mass transfer in the CO2 adsorption process. In addition, it served as baseline to predict CO2 adsorption/desorption kinetics for the rational simulation and design of gas-treating systems. In this study, the usefulness of Lagergen’s pseudo-first order model, pseudo-second order model, and Elovich model approaching the experimental values using purified CO2 adsorption at 25 °C is examined. The compliance of the predicted adsorption capacity was evaluated by the magnitude of coefficient regression R2 closeness towards unity.
2.5.1. Pseudo-First Order Kinetic Model
The linearized Lagergen’s pseudo-first order model was the first adsorption rate equation depicted for sorption of a liquid/solid system and one of the most frequently used adsorption rate models. It is expressed by the equation below [19,20]:
where qeq and qt are the amount of adsorption at equilibrium and at that particular time t, respectively. It has the unit of mg/g. k1 represents the rate constant for pseudo-first order adsorption. A linear plot will be obtained from the graph when this model is applicable. In addition, the slope and interception point of the plot can be used to determine pseudo-first order parameters.
2.5.2. Pseudo-Second Order Kinetic Model
The pseudo-second order model is expressed by the equation as follows [19,20]:
where qe and qt are the amount of adsorption at equilibrium and at that particular time t, in mg/g, respectively. k2 represents the overall rate constant for pseudo-second order adsorption with the unit of g/mg min. Similar to first order, a linear plot will be achieved from the graph of t/qt versus time, t when it is applicable.
2.5.3. Elovich Kinetic Model
Elovich kinetic model is usually used in a gas–solid system and is expressed by [19,20]:
where qt is the amount of CO2 adsorbed in mg/g at a particular time, t. represents the initial adsorption rate in mg/g min, while is the extent of surface coverage in g/mg and the process activation energy.
3. Results and Discussion
3.1. Elemental Composition Analysis
Aside from examining the surface morphology of the samples, FESEM is also furnished with Energy-Dispersive X-ray (EDX) spectroscopy for detecting the elemental composition. Table 2 below shows the corresponding elemental content before and after activation. Two main elements were detected on the samples before activation, which are carbon and oxygen. It was described in specific that the acceptable range of carbon presence should lie between 40 and 80% [17]. The result shows that RSS fulfills the criteria of producing AC. It was found that the percentage of carbon content has escalated after carbonization and activation due to the release of more volatile matter during the process. An additional element identified as potassium was detected in the sample after activation. Presence of potassium element is as a result the use of KOH as chemical activating agent during the activation process. Repetitive washing can greater reduce the potassium element, but complete elimination is hardly possible. Calcium content in RSS is expected and considered normal as the RSS is rich in protein, minerals, and amino acid. Eka et al. [21] has mentioned this in a report that rubber seed has a low content of calcium.
Table 2.
Comparison of elemental composition.
3.2. Characterization Study
The preparation conditions and results of AC samples produced from KOH impregnated RSS are exhibited in Table 3. The result demonstrated that sample A6, which is arranged at an impregnation ratio (IR) of 1:2, Tact of 700 °C, and tact of 120 min, yields the highest values of specific surface area, SBET of 1129.60 m2/g, average pore diameter, D of 3.46 nm, and total pore volume, VT as high as 0.412 cm3/g. This is followed by samples A5 at 826.31 m2/g, 3.21 nm, and 0.376 cm3/g, and A8 at 731.06 m2/g, 3.21 nm, and 0.301 cm3/g, respectively. In comparison, samples A1 and A2, which are developed at an IR of 1:1, all exhibit reduced SBET and VT values in comparison to A3. The reason is due to the IR of KOH to RSS which plays a critical role in the pores formation. High IR supposedly helps to increase the amount of potassium metal that can be intercalated and thus develops more pore formation [22]. Nevertheless, the outcome of the analysis confirms that there is an utmost number of ions that can be accepted above which would reduce pore progression. The reason behind this is because additional or excess activating agents probably form an insulating layer (or skin) coating the AC particles, and therefore lowering the activation process and the influence with the surrounding atmosphere [23]. This phenomenon is particularly observed in sample A4 where most likely activation is hindered, resulting in a lower surface area (SBET of 492.55 m2/g) and pore volume formation (VT of 0.182 cm3/g) as compared to A3.
Table 3.
Surface area and porosity results.
As for activation temperature, the optimum temperatures have been reported to be between 500–800 °C by most of the earlier researchers [24]. Hence, the experiments were conducted by varying temperatures from 400 to 900 °C, and it turned out that the recommended temperature is reliable due to verification provided by samples A1 to A3 and A5 to A9. Sample A1, which is carbonized at 400 °C, yields the lowest SBET (203.81 m2/g) and VT (0.113 cm3/g) than any additional samples. It was reported that 400 °C is the starting carbonization temperature in the development rudimentary of pores of AC material. Increasing the activation temperature to 700 °C will intensify the expulsion of molecular weight of unstable compounds and further generating new pores, resulting in the hastening of porosity growth of the AC. Sample A5 and A6 have the highest SBET (826.31 m2/g and 1129.60 m2/g) and VT (0.376 cm3/g and 0.412 cm3/g) values, respectively. Nevertheless, when the activation temperature is elevated to 900 °C, the excessive heat energy supplied to the carbon will result in the collapsing and knocking of some porous wall [17]. The outcome is the decrease quantity of SBET and VT. This can be interpreted by comparing sample A9 with other samples’ characterization result.
Extended activation time during the carbonization process may cause in over-activation, where surface erosion is accelerated more quickly than pore formation. Sample A7 shows rapid decreasing in SBET, VT, and D after an activation time of 180 min. Considering the well-developed porous structure at a temperature of 700 °C, any increment in activation time will causes the carbon structures to break between its cross-links, resulting in pore collapsing [25,26]. Although sample A6 has the highest SBET, VT, and D, only 31.67% of its volume existed as micropores. Sample A3 has the highest micropore volume, with 85.29% of its total pore, while sample A9 has the lowest micropore volume with 15.13%. According to The International Union of Pure and Applied Chemistry (IUPAC) classification pore size are categorized as macro if the size >50 nm, meso if the size is between 2–50 nm, and micropore when <2 nm [26]. All samples, except raw and A1, show pore diameter in the range between 2–4 nm, and thus distinctly categorize that the pores belong to the mesopores classification.
3.3. Morphology
Figure 1 shows the microscopic morphology structure of the raw RSS and some selected samples prepared at different operating parameters. By using FESEM, structural images with magnification up to 300 times are taken. The structural image of fresh RSS in Figure 1a indicates that the raw material before undergoing activation shows no noticeable pores. However, the image clearly shows the existence of fine pores on the surface, which is one of the important aspects for manufacturing AC. After activation, a greater distribution of pores emerged to become active sites for adsorption to take place more readily. The difference in pore structure before activation and after activation is clearly illustrated through comparison made between Figure 1a with Figure 1b,c. The canal structure on the surface of sample A6 has been partially broken, which indicates carbonization process occurred and the surface was eroded by longer activation temperature and time than sample A1. Therefore, the SBET of sample A6 is much higher. As shown in Figure 1c, sample A6 has the most well-developed structure compared the other three AC. This justified that sample A6 has the highest SBET, VT, and D compared to other samples. On the other hand, collapse of porous wall due to excessive heat exposure is observed in Figure 1d with sample A9 being activated at highest temperature. Two promising samples, A5 and A6, are selected for further analysis.
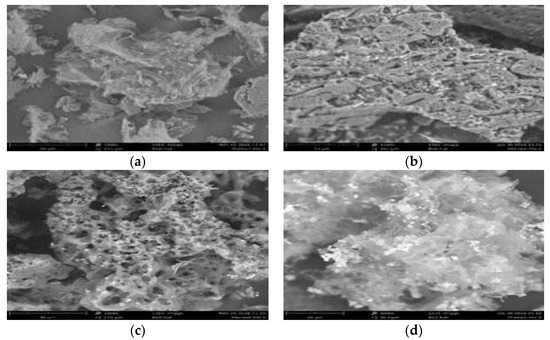
Figure 1.
FESEM images of selected samples, (a) fresh RSS, (b) sample A1, (c) sample A6, and (d) sample A9.
3.4. Nitrogen Adsorption–Desorption Isotherms Study
Figure 2 shows the N2 adsorption–desorption isotherms of the selected three AC. The quantity of N2 adsorbed is projected against the relative pressure p/po where p = pressure at given condition and po = saturated vapor pressure of N2. Based on IUPAC classification of adsorption isotherm [25], it can be seen that for raw AC the isotherm follows Type II classification, which signify the presence of microporous pores existed and within the micropores the surface resides almost exclusively. Once it was fully occupied by N2 adsorbate, very few or no exterior surface left for further adsorption. Samples A5 and A6, however, show a combination of Type I and Type III classification where the trend line was initially following Type I with Type III trend line appearing at the end of high relative pressure. This combination is associated with a combination of microporous and mesoporous structures with mesopores as the dominant species [26]. The result is consistent with the D of 3.21 and 3.46 nm, respectively, as shown in Table 3, where it complies with the IUPAC classification of mesoporous material.
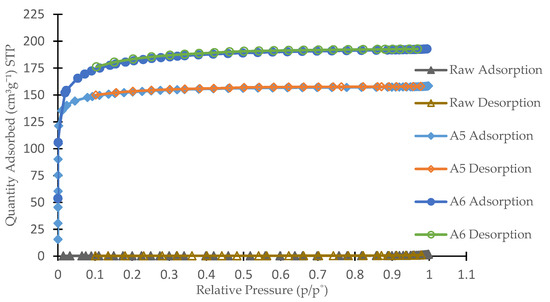
Figure 2.
N2 adsorption–desorption isotherms.
3.5. CO2 Adsorption and Isotherm Modeling
Figure 3a depicts the CO2 adsorption capacity for samples A5 and A6 at an ambient temperature and pressure. According to Estaves et al. [27], it is ideal to adsorb CO2 at lower a temperature (25 °C in this research) as CO2 adsorption process onto AC is exothermic due to the physical adsorption (physisorption) process. Weak van der Waals forces are basically involved in physisorption. At high temperature condition, these weak forces are easily broken and result in the decrease of the adsorption capacity. Instability of the CO2 adsorbate on the carbon surface will result in a desorption process, owing to higher surface adsorption energy and molecular diffusion at high temperature. According to Hauchhum et al. [28], the rise in bed temperature of AC will expedite the internal energy of the adsorbent, and therefore CO2 molecules are released from the surface. To summarize, exothermic process during adsorption is controlled by physisorption when there is reduction in the adsorption capacity with respect to the temperature [29]. Based from Figure 3a, higher CO2 adsorption capacity for sample A6 is recorded compared to A5. This finding is parallel to the nitrogen adsorption analysis carried out earlier. This verifies that higher surface area does lead to higher adsorption capacity. The highest CO2 adsorption capacity for sample A6 is 43.5094 cm3/g at a pressure of 1.2523 bar, while for the A5 sample it is 39.2496 cm3/g at a pressure of 1.2525 bar, respectively.
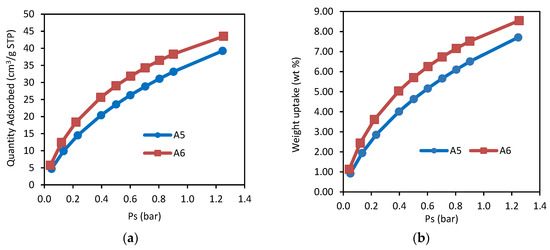
Figure 3.
(a) CO2 adsorption capacity at 25 °C; (b) weight uptake of CO2 adsorption at 25 °C.
The effect of pressure on CO2 capacity is also observed where higher adsorption occurs at higher pressure. This phenomenon happens because high pressure tends to push CO2 molecules onto adsorption site within the pore. In Figure 3b, the highest CO2 sorption quantity that is exhibited by samples A6 and A5 is 8.5431 wt% at a pressure of 1.2523 bar and 7.7067 wt% at a pressure of 1.2525 bar, respectively. The disparity in CO2 weight uptake of these solid AC as a result of the surface area value is shown in Table 3. Sample A6, which has the largest SBET, is noticed to adsorb more CO2 compared to other samples, which implies that there are more available surface sites for CO2 adsorption processes to take place.
Table 4 shows the calculated isotherm constants and their corresponding R2 values for CO2 adsorption using linear regression method. According to Perez et al. [30], the Langmuir constant kL and Freundlich constant kF are all related to the adsorption affinity. Its value decreases with increases in temperature, which signify physisorption behavior. This CO2 adsorption capacity reduction can be interpreted by Le Chatelier’s principle, where for an exothermic process (physisorption), low temperature is preferred during adsorption. The exothermic behavior of the CO2 adsorption is aligned with the qm value that is likely to decline with the rise in the adsorption temperature. The Langmuir adsorption model explains that adsorption does not occur after monolayer adsorbate formation on the adsorbent surface. This model assumes constant adsorption energies onto the surface and no adsorbate movement on the surface planes [29,30,31].
Table 4.
Langmuir, Freundlich, and Temkin isotherm models via linearized technique.
Freundlich adsorption model is based on an empirical relationship, which explains adsorption isothermal variation with pressure. This model is often used to explain heterogeneous surface adsorption characteristics. The Temkin adsorption model accounts for the adsorbate–adsorbent interaction. This model assumes adsorption heat of all adsorbate molecules decreases linearly [29]. As for Freundlich constant, n, and sometimes known as heterogeneity factor, its value signifies the type of adsorption, where n > 1 is for physical adsorption while n < 1 corresponds to chemical adsorption. Both samples A5 and A6 have a R2 value closer to unity for the Freundlich model compared to Langmuir and Temkin. This shows that the adsorption process occurs in heterogeneous surfaces and is not restricted to monolayer adsorption as recommended by Langmuir. The summary for Table 4 suggests that the Freundlich model gives the best fitting correlation to the experimental data, owing its R2 value approaching unity as it permits the CO2 adsorbate molecules to form a successive layer onto the surface of AC.
3.6. Kinetic Analysis
Figure 4 shows the straight line plot of log(qe − qt) versus t for RSS AC of sample A6 at 25 °C using Equation (4). The kinetic data are summarized in Table 5. The pseudo-first order kinetic model is established on the assumption that the rate of adsorption is proportional to the number of vacant sites available on the adsorbent surface and is used regularly in liquid–solid phase [29]. Due to its low R2 value of 0.8392, this kinetic model does not fit well with the CO2 adsorption experimental data. Sadaf et al. [32] verified that the pseudo-first order model was unsuitable in the adsorption process as it can be only applied during the beginning stage and not for the entire period.
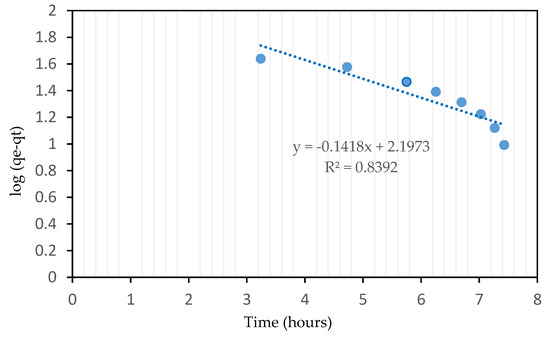
Figure 4.
Pseudo-first order kinetic model of sample A6 RSS AC.
Table 5.
Summary of kinetic models.
For the pseudo-second order kinetics model, the rate of adsorption is assumed to be linearly related to the square of the number of vacant sites available on the adsorbent surface. This model has been used by many researchers for the modeling of experimental data of CO2 adsorption kinetics [33,34]. A plot of t/qt against time t will generate a straight line with 1/h and 1/qe as y-interception and slope, respectively, if the model is applicable in the adsorption process. By taking the R2 value shown in Figure 5, the pseudo-second order model fits the CO2 adsorption profile with the regression coefficient value of 0.9388 compared to the first-order model of 0.8392. In addition, the magnitude of h that represents the rate of adsorption has a value of 2.306 mg/g min and its value is expected to decline with respect to the operating temperature. According to Simon et al. [29], the CO2 molecules will gain an adequate amount of energies at elevated temperatures and be able to overcome the weak van der Waals bonding and finally will be moved back to the bulk gas phase. A similar trend was observed by Chao Ge et al. [25] when investigating the adsorption equilibrium capacity of CO2 at temperatures between −47 and 28 °C using both pseudo-model kinetics. Results predicted by the pseudo-second order model were much closer and coincided with the experimental values (R2 value greater than 0.996). Contrarily, larger deviation between the actual and calculated value resulted by using the pseudo-first order model and, thus, producing lower R2 values.
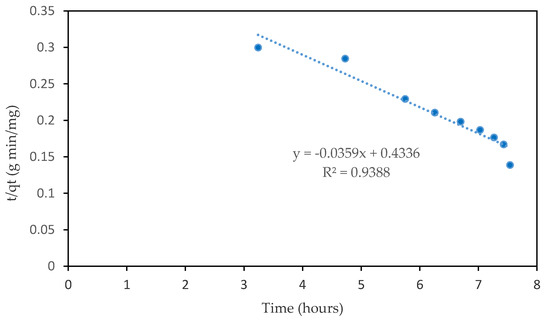
Figure 5.
Pseudo-second order kinetic model of sample A6 RSS AC.
Figure 6 displays the Elovich plot of CO2 adsorption using the same data. If it fits with the model, a straight line with gradient of 1/β and y-interception of 1/β ln(αβ) will be produced. The Elovich kinetic model assumes that the rate of adsorption exponentially decreases with the increase in the amount of CO2 adsorbed on the adsorbent surface without any interaction among the adsorbed species [35,36]. By applying boundary conditions and integrate in Equation (3), it results in a new equation as shown below:
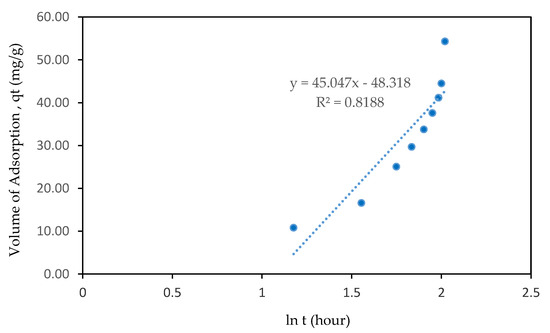
Figure 6.
Elovich model of sample A6 RSS AC.
As demonstrated in the figure, the Elovich kinetic model gave a poor regression coefficient of 0.8188 compared to the other two pseudo-models.
Based on the summary of kinetic models shown in Table 5, it was noticed that the pseudo-first order and Elovich model are not well suited to fit the CO2 adsorption kinetics data owing to their low R2 values. Significant deviations are observed when determining equilibrium adsorption capacity using the two kinetic models. The pseudo-second order kinetics model fits the adsorption kinetics data, with a R2 value of 0.939. It can be concluded that the three kinetics models are found to be suitable for fitting the present adsorption kinetics data in the following subsequent order: Pseudo-second order > pseudo-first order > Elovich.
3.7. Comparison Study with Other Biomass Activated Carbon Materials
Figure 7 shows the CO2 adsorption comparison capacities on selected types of AC from agricultural waste ranging from coconut shell, banana peel, rice husk, palm shell, and coconut fiber [17,34]. From this relative study, it can be seen that the RSS AC of sample A6 has a noticeable higher adsorption capacity compared to banana peel and rice husk based AC. The highest CO2 adsorption capacity is coconut shell at 78.77 mg/g, followed by coconut fiber at 60.2 mg/g and palm shell at 58.52 mg/g. RSS is ranked fourth with an adsorption capacity of 54.31 mg/g of CO2. The usage of RSS waste biomass from rubber plantation for the development into AC is practical as it can overcomes the shortage of the non-renewable precursors, such as zeolites, metal-organic frameworks (MOF), mesoporous oxides, polymers, etc. To guarantee a long-term sustainability of this industry, Khalili et al. [37,38] acknowledged that the biomass-based AC may be synthesized from the renewable feedstock. In addition, the preparation of wastes from sustainable biomass precursors provides an environmentally friendly and sustainable passage for the advancement of CO2 sorbent materials.
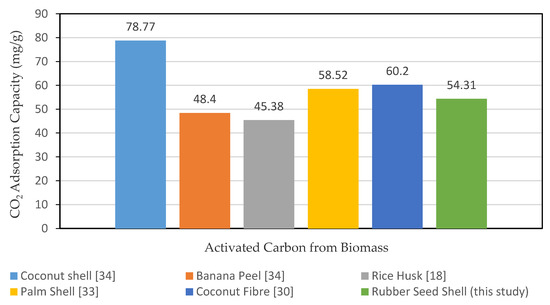
Figure 7.
CO2 adsorption capacity by different agricultural waste AC [18,30,33,34].
4. Conclusions
This study indicates the promising potential in producing a low-cost AC from RSS using KOH as activating agent. The resulting AC yield a high surface area, pore volume, and average diameter at an impregnation ratio of 1:2, activation temperature of 700 °C, and activation time of 120 min. According to the characterization analysis, the range of pore diameter (2–50 nm) is in the mesopores classification. The AC with a high surface area was also verified to have higher CO2 adsorption capacity using a static volumetric instrument. Moreover, the adsorption capacity test proved that adsorption using RSS based AC has a high prospective in reducing CO2 and is on par with some already existing conventional biomass AC. Based on isotherm model analysis, the Freundlich isotherm model fit best, and the kinetic analysis demonstrated that the CO2 adsorption onto the AC obeys the pseudo-second order model due to its closest proximity R2 value toward unity.
Author Contributions
Data curation, A.B.; formal analysis, A.B. and J.W.L.; funding acquisition, A.B.; methodology, A.B. and S.Y.; supervision, S.Y.; validation, A.B. and S.Y.; writing—original draft, A.B.; writing—review and editing, J.W.L. and P.L.S.
Funding
The authors extend their appreciation to the Ministry of Higher Education (MOHE), Government of Malaysia, under the Fundamental Research Grant Scheme, [FRGS No: FRGS/1/2018/TK10/UTP/02/9] for funding this research.
Acknowledgments
The authors gratefully thank the Universiti Teknologi PETRONAS and the Center for Biofuel and Biochemical Research (CBBR), UTP for providing financial assistance and support.
Conflicts of Interest
All authors declare no conflict of interest.
References
- Amira, K.; Mohammad, A. Exploring the Impact of Renewable Energy on Climate Change in the GCC Countries. Int. J. Energy Econ. Policy 2019, 9, 124–130. [Google Scholar]
- Chao, X.; Maria, S. Sustainable Porous Carbon Materials Derived from Wood-Based Biopolymers for CO2 Capture. Nanomaterials 2019, 9, 103. [Google Scholar]
- Olivier, J.G.J.; Janssens-Maenhout, G.; Muntean, M.; Peters, J.A.H.W. Trends in Global CO2 Emissions: 2016 Report; PBL Netherlands Environmental Assessment Agency: The Hague, The Netherlands, 2016; pp. 1–86. [Google Scholar]
- Shahid, S.; Minhans, A.; Che Puan, O. Assessment of greenhouse gas emission reduction measures in transportation sector in Malaysia. J. Teknol. 2014, 70, 1–8. [Google Scholar] [CrossRef]
- Mahdi, F.; Olga, E.; Christian, B. Techno-economic assessment of CO2 direct air capture plants. J. Clean. Prod. 2019, 224, 957–980. [Google Scholar]
- Yuan, W.; Li, Z.; Alexander, O.; Martin, R.D.S. A Review of Post-combustion CO2 Capture Technologies from Coal-fired Power Plants. Energy Procedia 2017, 114, 650–665. [Google Scholar]
- Bryce, D.; Maohong, F.; Armistead, G.R. Amine-Based CO2 Capture Technology Development from the Beginning of 2013-A Review. ACS Appl. Mater. Interfaces 2015, 7, 2137–2148. [Google Scholar]
- Singh, V.K.; Kumar, E.A. Measurement and analysis of adsorption isotherms of CO2 on activated carbon. Appl. Therm. Eng. 2016, 97, 77–86. [Google Scholar] [CrossRef]
- Srinivas, B.N.; Kishore, P.; Rao, K.S.; Kumar, T.A. Preparation of surface modified activated carbons from rice husk and CO2 adsorption studies. IOSR J. Appl. Chem. 2017, 10, 54–60. [Google Scholar]
- Boonpoke, A.; Chiarakon, S.; Laosiripojana, N.; Towprayoon, S.; Chidthaisong, A. Synthesis of activated carbon and MCM-41 from bagasse and rice husk and their carbon dioxide adsorption capacity. J. Sustain. Energy Environ. 2011, 2, 77–81. [Google Scholar]
- Ademiluyi, F.T.; David-West, E.O. Effect of chemical activation on adsorption of heavy metals using activated carbons from waste materials. Int. Sch. Res. Netw. 2012. [Google Scholar] [CrossRef]
- Borhan, A.; Hoong, P.K.; Taha, M.F. Biosorption of heavy metal ions, oil and grease from industrial waste water by banana peel. Appl. Mech. Mater. 2014, 625, 749–752. [Google Scholar] [CrossRef]
- Jahagindar, A.A.; Ahmed, M.N.Z.; Devi, D.V. Adsorption of chromium on activated carbon prepared from coconut shell. Int. J. Eng. Res. Appl. 2012, 2, 364–370. [Google Scholar]
- El-Sadaawy, M.; Abdelwahab, O. Adsorptive removal of nickel from aqueous solutions by activated carbons from doum seed coat. Alex. Eng. J. 2014, 53, 399–408. [Google Scholar] [CrossRef]
- Zabihi, M.; Haghighi, A.A.; Ahmadpour, A. Studies on adsorption of mercury from aqueous solution on activated carbons prepared from walnut shell. J. Hazard. Mater. 2010, 174, 251–256. [Google Scholar] [CrossRef]
- Yahya, M.; Al-Qodah, Z.; Ngah, C. Agriculture bio-waste materials as potential sustainable precursors used for activated carbon production: A review. Renew. Sustain. Energy Rev. 2015, 46, 218–235. [Google Scholar] [CrossRef]
- Borhan, A.; Taha, M.F.; Hamzah, A.A. Characterization of activated carbon from wood sawdust via chemical activation using potassium hydroxide. Adv. Mater. Res. 2014, 832, 132–137. [Google Scholar] [CrossRef]
- Rashidi, N.A.; Yusup, S.; Borhan, A. Isotherm and Thermodynamic Analysis of Carbon Dioxide on Activated. Procedia Eng. 2016, 148, 630–637. [Google Scholar] [CrossRef]
- Al-Marri, M.J.; Al-Saad, M.K.; Saad, M.A.; Cortes, D.J.; Khader, M.M. Thermodynamics of CO2 adsorption on polyethyleneimine mesoporous silica and activated carbon. J. Phys. Chem. Biophys. 2017, 1, 1–5. [Google Scholar]
- Jhonatan, R.G.R.; Juan Carlos, M.P.; Liliana, G.G. Kinetic and Equilibrium Study of the Adsorption of CO2 in Ultramicropores of Resorcinol-Formaldehyde Aerogels Obtained in Acidic and Basic Medium. J. Carbon Res. 2018, 4, 1–19. [Google Scholar]
- Eka, H.D.; Tajul, A.Y.; Wan, N.W.A. Potential use of Malaysian rubber (Hevea brasiliensis) seed as food, feed and biofuel. Int. Food Res. J. 2010, 17, 527–534. [Google Scholar]
- Borhan, A.; Hamidi, M.N.R. Modification of Rubber-Seed Shell Activated Carbon using Chitosan for Removal of Cu2+ and Pb2+ from Aqueous Solution. In Proceedings of the International Symposium on Green and Sustainable Technology (ISGST 2019), Perak, Malaysia, 23–26 April 2019; Volume 2157, p. 020024. [Google Scholar]
- Cao, Q.; Xie, K.C.; Liv, Y.K.; Bao, W.R. Process effects of activated carbon with large specific area from corncob. Bioresour. Technol. 2012, 97, 110–115. [Google Scholar] [CrossRef] [PubMed]
- Ogungbenro, A.E.; Quang, D.V.; Al-Ali, K.; Abu-Zahra, M.R.M. Activated carbon from date seeds for CO2 capture applications. Energy Procedia 2017, 114, 2313–2321. [Google Scholar] [CrossRef]
- Chao, G.; Dandan, L.; Shaopeng, C.; Jie, G.; Jianjun, L. Highly Selective CO2 Capture on Waste Polyurethane Foam-Based Activated Carbon. Processes 2019, 7, 1–15. [Google Scholar]
- Mays, T.J. A new classification of pore sizes. Stud. Surf. Sci. Catal. 2007, 160, 57–62. [Google Scholar]
- Esteves, I.A.A.C.; Lopes, M.S.S.; Nunes, P.M.C.; Mota, J.B.P. Adsorption of natural gas and biogas components on activated carbon. Sep. Purif. Technol. 2008, 62, 281–296. [Google Scholar] [CrossRef]
- Hauchhum, L.; Mahanta, P. Kinetic, thermodynamics and regeneration studies for CO2 adsorption onto activated carbon. Int. J. Adv. Mech. Eng. 2014, 4, 27–32. [Google Scholar]
- Simon, J.C.; Bushra, A.D.; Nannan, S.; Cheng-gong, S.; Colin, E.S.; Kaixi, L.S.; Joseph, W. Carbon Dioxide Separation from Nitrogen/Hydrogen Mixtures over Activated Carbon Beads: Adsorption Isotherms and Breakthrough Studies. Energy Fuels 2015, 29, 3796–3807. [Google Scholar]
- Perez, N.; Sanchez, M.; Rincon, G.; Delgado, L. Study of the behaviour of metal adsorption in acid solutions on lignin using a comparison of different adsorption isotherms. Lat. Am. Appl. Res. 2015, 37, 157–162. [Google Scholar]
- Li, J.; Hitch, M. Carbon dioxide sorption isotherm study on pristine and acid-treated olive and its application in the vacuum swing adsorption process. Miner 2015, 5, 259–275. [Google Scholar] [CrossRef]
- Sadaf, S.; Bhatti, H.N. Evaluation of peanut husk as a novel, low cost biosorbent for the removal of Indosol Orange RSN dye from aqueous solutions: Batch and fixed bed studies. Clean Technol. Environ. Policy 2014, 16, 527–544. [Google Scholar] [CrossRef]
- Jia, Z.; Li, Z.; Ni, T.; Li, S. Adsorption of low-cost absorption materials based on biomass (Cortaderia selloana flower spikes) for dye removal: Kinetics, isotherms and thermodynamic studies. J. Mol. Liq. 2017, 229, 285–292. [Google Scholar] [CrossRef]
- Rashidi, N.A.; Yusup, S.; Hameed, B.H. Kinetic studies on CO2 capture using lignocellulosic based activated carbon. Energy 2013, 61, 440–446. [Google Scholar] [CrossRef]
- Balsamo, M.; Budinova, T.; Erto, A.; Lancia, A.; Petrova, B.; Petrov, N.; Tsyntsarski, B. CO2 adsorption onto synthetic activated carbon: Kinetic, thermodynamic and regeneration studies. Sep. Purif. Technol. 2013, 116, 214–221. [Google Scholar] [CrossRef]
- Shieu, A.; Hu, S.C.; Chang, S.M.; Ko, T.Y.; Hsieh, A.; Chan, A. Adsorption kinetics and breakthrough of carbon dioxide for the chemical modified activated carbon filter used in the building. Sustanability 2017, 9, 1533. [Google Scholar] [CrossRef]
- Khalili, S.; Khoshandam, B.; Jahanshahi, M. Optimization of production conditions for synthesis of chemically activated carbon produced from pine cone using response surface methadology for CO2 adsorption. RSC Adv. 2015, 5, 94115–94129. [Google Scholar] [CrossRef]
- Ismat, H.A.; Mohammed, K.A.; Mohammad, I.K.; Mohd, D.; Majed, M.A. Exploring Adsorption Process of Lead (II) and Chromium (VI) Ions from Aqueous Solutions on Acid Activated Carbon Prepared from Juniperus procera Leaves. Processes 2019, 7, 1–14. [Google Scholar]


© 2019 by the authors. Licensee MDPI, Basel, Switzerland. This article is an open access article distributed under the terms and conditions of the Creative Commons Attribution (CC BY) license (http://creativecommons.org/licenses/by/4.0/).