Numerical and Experimental Investigation on Radiated Noise Characteristics of the Multistage Centrifugal Pump


Abstract
1. Introduction
2. Method and Basic Theory
2.1. Theory of the Acoustic Simulation
2.2. DES Method
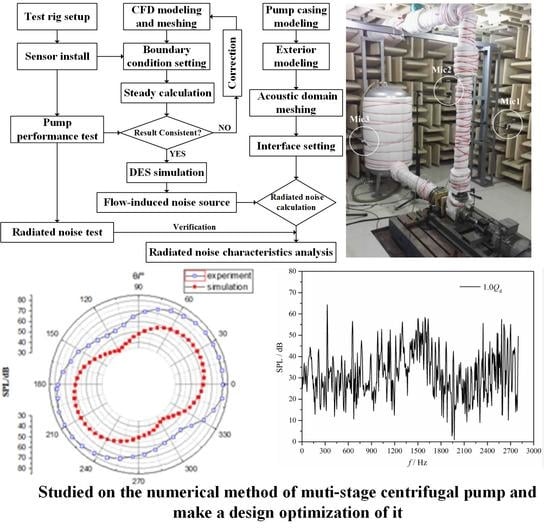
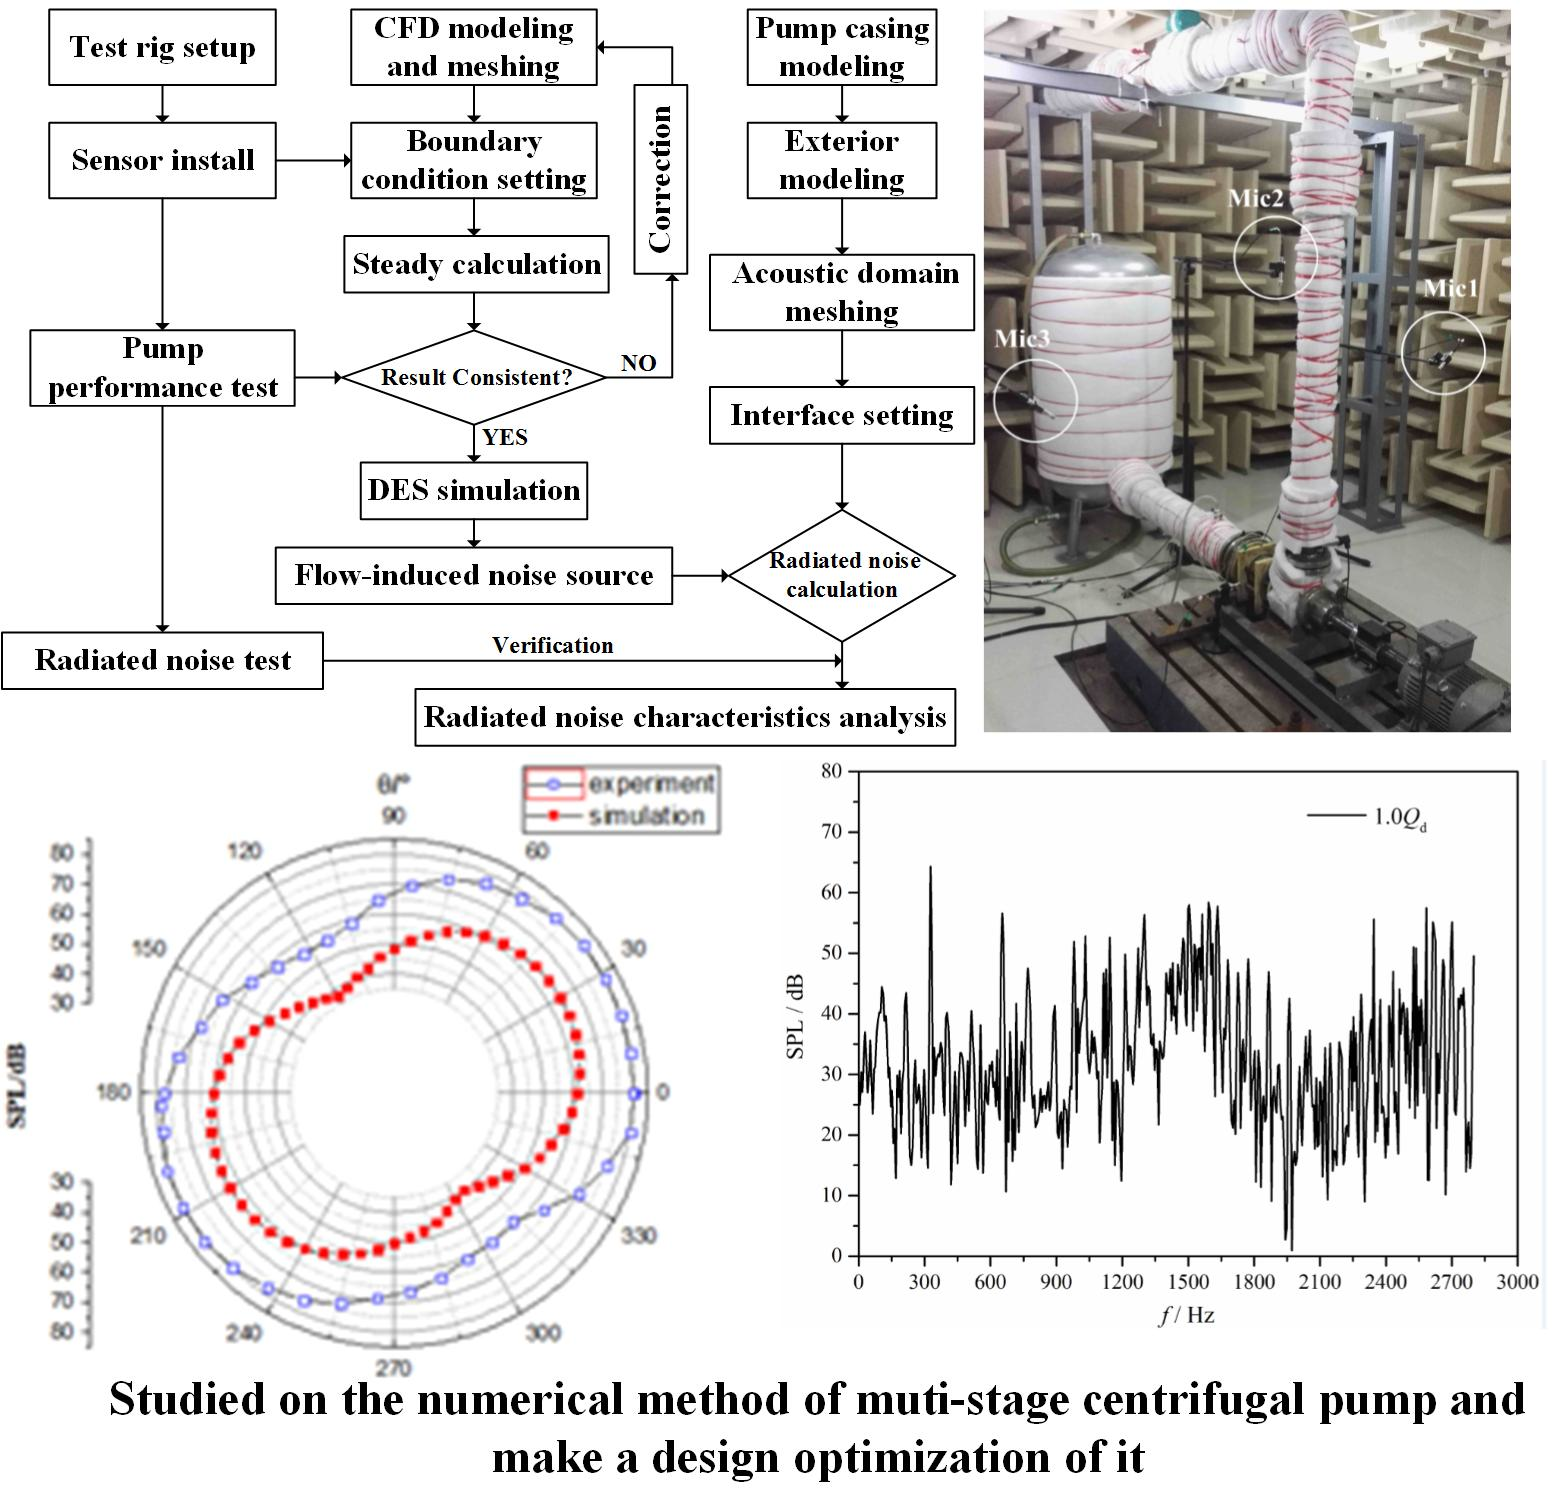
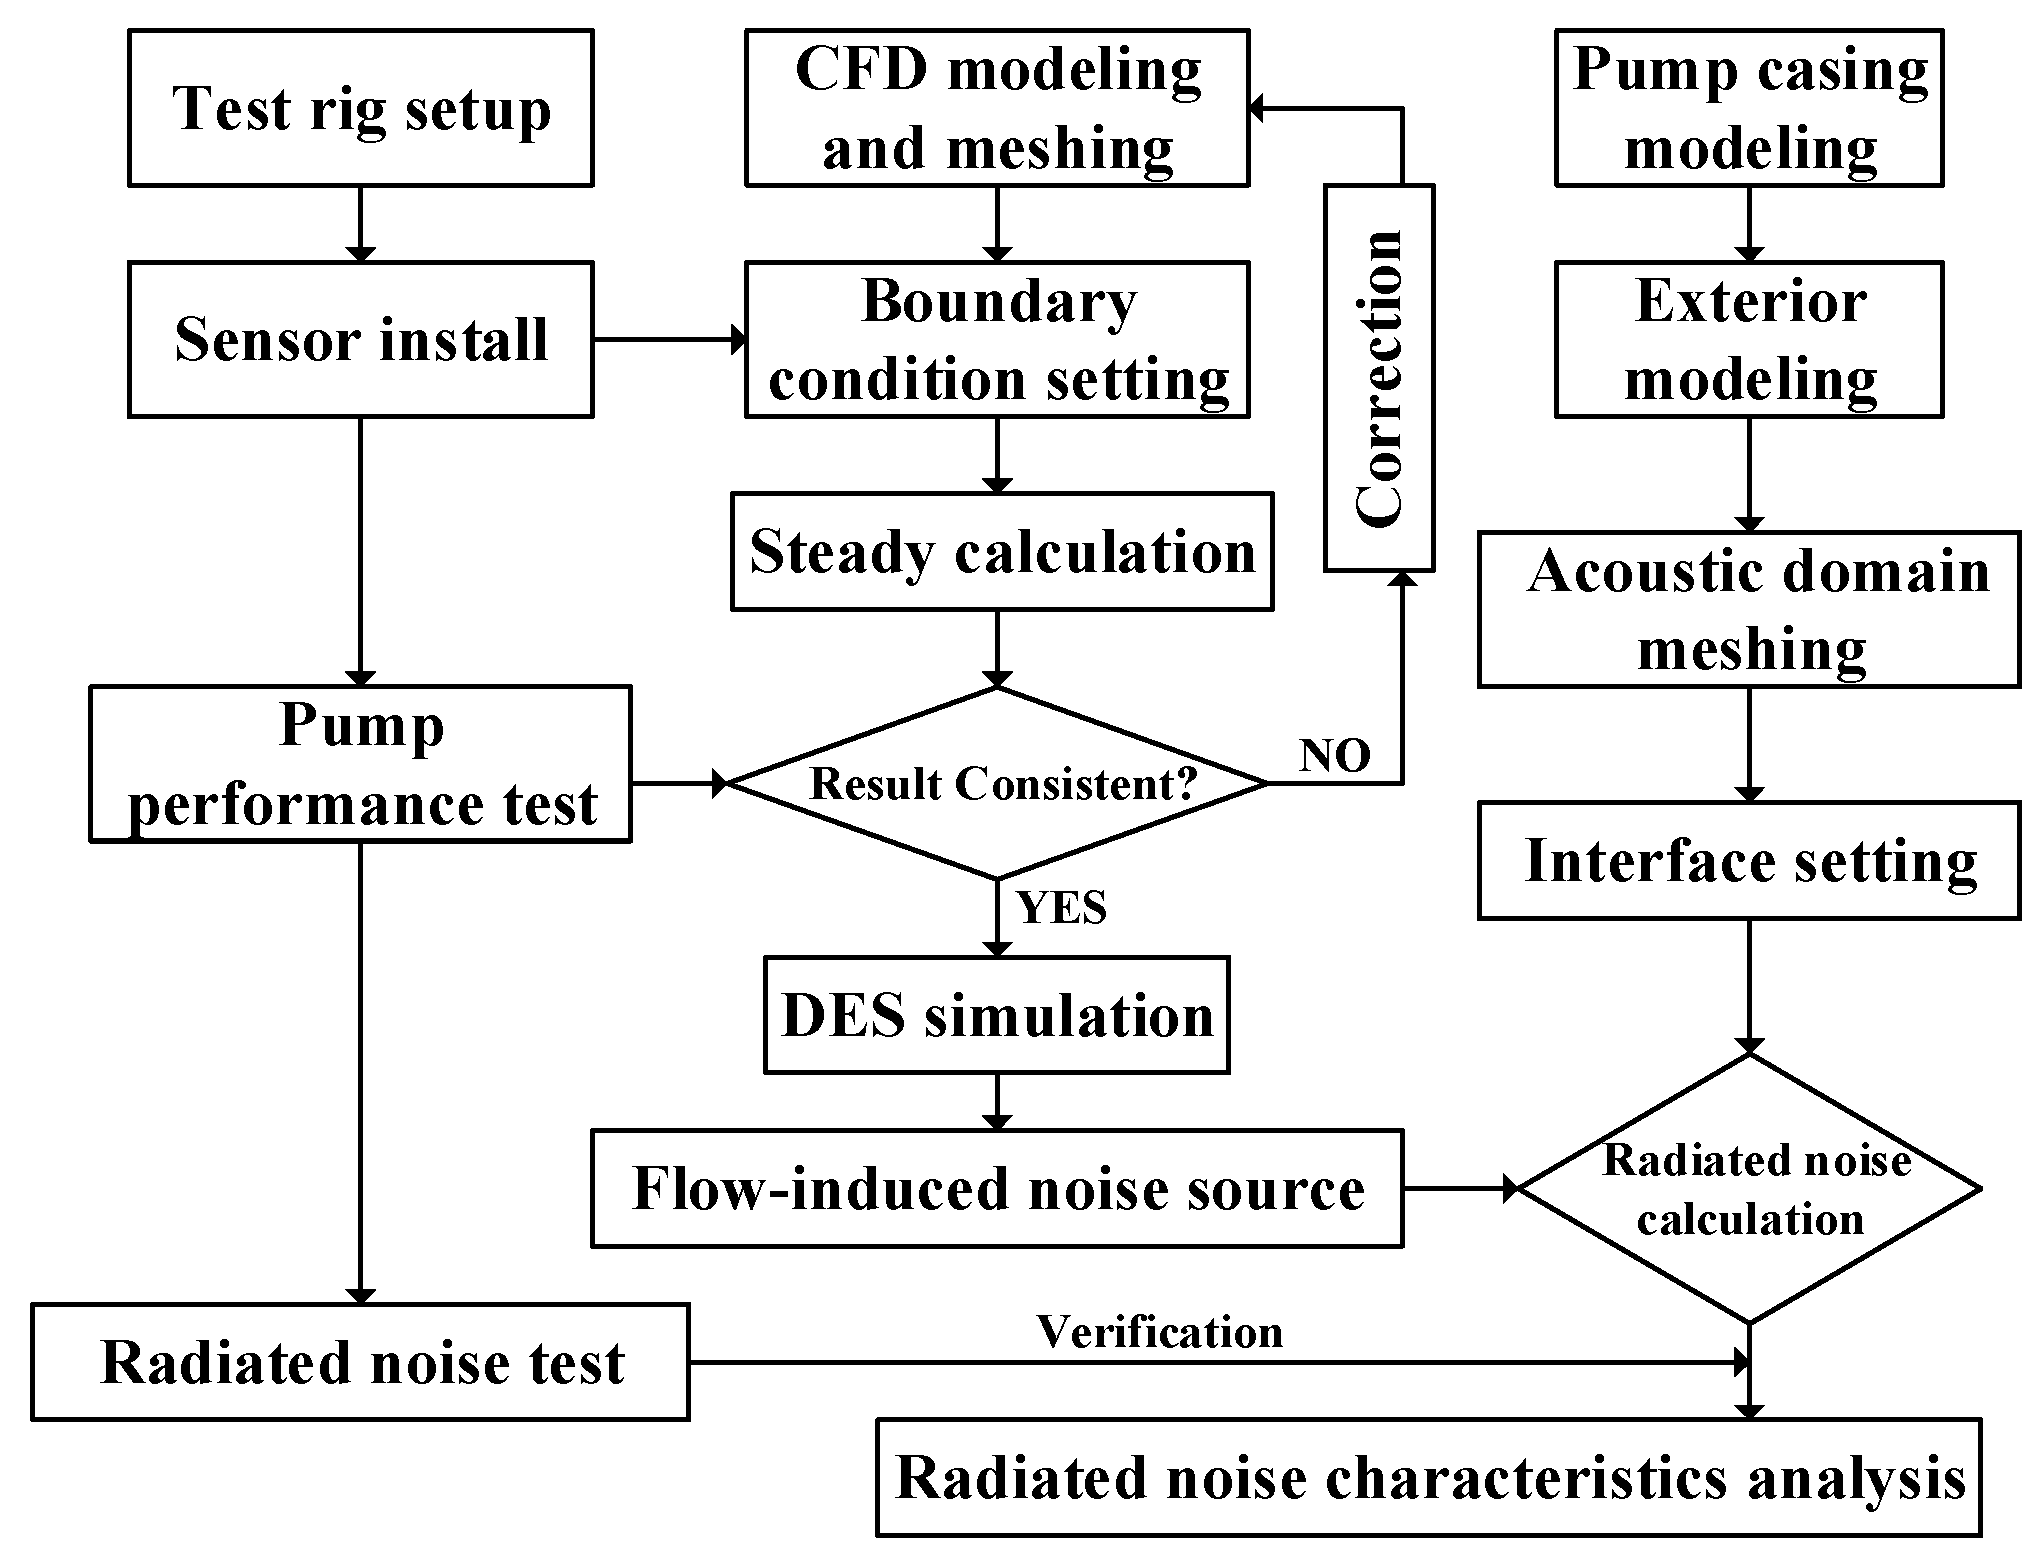
2.3. Simulation Procedure
3. Numerical Method
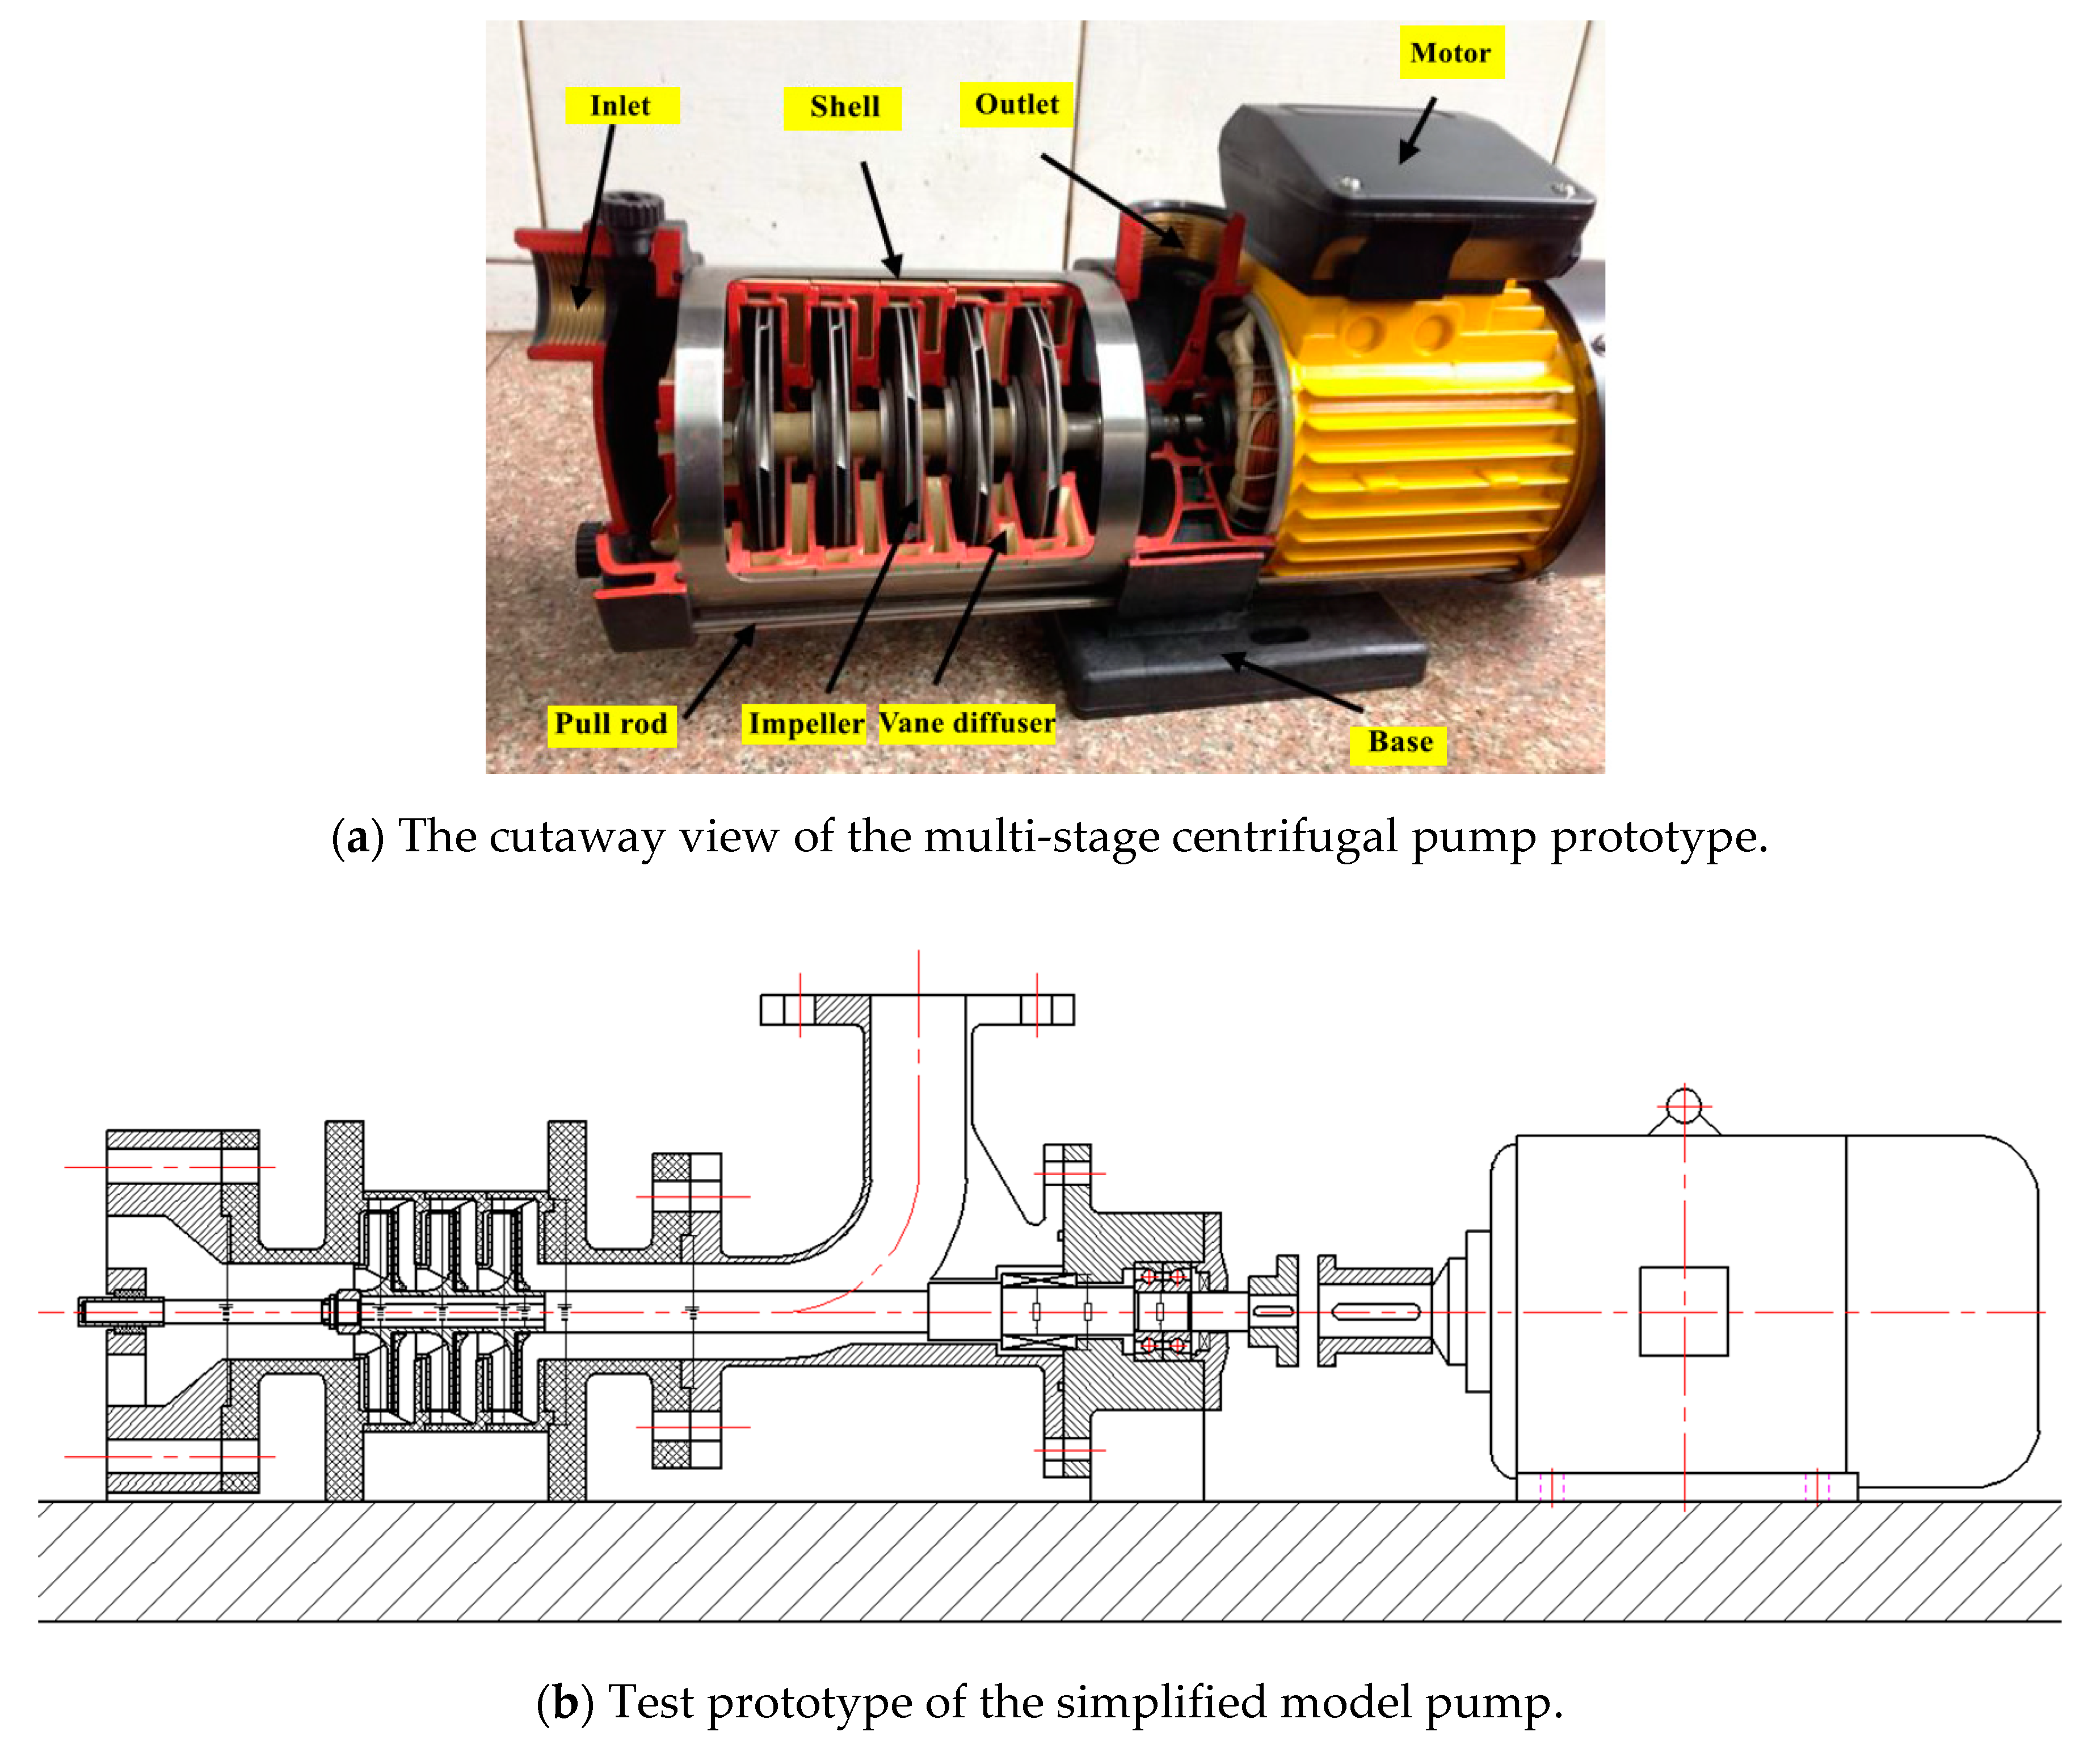
3.1. Study Object
3.2. Fluid Field Simulation
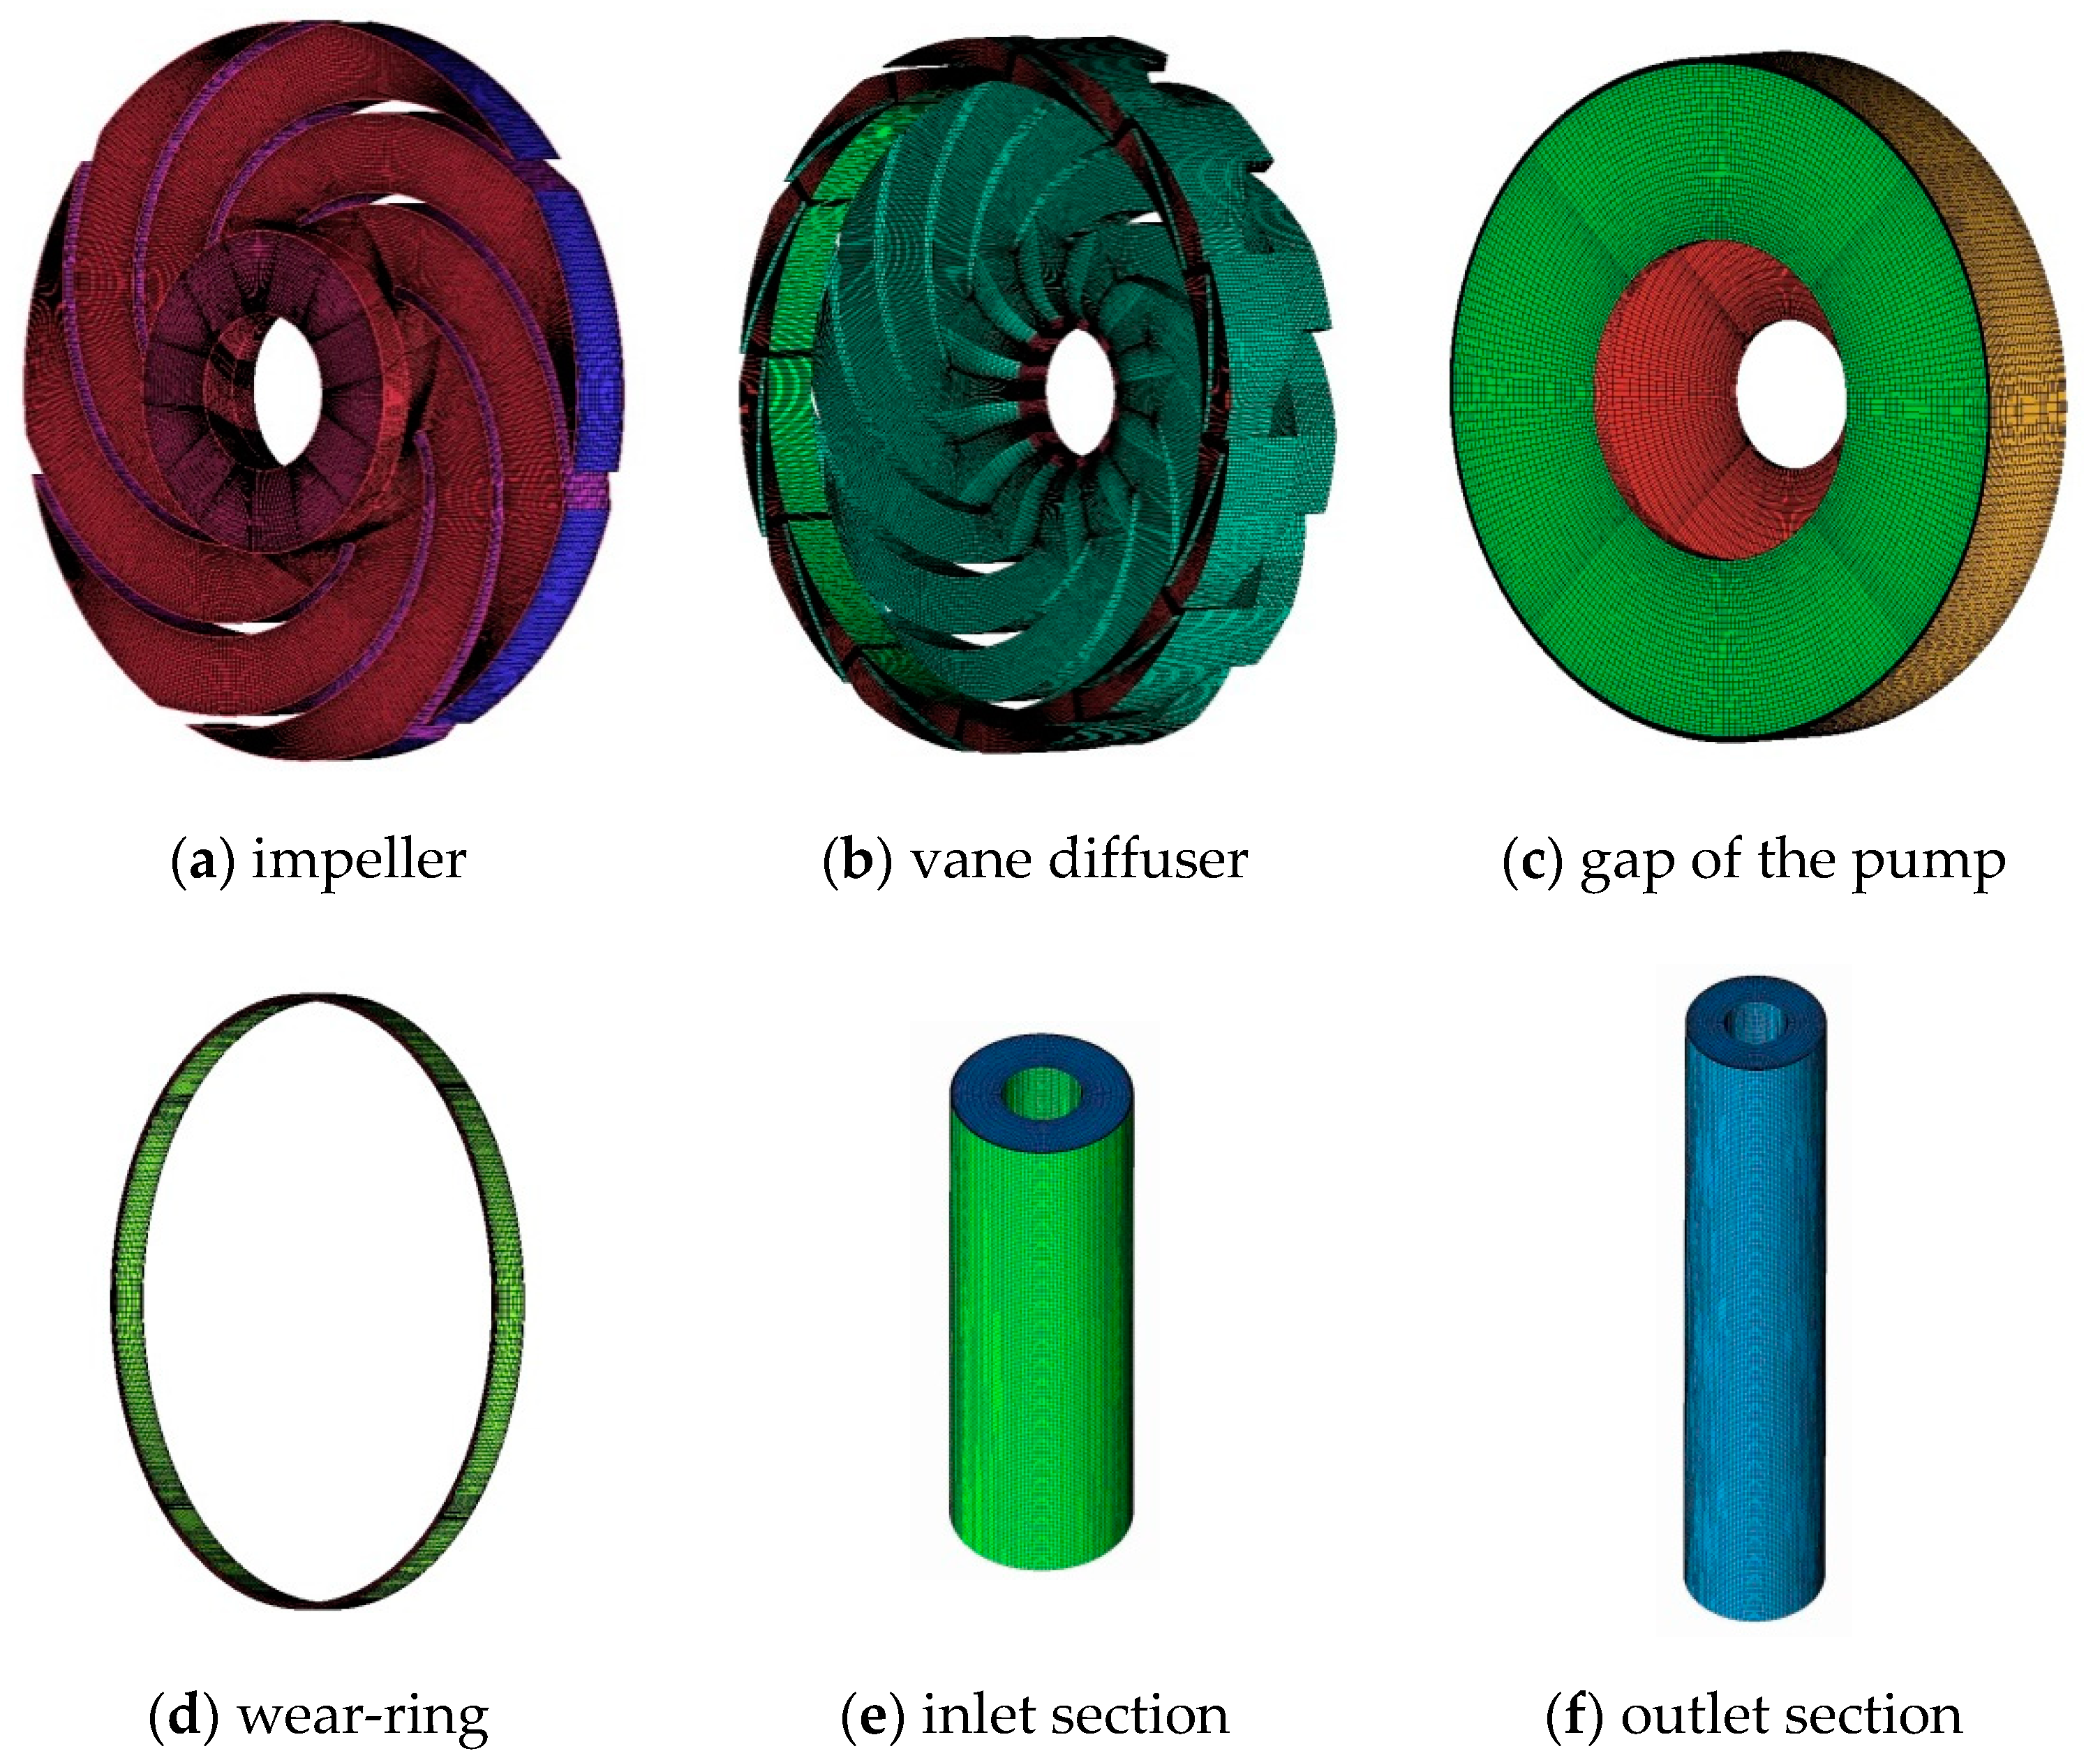
3.2.1. Computational Domain
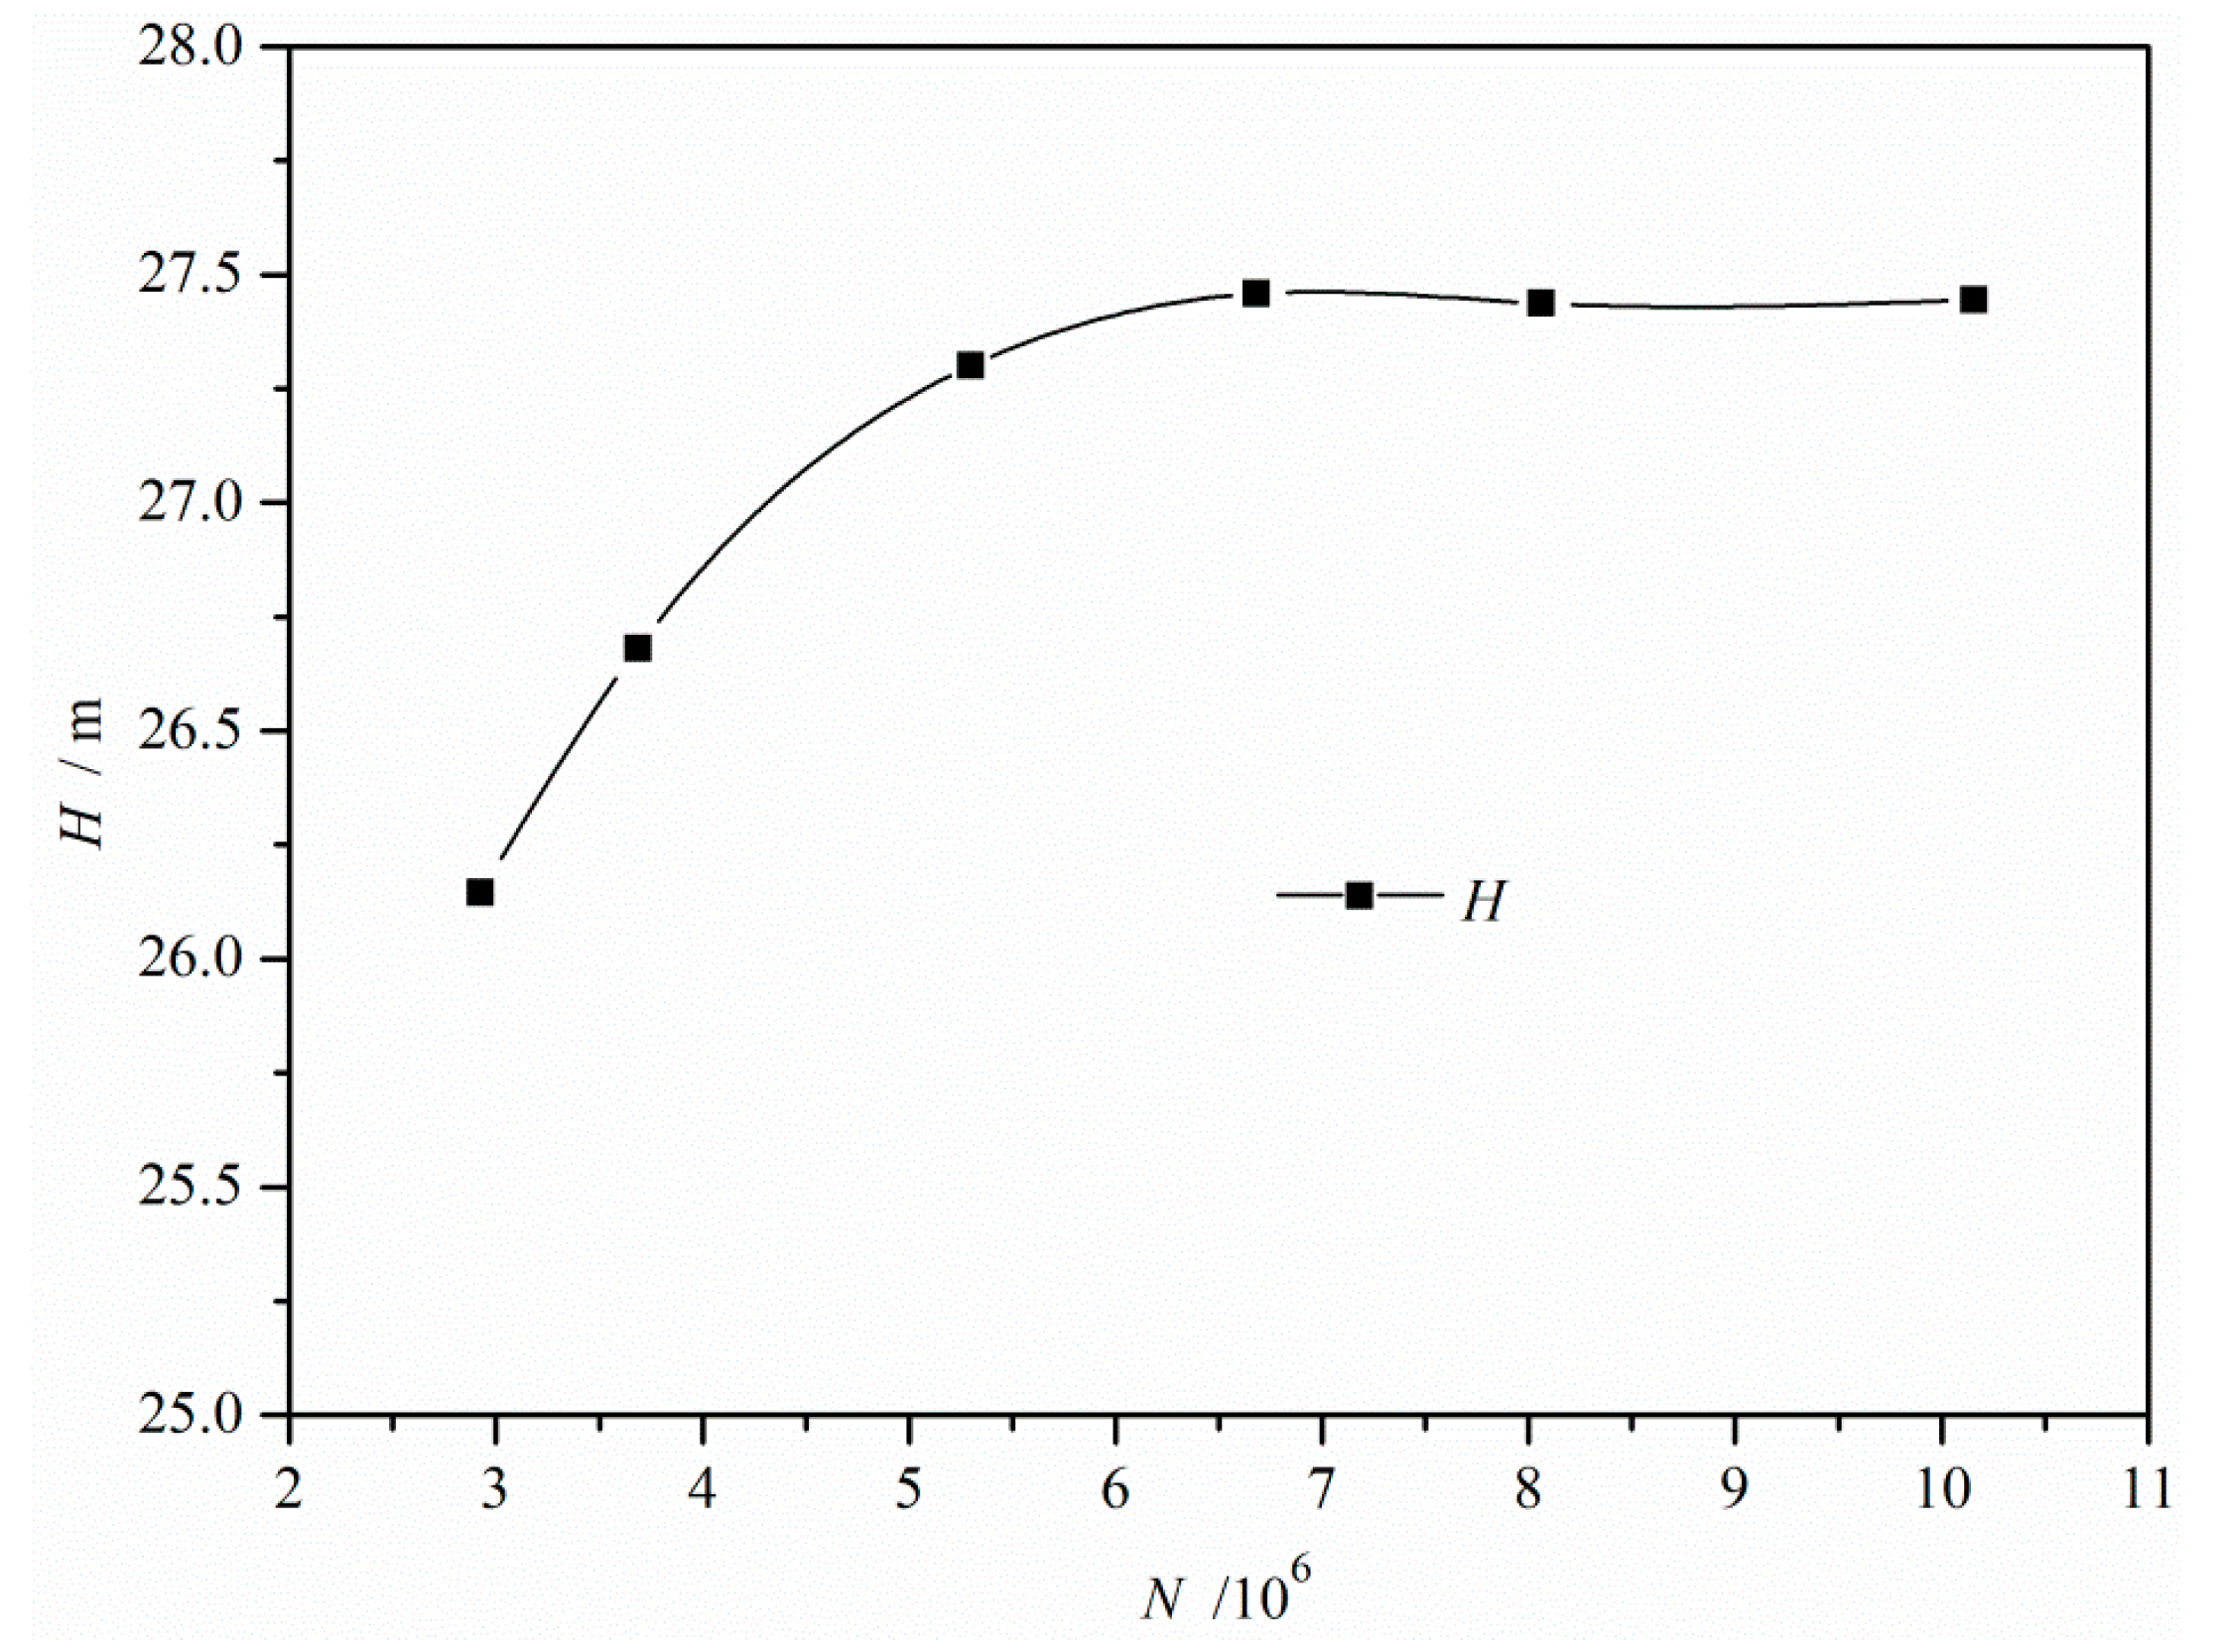
3.2.2. Mesh Generation and Boundary Conditions
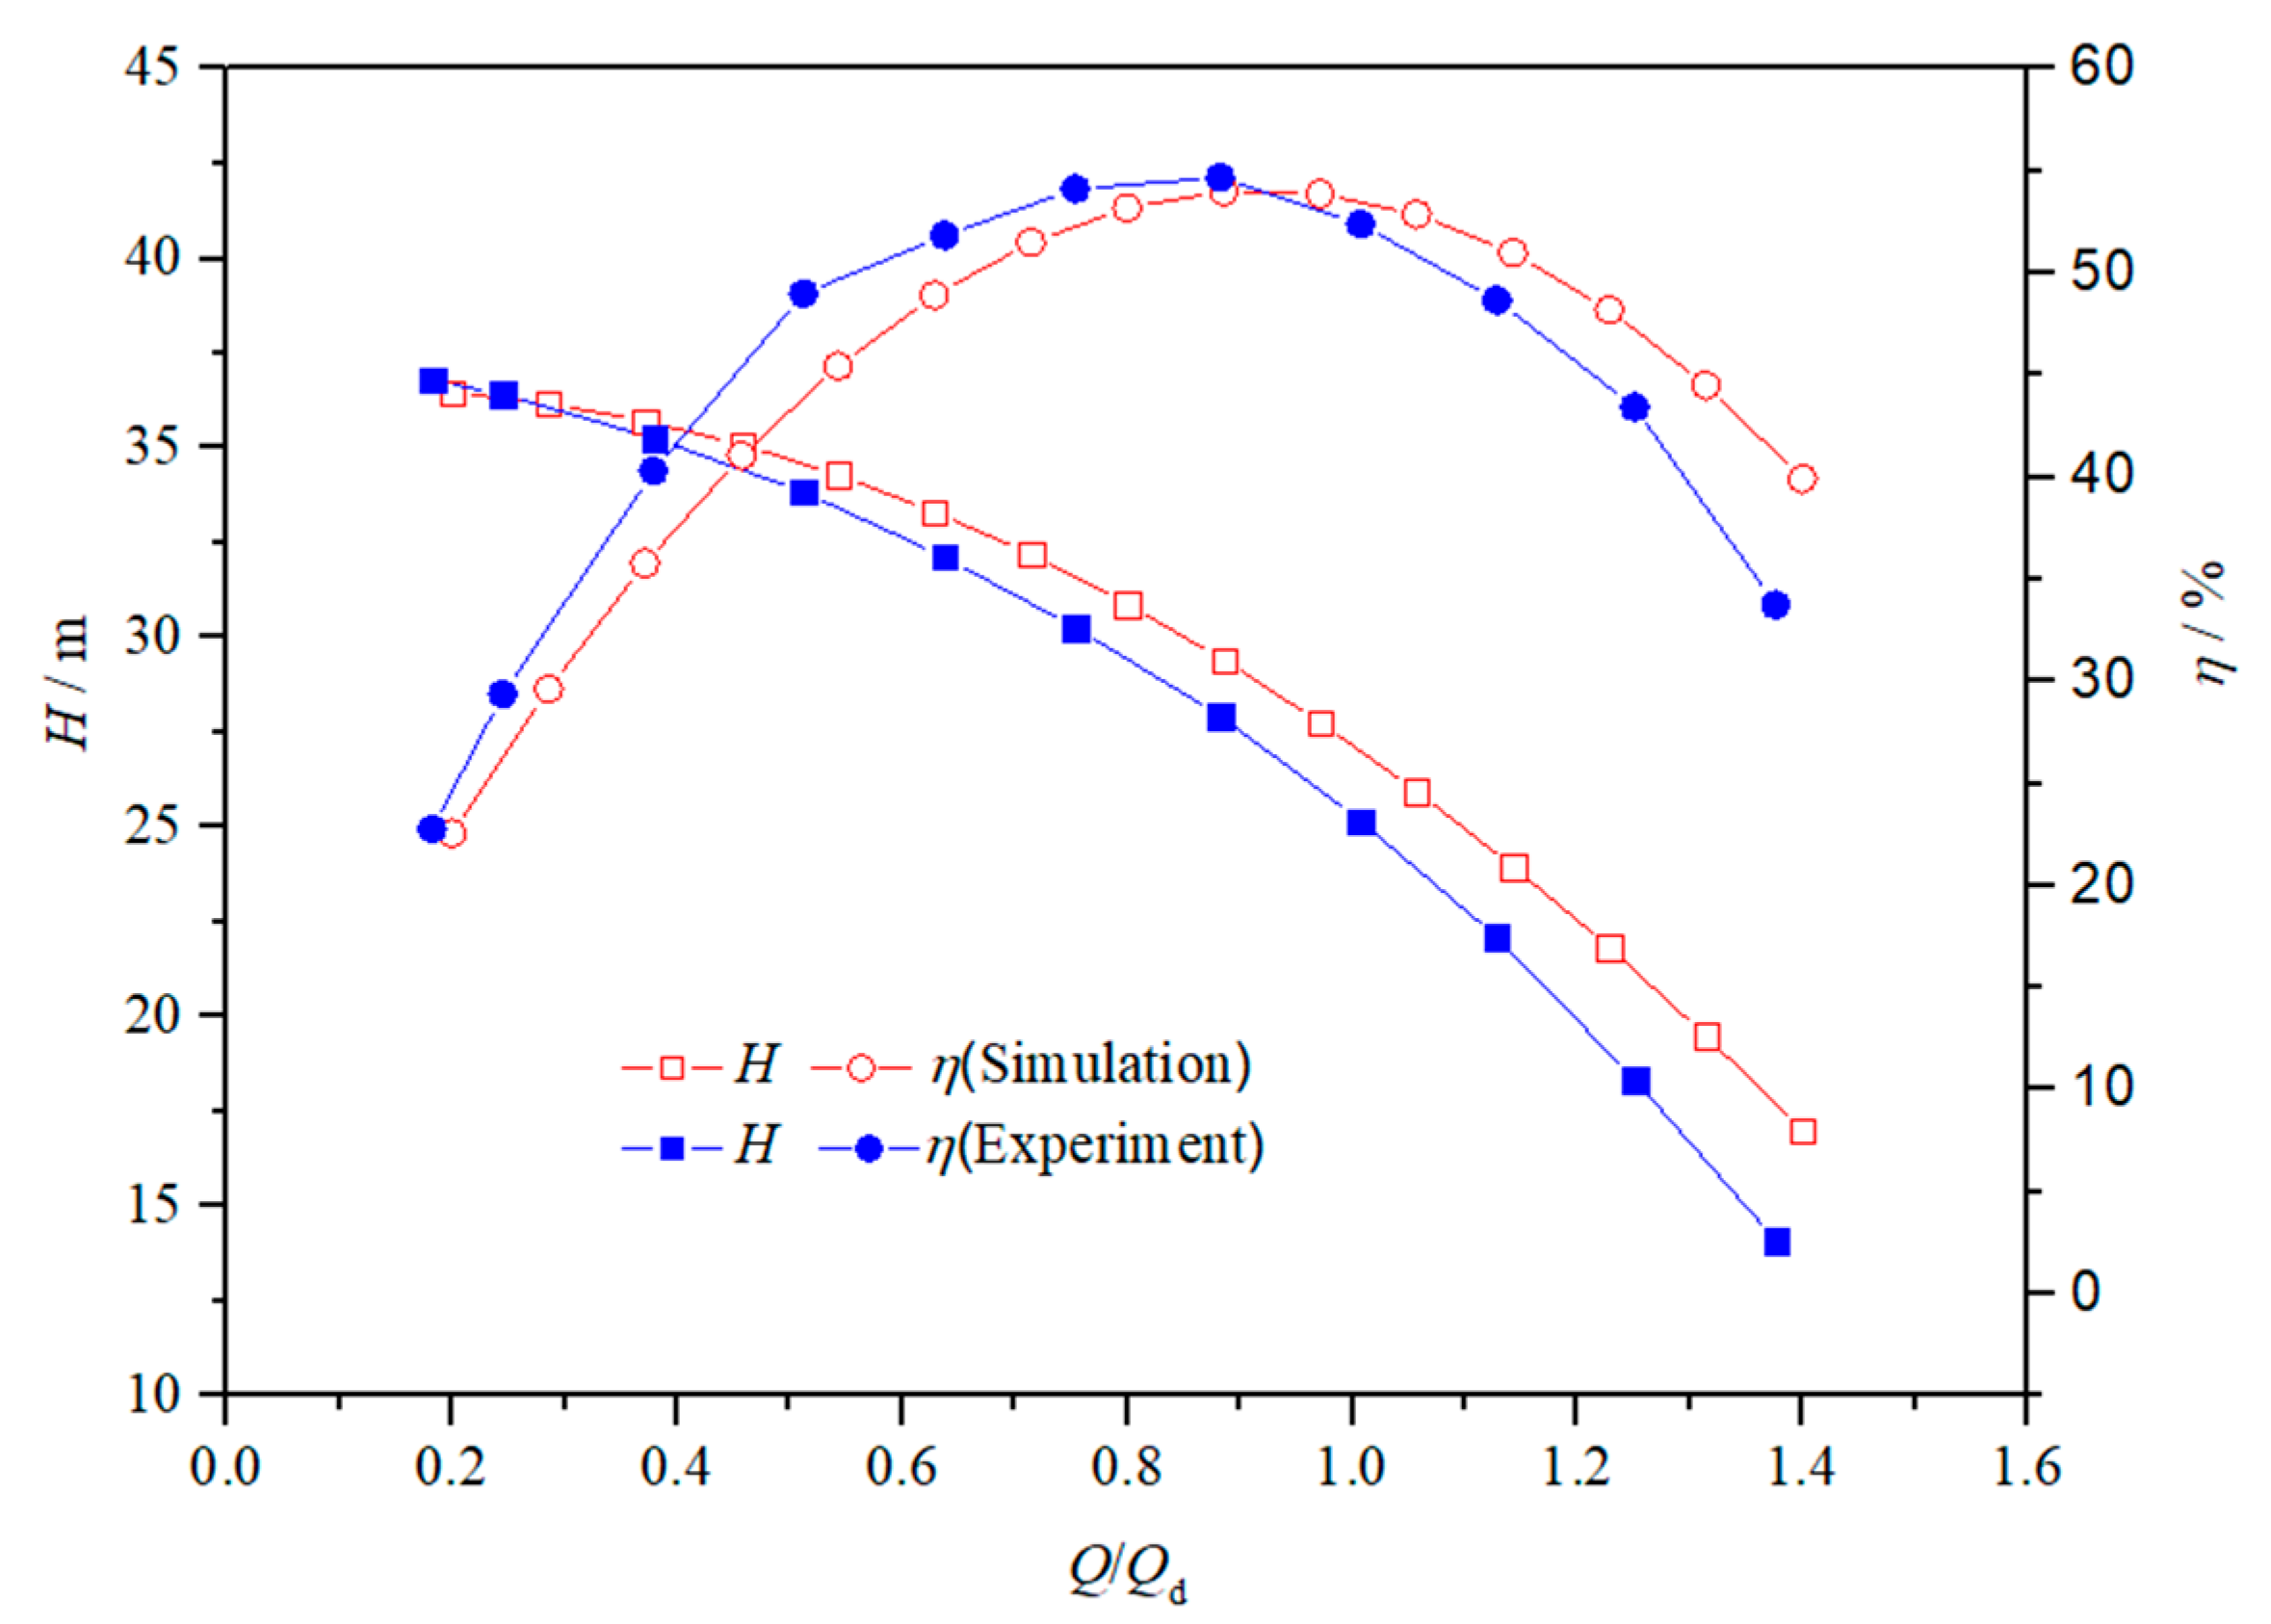
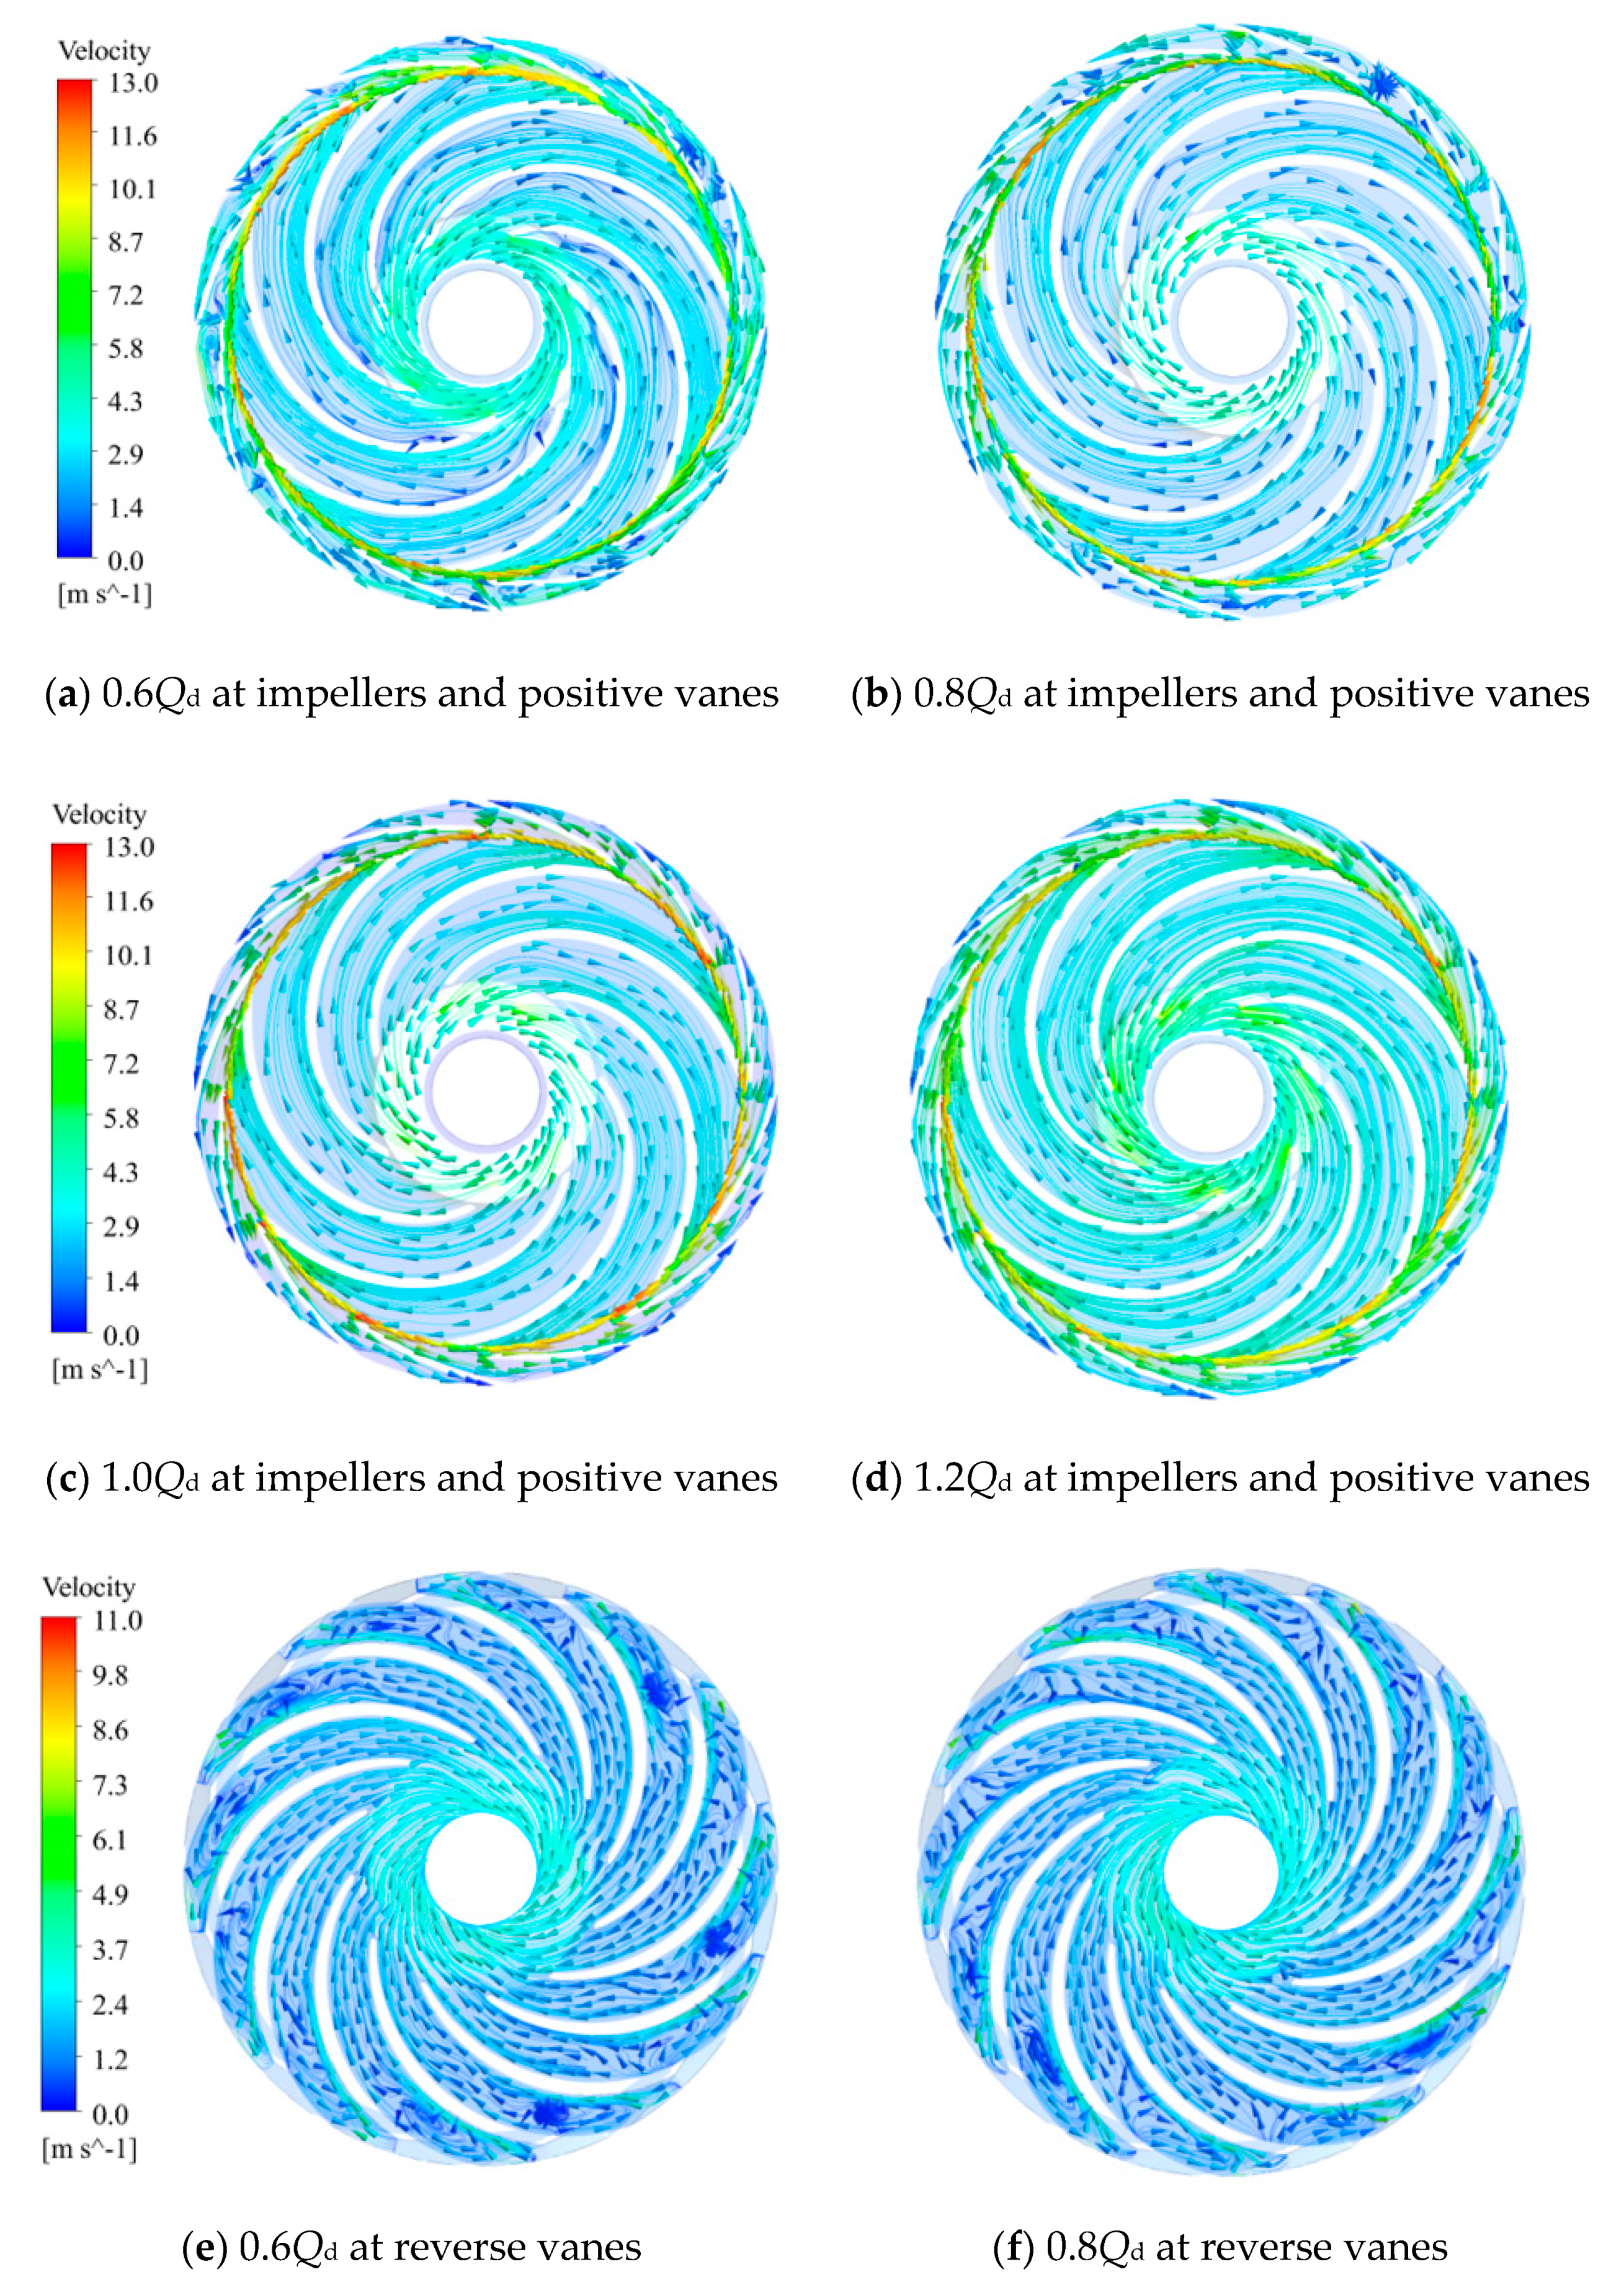
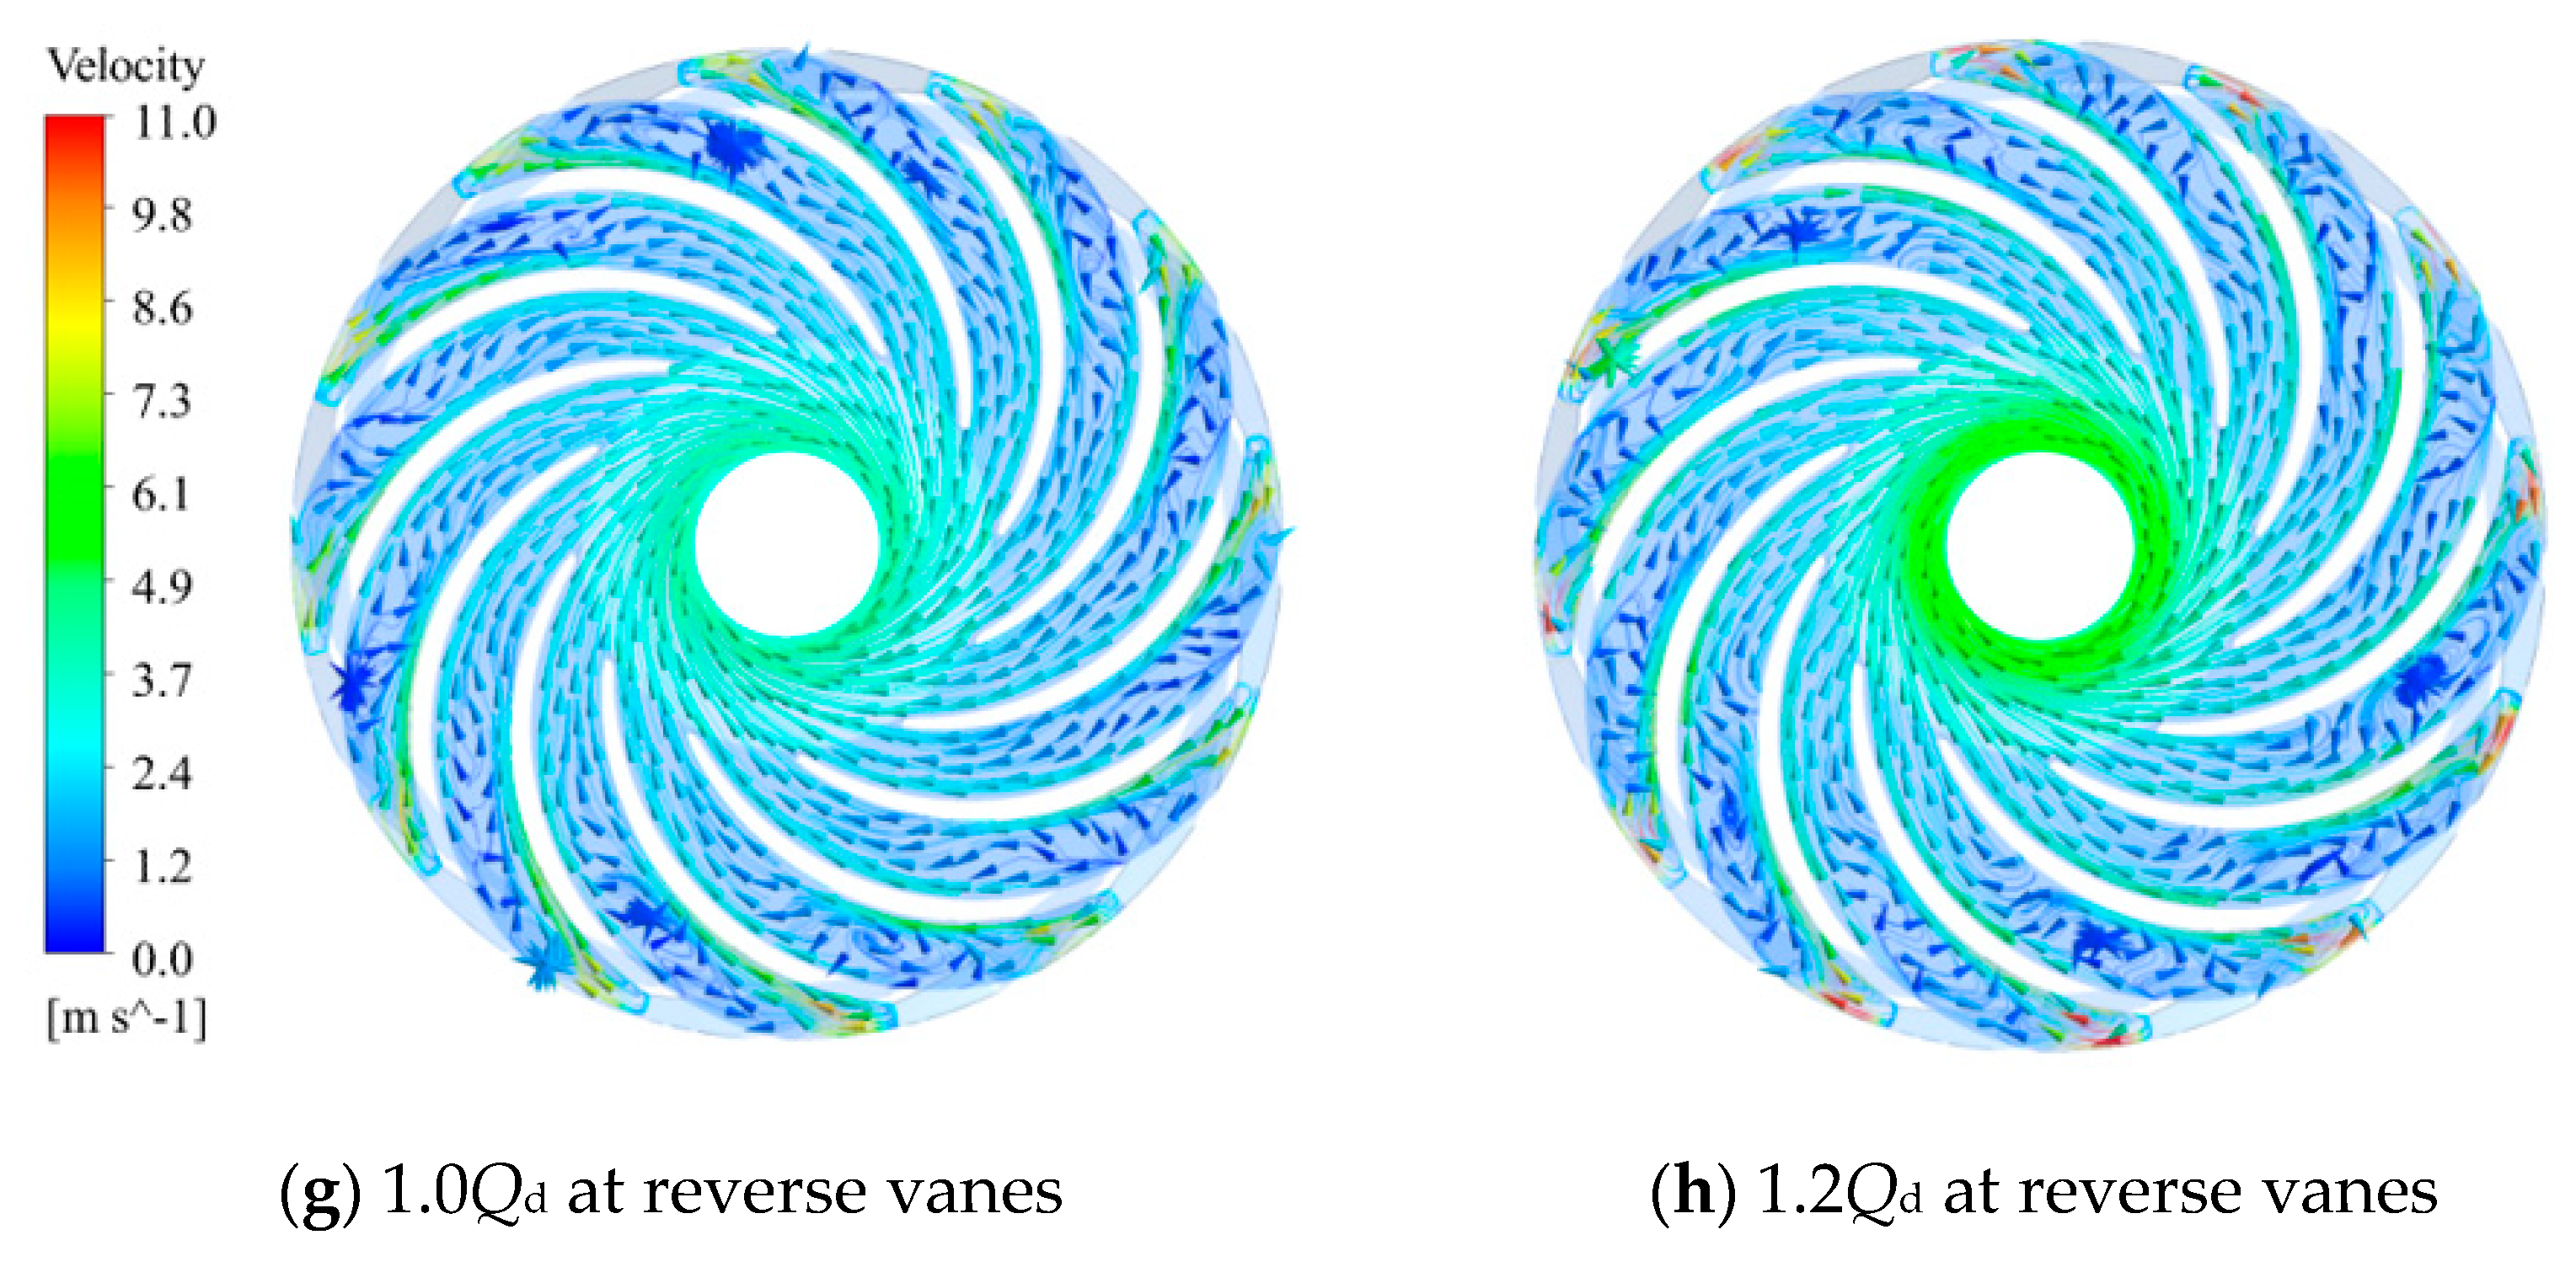
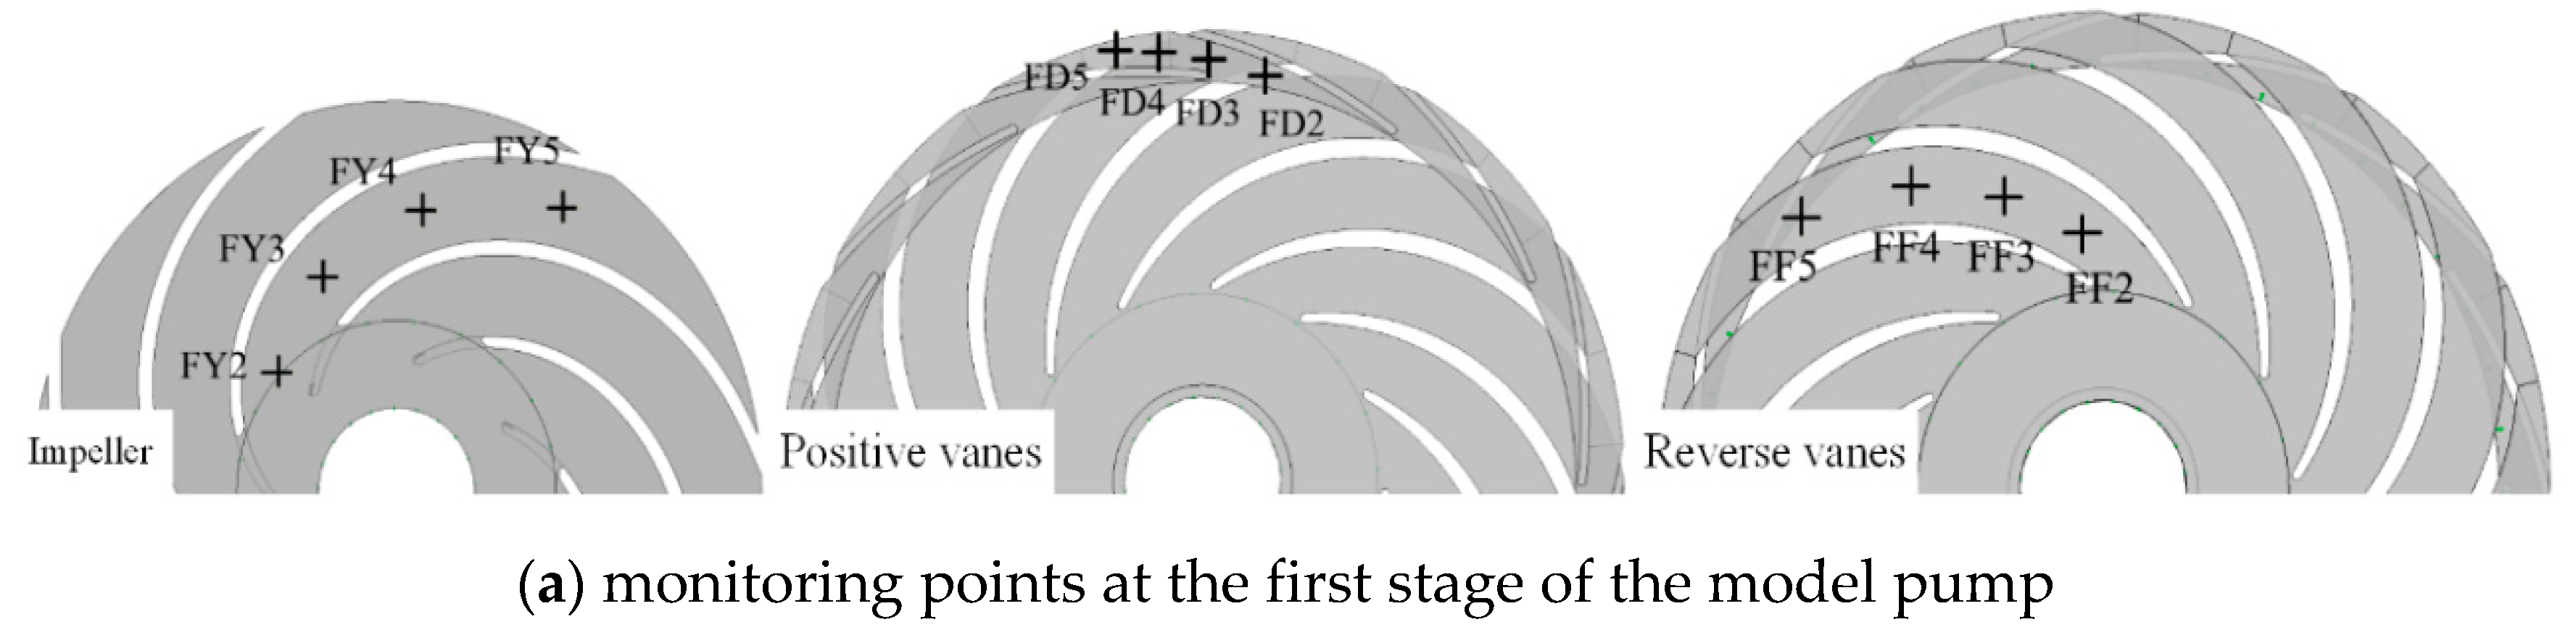
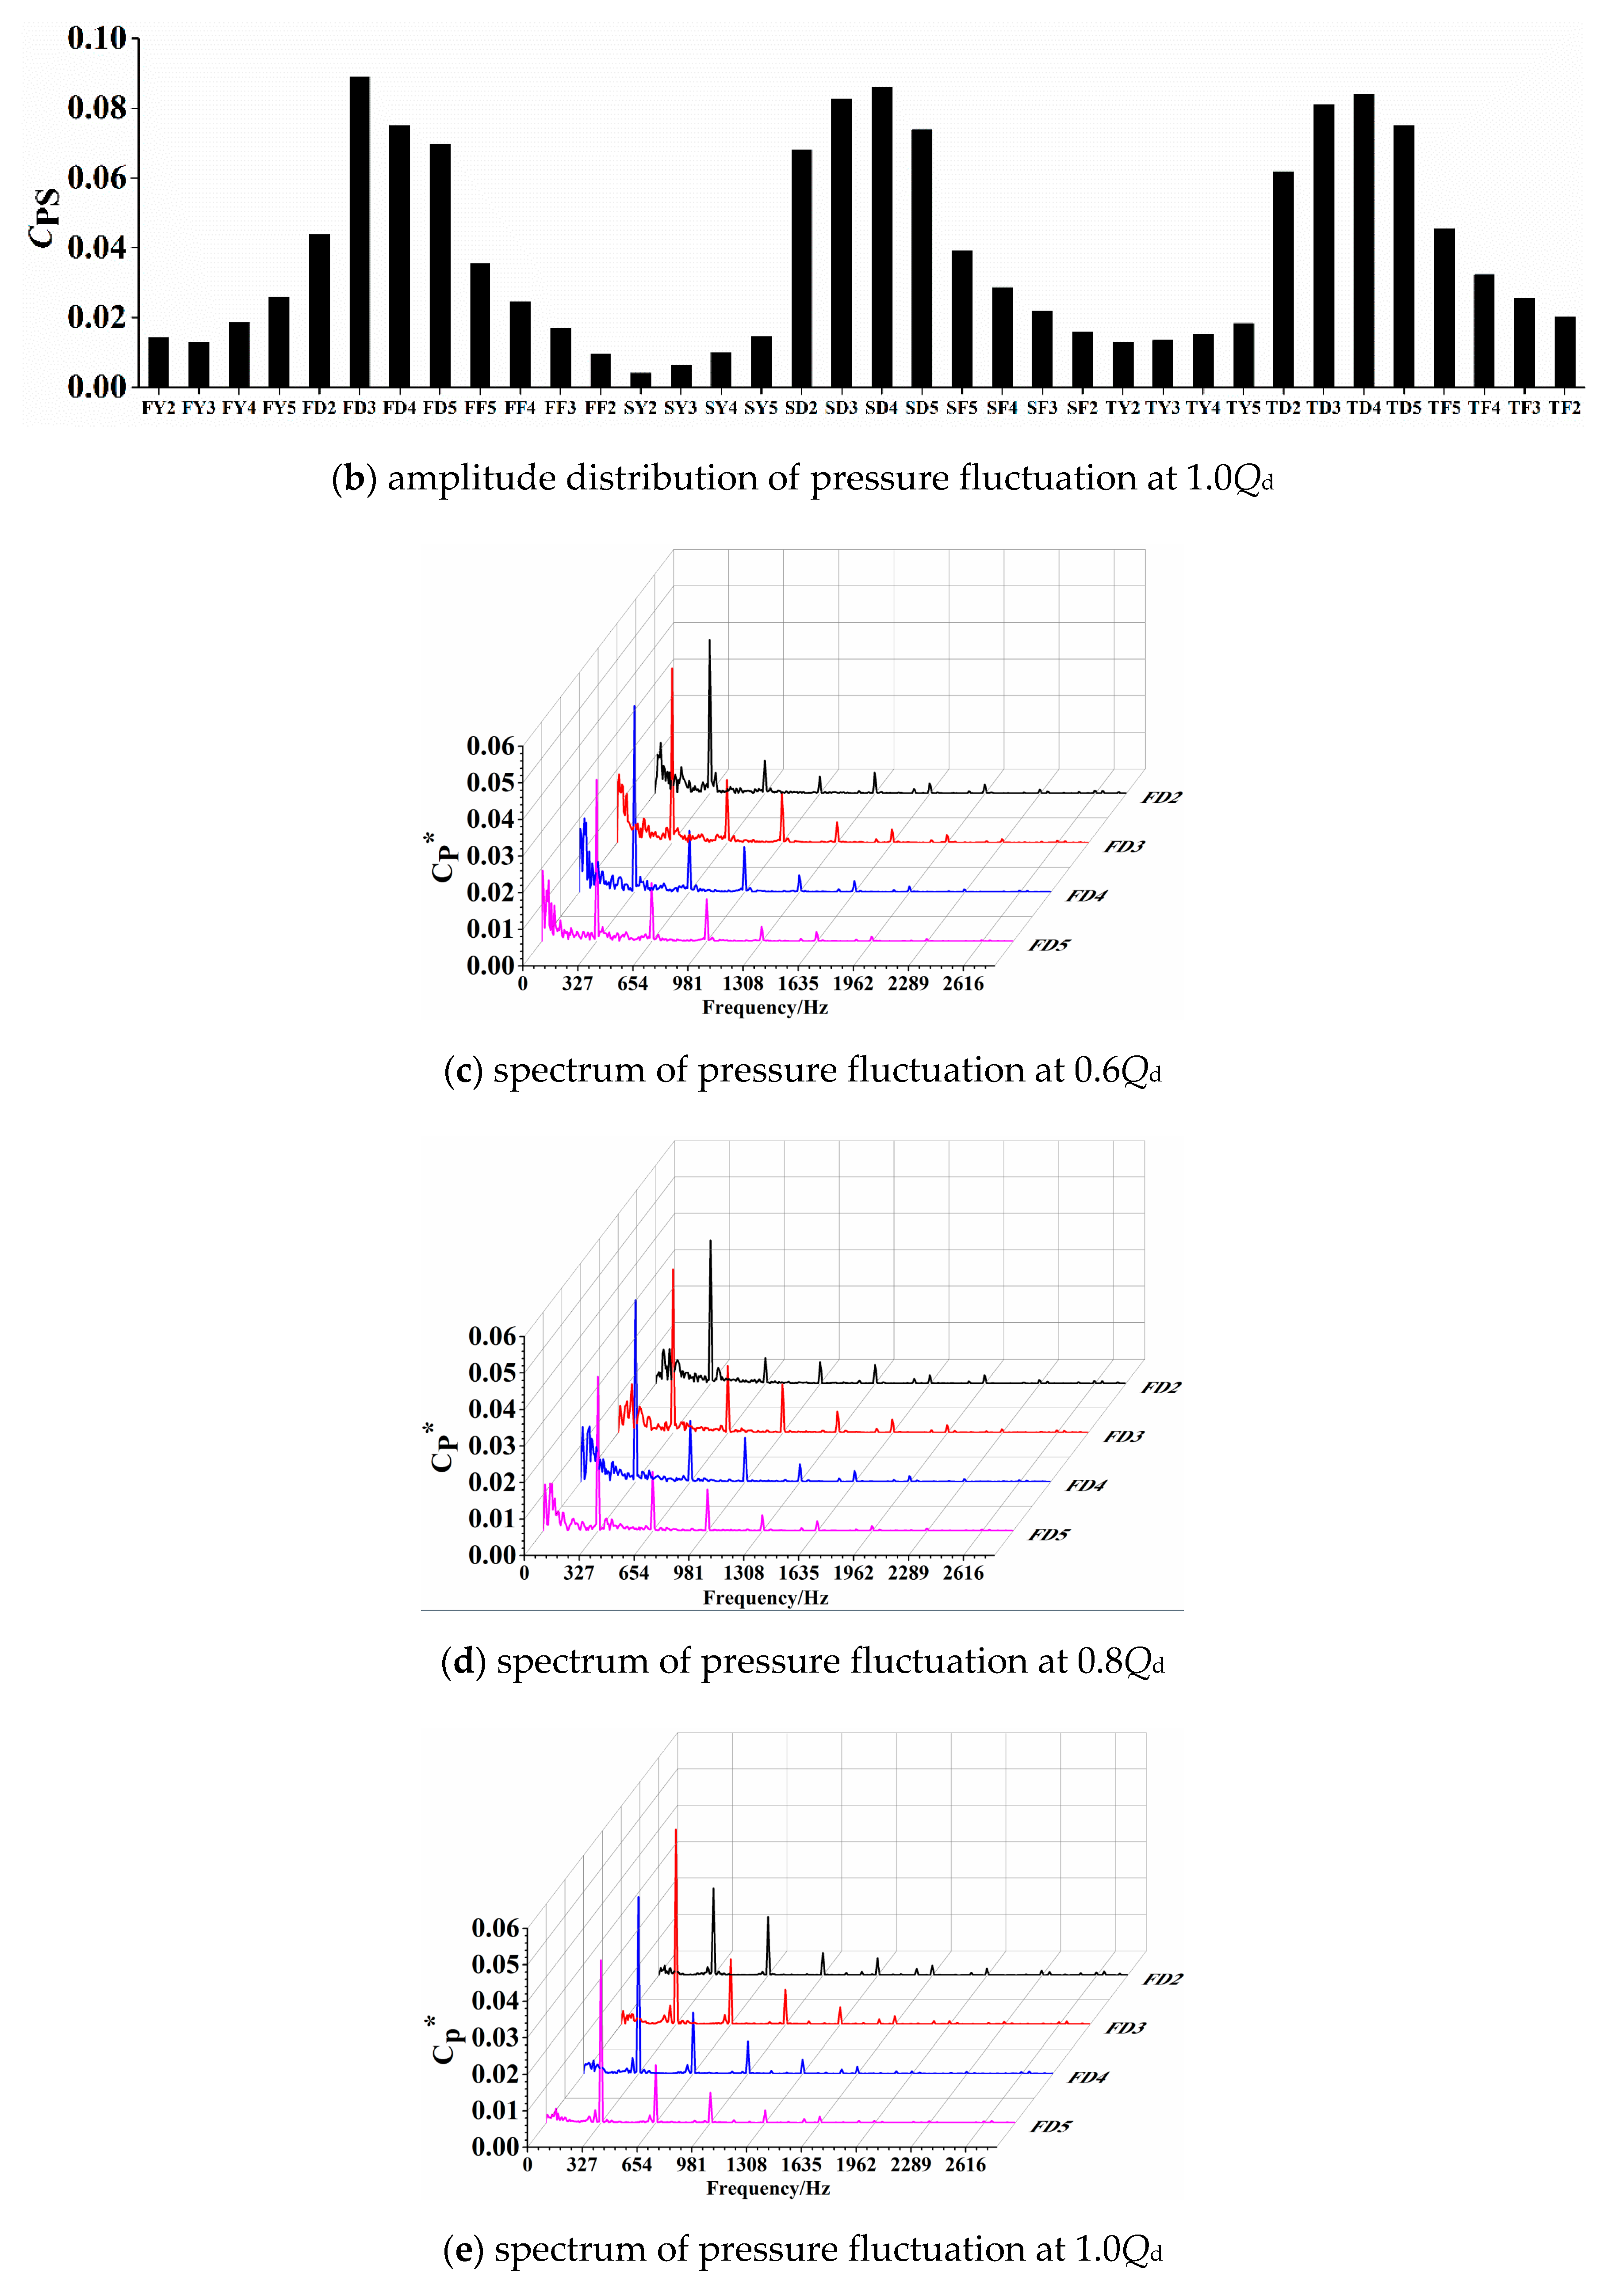
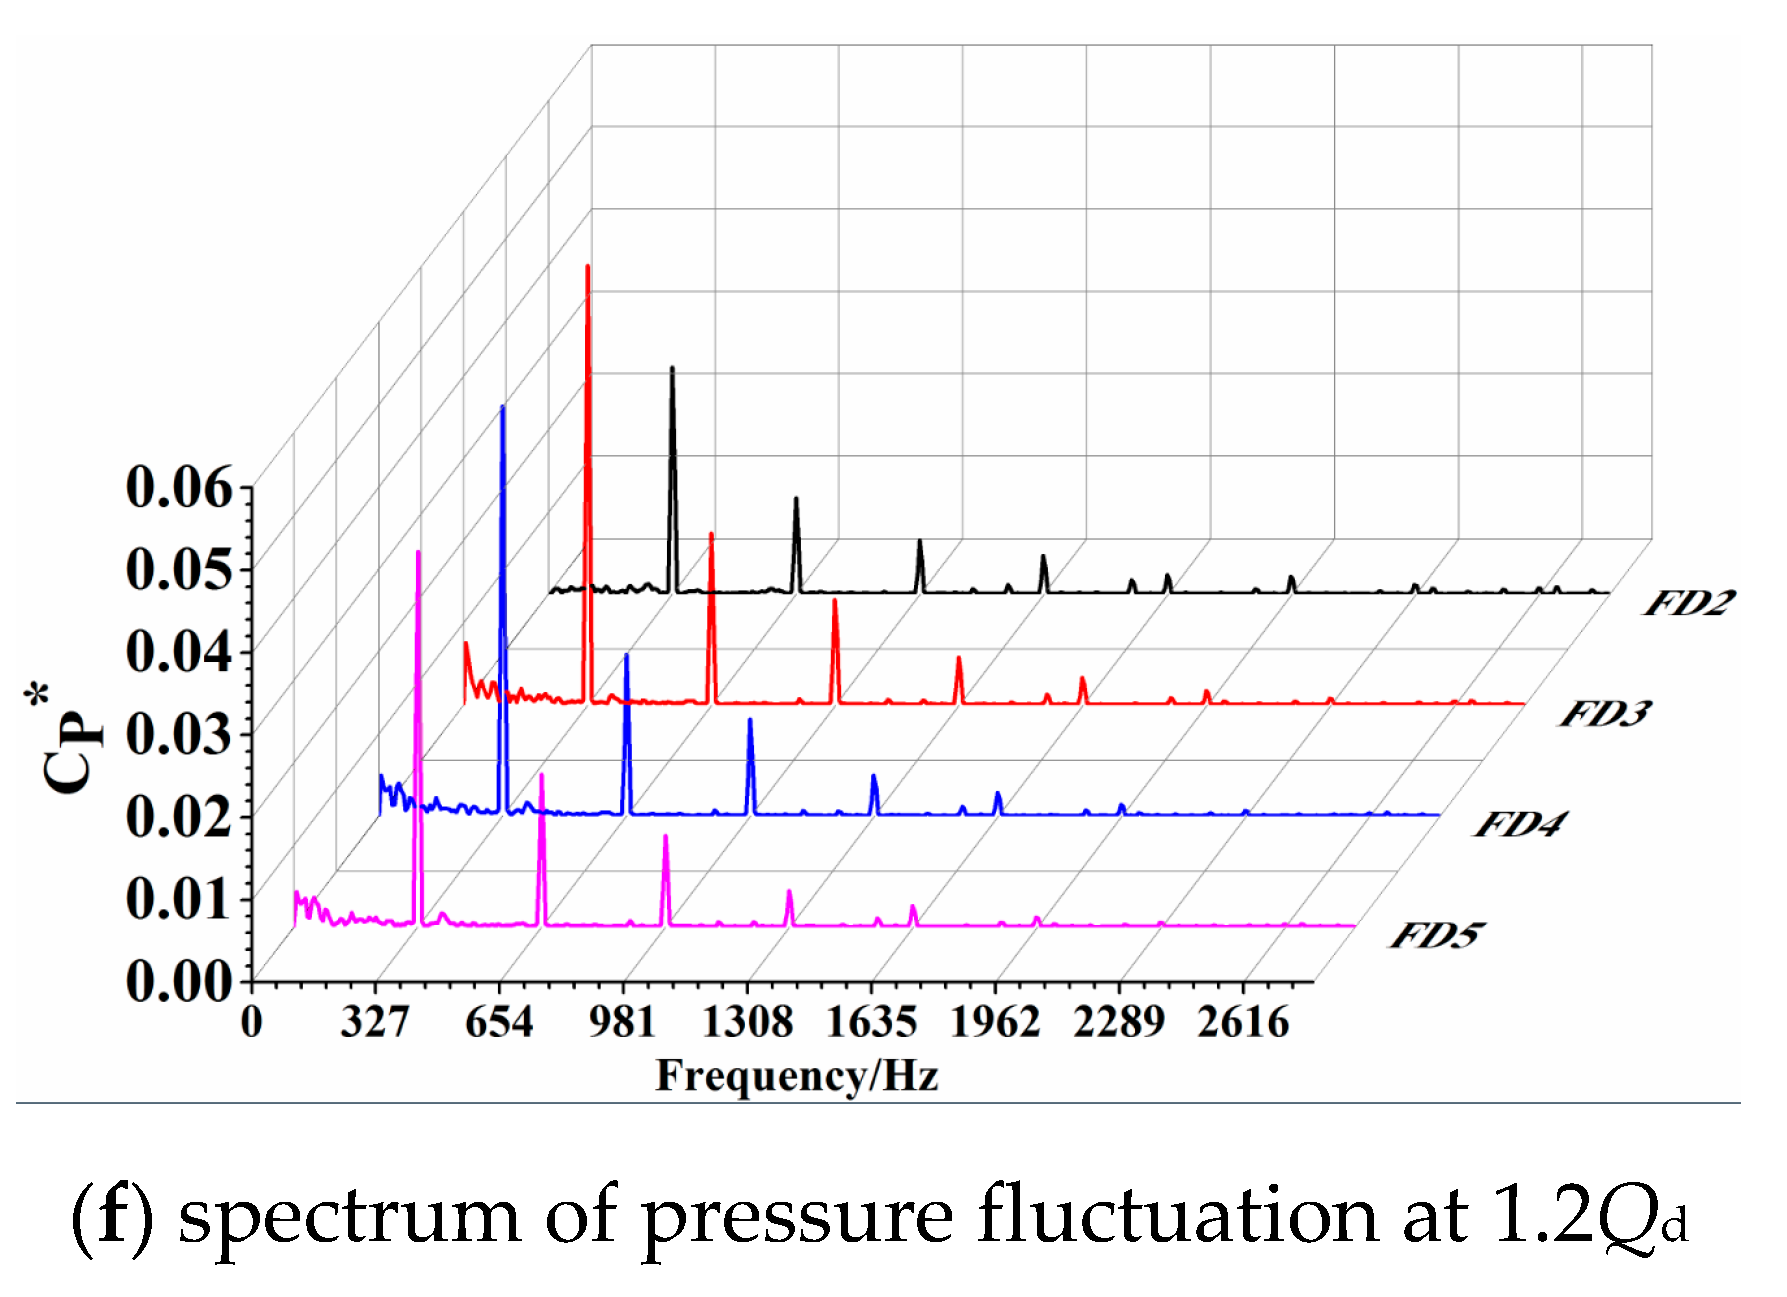
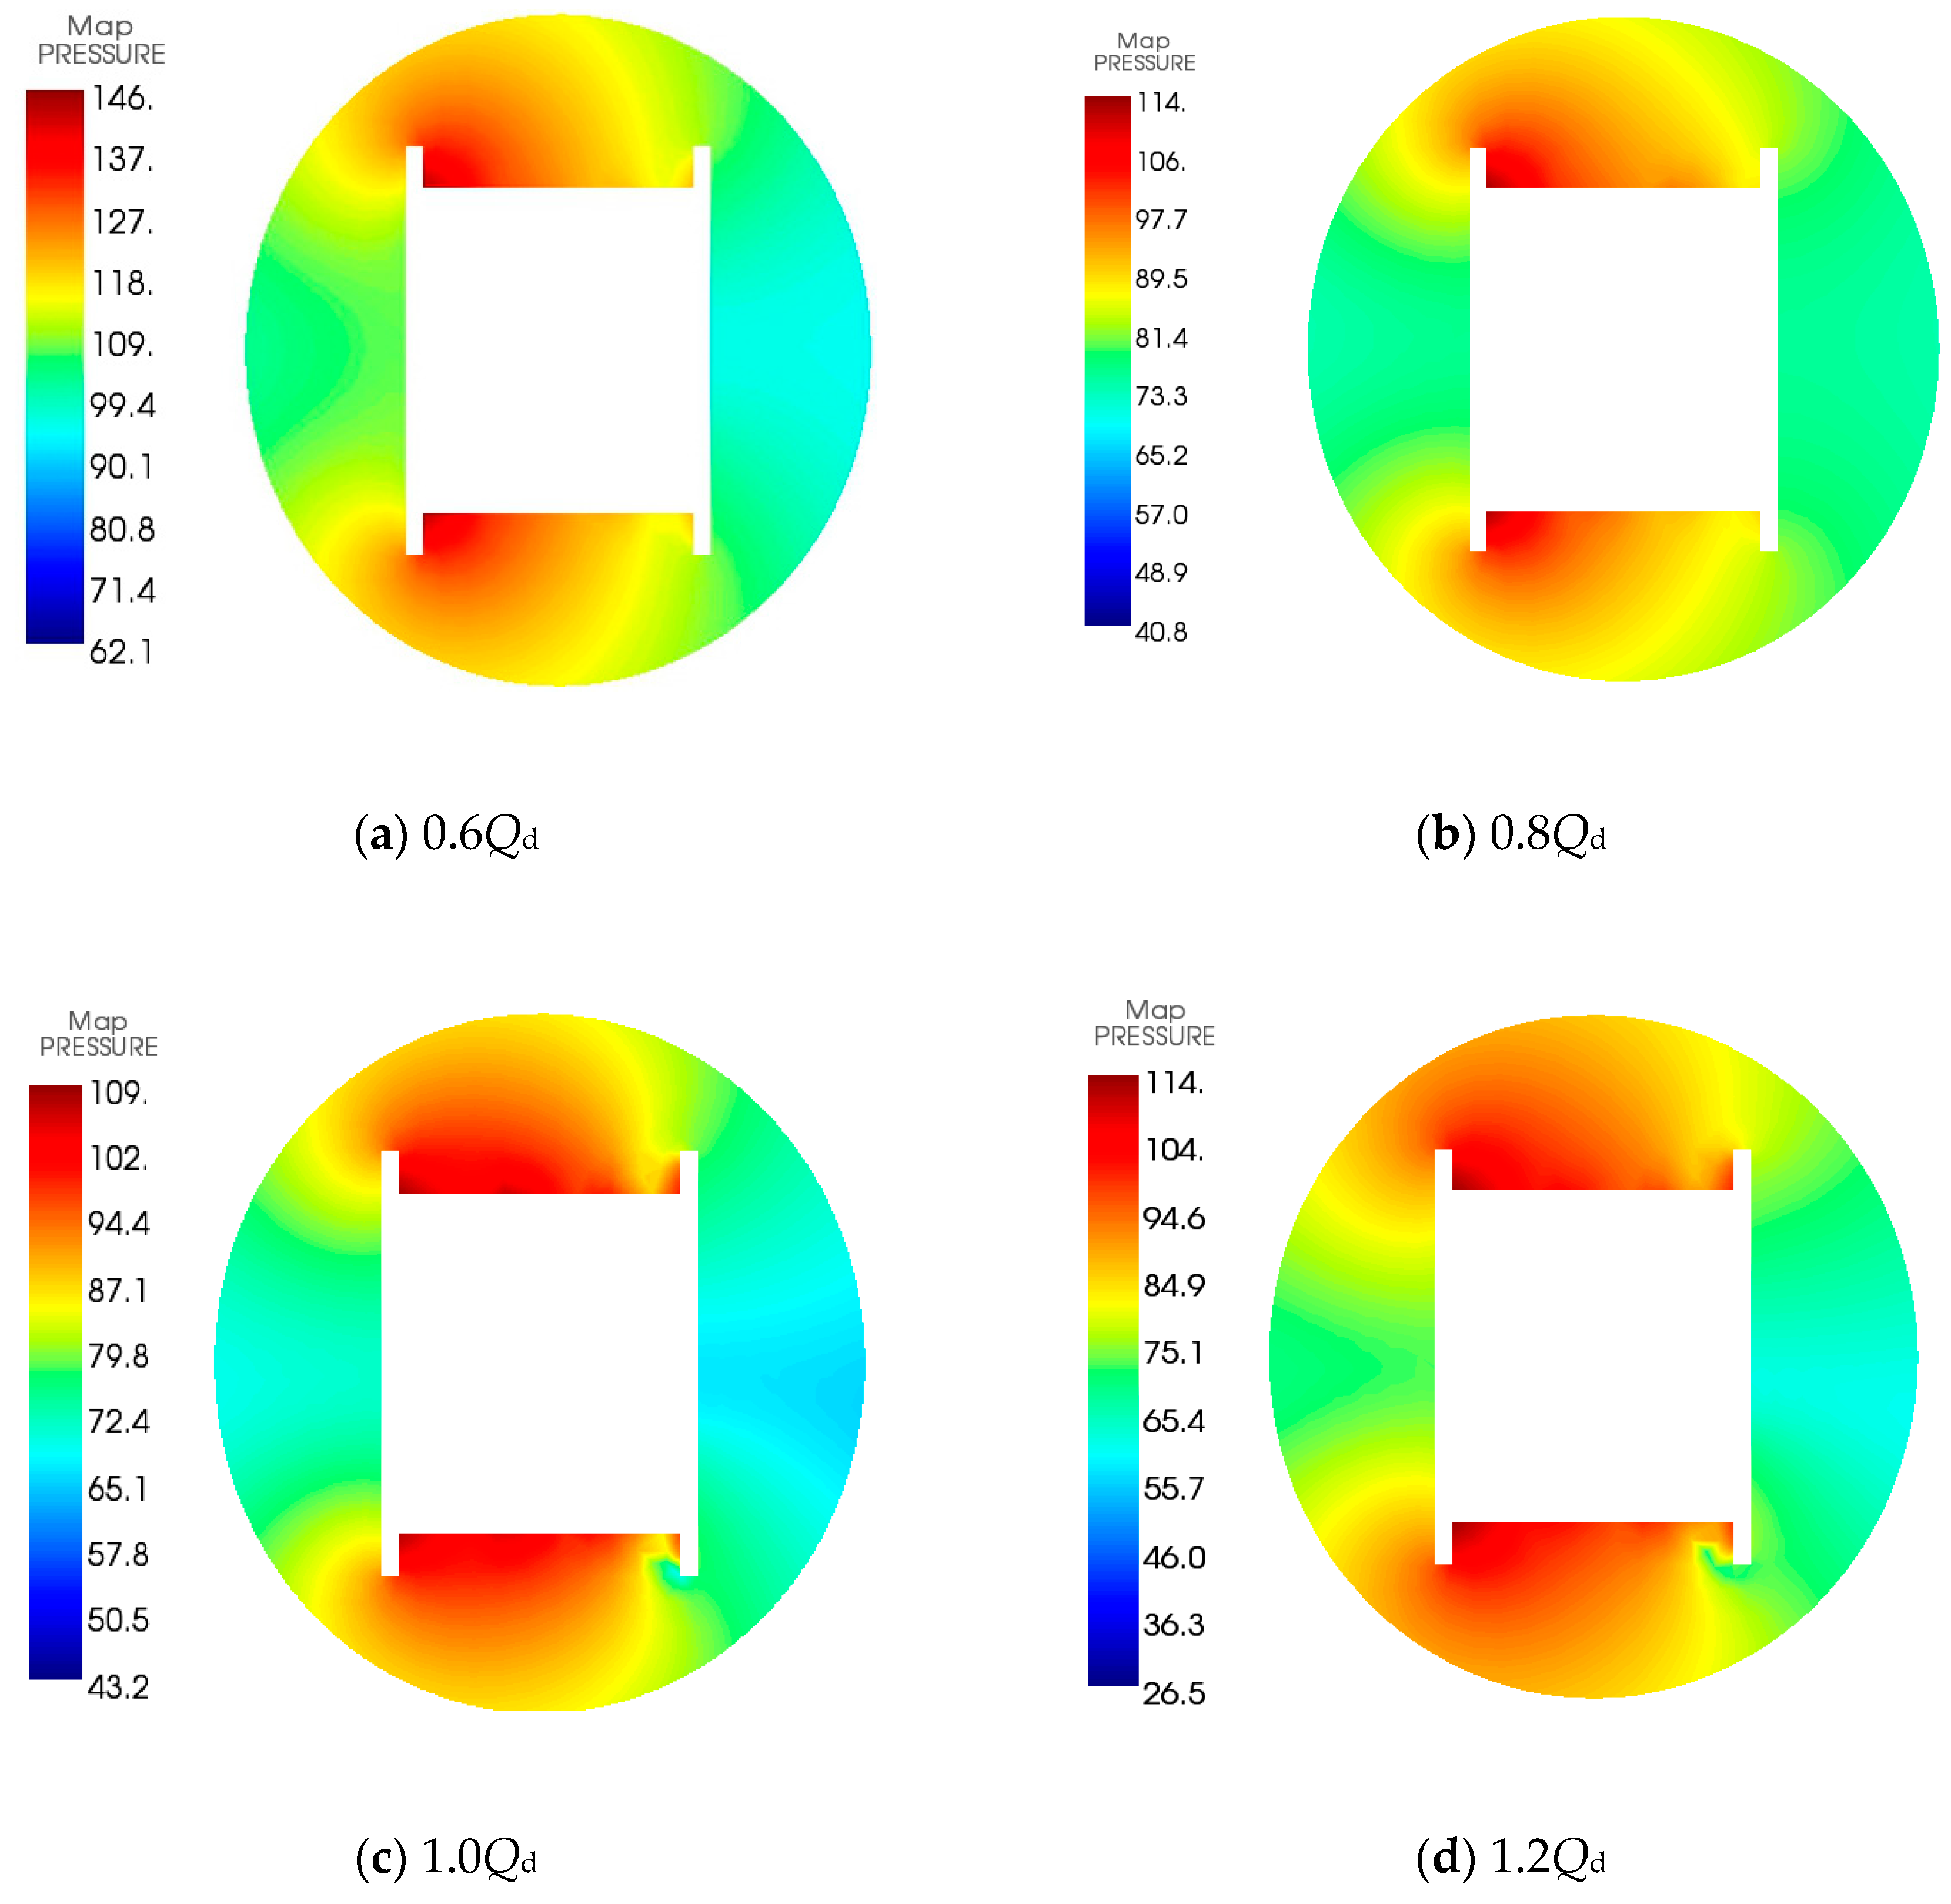
3.2.3. Flow Field Results
3.3. Radiated Noise Analysis
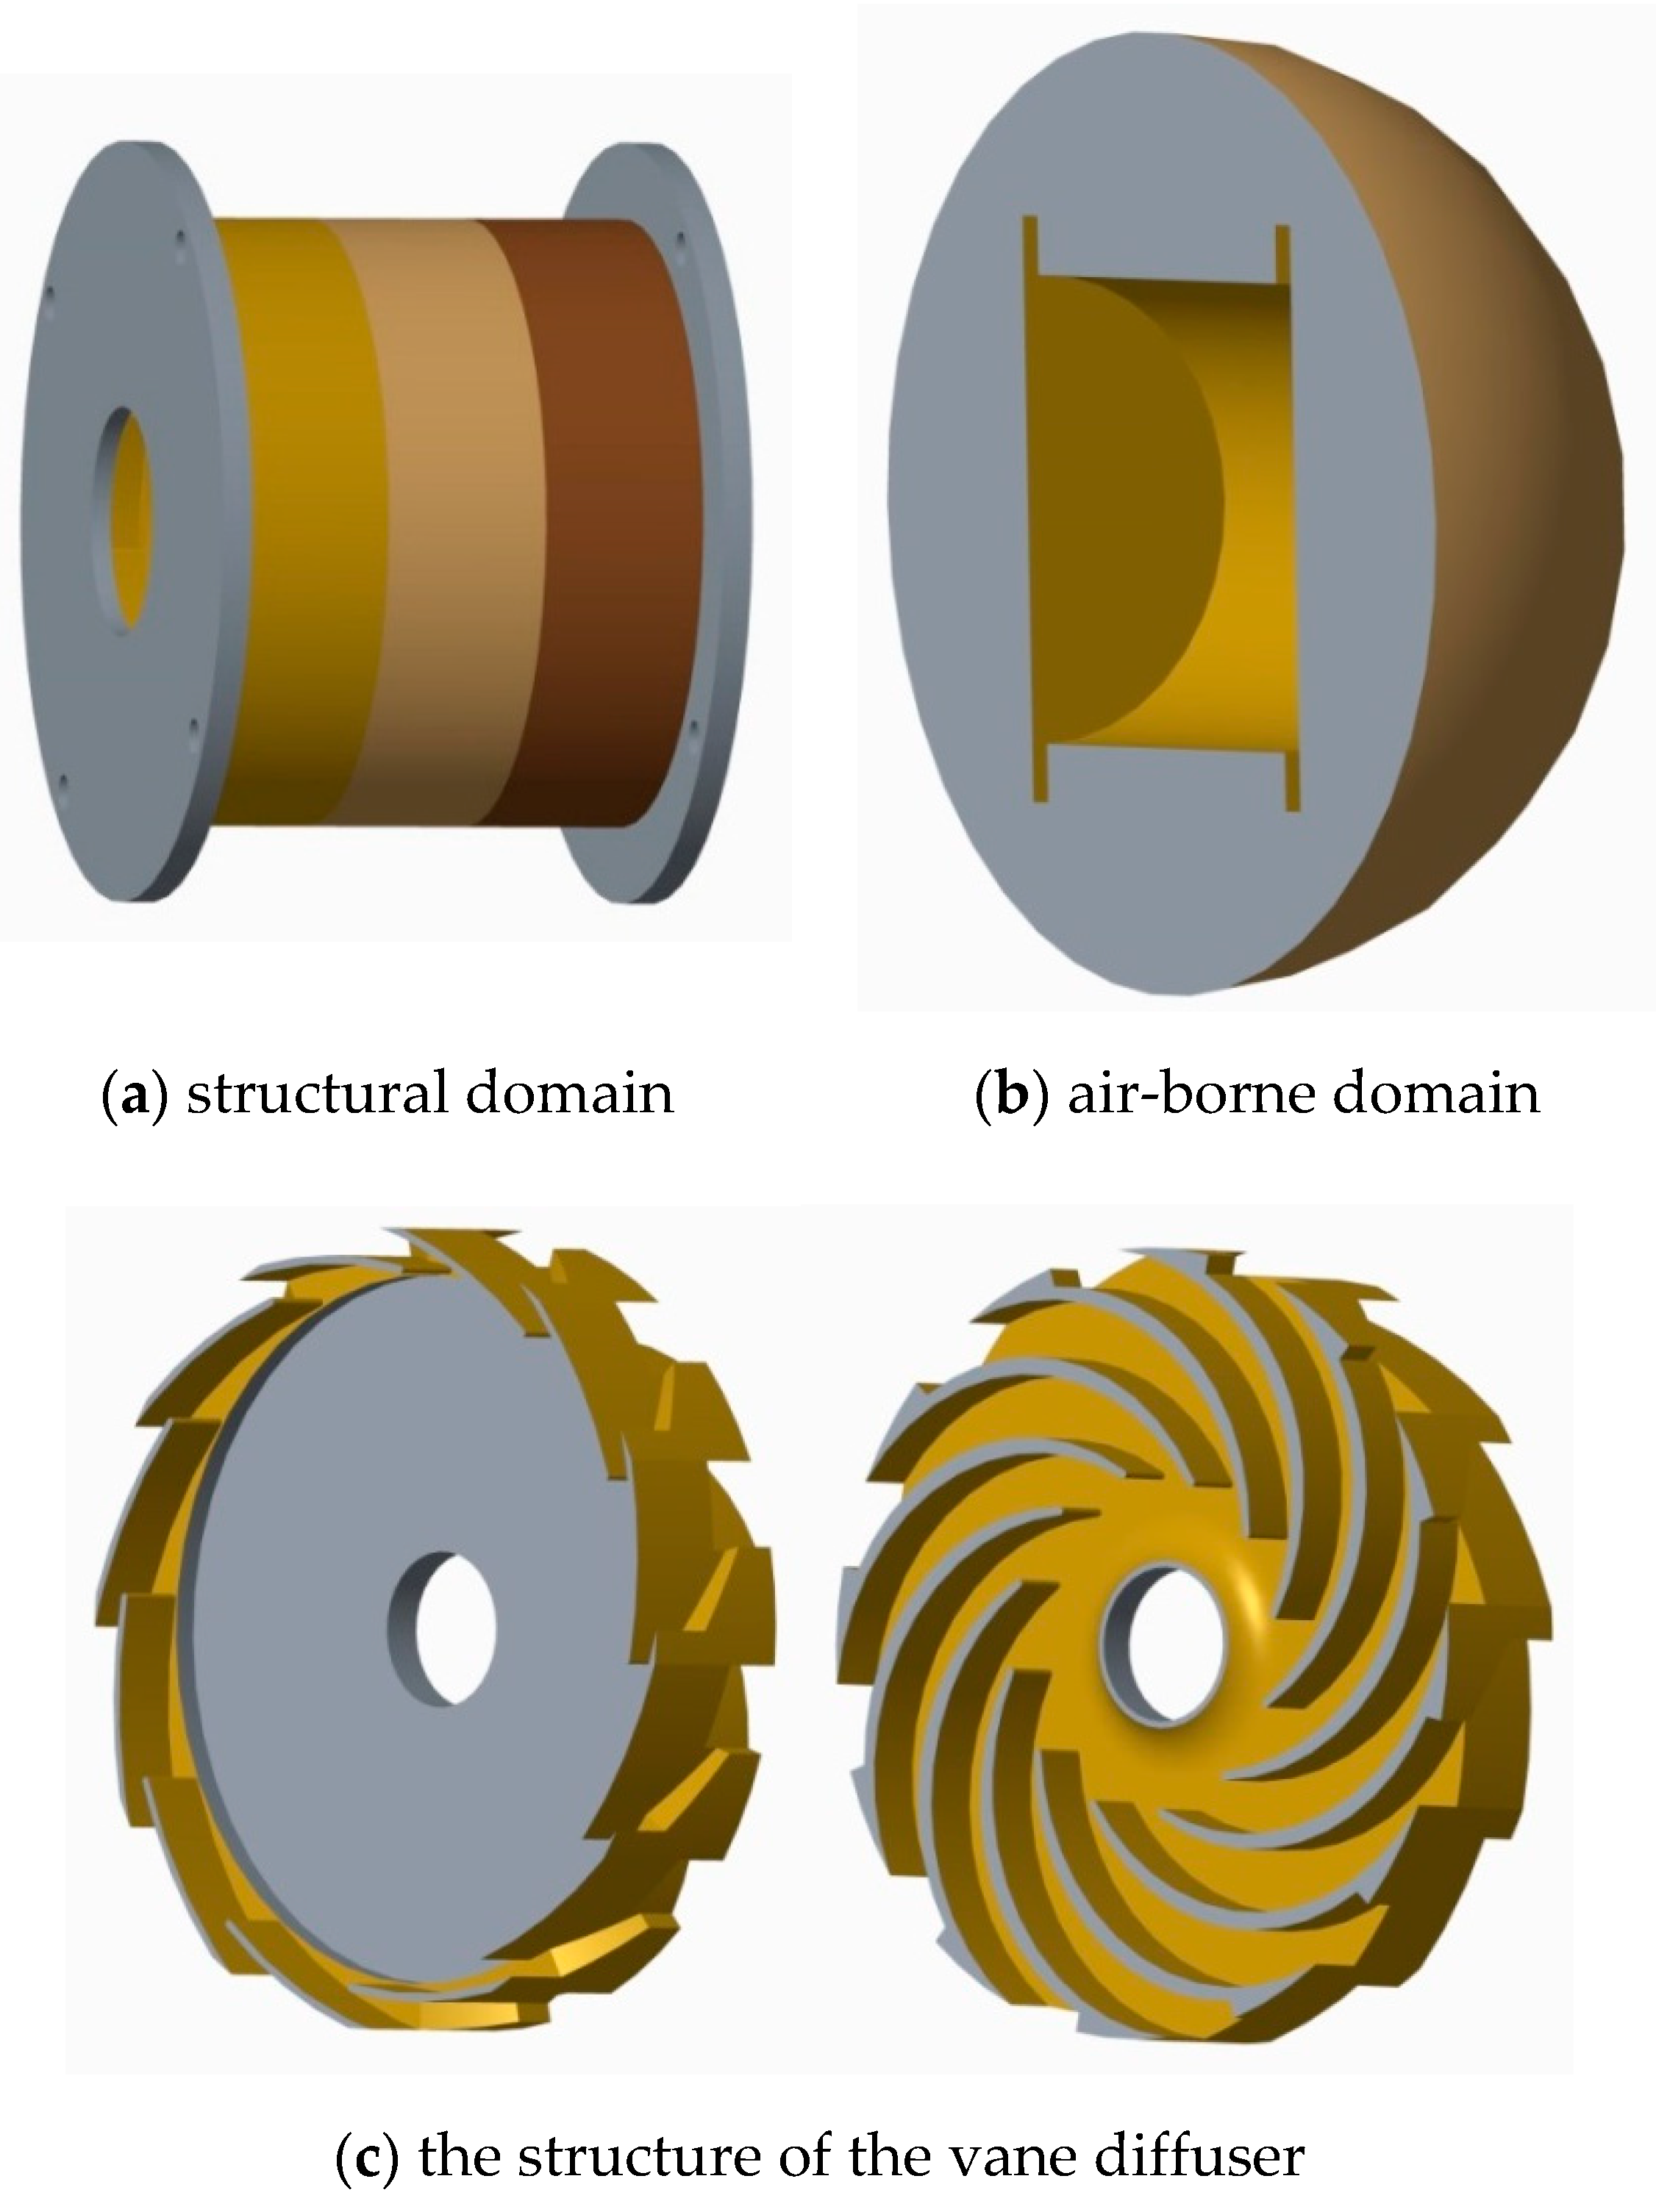
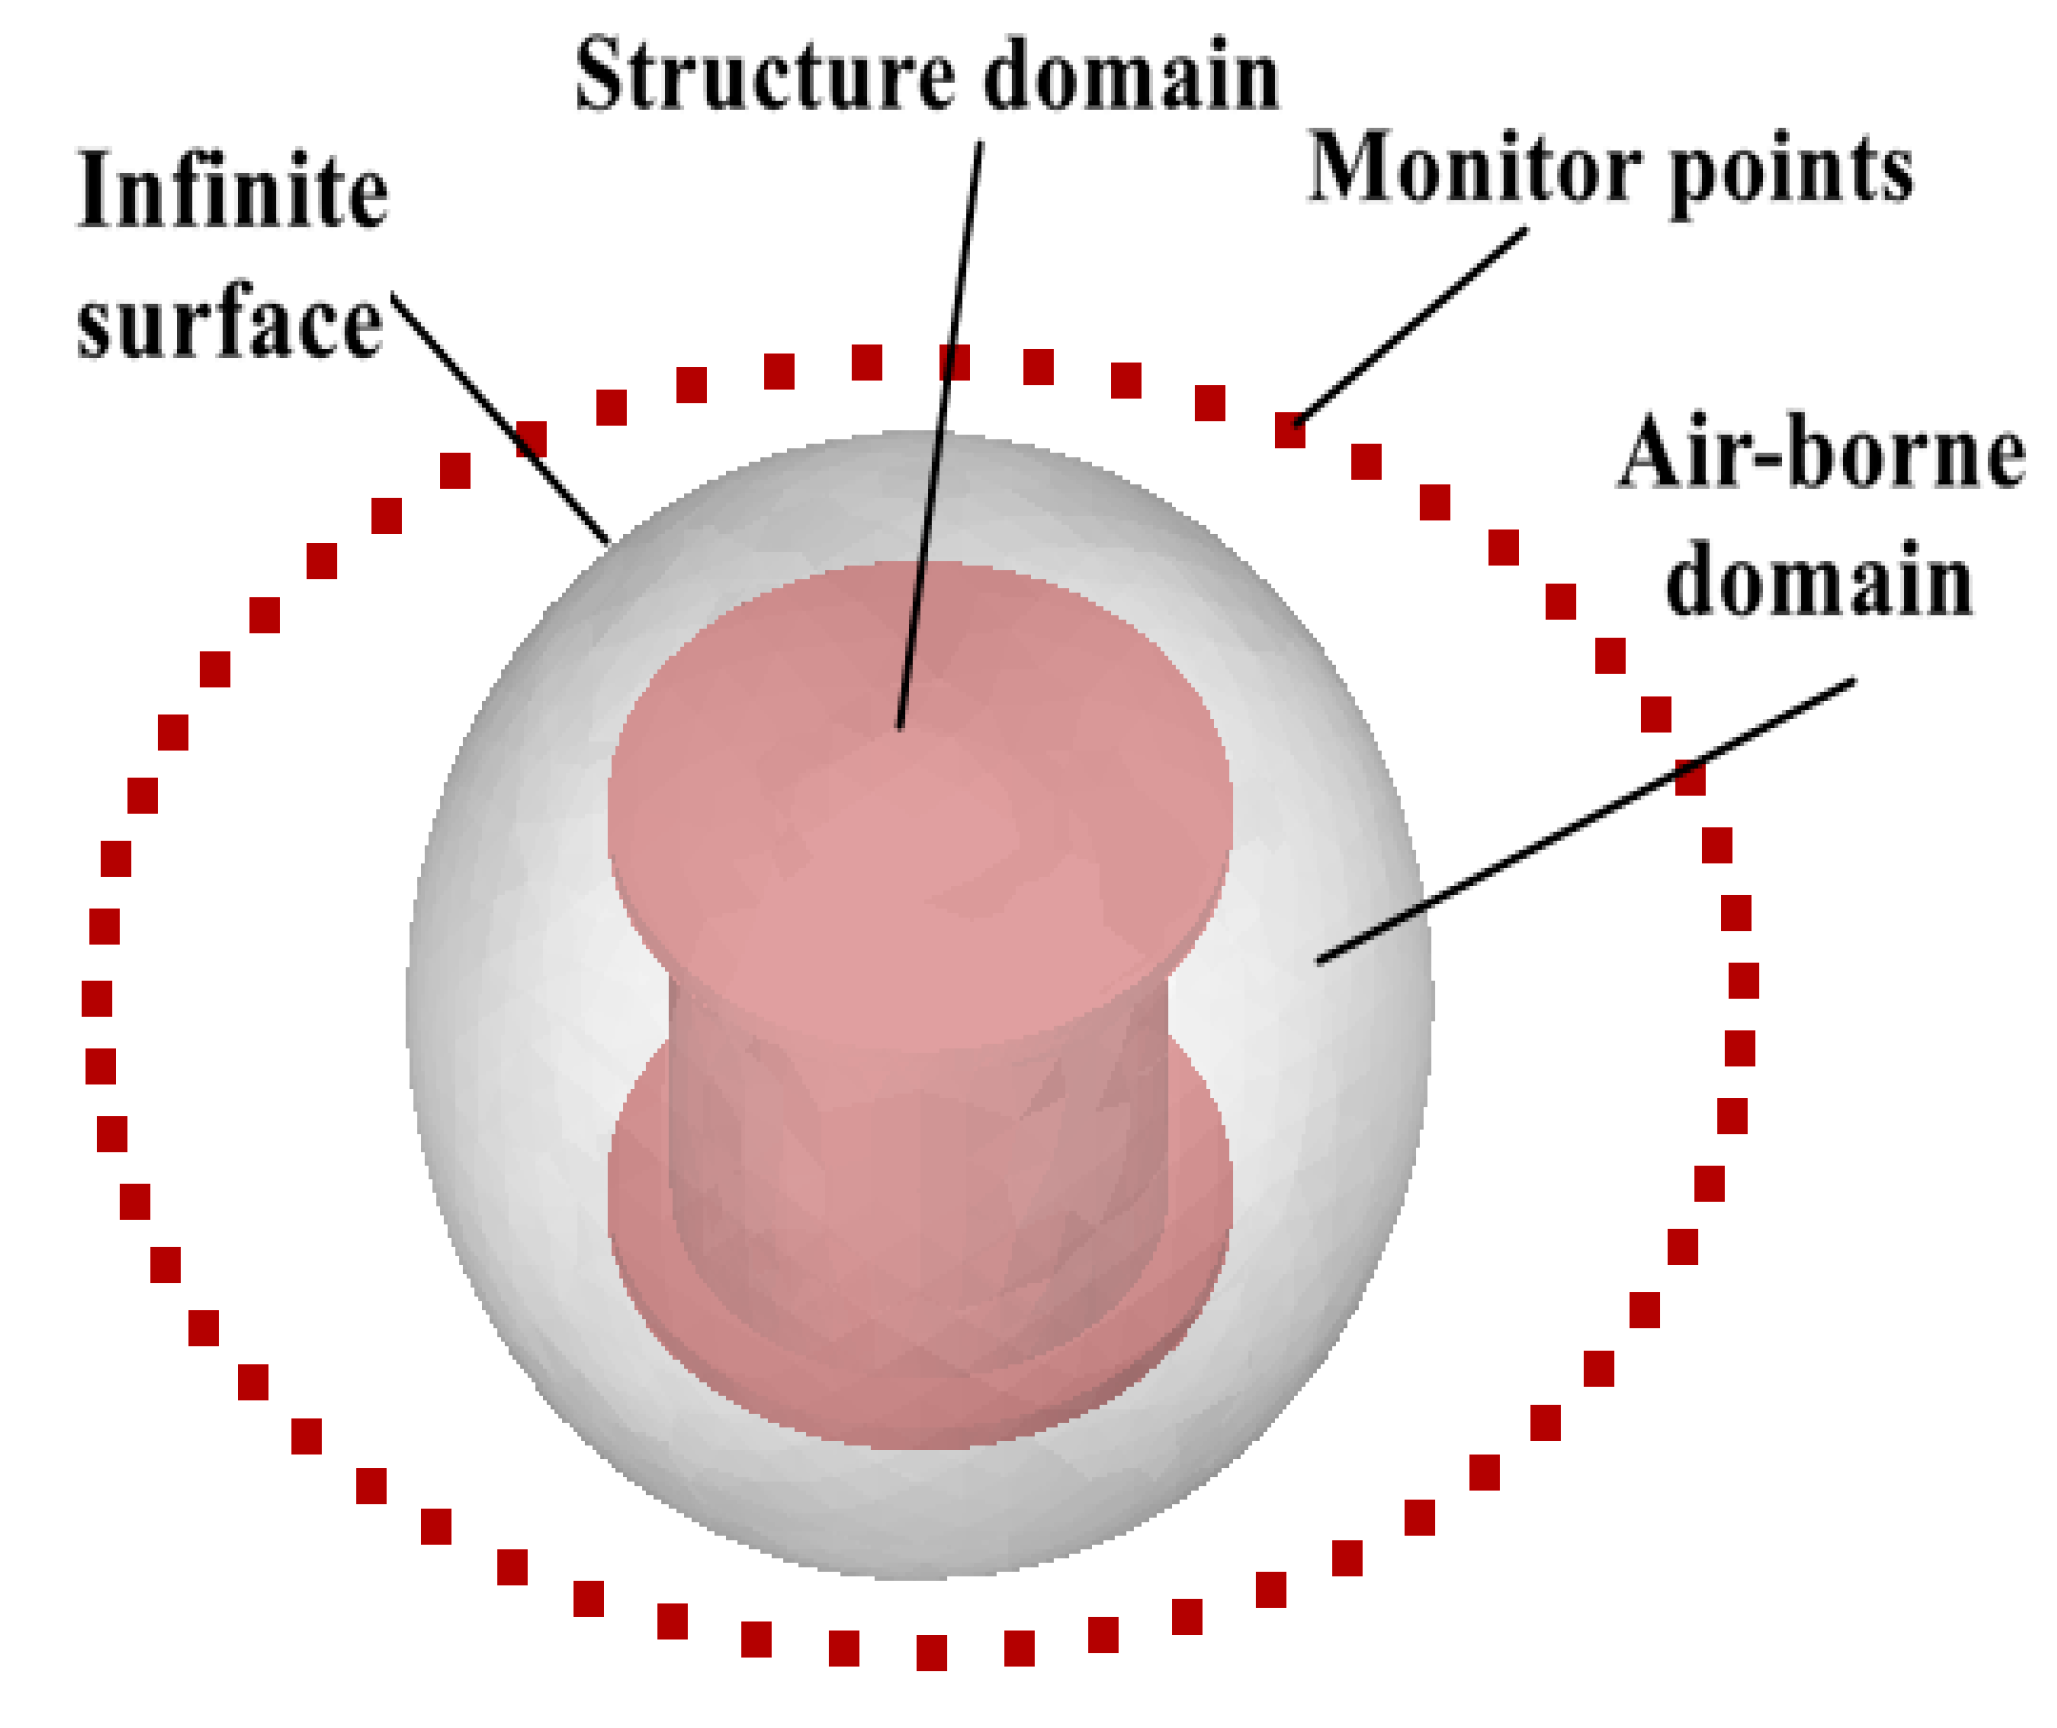
3.3.1. Computational Domain
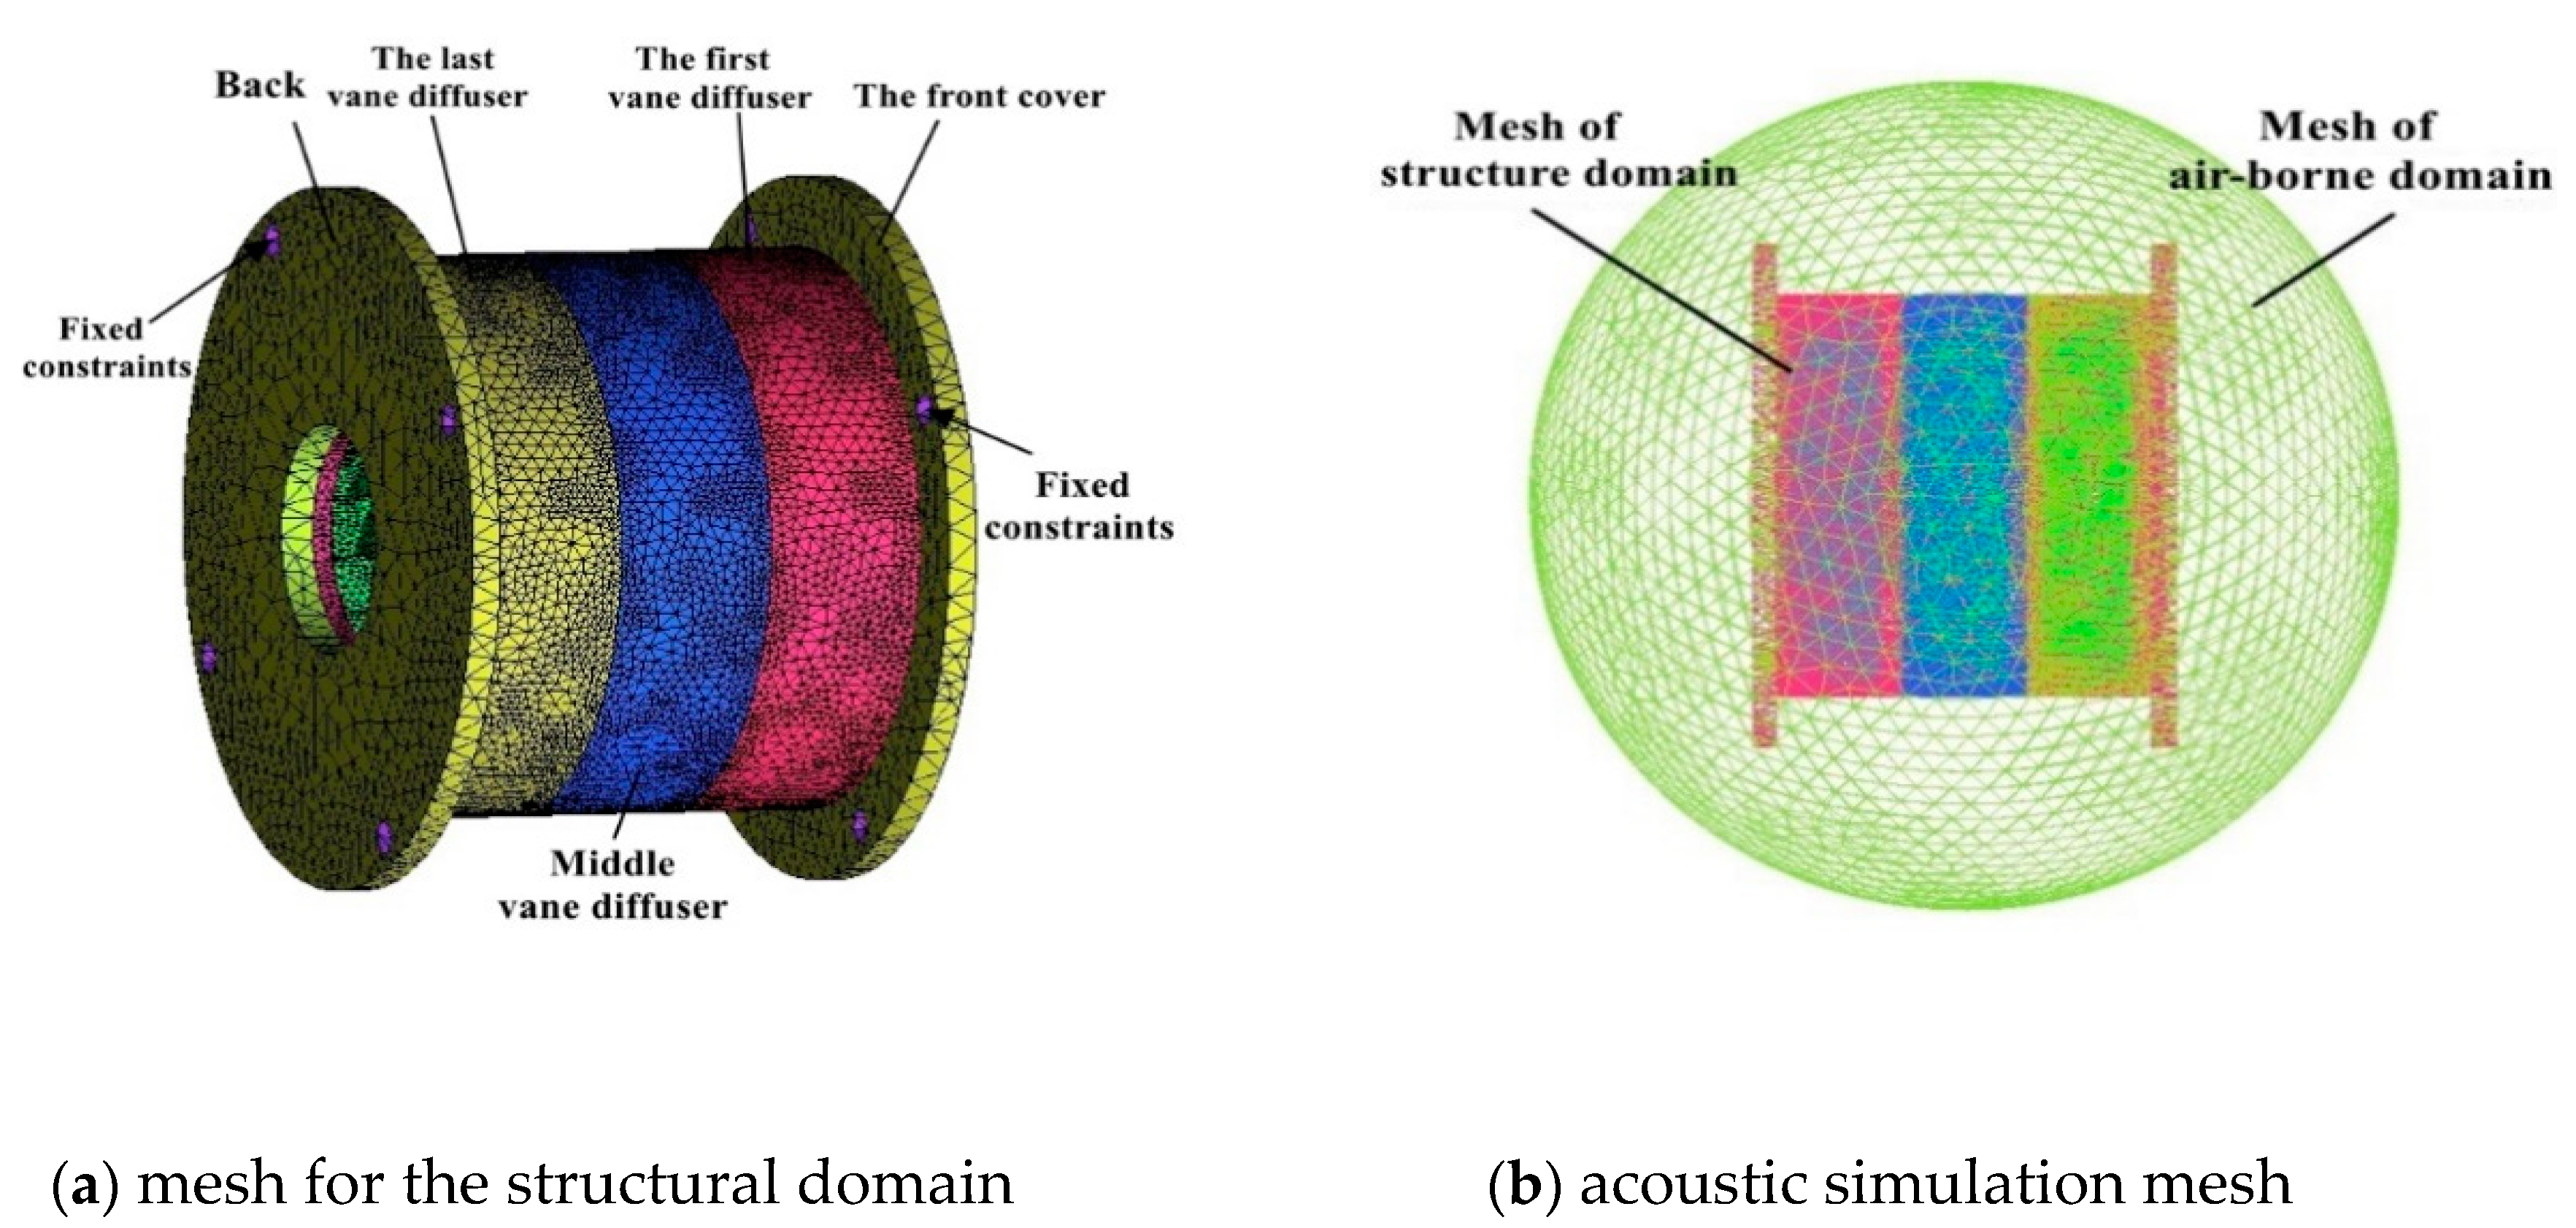
3.3.2. Mesh Generation and Boundary Condition
3.3.3. Acoustic Field Results
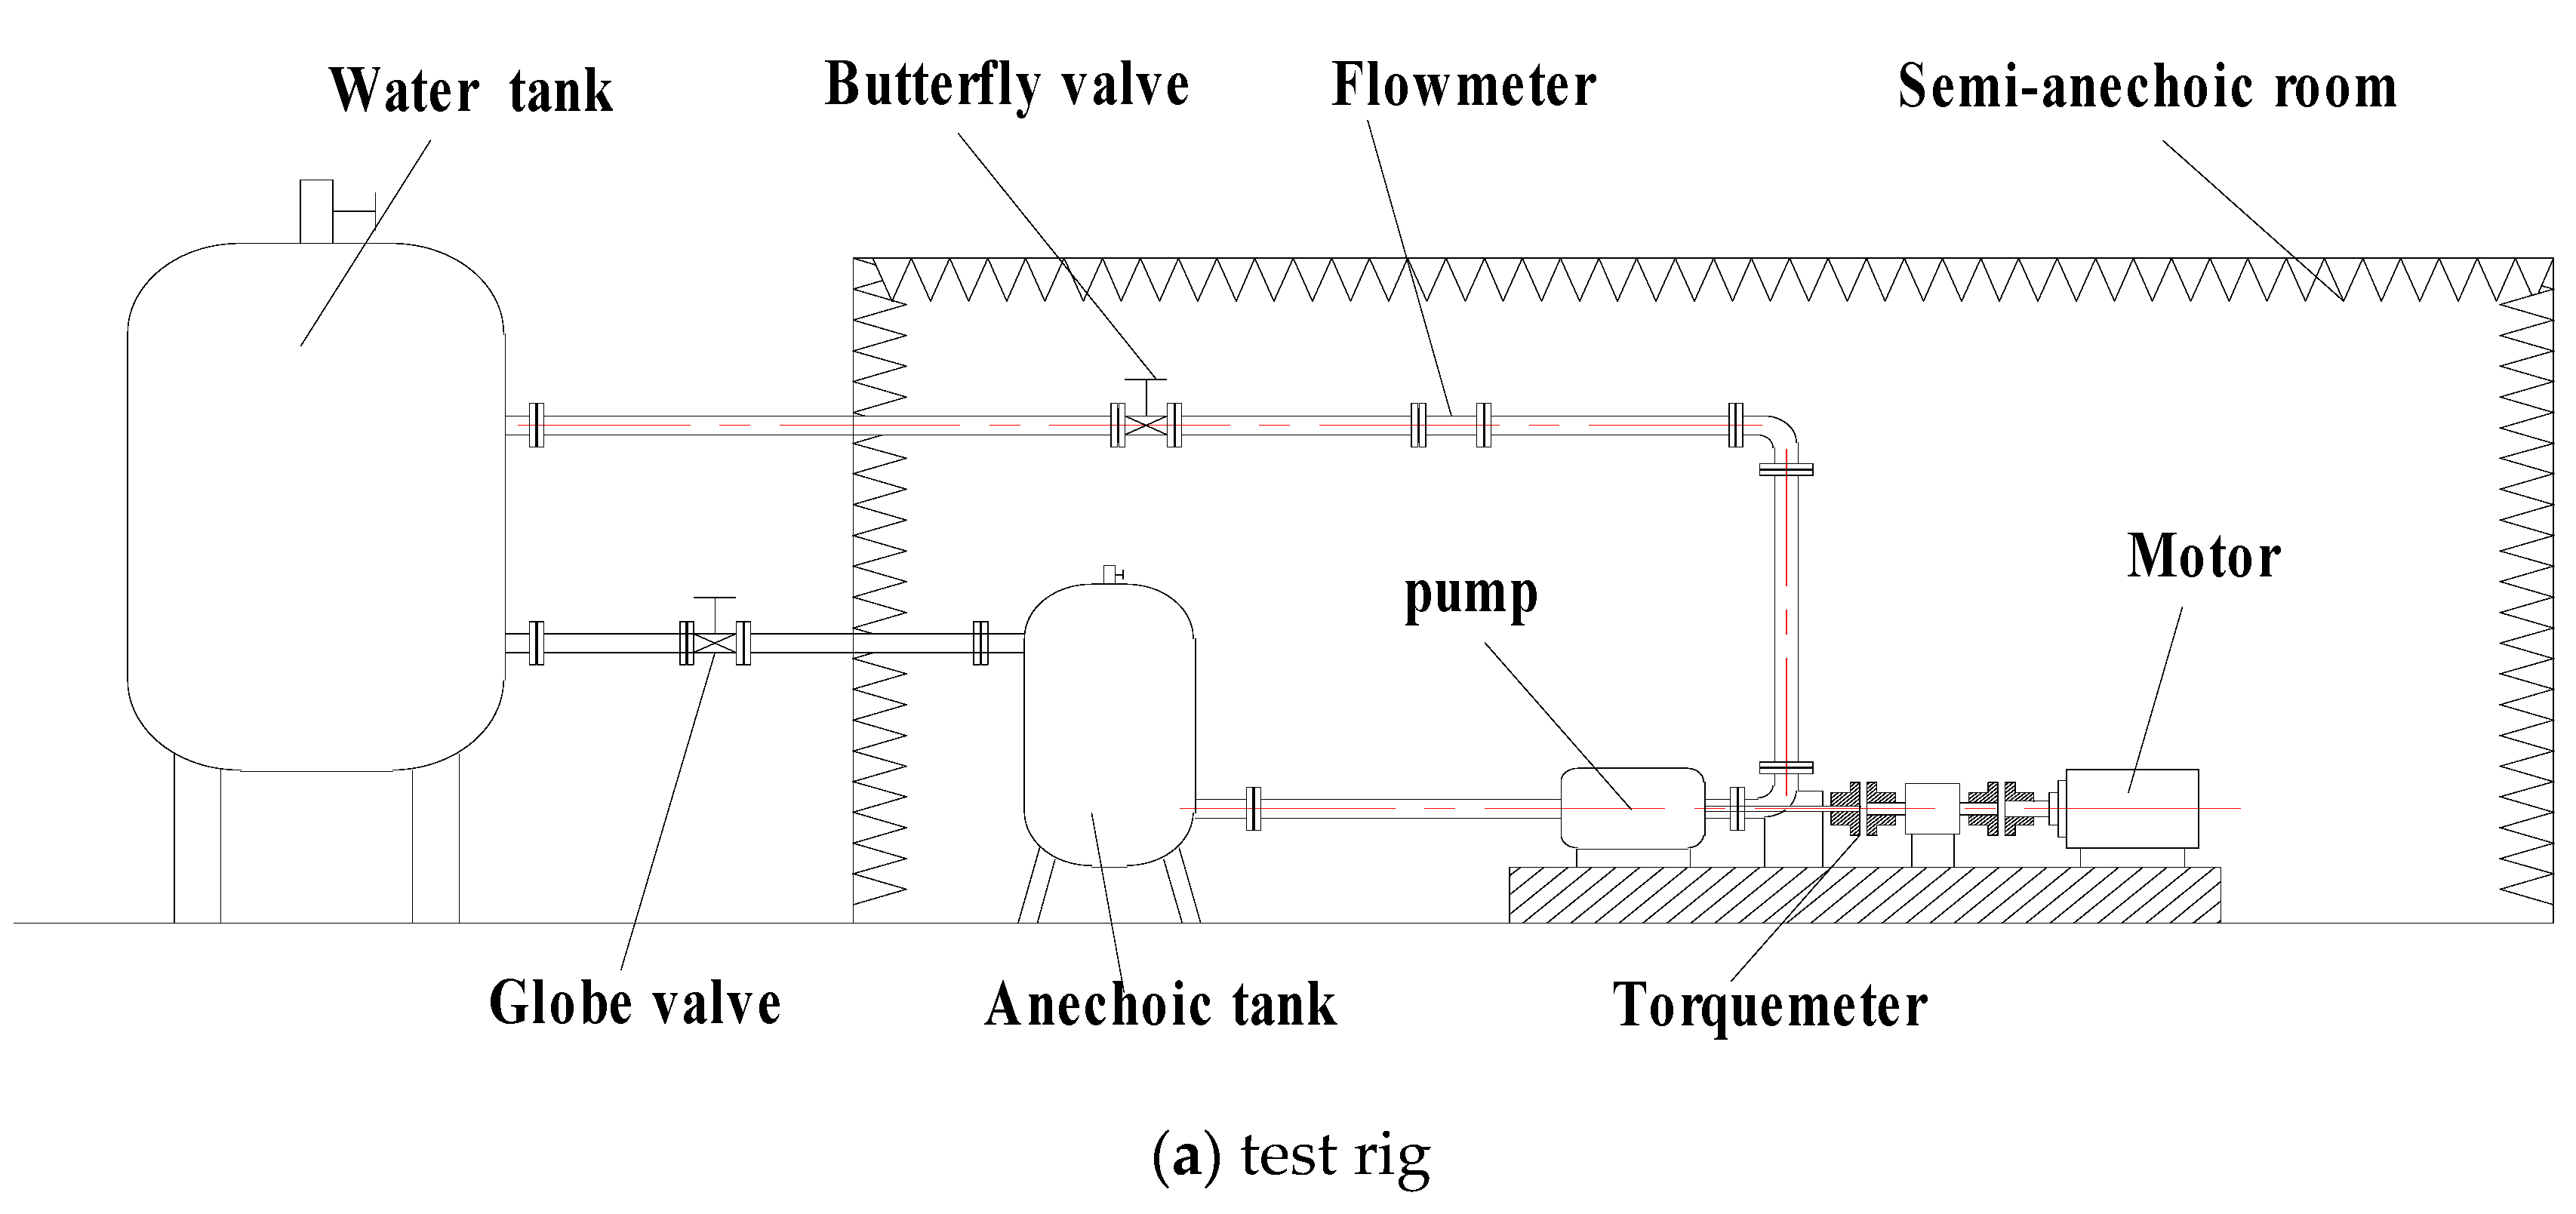
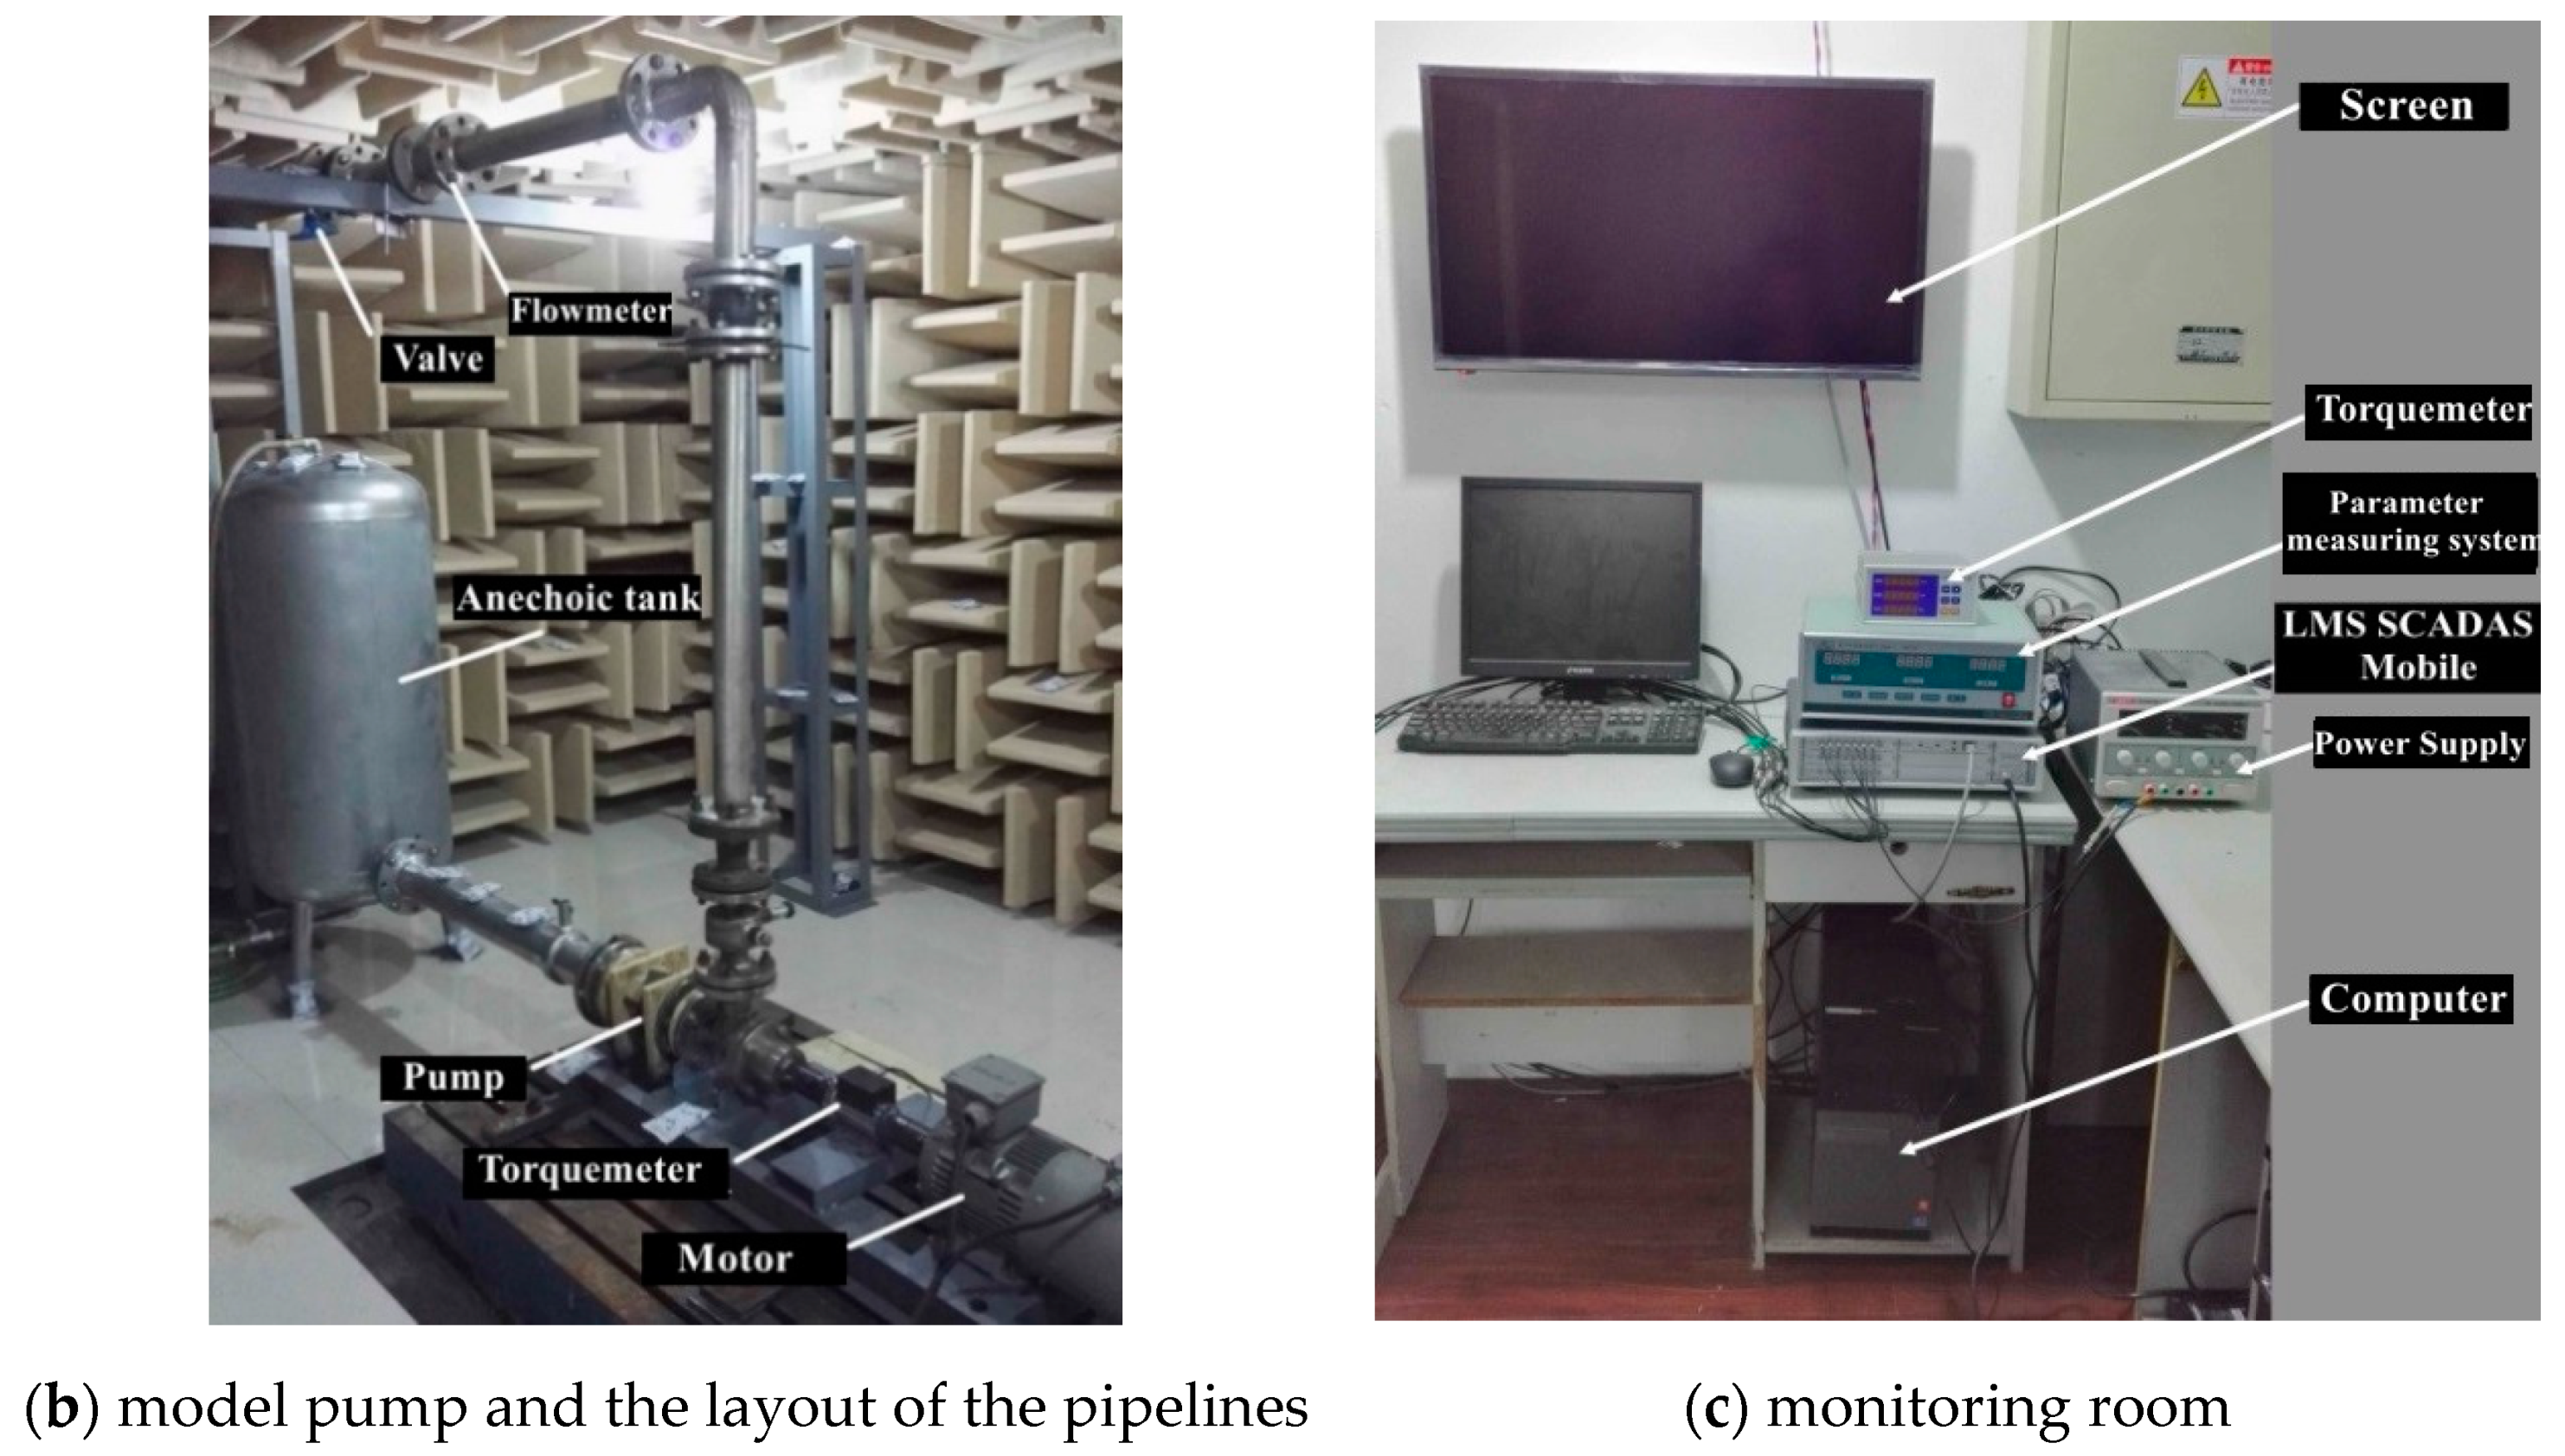
4. Experimental Verification
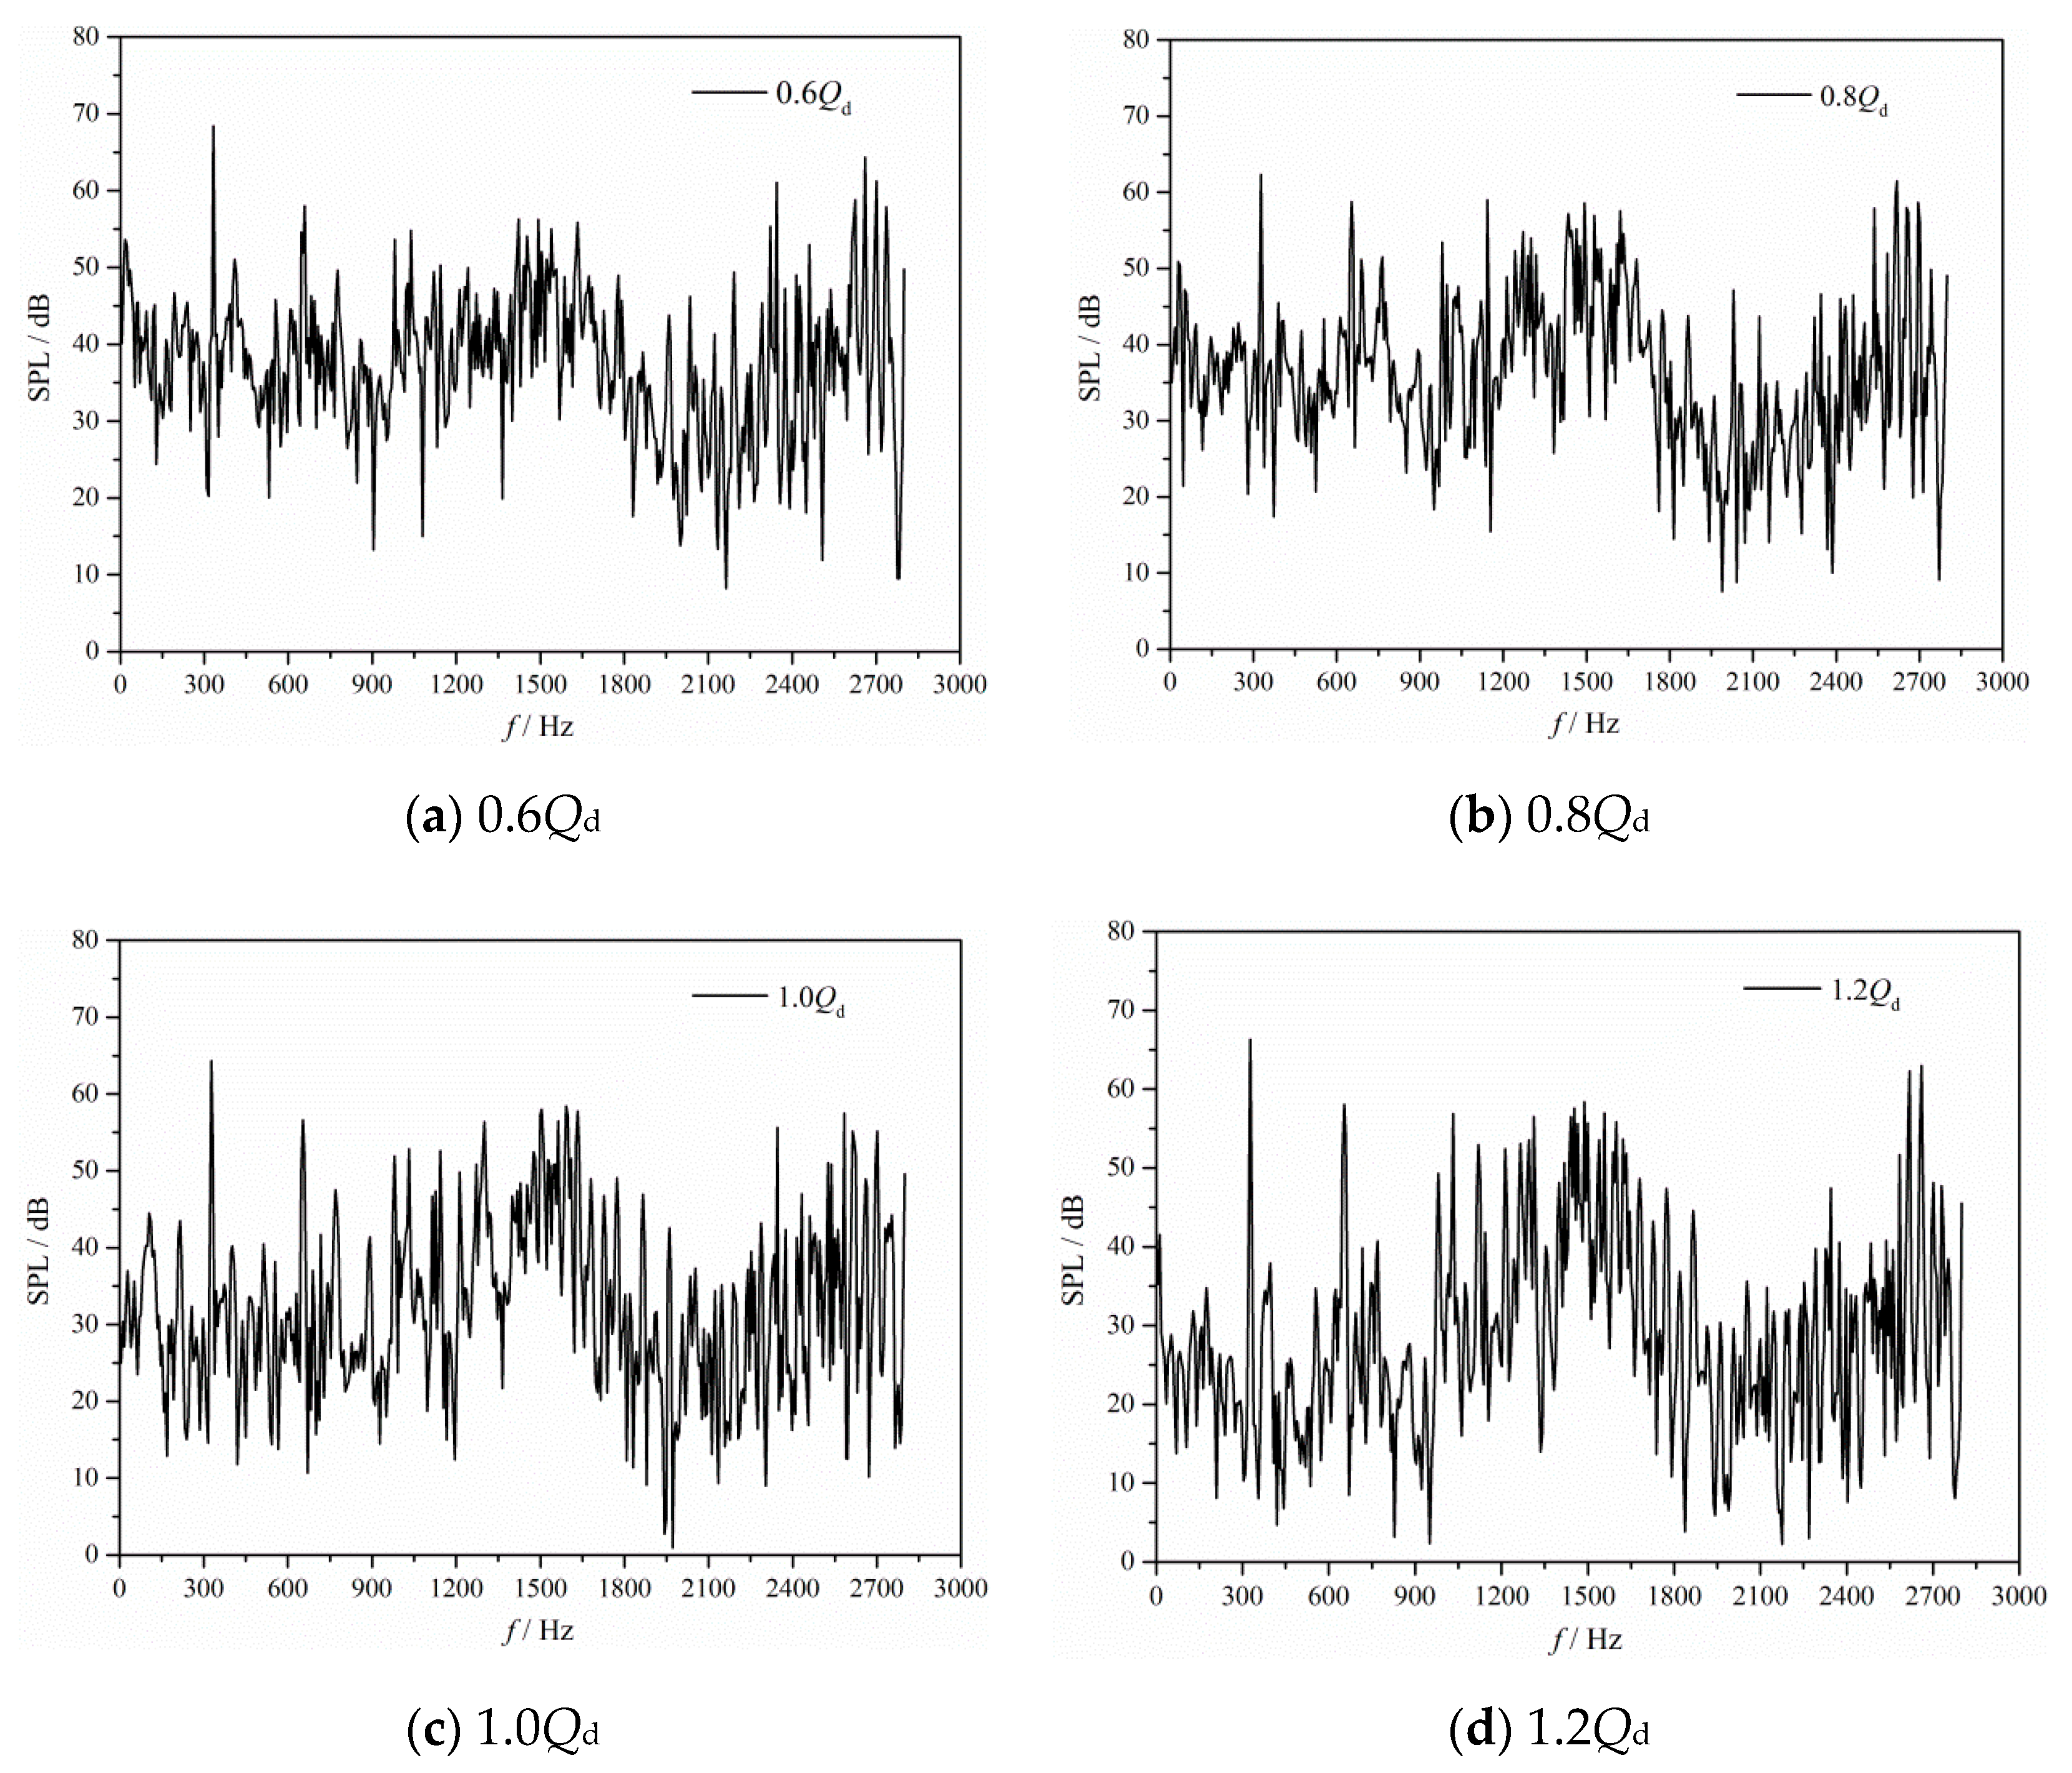
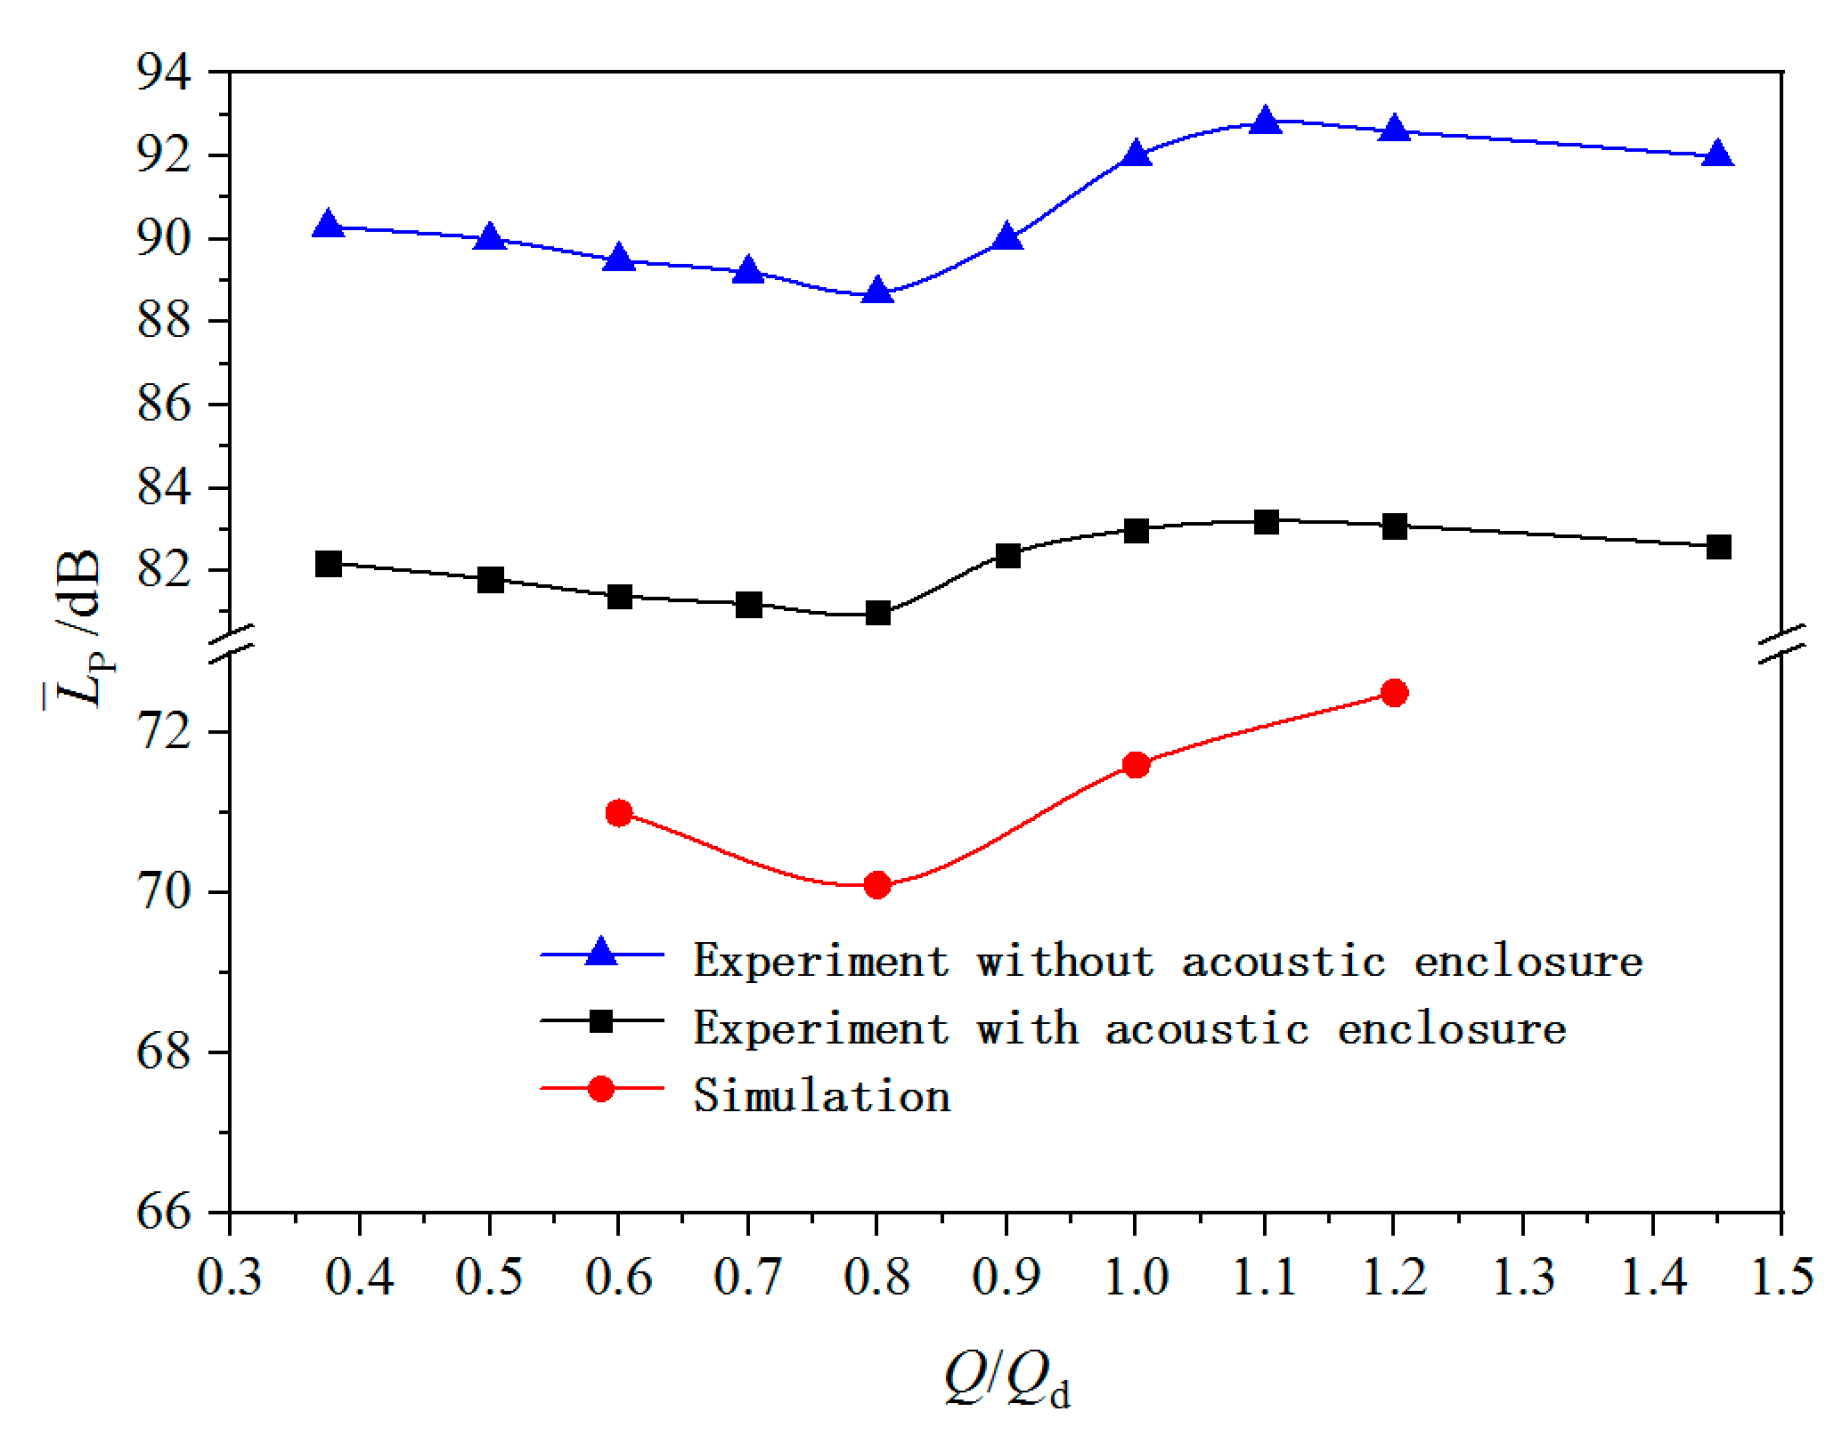
4.1. Radiated Noise at the Different Flow Rate
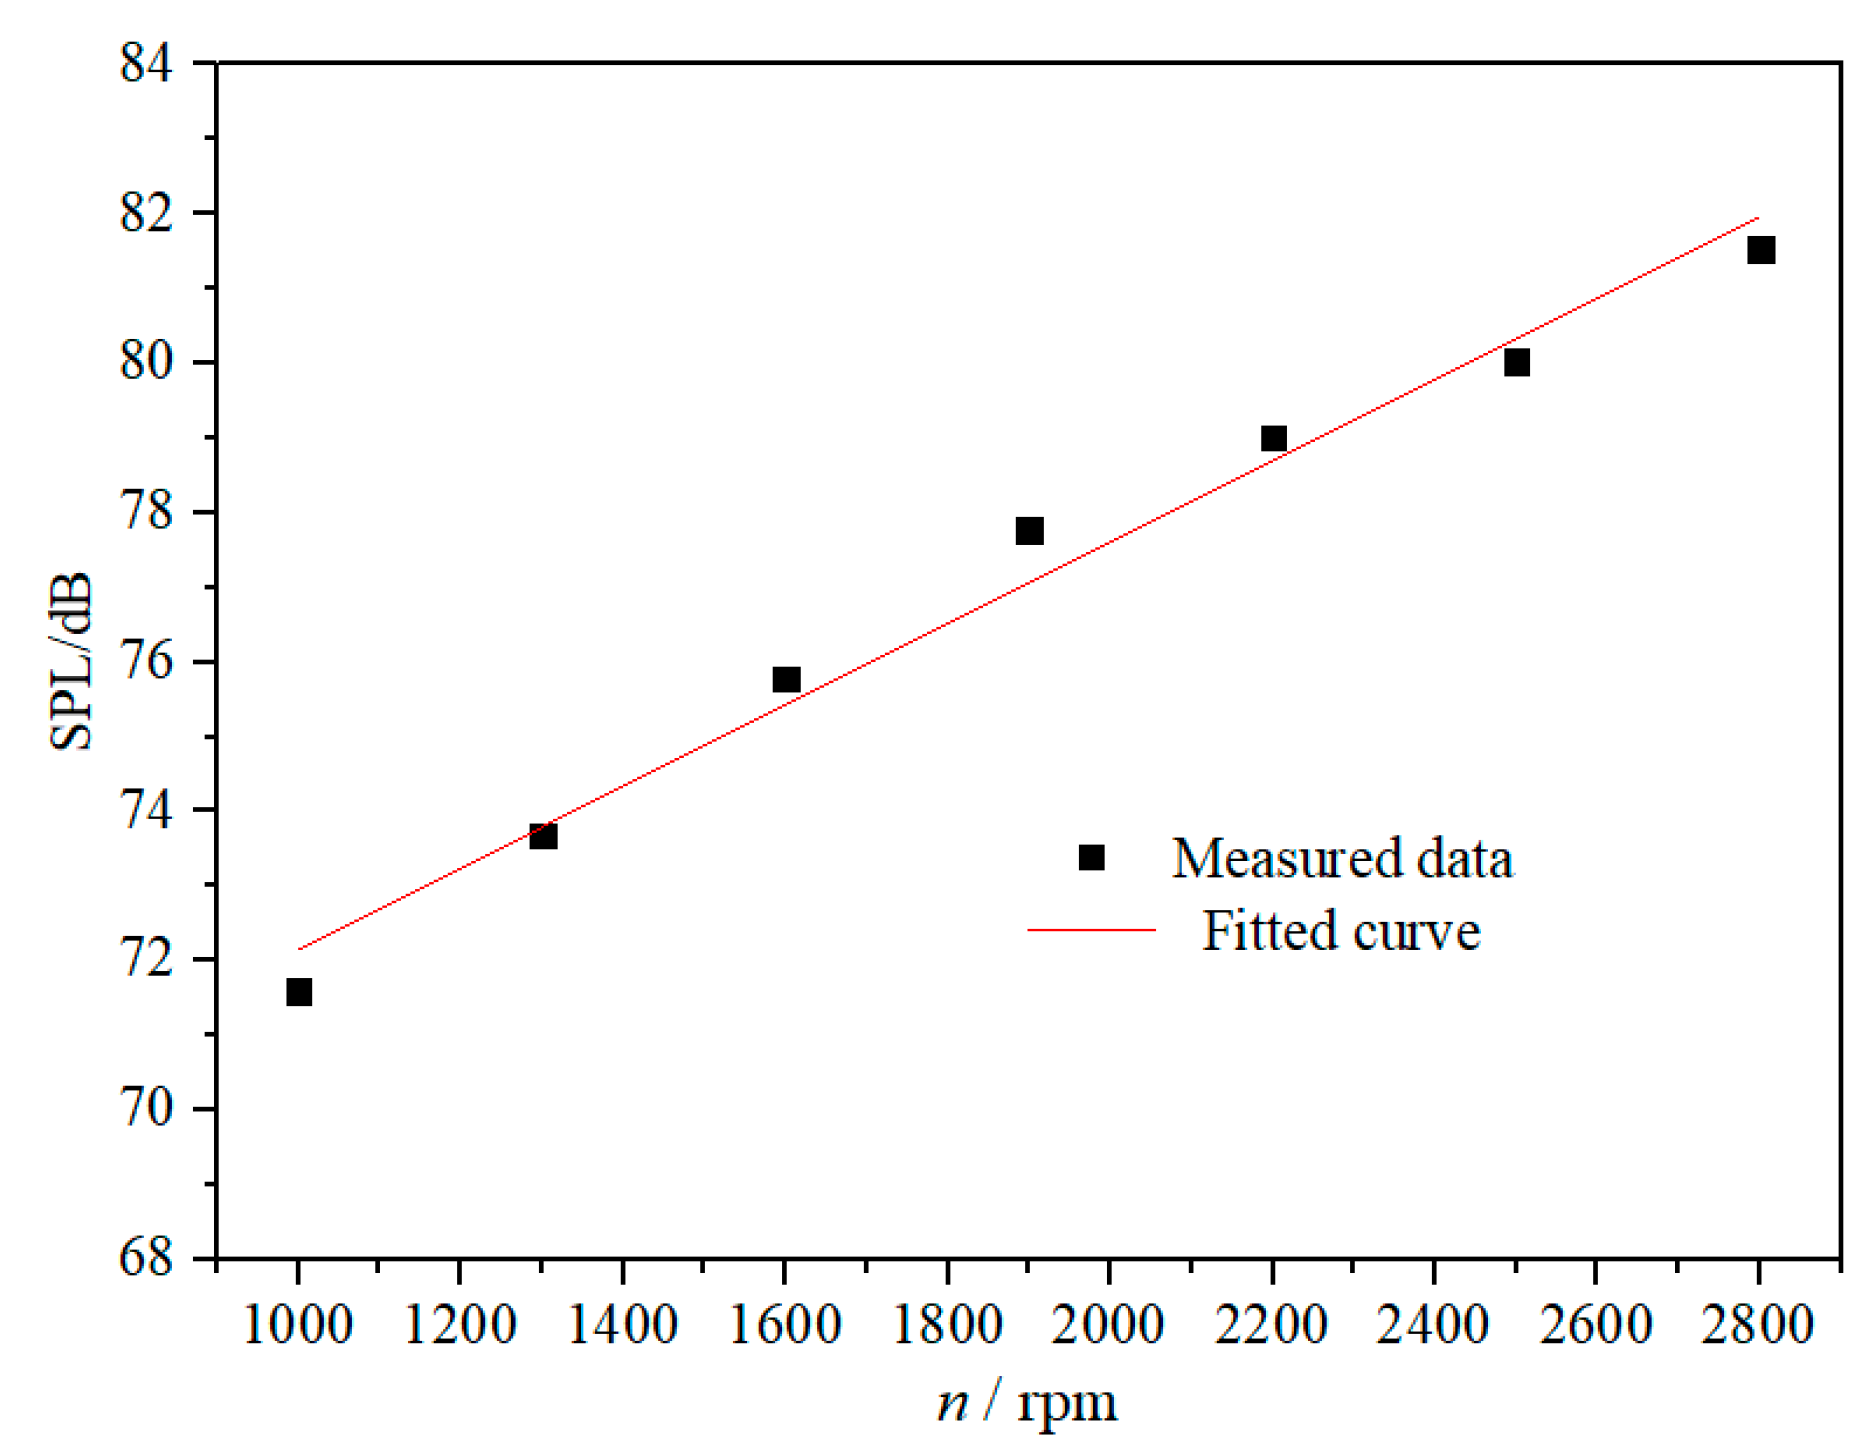
4.2. Radiated Noise at the Different Rotational Speed
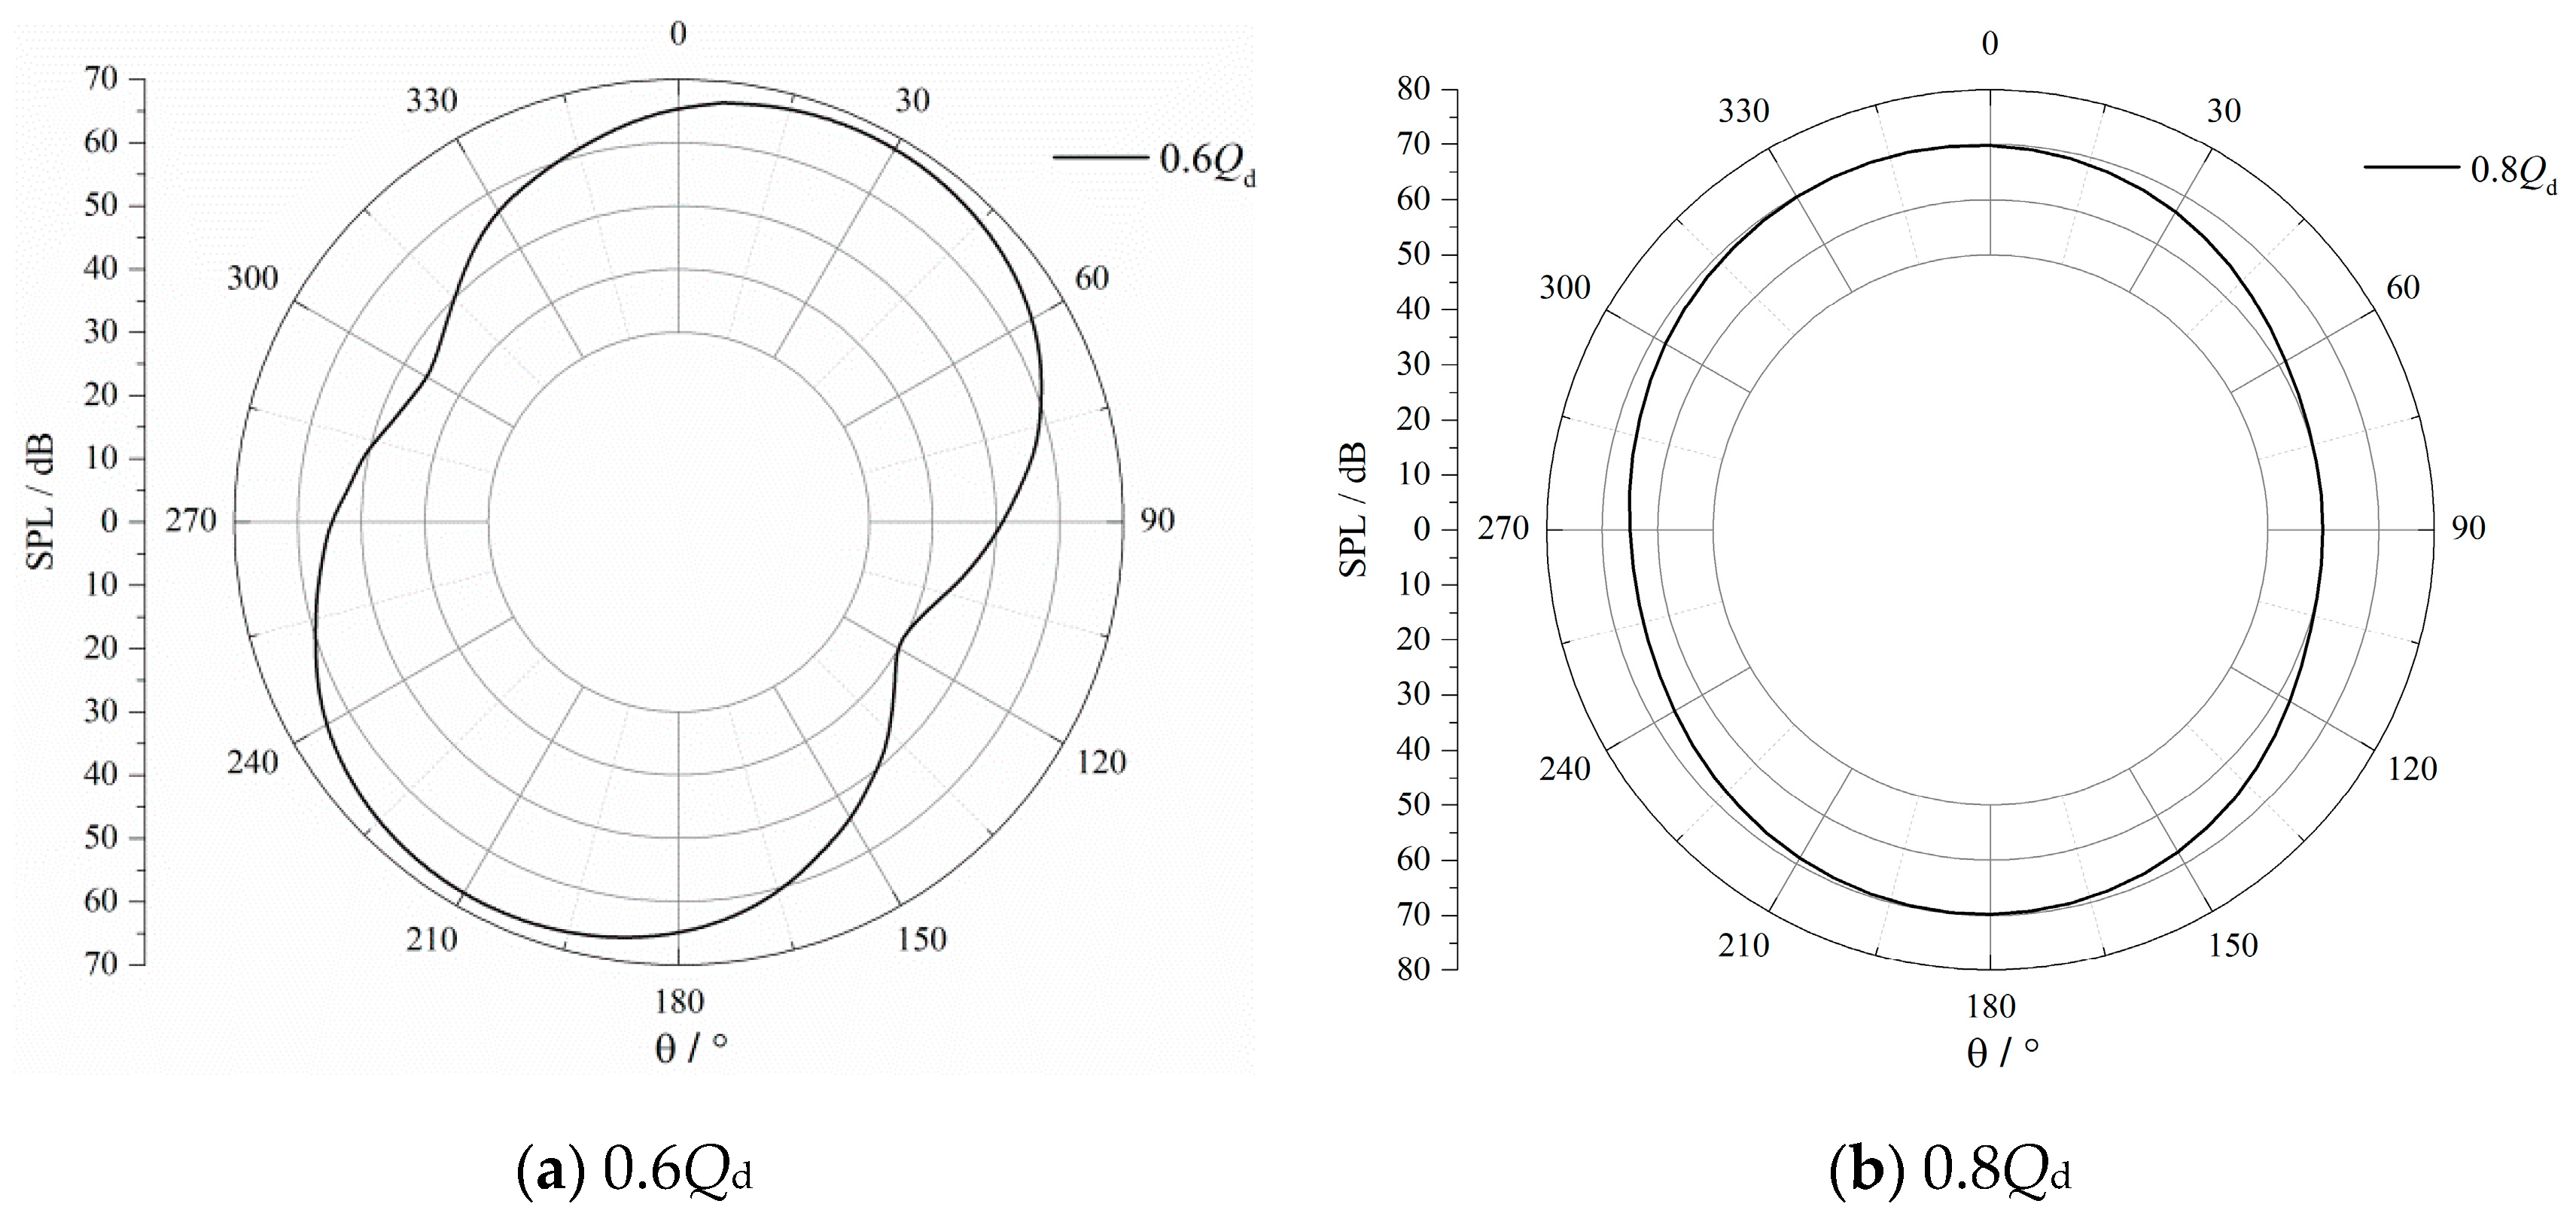
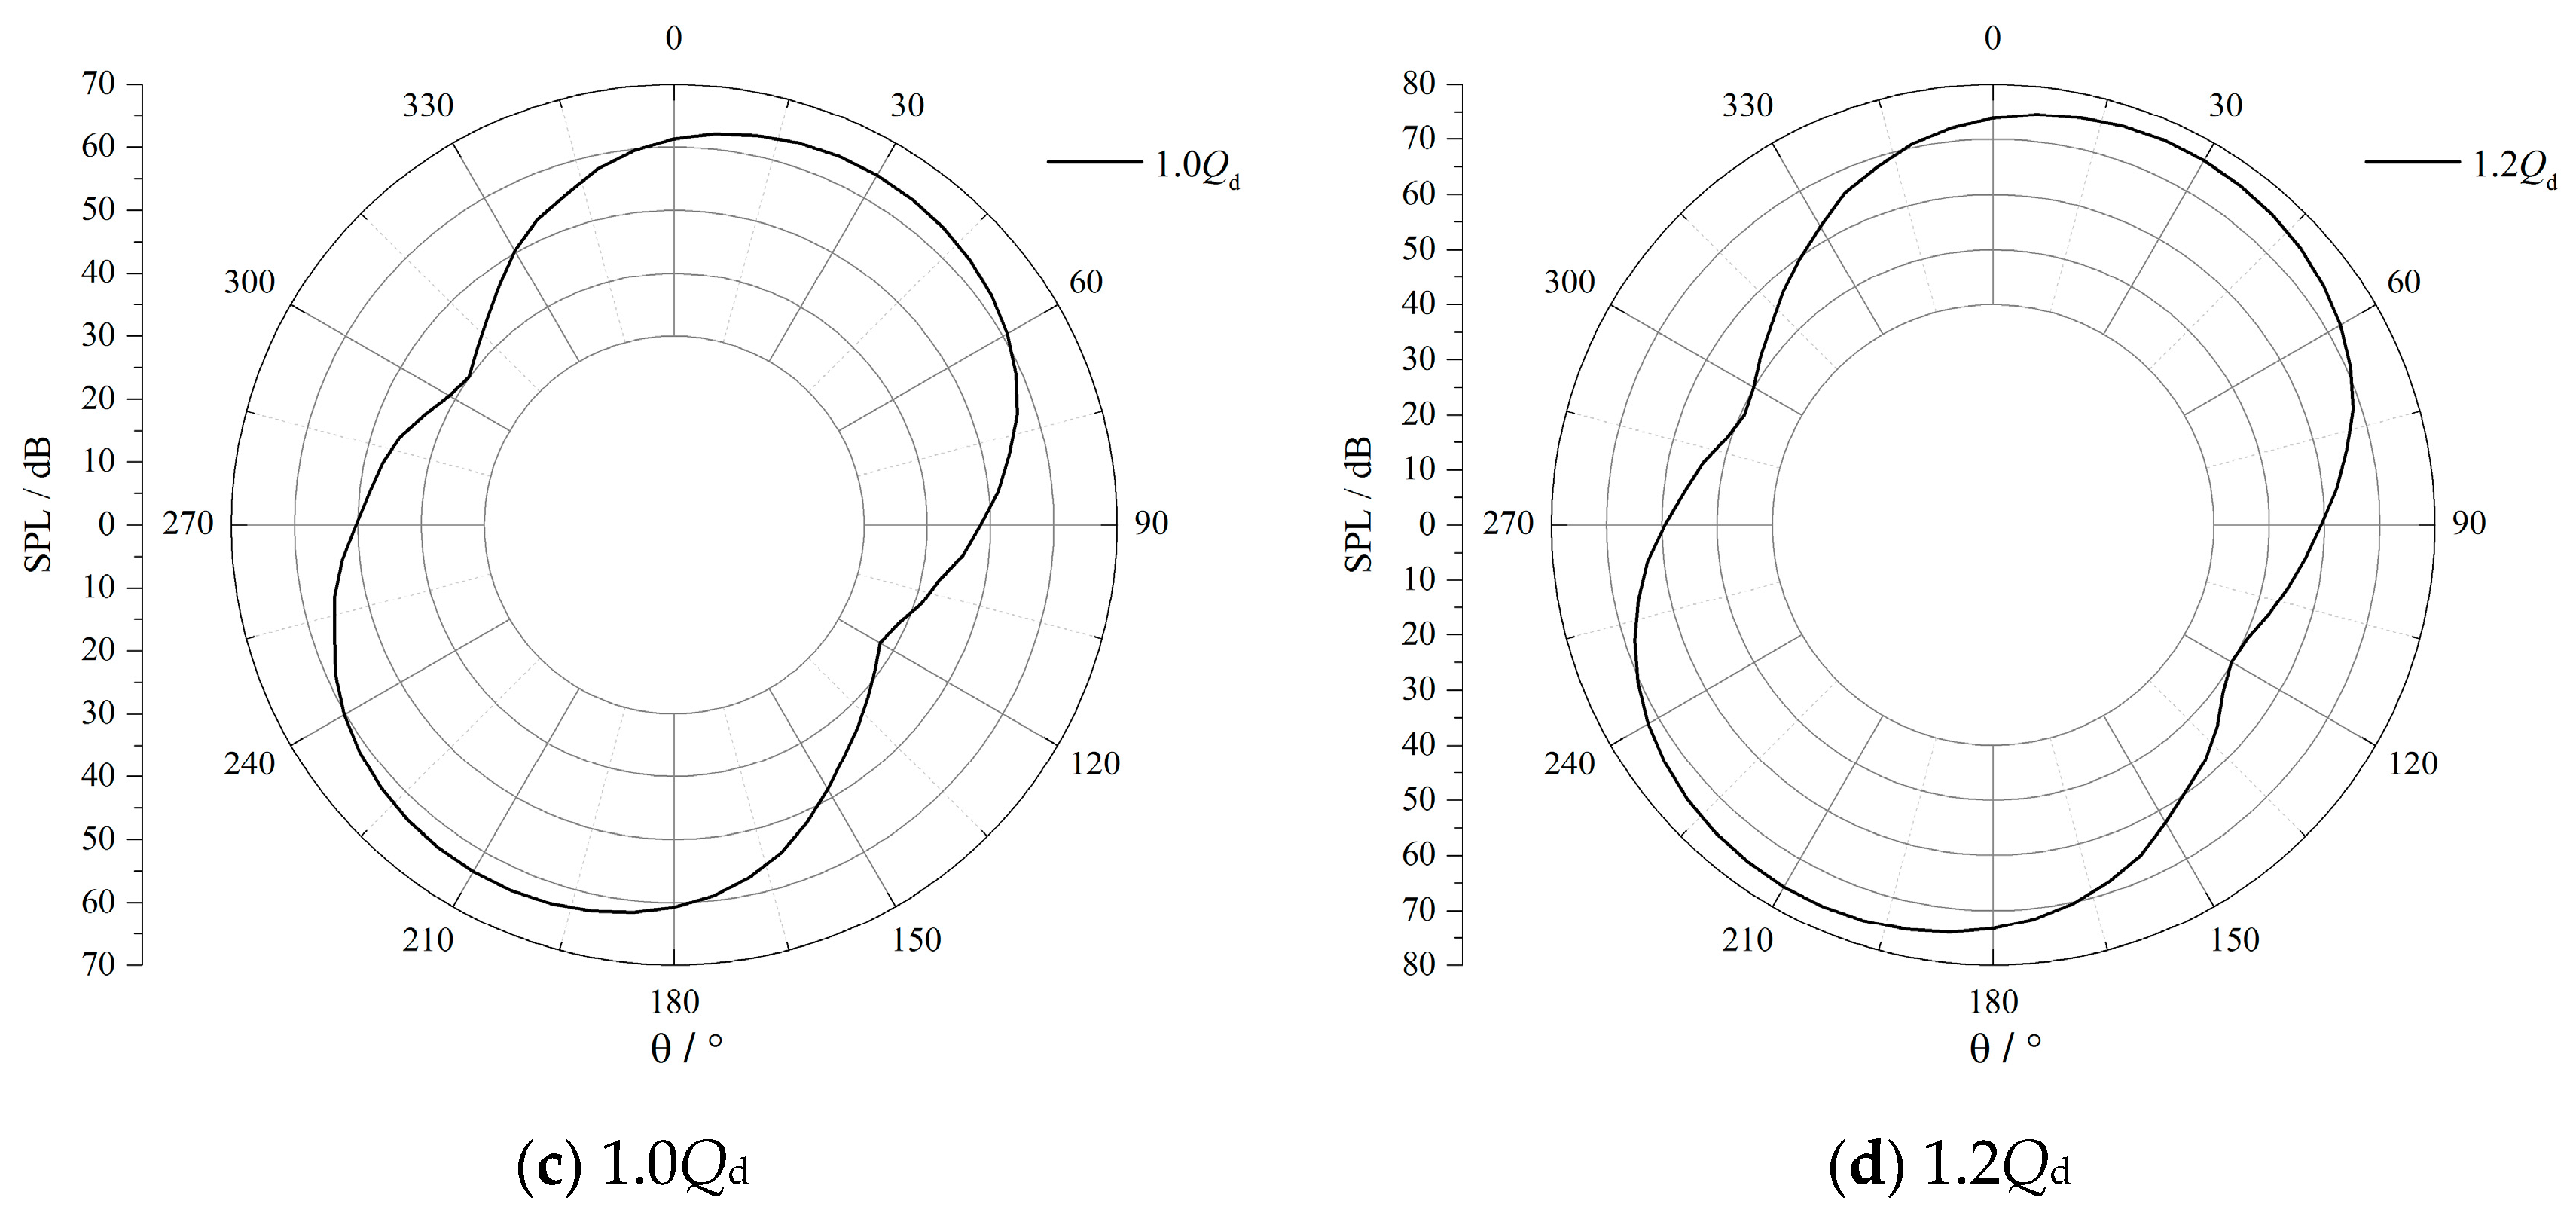
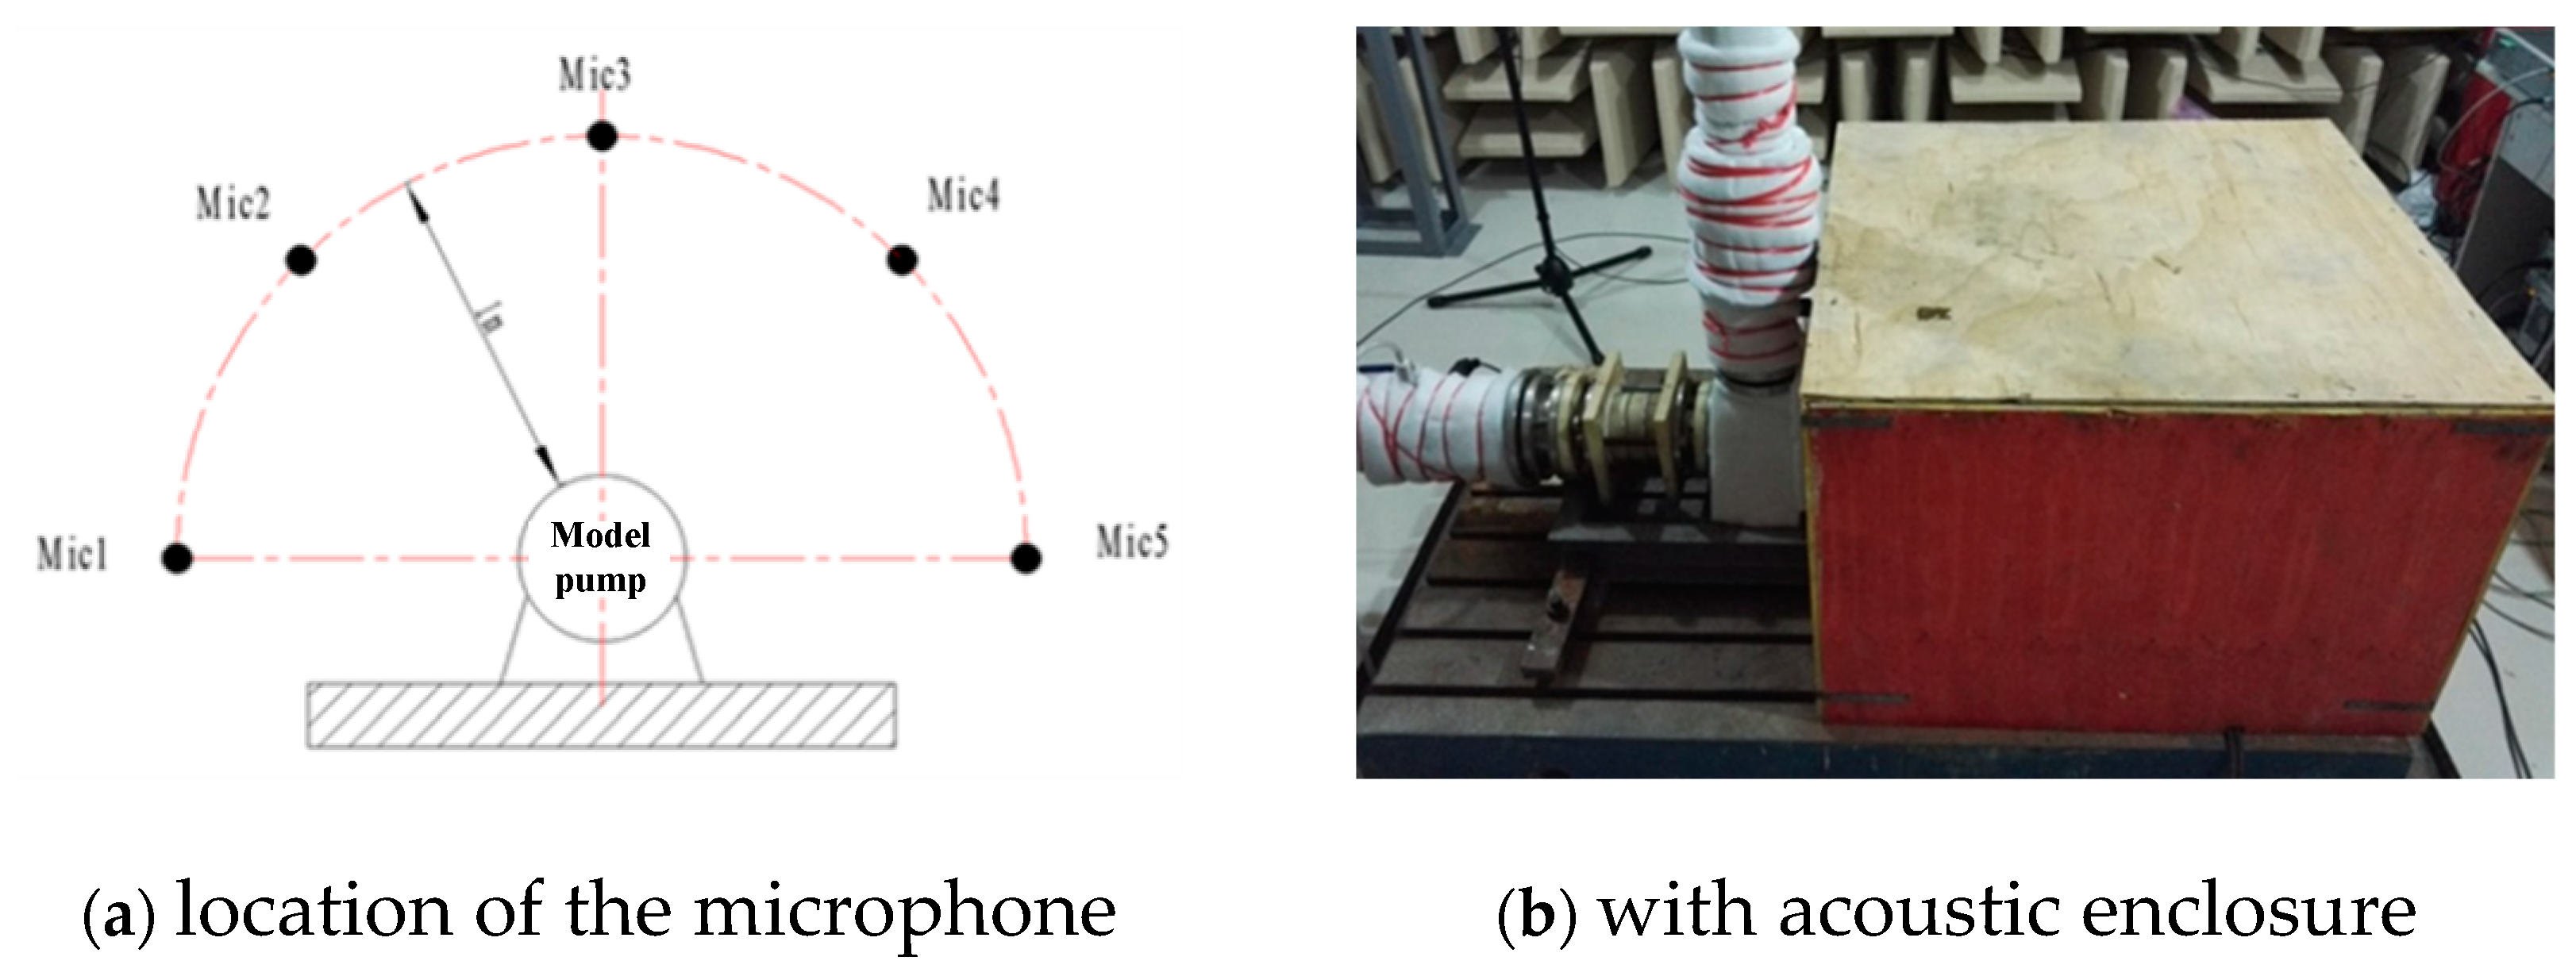
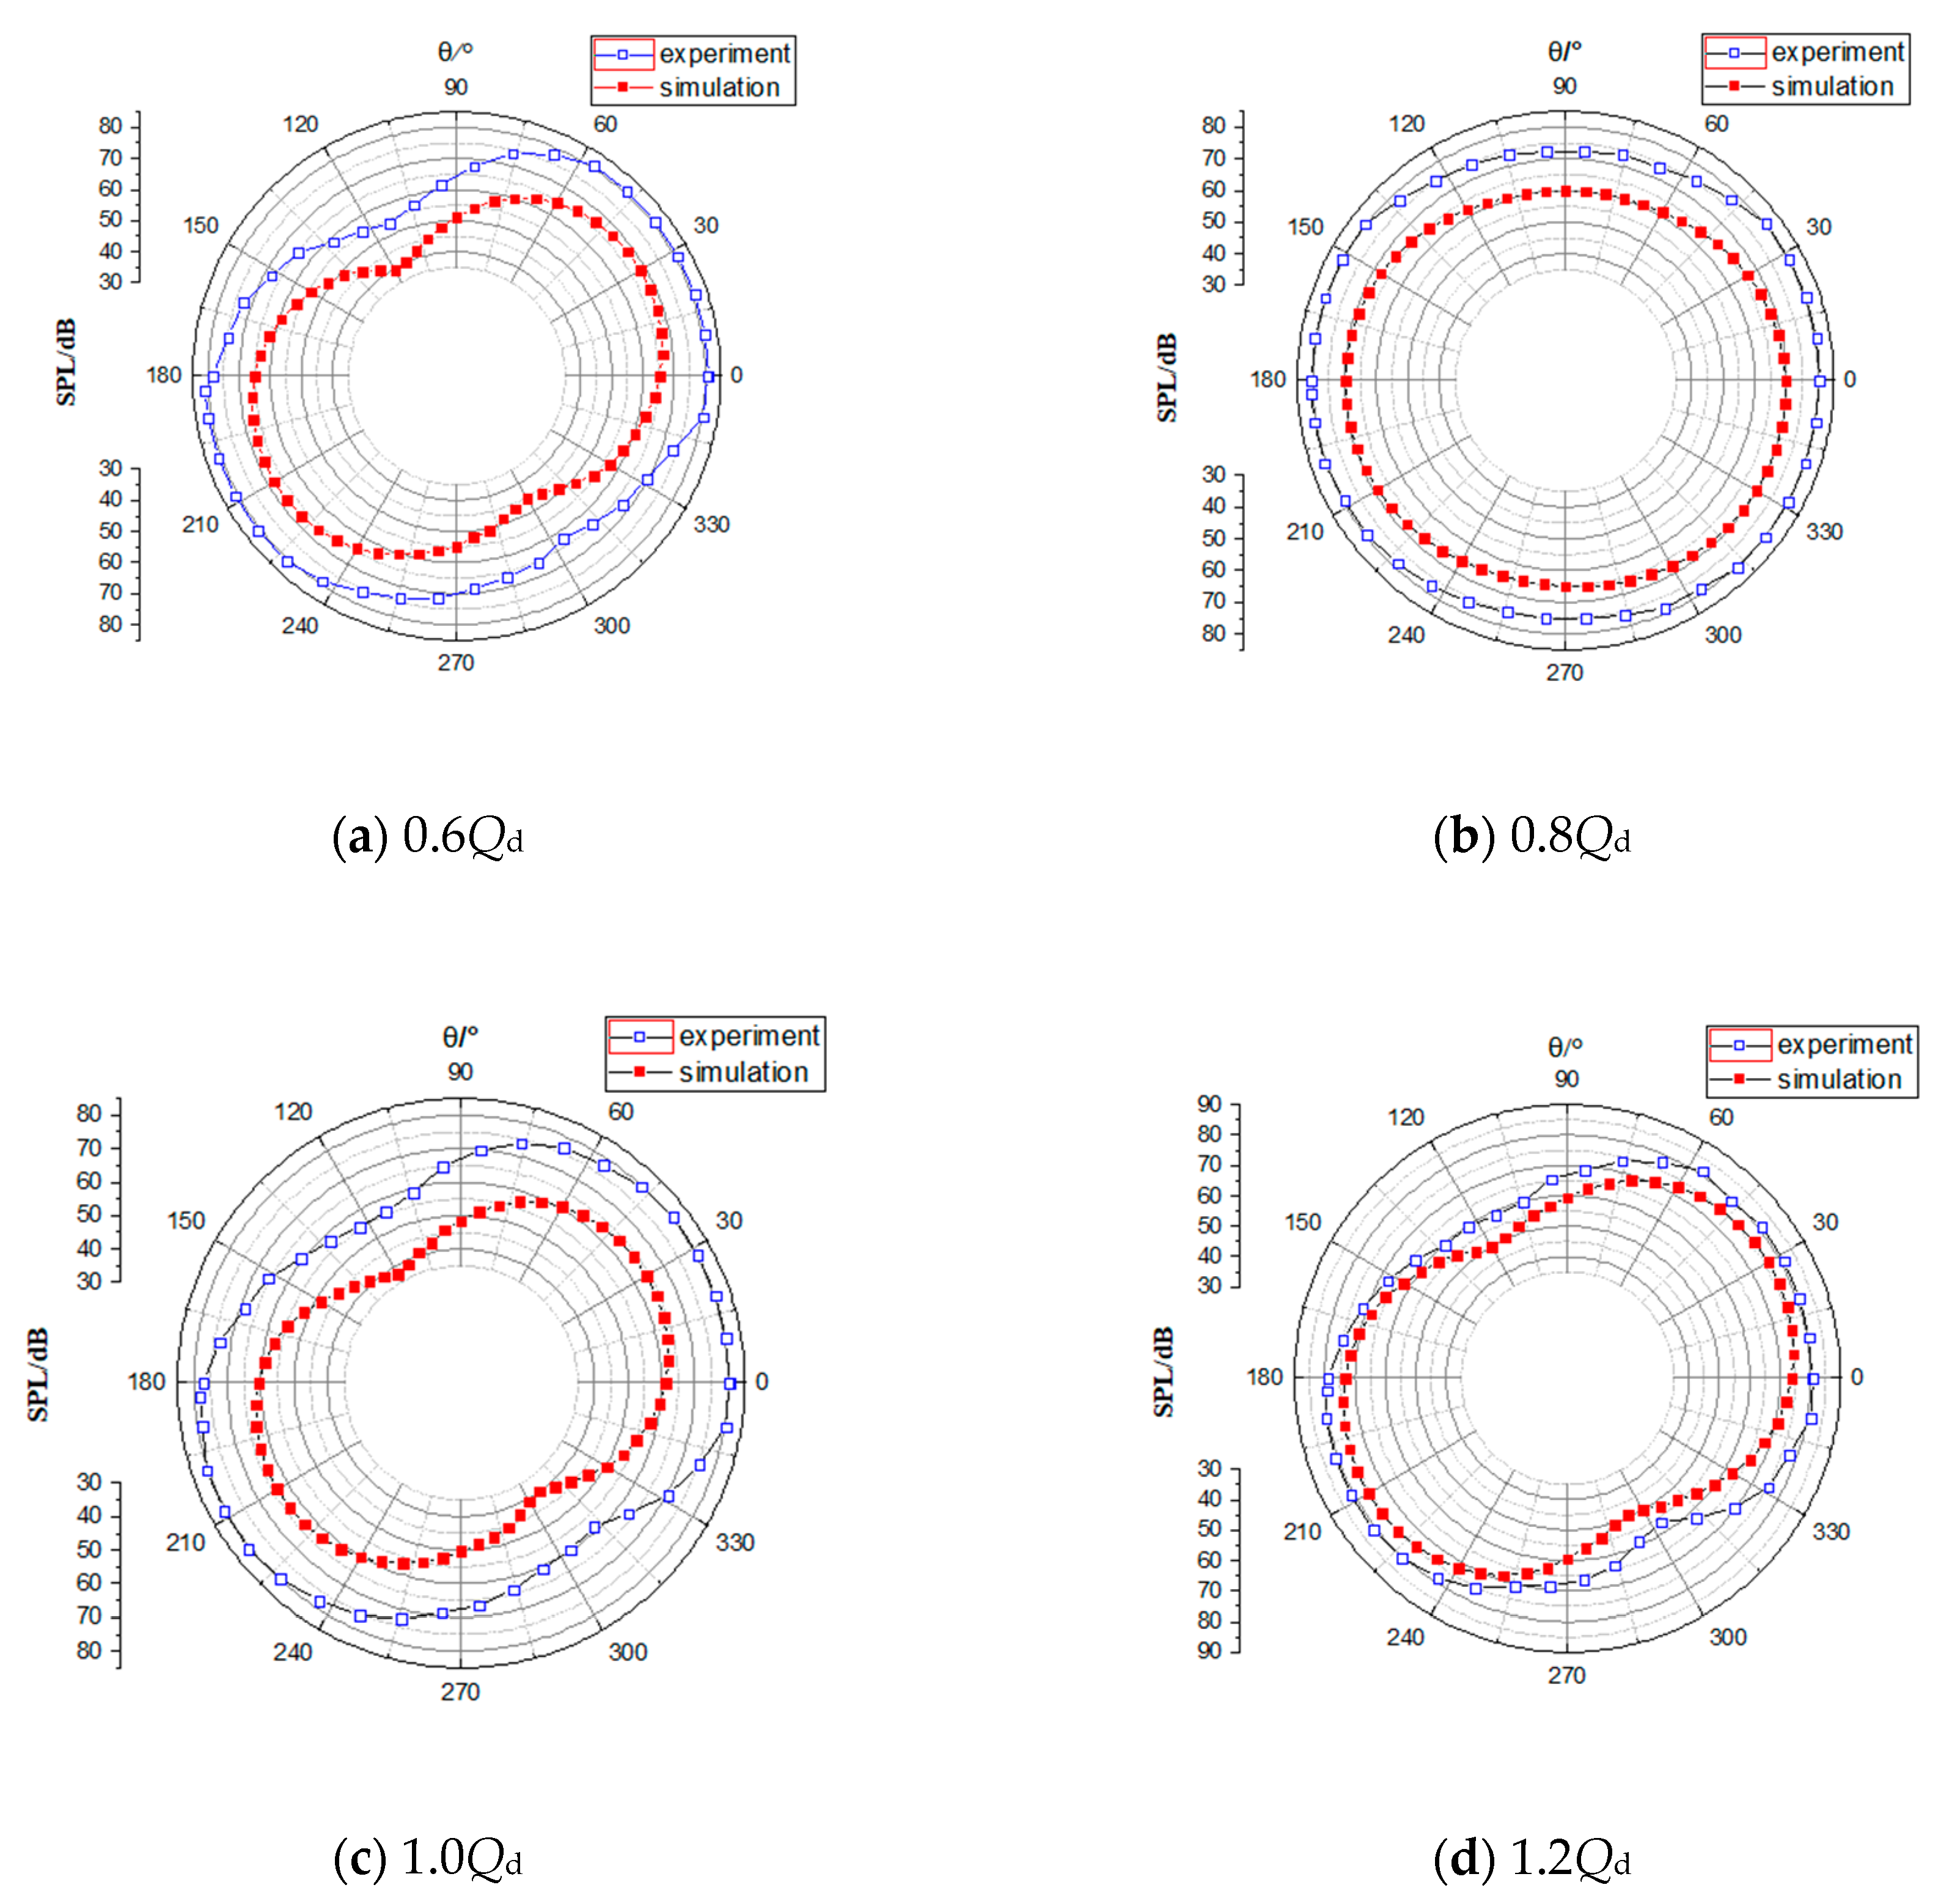
4.3. Directivity of Radiated Noise at Different Flowrates
5. Hydraulic Optimization Design
6. Conclusions
- (1)
- The sound pressure level in the multi-stage pump increases first and decreases afterward with the increment of the flowrate. The sound pressure level reaches its lowest value at 0.8Qd, which corresponds to maximum efficiency working conditions. The sound pressure level of the radiated noise in the multistage pump rises linearly with the increase of the rotational speed.
- (2)
- The radiated noise of the multi-stage pump is characterized by dipoles. Furthermore, the main frequency of the radiated noise is the blade passing frequency (327 Hz). This fact proves that the rotor-stator interaction between impeller and diffuser is still the main hydraulic exciting force and sound source. In addition, the directivity of the sound source changes with the variation of the flowrate.
- (3)
- Flow-induced radiated noise of the multi-stage centrifugal pump was calculated by the combined CFD(DES)/CA(FEM) method based on the Lighthill acoustic analogy theory. Comparisons of numerical predictions with the measured/analytical results reveal that the model can yield good results on the noise and the flow field. The most important aspect of the hydraulic design of a low-noise multi-stage centrifugal pump is to select the appropriate number of impeller blades and its matched guide vane.
Author Contributions
Funding
Conflicts of Interest
References
- Wang, C.; Shi, W.; Wang, X.; Jiang, X.; Yang, Y.; Li, W.; Zhou, L. Optimal design of multistage centrifugal pump based on the combined energy loss model and computational fluid dynamics. Appl. Energy 2017, 187, 10–26. [Google Scholar] [CrossRef]
- Wang, C.; He, X.; Zhang, D.; Hu, B.; Shi, W. Numerical and experimental study of the self-priming process of a multistage self-priming centrifugal pump. Int. J. Energy Res. 2019, 43, 4074–4092. [Google Scholar] [CrossRef]
- Huang, K.; Yuan, J.; Si, Q.; Lin, G. Numerical simulation on pressure pulsation in multistage centrifugal pump under several working conditions. J. Drain. Irrig. Mach. Eng. 2019, 37, 387–392. [Google Scholar]
- Wang, C.; Hu, B.; Zhu, Y.; Wang, X.; Luo, C.; Cheng, L. Numerical study on the gas-water two-phase flow in the self-priming process of self-priming centrifugal pump. Processes 2019, 7, 330. [Google Scholar] [CrossRef]
- Rochecarrier, N.L.; Ngoma, G.D.; Ghie, W. Numerical Investigation of a first stage of a multistage centrifugal pump: Impeller, diffuser with return vanes, and casing. Isrn Mech. Eng. 2015, 2013, 578072. [Google Scholar]
- Wang, C.; He, X.; Shi, W.; Wang, X.; Wang, X.; Qiu, N. Numerical study on pressure fluctuation of a multistage centrifugal pump based on whole flow field. Aip Adv. 2019, 9, 035118. [Google Scholar] [CrossRef]
- Zhang, J.; Xia, S.; Ye, S.; Xu, B.; Song, W.; Zhu, S.; Xiang, J. Experimental investigation on the noise reduction of an axial piston pump using free-layer damping material treatment. Appl. Acoust. 2018, 139, 1–7. [Google Scholar] [CrossRef]
- Ye, S.; Zhang, J.; Xu, B.; Zhu, S. Theoretical investigation of the contributions of the excitation forces to the vibration of an axial piston pump. Mech. Syst. Signal Process. 2019, 129, 201–217. [Google Scholar] [CrossRef]
- Wang, J.; Feng, T.; Liu, K.; Zhou, Q.-J. Experimental Research on the Relationship between the Flow-induced Noise and the Hyaraulic Parameters in Centrifugal Pump. Fluid Mach. 2007, 6, 1–13. [Google Scholar]
- Brennen, C.E. A review of the dynamics of cavitating pumps. J. Fluids Eng. 2013, 135, 061301. [Google Scholar] [CrossRef]
- He, X.; Jiao, W.; Wang, C.; Cao, W. Influence of surface roughness on the pump performance based on Computational Fluid Dynamics. IEEE Access 2019, 7, 105331–105341. [Google Scholar] [CrossRef]
- Qian, J.Y.; Chen, M.R.; Liu, X.L.; Jin, Z.J. A numerical investigation of the flow of nanofluids through a micro Tesla valve. J. Zhejiang Univ. Sci. A 2019, 20, 50–60. [Google Scholar] [CrossRef]
- Qian, J.Y.; Gao, Z.X.; Liu, B.Z.; Jin, Z.J. Parametric study on fluid dynamics of pilot-control angle globe valve. ASME J. Fluids Eng. 2018, 140, 111103. [Google Scholar] [CrossRef]
- Zhu, Y.; Tang, S.; Wang, C.; Jiang, W.; Yuan, X.; Lei, Y. Bifurcation Characteristic research on the load vertical vibration of a hydraulic automatic gauge control system. Processes 2019, 7, 718. [Google Scholar] [CrossRef]
- Zhu, Y.; Tang, S.; Quan, L.; Jiang, W.; Zhou, L. Extraction method for signal effective component based on extreme-point symmetric mode decomposition and Kullback-Leibler divergence. J. Braz. Soc. Mech. Sci. Eng. 2019, 41, 100. [Google Scholar] [CrossRef]
- Zhu, Y.; Qian, P.; Tang, S.; Jiang, W.; Li, W.; Zhao, J. Amplitude-frequency characteristics analysis for vertical vibration of hydraulic AGC system under nonlinear action. Aip Adv. 2019, 9, 035019. [Google Scholar] [CrossRef]
- Chu, S.; Dong, R.; Katz, J. Relationship Between Unsteady Flow, Pressure Fluctuations, and Noise in a Centrifugal Pump—Part A: Use of PDV Data to Compute the Pressure Field. J. Fluids Eng. 1995, 117, 24–29. [Google Scholar] [CrossRef]
- Chu, S.; Dong, R.; Katz, J. Relationship between Unsteady Flow, Pressure Fluctuations, and Noise in a Centrifugal Pump—Part B: Effects of Blade-Tongue Interactions. J. Fluids Eng. 1995, 117, 30–35. [Google Scholar] [CrossRef]
- Khalifa, A.E.; Al-Qutub, A.M.; Ben-Mansour, R. Study of Pressure Fluctuations and Induced Vibration at Blade-Passing Frequencies of a Double Volute Pump. Arab. J. Sci. Eng. 2011, 36, 1333–1345. [Google Scholar] [CrossRef]
- Parrondo, J.; Pérez, J.; Barrio, R.; Gonzales, J. A simple acoustic model to characterize the internal low frequency sound field in centrifugal pumps. Appl. Acoust. 2011, 72, 59–64. [Google Scholar] [CrossRef]
- Liu, H.L.; Dai, H.W.; Ding, J. Numerical and experimental studies of hydraulic noise induced by surface dipole sources in a centrifugal pump. J. Hydrodyn. Ser. B 2016, 28, 43–51. [Google Scholar] [CrossRef]
- Howe, M.S. On the Estimation of Sound Produced by Complex Fluid-Structure Interactions, with Application to a Vortex Interacting with a Shrouded Rotor. Proc. Math. Phys. Sci. 1991, 433, 573–598. [Google Scholar] [CrossRef]
- Kato, C.; Yoshimura, S.; Yamade, Y.; Jiang, Y.Y.; Wang, H.; Imai, R.; Katsura, H.; Yoshida, T.; Takano, Y. Prediction of the Noise from a Multi-Stage Centrifugal Pump. In Proceedings of the ASME 2005 Fluids Engineering Division Summer Meeting, Houston, TX, USA, 19–23 June 2005; pp. 1273–1280. [Google Scholar]
- Ding, J.; Liu, H.L.; Wang, Y.; Tan, M.G.; Cui, J.B. Numerical study on the effect of blade outlet angle on centrifugal pump noise. J. Vib. Shock 2014, 33, 122–127. [Google Scholar]
- Si, Q.R.; Ali, A.; Yuan, J.P.; Fall, I.; Muhammad, Y.F. Flow-induced noises in a centrifugal pump: A review. Sci. Adv. Mater. 2019, 11, 909–924. [Google Scholar] [CrossRef]
- Keller, J.; Barrio, R.; Parrondo, J.; Barrio, R.; Fernandez, J.; Blanco, E. Effects of the Pump-Circuit Acoustic Coupling on the Blade-Passing Frequency Perturbations. Appl. Acoust. 2014, 76, 150–156. [Google Scholar] [CrossRef]
- Gao, M.; Dong, P.; Lei, S.; Turan, A. Computational Study of the Noise Radiation in a Centrifugal Pump When Flow Rate Changes. Energies 2017, 10, 221. [Google Scholar] [CrossRef]
- Jiang, Y.Y.; Yoshimura, S.; Imai, R.; Katsura, H.; Yoshida, T.; Kato, C. Quantitative evaluation of flow-induced structural vibration and noise in turbomachinery by full-scale weakly coupled simulation. J. Fluids Struct. 2007, 23, 531–544. [Google Scholar] [CrossRef]
- Timushev, S. Development and Experimental Validation of 3D Acoustic-Vortex Numerical Procedure for Centrifugal Pump Noise Prediction. In Proceedings of the ASME 2009 Fluids Engineering Division Summer Meeting, Vail, CO, USA, 2–6 August 2009; pp. 389–398. [Google Scholar]
- Barrio, R.; Parrondo, J.; Blanco, E. Numerical analysis of the unsteady flow in the near-tongue region in a volute-type centrifugal pump for different operating points. Comput. Fluids 2010, 39, 859–870. [Google Scholar] [CrossRef]
- Dong, L.; Dai, C.; Kong, F.; Fu, L.; Bai, Y. Impact of blade outlet angle on acoustic of centrifugal pump as turbine. Trans. Chin. Soc. Agric. Eng. 2015, 31, 69–75. [Google Scholar]
- Rui, X.P.; Zhao, Y. Numerical simulation and experimental research of flow-induced noise for centrifugal pumps. J. Vibroeng. 2016, 18, 622–636. [Google Scholar]
- Hao, Z. Vibration Noises and Acoustic Optimization Design of the Centrifugal Pump. In Proceedings of the International Conference on Machinery, Materials and Computing Technology, Hangzhou, China, 23–24 January 2016. [Google Scholar]
- Heng, Y.; Yuan, S.; Hong, F.; Yuan, J.; Si, Q.; Hu, B. A Hybrid Method for Flow-Induced Noise in Centrifugal Pumps Based on LES and FEM. In Proceedings of the ASME 2013 Fluids Engineering Division Summer Meeting, Vail, CO, USA, 2–6 August 2013; p. V01BT10A034. [Google Scholar]
- Tu, S.; Shahrouz, A.; Reena, P.; Watts, M. An implementation of the Spalart-Allmaras DES model in an implicit unstructured hybrid finite volume/element solver for incompressible turbulent flow. Int. J. Numer. Methods Fluids 2010, 59, 1051–1062. [Google Scholar] [CrossRef]
- Gülish, J.F. Centrifugal Pumps; Springer: Berlin/Heidelberg, Germany; New York, NY, USA, 2008. [Google Scholar]
- Methods of Measuring and Evaluating Noise of Pumps; China Standard Press: Beijing, China, 2013; GB/T 29529-2013.


| Geometry | Values | Geometry | Values |
|---|---|---|---|
| Impeller inlet diameter, Dj | 45/mm | Blade outlet angle, β2 | 37/° |
| Impeller outlet diameter, D2 | 103/mm | Impeller blades number, Za | 7 |
| Impeller outlet width, b2 | 10/mm | Diffuser vane number, Zd | 12 |
| Diffuser inlet diameter, D3 | 104.5/mm | Specific speed, ns | 86 |
| Material | Density/(kg/m3) | Young’s Modulus/GPa | Poisson’s Ratio |
|---|---|---|---|
| ABS | 1040 | 200 | 0.394 |
© 2019 by the authors. Licensee MDPI, Basel, Switzerland. This article is an open access article distributed under the terms and conditions of the Creative Commons Attribution (CC BY) license (http://creativecommons.org/licenses/by/4.0/).
Share and Cite
Si, Q.; Wang, B.; Yuan, J.; Huang, K.; Lin, G.; Wang, C. Numerical and Experimental Investigation on Radiated Noise Characteristics of the Multistage Centrifugal Pump. Processes 2019, 7, 793. https://doi.org/10.3390/pr7110793
Si Q, Wang B, Yuan J, Huang K, Lin G, Wang C. Numerical and Experimental Investigation on Radiated Noise Characteristics of the Multistage Centrifugal Pump. Processes. 2019; 7(11):793. https://doi.org/10.3390/pr7110793
Chicago/Turabian StyleSi, Qiaorui, Biaobiao Wang, Jianping Yuan, Kaile Huang, Gang Lin, and Chuan Wang. 2019. "Numerical and Experimental Investigation on Radiated Noise Characteristics of the Multistage Centrifugal Pump" Processes 7, no. 11: 793. https://doi.org/10.3390/pr7110793
APA StyleSi, Q., Wang, B., Yuan, J., Huang, K., Lin, G., & Wang, C. (2019). Numerical and Experimental Investigation on Radiated Noise Characteristics of the Multistage Centrifugal Pump. Processes, 7(11), 793. https://doi.org/10.3390/pr7110793