Article

Simulation of Batch Slow Pyrolysis of Biomass Materials Using the Process-Flow-Diagram COCO Simulator

by
Chaiyot Tangsathitkulchai
1,*,
Natthaya Punsuwan
2 and
Piyarat Weerachanchai
3
1
School of Chemical Engineering, Institute of Engineering, Suranaree University of Technology, Nakhon Ratchasima 30000, Thailand
2
Department of Chemical Engineering, Faculty of Engineering, Ubon Ratchathani University, Ubon Ratchathani 34190, Thailand
3
Nanyang Environment & Water Research Institute, Nanyang Technological University, Singapore 637141, Singapore
*
Author to whom correspondence should be addressed.
Processes 2019, 7(11), 775; https://doi.org/10.3390/pr7110775
Submission received: 21 September 2019 / Revised: 21 October 2019 / Accepted: 21 October 2019 / Published: 24 October 2019
(This article belongs to the Special Issue Progress in Thermochemical Conversion of Solid Fuels)

Abstract

:
The commercial COCO simulation program was used to mimic the experimental slow pyrolysis process of five different biomasses based on thermodynamic consideration. The program generated the optimum set of reaction kinetic parameters and reaction stoichiometric numbers that best described the experimental yields of solid, liquid and gas products. It was found that the simulation scheme could predict the product yields over the temperature range from 300 to 800 °C with reasonable accuracy of less than 10% average error. An attempt was made to generalize the biomass pyrolysis behavior by dividing the five biomasses into two groups based on the single-peak and two-peak characteristics of the DTG (derivative thermogravimetry) curves. It was found that this approximate approach was able to predict the product yields reasonably well. The proposed simulation method was extended to the analysis of slow pyrolysis results derived from previous investigations. The results obtained showed that the prediction errors of product yields were relatively large, being 12.3%, 10.6%, and 27.5% for the solid, liquid, and gas products, respectively, possibly caused by differing pyrolysis conditions from those used in the simulation. The prediction of gas product compositions by the simulation program was reasonably satisfactory, but was less accurate for predicting the compositions of liquid products analyzed in forms of hydrocarbons, aromatics and oxygenated fractions. In addition, information on the kinetics of thermal decomposition of biomass in terms of the variation of fractional conversion with time was also derived as a function of temperature and biomass type.

1. Introduction

Biomass-based fuels are non-fossil and renewable and are regarded as CO2 neutral, since a biomass can assimilate carbon dioxide from the atmosphere during its growth period. Nowadays, biomass is becoming increasingly important as a renewable source of energy. The primary biomass fuel is wood waste; however, other agricultural wastes, such as bagasse, straw, rice hull, and coconut shells are also popularly used as fuel sources. The chemistry of biomass is complicated but the major components which can be isolated by analytical methods are cellulose, hemicelluloses, lignin, organics extractives, and inorganic materials [1]. Biomass is generally used on-site or a short distance off-site, due to its low bulk density. This is the reason why it is difficult to transport and use biomass in many applications without substantial pretreatment. As an energy source, biomass can be generally converted to biofuels by two possible routes, namely, fermentation and thermal decomposition. Based on the end-products required, thermal decomposition can be classified into direct combustion, gasification and pyrolysis [1,2,3].
Pyrolysis is the thermal degradation of biomass by heat in the absence of oxygen that results in the production of charcoal (solid), bio-oil (liquid) and gas products comprising mainly of CO2, CO, H2 and CH4. Generally, pyrolysis process operates in the temperatures ranging from 280 to 850 °C with different heating rates and residence times and can be classified into three subclasses: Conventional pyrolysis, fast pyrolysis, and flash pyrolysis.
Conventional pyrolysis may also be termed “slow pyrolysis”. This type of pyrolysis has been mainly used for the production of charcoal. Slow pyrolysis is characterized by the slow heating rate (less than 10 °C/s) and long residence times of gas and solids with the temperature being around 450 °C [1]. The release of vapor products does not occur as rapidly as in the fast pyrolysis. Thus, components in the vapor phase continue to react with each other, resulting in the formation of char and additional liquids.
Fast pyrolysis is a high-temperature process in which biomass is rapidly heated to around 500 °C in the absence of oxygen. Biomass decomposes to generate vapors, aerosols, and some charcoal-like char. Fast pyrolysis heating rate is around 100 °C/s, or even 10,000 °C/s and the vapor residence time is normally less than 2 s [4]. At higher fast pyrolysis temperatures, the major product is gas. Rapid heating and rapid quenching maximize the pyrolysis liquid products, which condense out before further reactions break down the higher-molecular-weight species into gaseous products. A dark brown liquid is formed after cooling and condensation of the vapors. The heating value of this liquid is approximately half that of conventional fuel oil. Fast pyrolysis processes produce 60–75 wt % of liquid bio-oil, 15–25 wt % of solid char, and 10–20 wt % of non-condensable gases, depending on the feedstock being used.
Flash pyrolysis occurs in a very high-temperature range of 700–1000 °C at a much faster heating rate of higher than 500 °C/s and with a short residence time of less than 0.5 s. Biomass conversion to bio-oil can have efficiency up to 80% in the flash pyrolysis process [5]. The liquid product is considered a very promising fuel because it can be easily transported, burnt directly in thermal power stations, and can be further used as a chemical feedstock to produce many valuable chemical products [6]. However, bio-oils have high oxygen content (35–50%), which causes high acidity (pH as low as ~2). Bio-oils are also viscous (20–1000 cP @ 40 °C), and a have high content of solid residues (up to 40%). These oils are also oxidatively unstable, so that the oils can polymerize, agglomerate, or have oxidative reactions occurring in situ, which lead to increased viscosity and volatility [7].
Due to the growing interest in the application of pyrolysis for energy generation, many research efforts have been made to study the effects of process conditions on the degradation mechanisms [4,8] and the distribution and compositions of the pyrolysis products [9,10]. On the other hand, various mathematical models capable of describing the pyrolysis phenomena have also been proposed. The simplest biomass pyrolysis model is the kinetic or reaction model which consists of the simple lumped kinetic model [4,11,12,13,14] and the multiple complex reactions distributed model, involving an infinite number of independent parallel reactions having distributed activation energies [15,16]. However, the kinetic models can be applied only for the case of chemical kinetic control, that is, for small particles where the effects of heat and mass transfer can be neglected. The next improved model is the single particle model where other processes are taken into consideration, such as heat and mass transfer limitations [17,18], secondary reactions [19,20] and particle shrinkage [21]. However, these two kinds of models often give information concerning the effects of pyrolysis conditions on the reaction conversion of the feed biomass or the yields of solid char products, with no prediction on the yields and compositions of the gas and liquid products.
Another approach that has gained increasing attention for the modeling of the biomass pyrolysis process is to employ a process simulator that is more flexible in terms of process layout and capable of process analysis, design and optimization [22,23]. The primary impetus of the present study was to use the COCO Simulation Program as a tool for mimicking the experimental process for studying the slow pyrolysis of five different biomasses, with the purpose to predict the product yields and compositions as a function of pyrolysis temperature. The COCO Simulator [24] uses the process flow diagram for defining the process to be simulated. It is a commercial open flowsheet modeling environment that contains a library of many unit operations and reactor models and a range of physicochemical and thermodynamic properties. The novelty of the simulation approach proposed in the present work is its ability to predict the pyrolysis kinetics, as well as the equilibrium yields and compositions of the pyrolysis products of biomasses from various sources as a function of decomposition temperature over a wide range from 300 to 800 °C.

2. Materials and Methods

Pyrolysis experimental data used as inputs for the simulation and validation of the proposed pyrolysis model in the present study was taken from our previous work [25,26]. The pyrolysis experiments were conducted in a fixed-bed reactor made of stainless steel (4.5 cm inside diameter and 46 cm long) which was inserted in a vertical tube furnace (model PTF 12/50/450, Protherm Electrical Furnaces) Palm shell (PS), coconut shell (CS), palm kernel cake (PK), cassava pulp residue (CP) and longan fruit seed (LS) were used as the biomass precursors for the pyrolysis study. Cassava pulp residue is a by-product from starch manufacturing from cassava and palm kernel cake is a solid residue left after oil extraction by screw press or solvent extraction and containing about 5 wt % of free fatty acid in the residual oil [27].
The as-received biomass precursors were crushed and sieved to obtain the average particle size of 2.03 mm (8 × 12 mesh screens). The pyrolysis experiment was commenced by loading each type of biomass into the reactor with the amount of 100 g for palm kernel cake, palm shell, coconut shell and longan fruit seed and 50 g for cassava pulp residue because of its low bulk density. The reactor was then heated from room temperature to the desired final pyrolysis temperature (300–800 °C) at a constant heating rate of 20 °C/min under a constant flow of nitrogen in the downward direction at the rate of 200 cm3/min. The generated vapor products flowed through two condensers connected in series. The first condenser utilized a mixture of salt-ice in a bath maintaining at −6 to −8 °C and the second condenser operated at −20 °C using a glycerin-water mixture filled in a temperature-controlled water bath. It usually took about 40–60 min after the final pyrolysis temperature was reached to complete each batch of the pyrolysis experiment. During the experimental run, the gas and the condensed liquid products were continuously collected until the end of the experiment. The total weights of solid char left in the reactor and the collected liquid products were determined and the product yields calculated based on the initial weight of the biomass according to the equation, product yield ( wt %) = (100) (weight of solid or liquid product/weight of biomass). The yield of the gas product was estimated by subtracting the yields of solid char and liquid products from 100. The compositions of the liquid and gas products from pyrolysis were also analyzed, and the method of analysis is described elsewhere [26].

3. Simulation of the Pyrolysis Process

In this work, the pyrolysis reaction scheme, as shown in Equation (1), was proposed as the decomposition of biomass, producing solid char, liquid products (H2O, C8H18, C6H5OH, C5H4O2, C7H8, C6H6, C8H10, C8H8, C9H20, C17H36, C19H40 and CH3COOH), and gas products (H2, CO2, CO and CH4). These chemical components are the dominant species detected in our slow pyrolysis batch experiments [25].
C x H y O z ( Biomass ) k a ( H 2 ) + b ( CO 2 ) + c ( CO ) + d ( CH 4 ) + e ( H 2 O ) + f ( C 8 H 18 ) +      g ( C 6 H 5 OH ) + h ( C 5 H 4 O 2 ) + ( C 7 H 8 )   + j ( C 6 H 6 ) + k ( C 8 H 10 ) + l ( C 8 H 8 )    + m ( C 9 H 20 ) + n ( C 17 H 36 ) + o ( C 19 H 40 ) + p ( CH 3 COOH ) + q ( Char ) ,
where x, y and z are mole ratios of carbon, hydrogen and oxygen which give the chemical formula for the biomass and their values are listed in Table 1 for various biomass precursors used in the present study. Symbols a to q represent the stoichiometric numbers of the products produced from the pyrolysis process.
The rate of biomass decomposition is assumed to follow the first-order rate expression, as shown in Equation (2).
reaction   rate = d ( x biomass ) d t = - k . x biomass = A . exp ( - E RT ) . x biomass ,
where k is the reaction rate constant (s−1), A is the pre-exponential factor (s−1), E is the activation energy of the reaction (J/mol), R is the gas-law constant (8.314 J/mol-°K), T is the absolute temperature (°K) and x biomass is the mole fraction of biomass feedstock. Equations (1) and (2) are the basis for the calculation of product yields derived from the biomass pyrolysis.
The simulation procedure for biomass pyrolysis was initiated by first drawing a process flow diagram that imitates the experimental steps of the pyrolysis study, as illustrated in Figure 1. The biomass is fed at a specified rate into the reactor which operates as a continuous-stirred-tank reactor (CSTR). It is assumed that the pyrolysis decomposition reactions occur in the gas phase at a uniform temperature with no heat loss to the surrounding. The reaction products leaving the reactor are cooled and separated into solid, liquid and gas streams by using two condensers connected in series which operate at −8 °C and −20 °C, respectively. The overall system operates under a continuous steady-state condition that simulates the final equilibrium condition for the experimental batch pyrolysis system.
The input data required for the COCO simulator are the following, chemical formula of each biomass (from Table 1), reaction equation (Equation (1)) with an initial set of stoichiometric numbers (values of a to q), the kinetic rate expression (Equation (2)) and the initial values of kinetic parameters (A and E), process conditions (feed rate, temperature and pressure), experimental yields of the pyrolysis products, and physicochemical and thermodynamic properties of biomass and various pyrolysis products (stored in the program library). The program computes the yields of pyrolysis products based on the laws of conservation of mass and energy using the available input data. The program then searches for the optimum set of stoichiometric numbers and kinetic parameters for each biomass using the nonlinear least square (NLS) algorithm that minimizes the objective function of sum of squared errors (SSE), defined as O . F . = i = 1 N ( % yield exp , i - % yield sim , i ) 2 , where % yield exp , i and % yield sim , i represent the experimental and calculated percentage yields of solid, or liquid or gas products, respectively.
The outputs generated by the simulation program are the reaction kinetic parameters (A and E), the reaction stoichiometry numbers (a to q), the expected yields of solid, liquid and gas products, and the compositions of the liquid and gas products.

4. Results and Discussion

4.1. Raw Material Characterization

Table 1 shows the proximate and ultimate analyses and the lignocellulosic compositions, as well as the chemical formulae (CxHyOz) of the biomass precursors used in this study. Proximate and elemental analyses show that the main compositions of biomasses are volatile contents and carbon and oxygen are the major chemical elements. The fixed carbon content varies in the range of 11.83–19.20 wt %. On the lignocellulosic compositions, coconut shell and cassava pulp residue contain the largest percentage of hemicellulose and cellulose, respectively, while lignin is the major lignocellulosic constituent in palm shell and palm kernel cake. The lignin content of longan fruit seed is notably much higher than those of the other biomasses. Obviously, the differences in chemical compositions of biomass will have a direct influence on the yields and compositions of the derived pyrolysis products. It is further noted that the chemical formula (mole ratios), shown in Table 1, for each biomass precursor was computed from its ultimate analysis data.

4.2. Simulation Results

Table 2 shows the optimum set of stoichiometric numbers (a to q) generated from the simulation program for the five different biomasses studied. It should be noted that the char formula, CH0.22O0.51, was estimated from the ultimate analysis data of the produced solid char and was assumed constant for all the simulation conditions. Table 3 shows the corresponding kinetic parameters (A and E) as a function of pyrolysis temperature over the range from 300 to 800 °C, along with the comparison between experimental product yields and those predicted from the simulation program. The designated symbols P01, P02, P03, P04 and P05 indicate the set of simulation parameters (stoichiometry and kinetic parameters) pertaining to palm shell (PS), coconut shell (CS), palm kernel cake (PK), cassava pulp residue (CP) and longan fruit seed (LS), respectively. As Table 2 shows, the stoichiometry of the pyrolysis reaction is strongly dependent on the type of biomass. In terms of gas components, the order of increasing stoichiometric number is as follows, H2(a) < CH4(d) << CO(c) < CO2(b). The stoichiometric number of CO2 is highest among the gas products and the following order of increasing CO2 stoichiometric number is noted for different biomass types, PS < CS < LS, PK < CP. This observation may indicate the highest percentage composition of CO2 in the pyrolysis gas products and cassava pulp residue could produce the highest percentage yield of CO2. The stoichiometric numbers of liquid water and phenol are much higher than the other liquid-phase chemical components, possibly an indication of large proportions of water and oxygenated compounds present in the liquid bio-oil product.
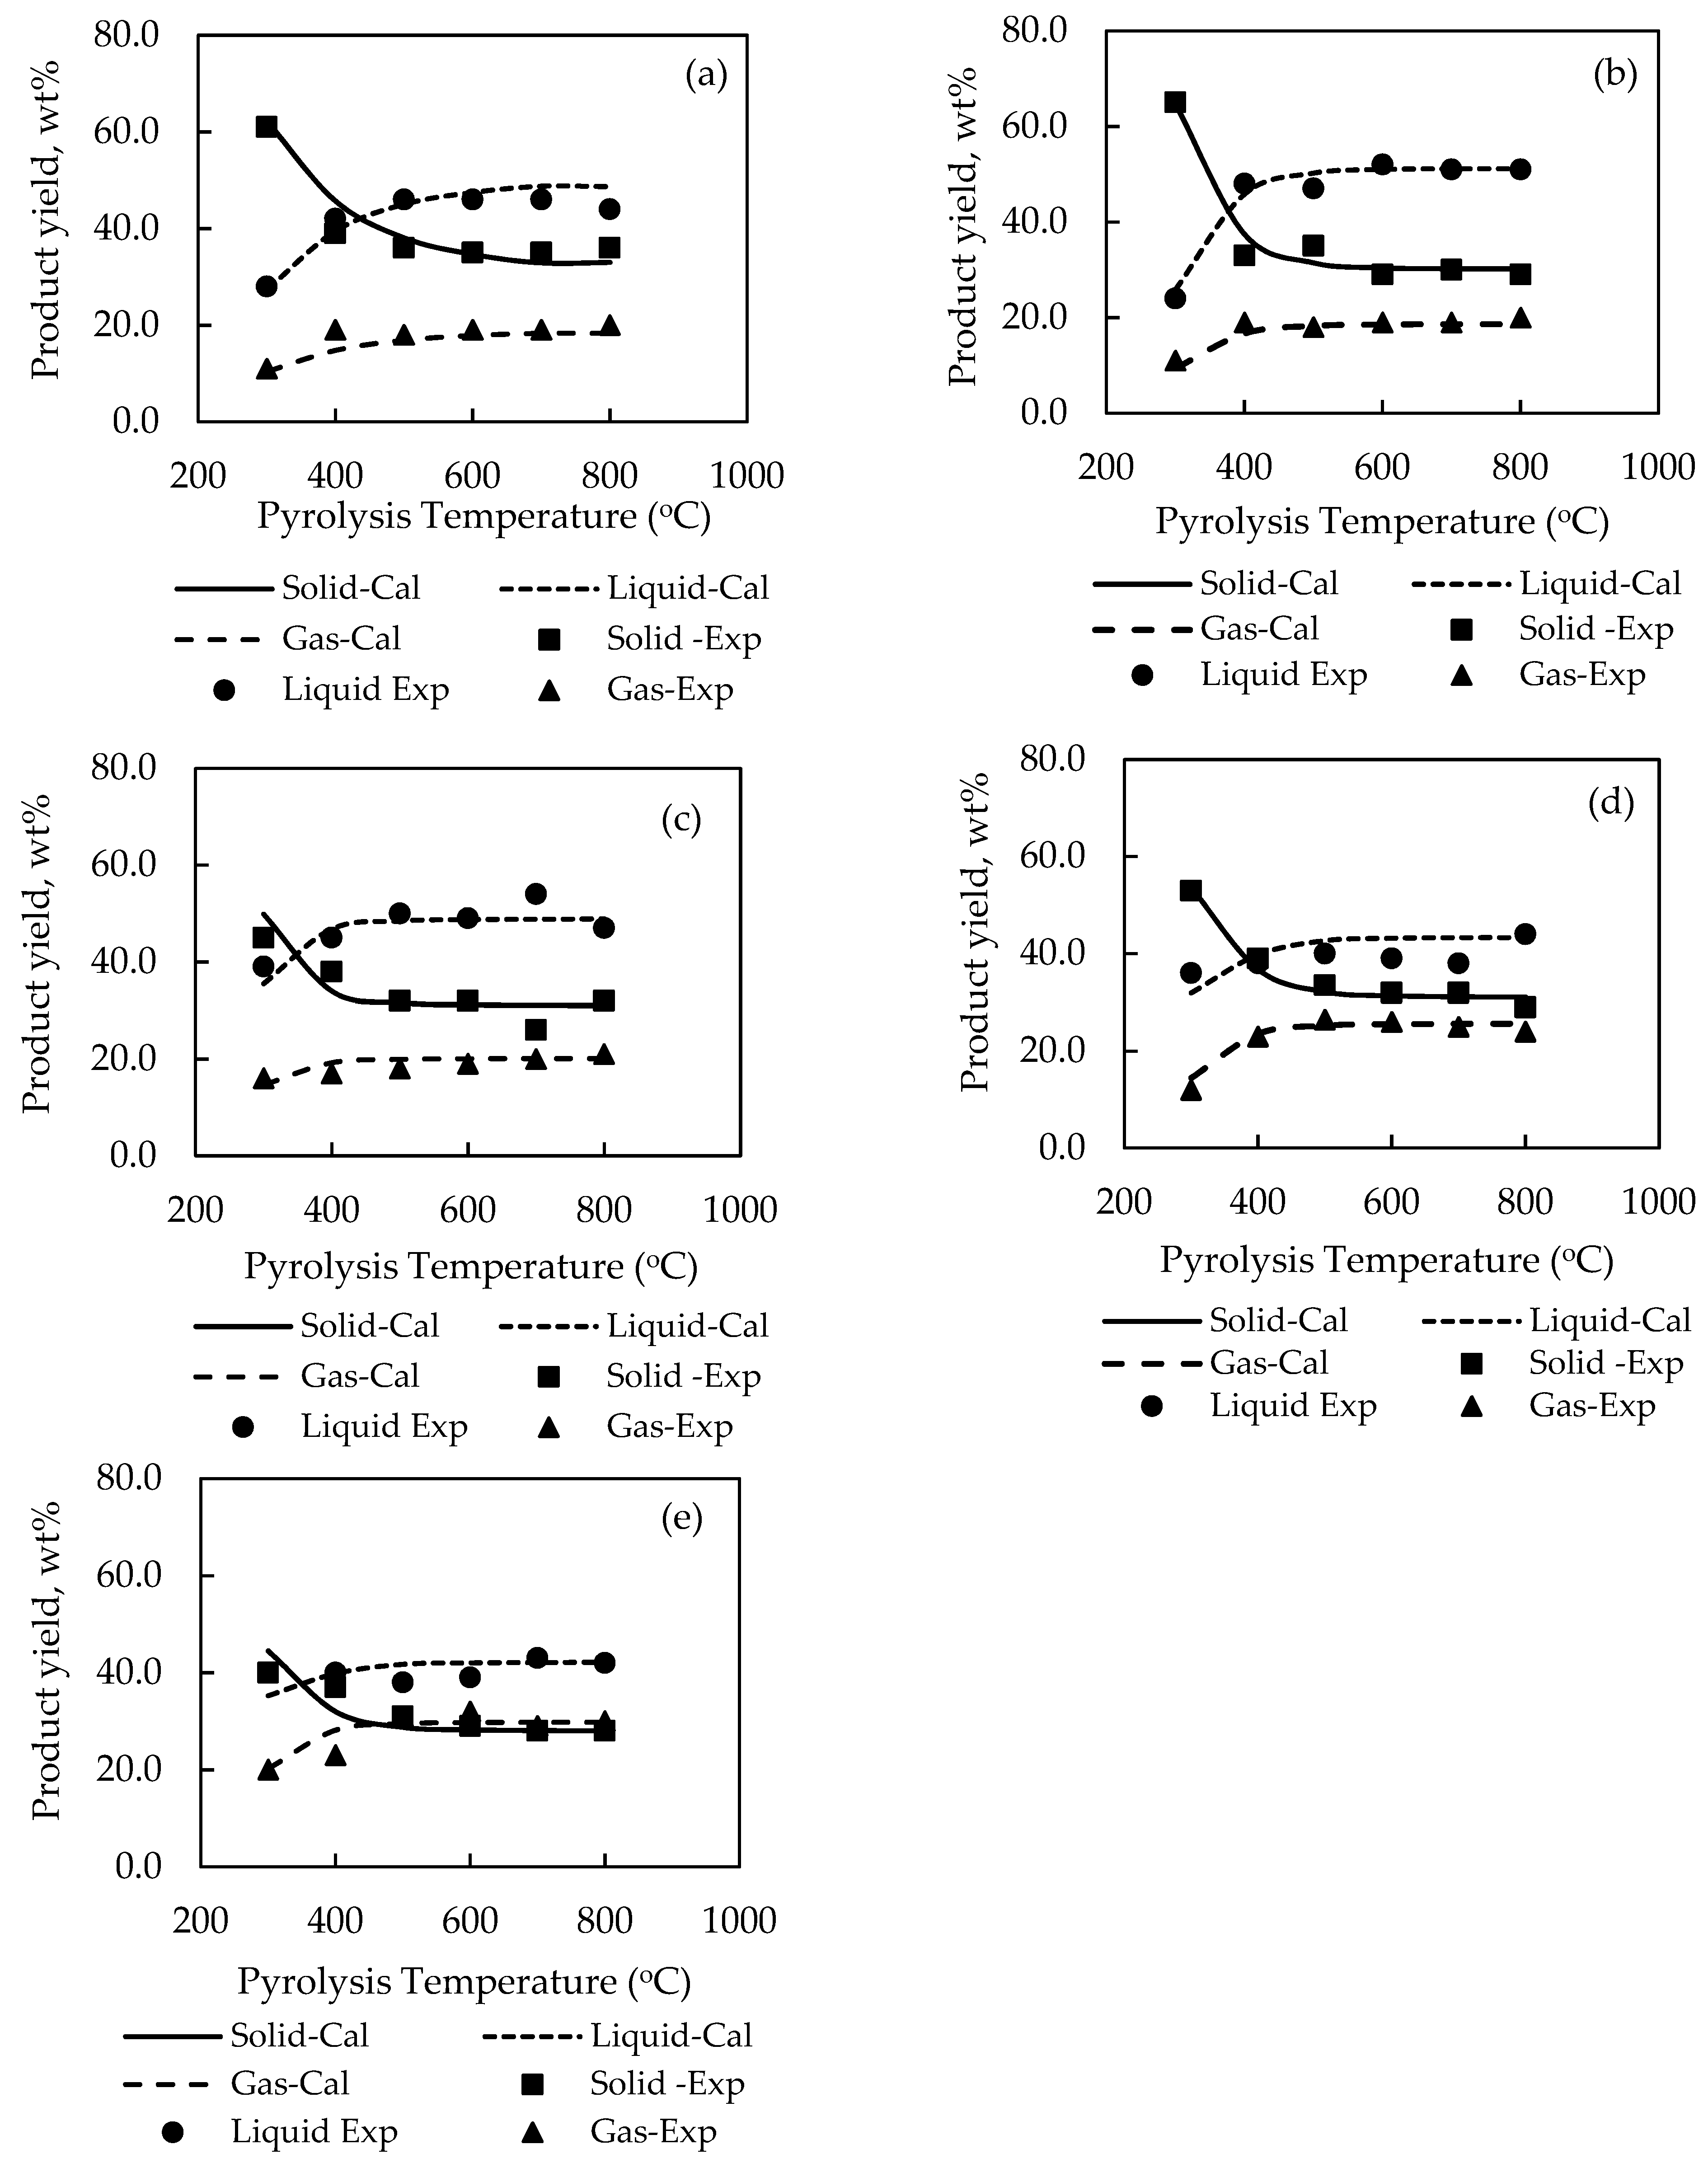
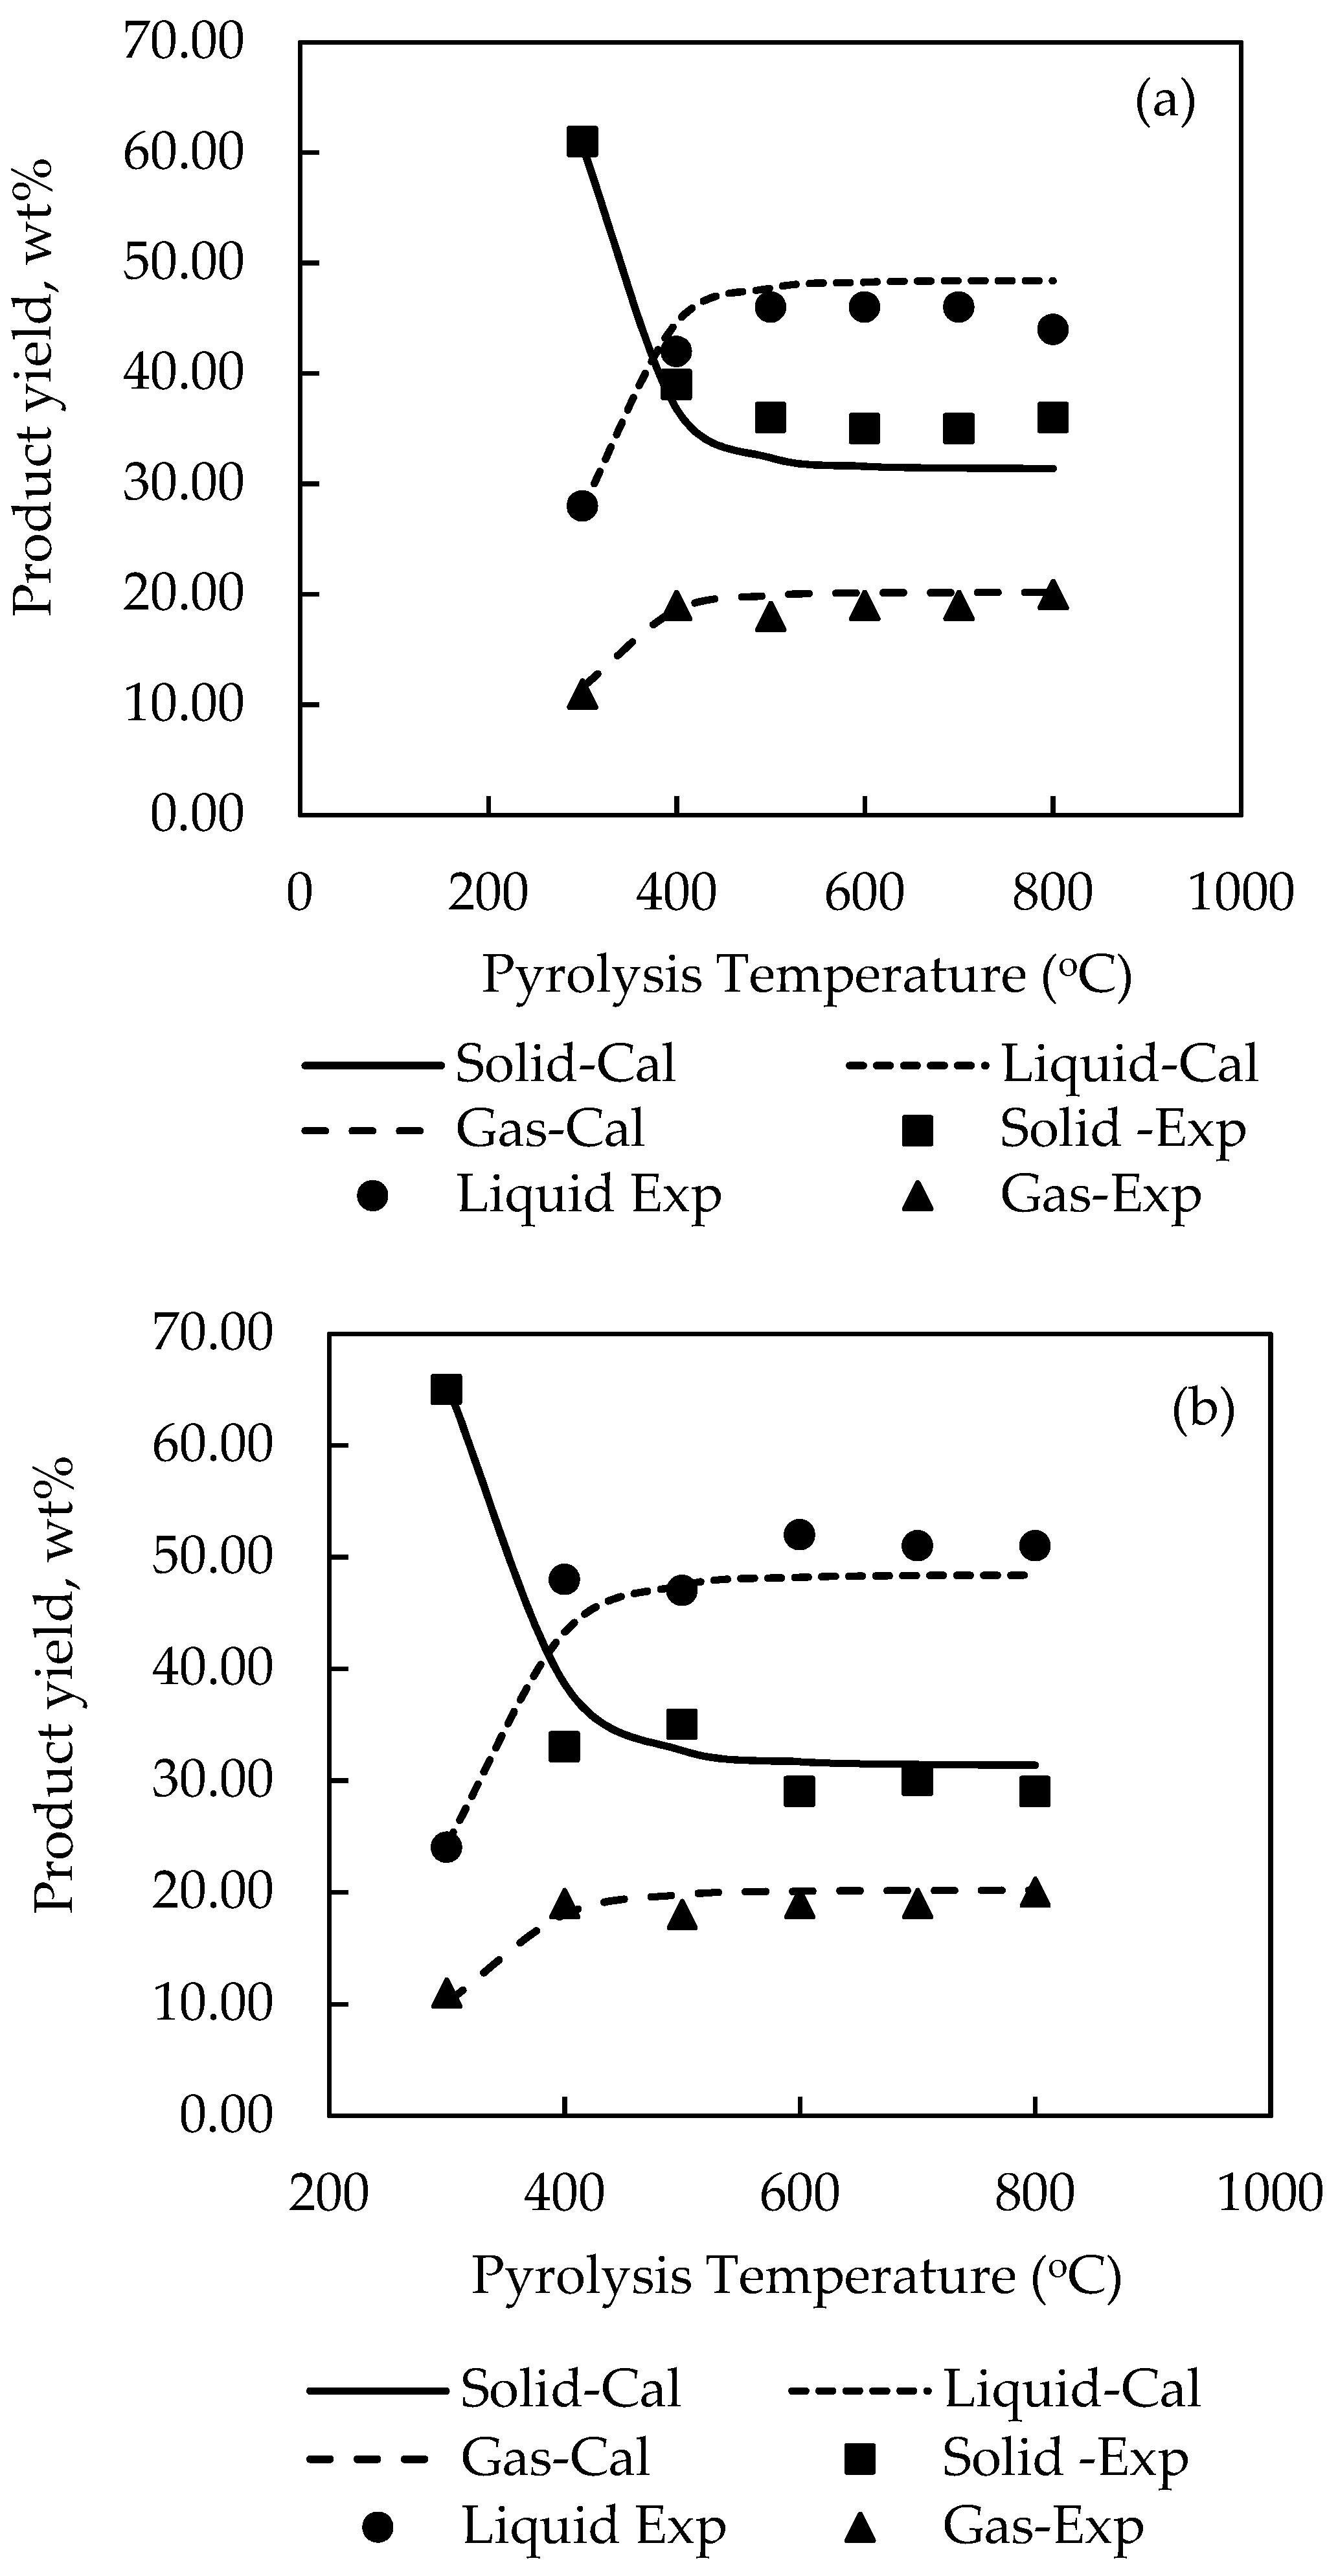
For the sake of clarity, the effect of pyrolysis temperature on the product yields is shown plotted in Figure 2. It is seen that there is a general tendency for the yield of solid char to abruptly decreased over a narrow range of temperature from 300 to 500 °C, caused by the release of low-molecular weight volatiles, and gradually decreased at higher temperatures before attaining a constant average value of about 32 wt % solid at 800 °C for all biomasses. On the contrary, the yields of liquid and gas products tended to increase steadily from 300 to 400 °C and became relatively constant at higher temperatures. It is noted that the maximum liquid yields of all biomasses varied in the range from around 42.0 to 54.0 wt % with palm kernel cake giving the highest liquid yield. The optimum temperature giving the maximum liquid yield depended on the type of biomass, being 700 °C for cassava pulp residue and palm kernel cake, and 500, 600 and 800 °C for palm shell, coconut shell and longan fruit seed, respectively. Previous works have shown that this optimum temperature was in the range of 500–800 °C for the slow pyrolysis of different biomasses [32,33,34]. It is further observed that the liquid yield was higher than the gas yield with the difference being higher for palm shell and coconut shell. Visual observation shows that the simulation program was able to predict the experimental product yields reasonably well over the temperature range studied, e.g., for biomass, etc.
Closer examination of reveals that the maximum prediction errors by the simulation are 19.5% for the solid char of PK biomass, 13.9% for the liquid products of LS biomass and 22.5% for the gas products of CP biomass. The overall average error for predicting the yields of solid, liquid, and gas products was 6.02%, 5.45%, and 7.03%, respectively. Overall, the relatively low values of sum-square-error (SSE) in the range of 0.0887–0.1258 and with about 78% of the total data having an error less than 10% substantiate that the simulation model proposed in this study was capable of describing the thermal decomposition characteristics of the tested biomass in a packed-bed reactor within acceptable accuracy.
The pre-exponential factor (A), shown in Table 3, was found to be insensitive to the type of biomass, and the pyrolysis temperature and the best constant value of 7 × 10⁶ s−1 was, thus, employed. The activation energy € derived from the simulation had the values of 8.0 × 10⁴, 7.9 × 10⁴, 7.4 × 10⁴, 7.6 × 10⁴ and 7.8 × 10
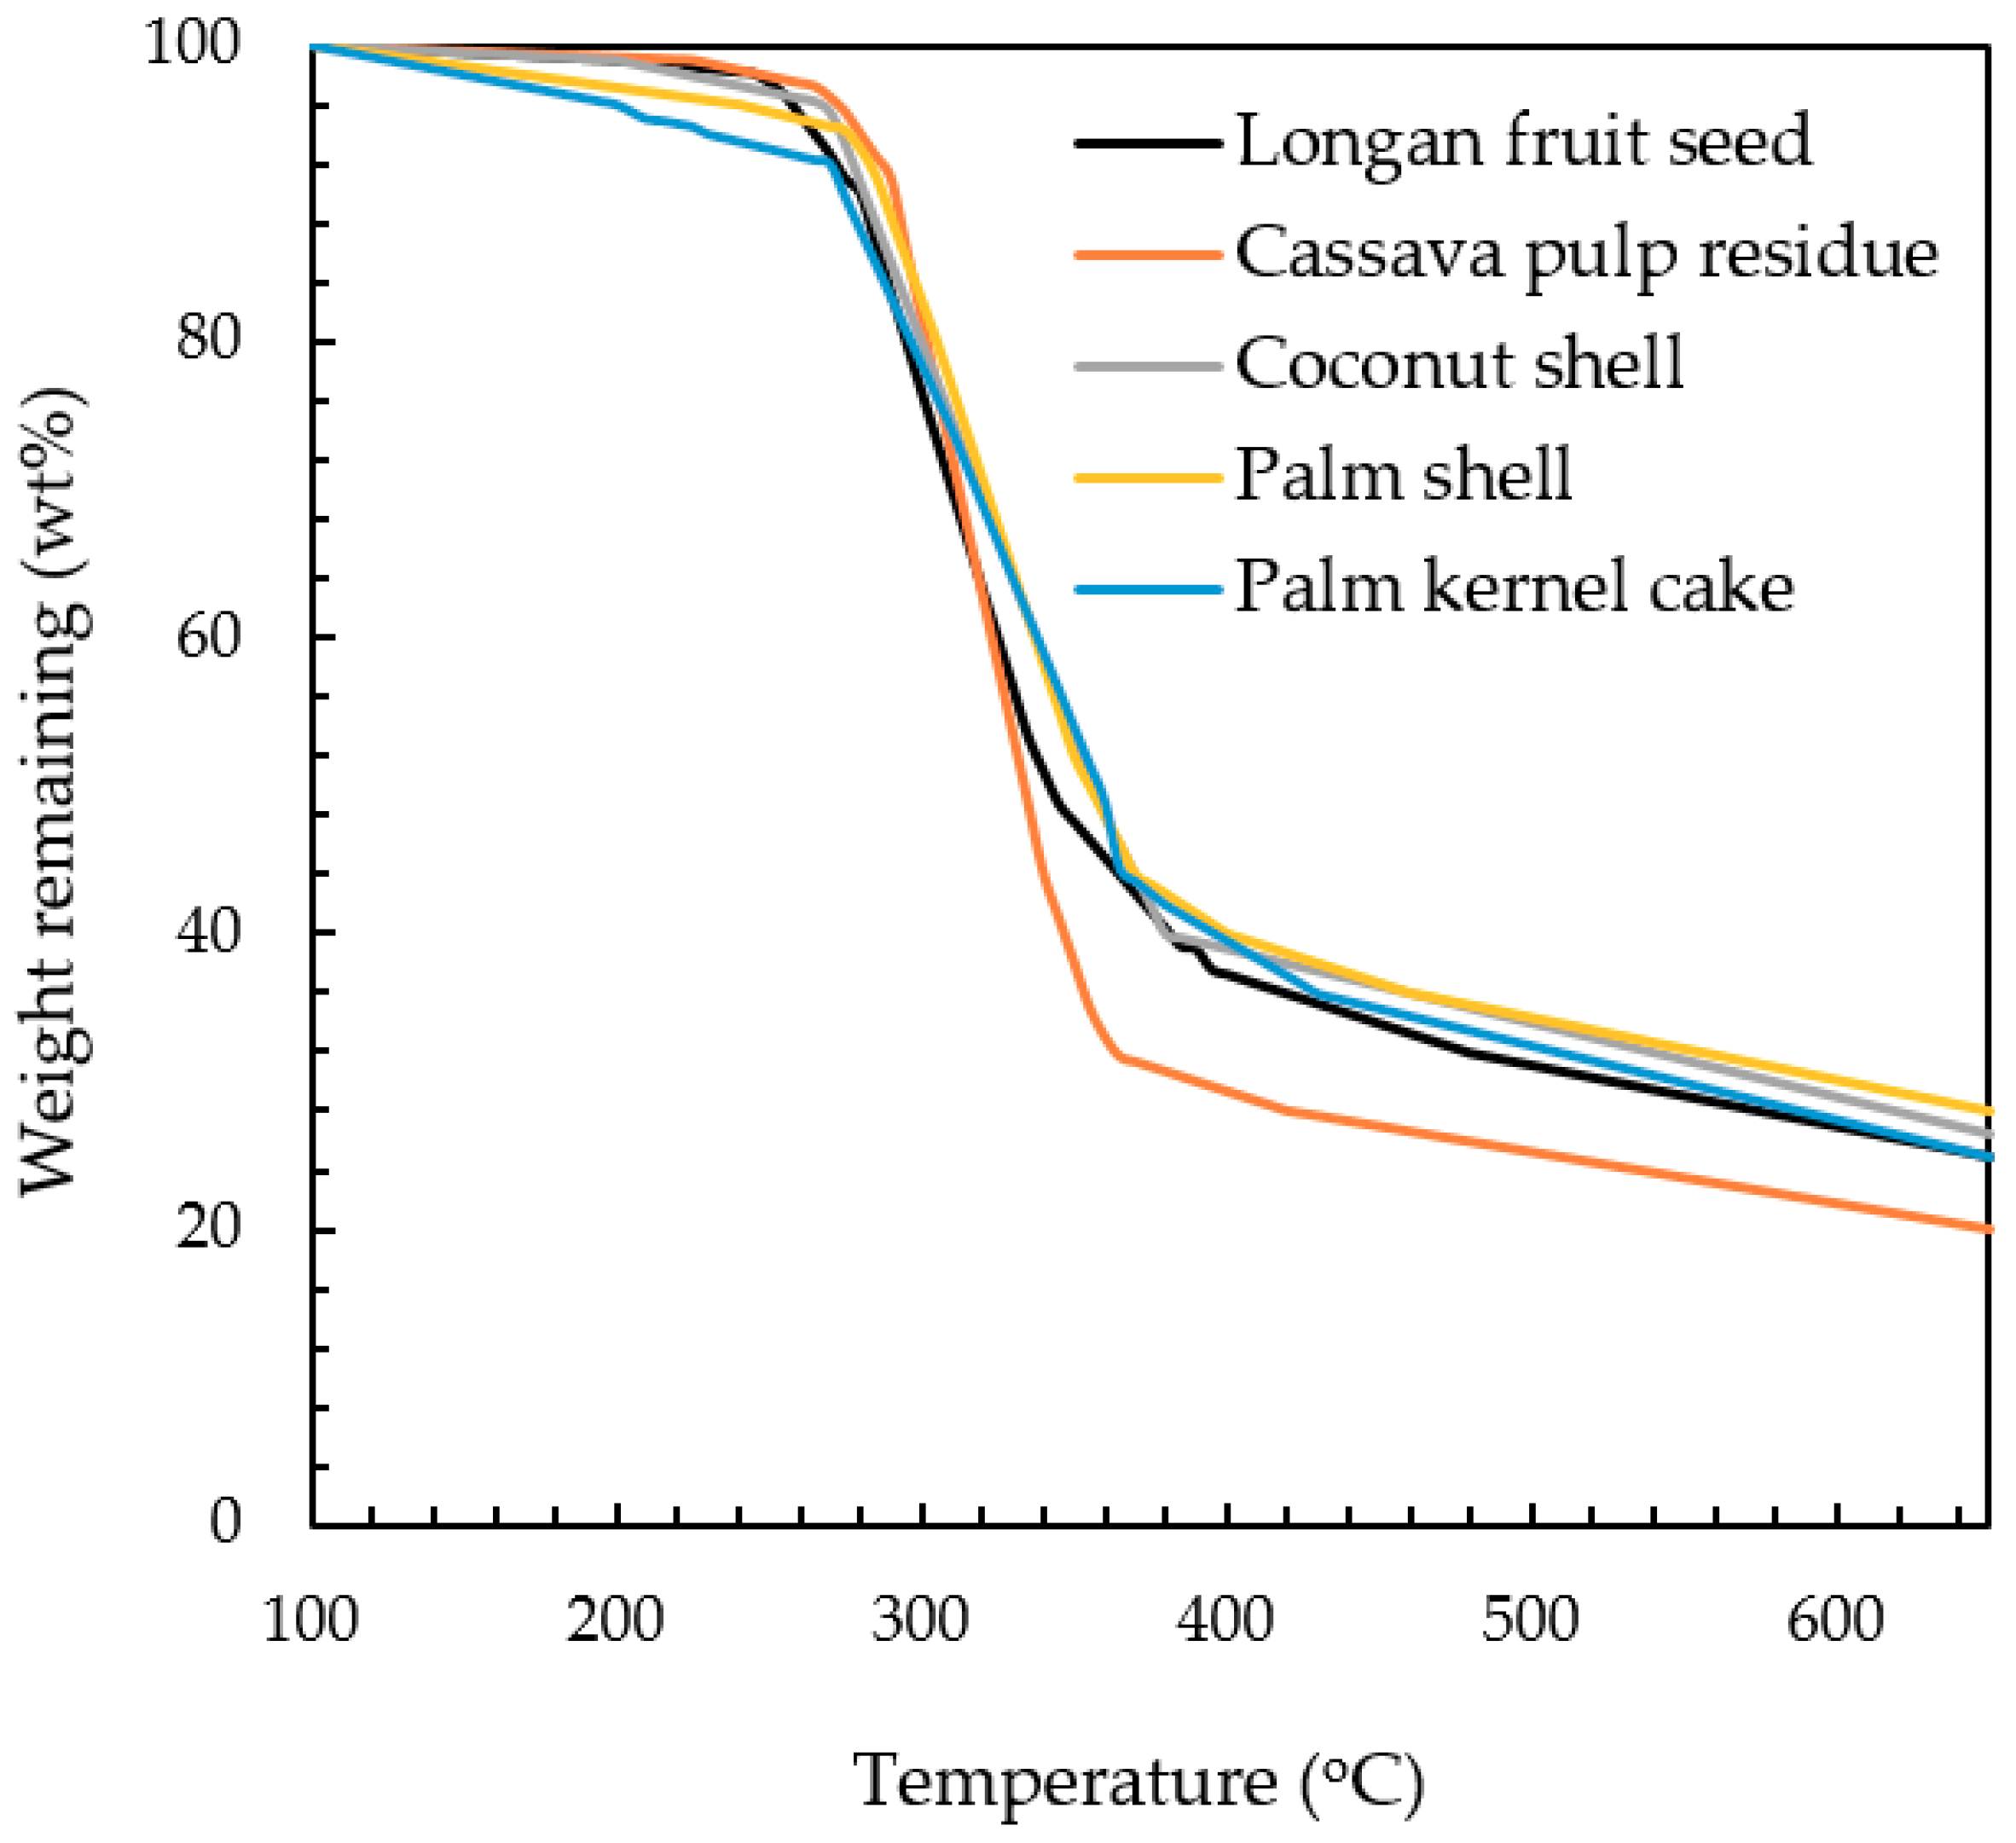
⁴ J/mol for palm shell, coconut shell, palm kernel, cassava pulp residue and longan fruit seed, respectively. The value of activation energy indicates the minimum energy barrier required for the initiation of a reaction, or it is a measure of chemical reactivity of a substance. Based on this argument, palm kernel cake is considered to be most reactive (lowest activation energy), while the palm shell is the least reactive. Another evidence concerning the biomass reactivity can be observed from TGA curves as displayed in Figure 3. The minimum temperature at which the biomass starts to decompose can be defined here as the temperature corresponding to the weight remaining of 90% or designated as Td. The lower this threshold temperature is, the easier for the reaction to occur. The determination of Td gave the following order: Td,PK (270 °C) < Td,PS (280 °C) < Td,LS (285 °C) < Td,CS (287 °C) < Td,CP (290 °C). Although this temperature order does not exactly match that of the activation energy (PK < CP < LS < CS < PS), it can be qualitatively inferred that palm kernel is most reactive with reference to the decomposition reaction.
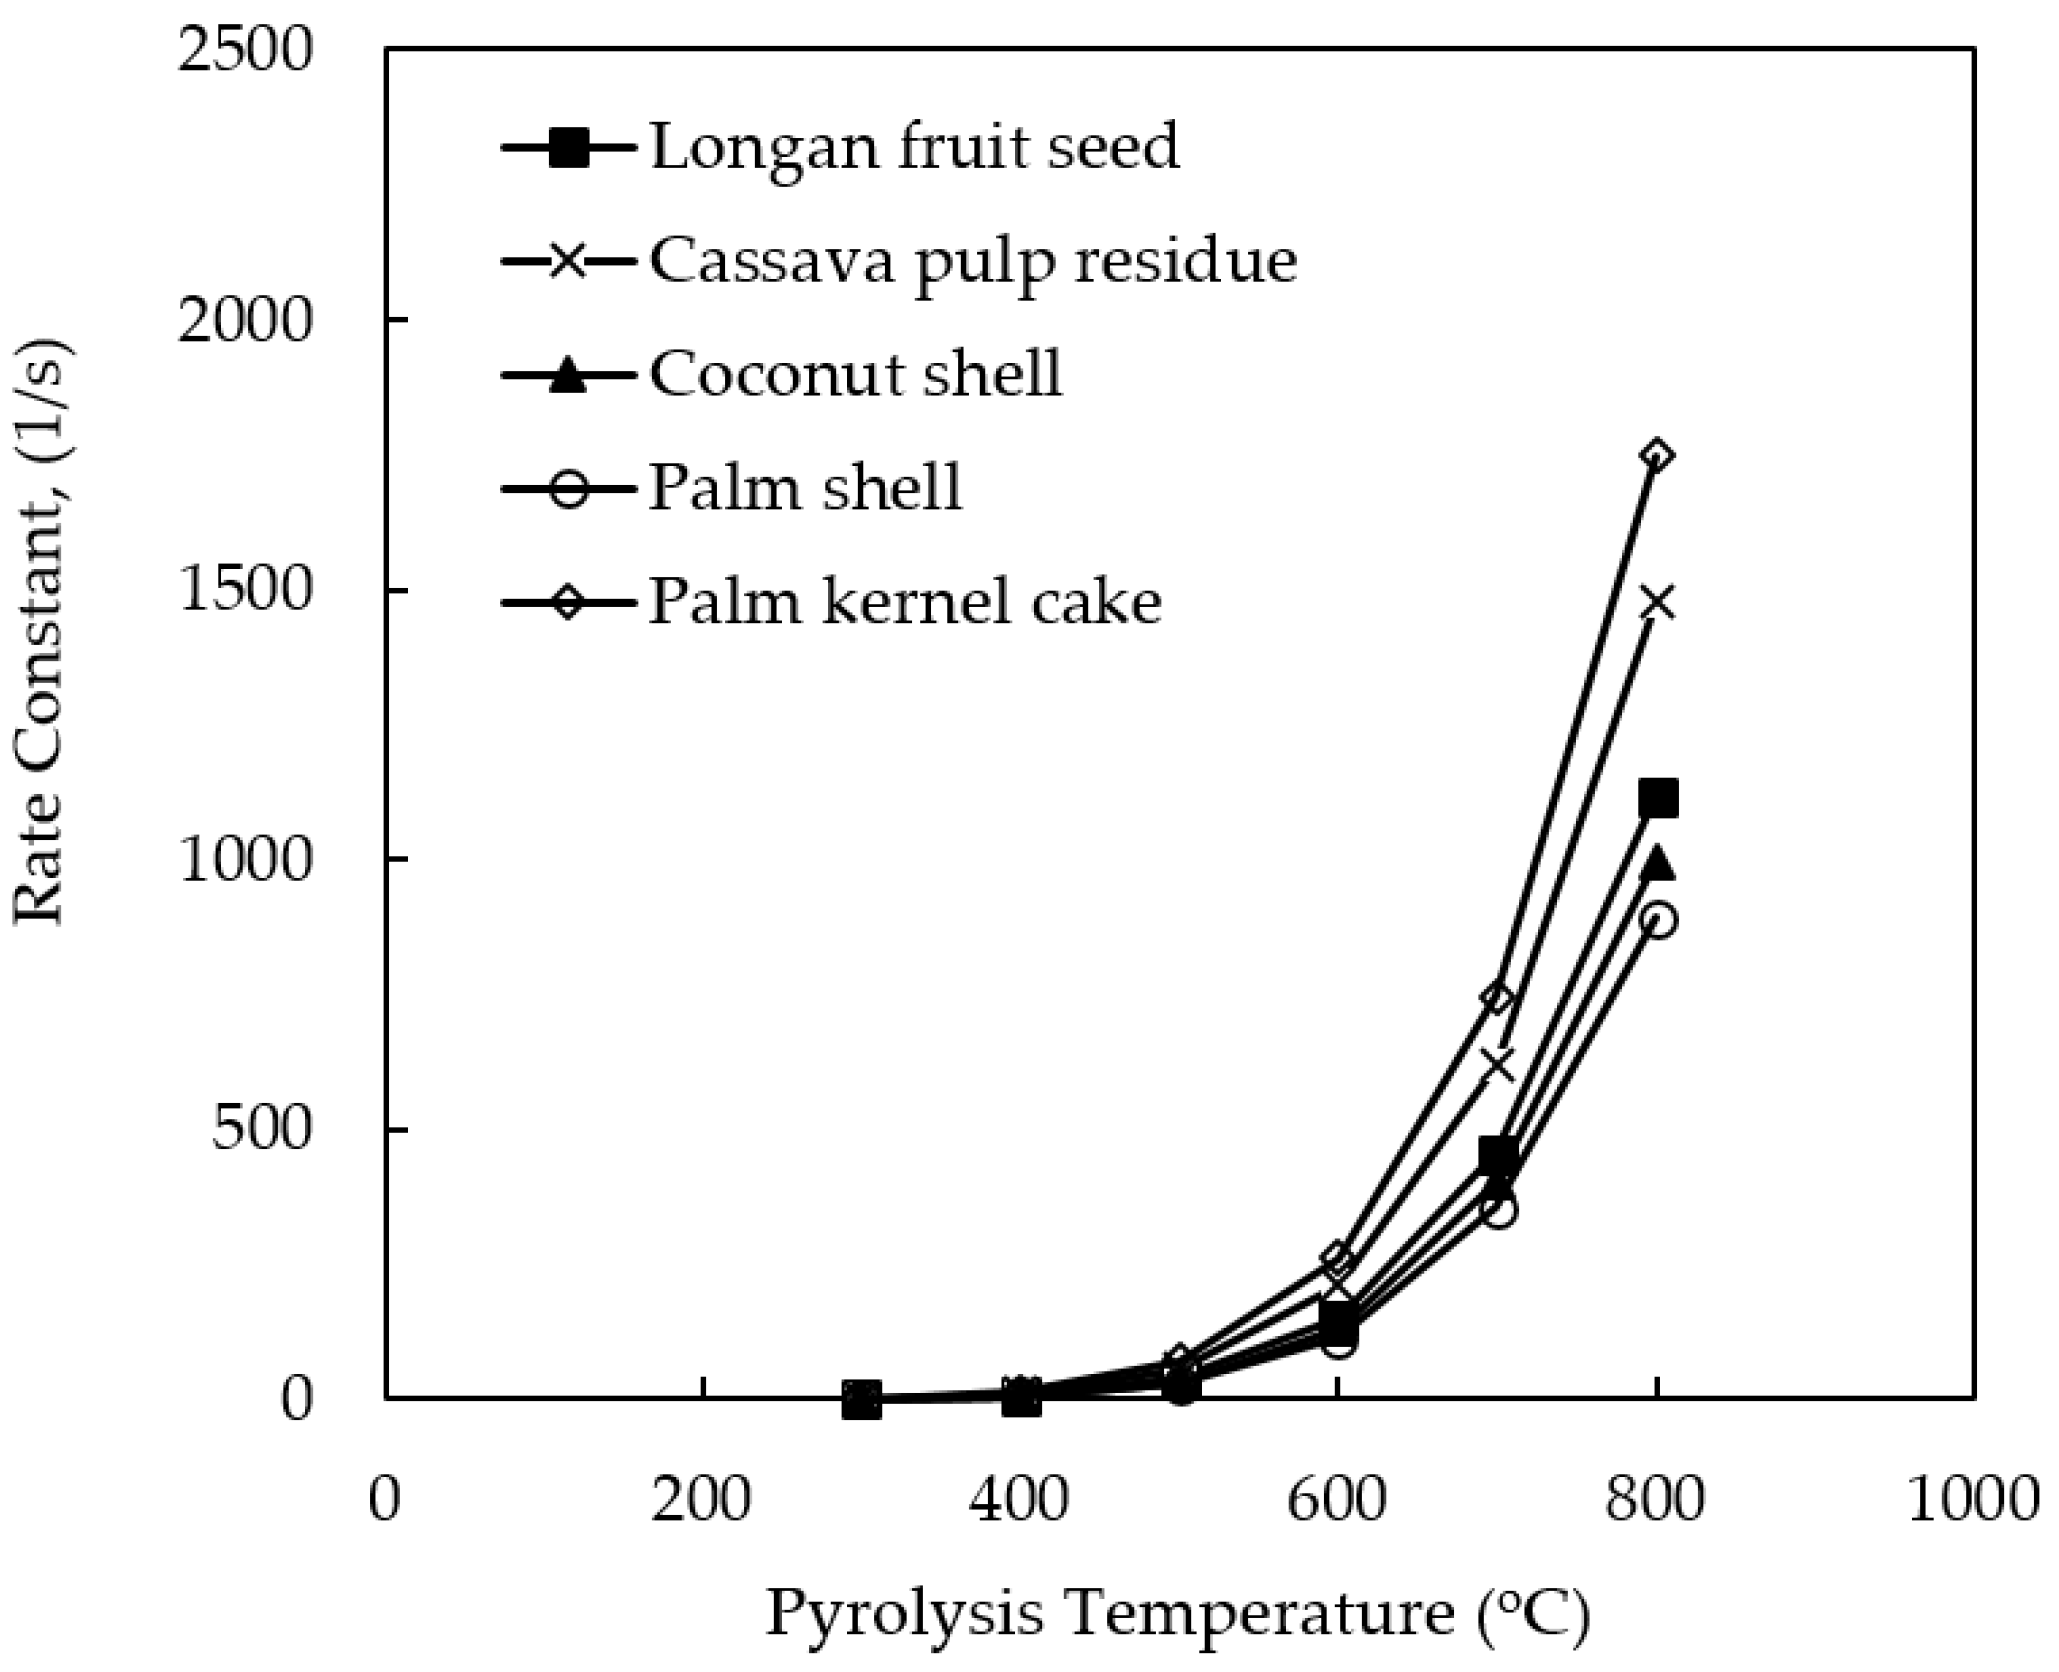
Figure 4 shows the effect of pyrolysis temperature on the rate constant (k) for the decomposition reaction of all biomasses studied. The rate constant (k) increased in an exponential fashion with the increase in the pyrolysis temperature as expected. This is because the decomposition reaction is an endothermic process. It is further noticed that kPK > kCP > kLS > kCS > kPS which is in reverse order as compared to that of the activation energy of the pyrolysis reaction. That is, the chemical reaction of a low-activation energy process can proceed at a faster rate. The values of the rate constant (k) can be compared with those of previous investigators at 500 °C, although the actual pyrolysis conditions were not the same. For example, k for CP = 1.12 s−1 [25], k for PS = 3.59 s−1 [35], and k for PK = 1303 s−1 [35], calculated based on their reported values of the pre-exponential factor (A) and the activation ener€(E). It is noted that these numbers fall within the range of k values for each biomass, as reported in Table 3.
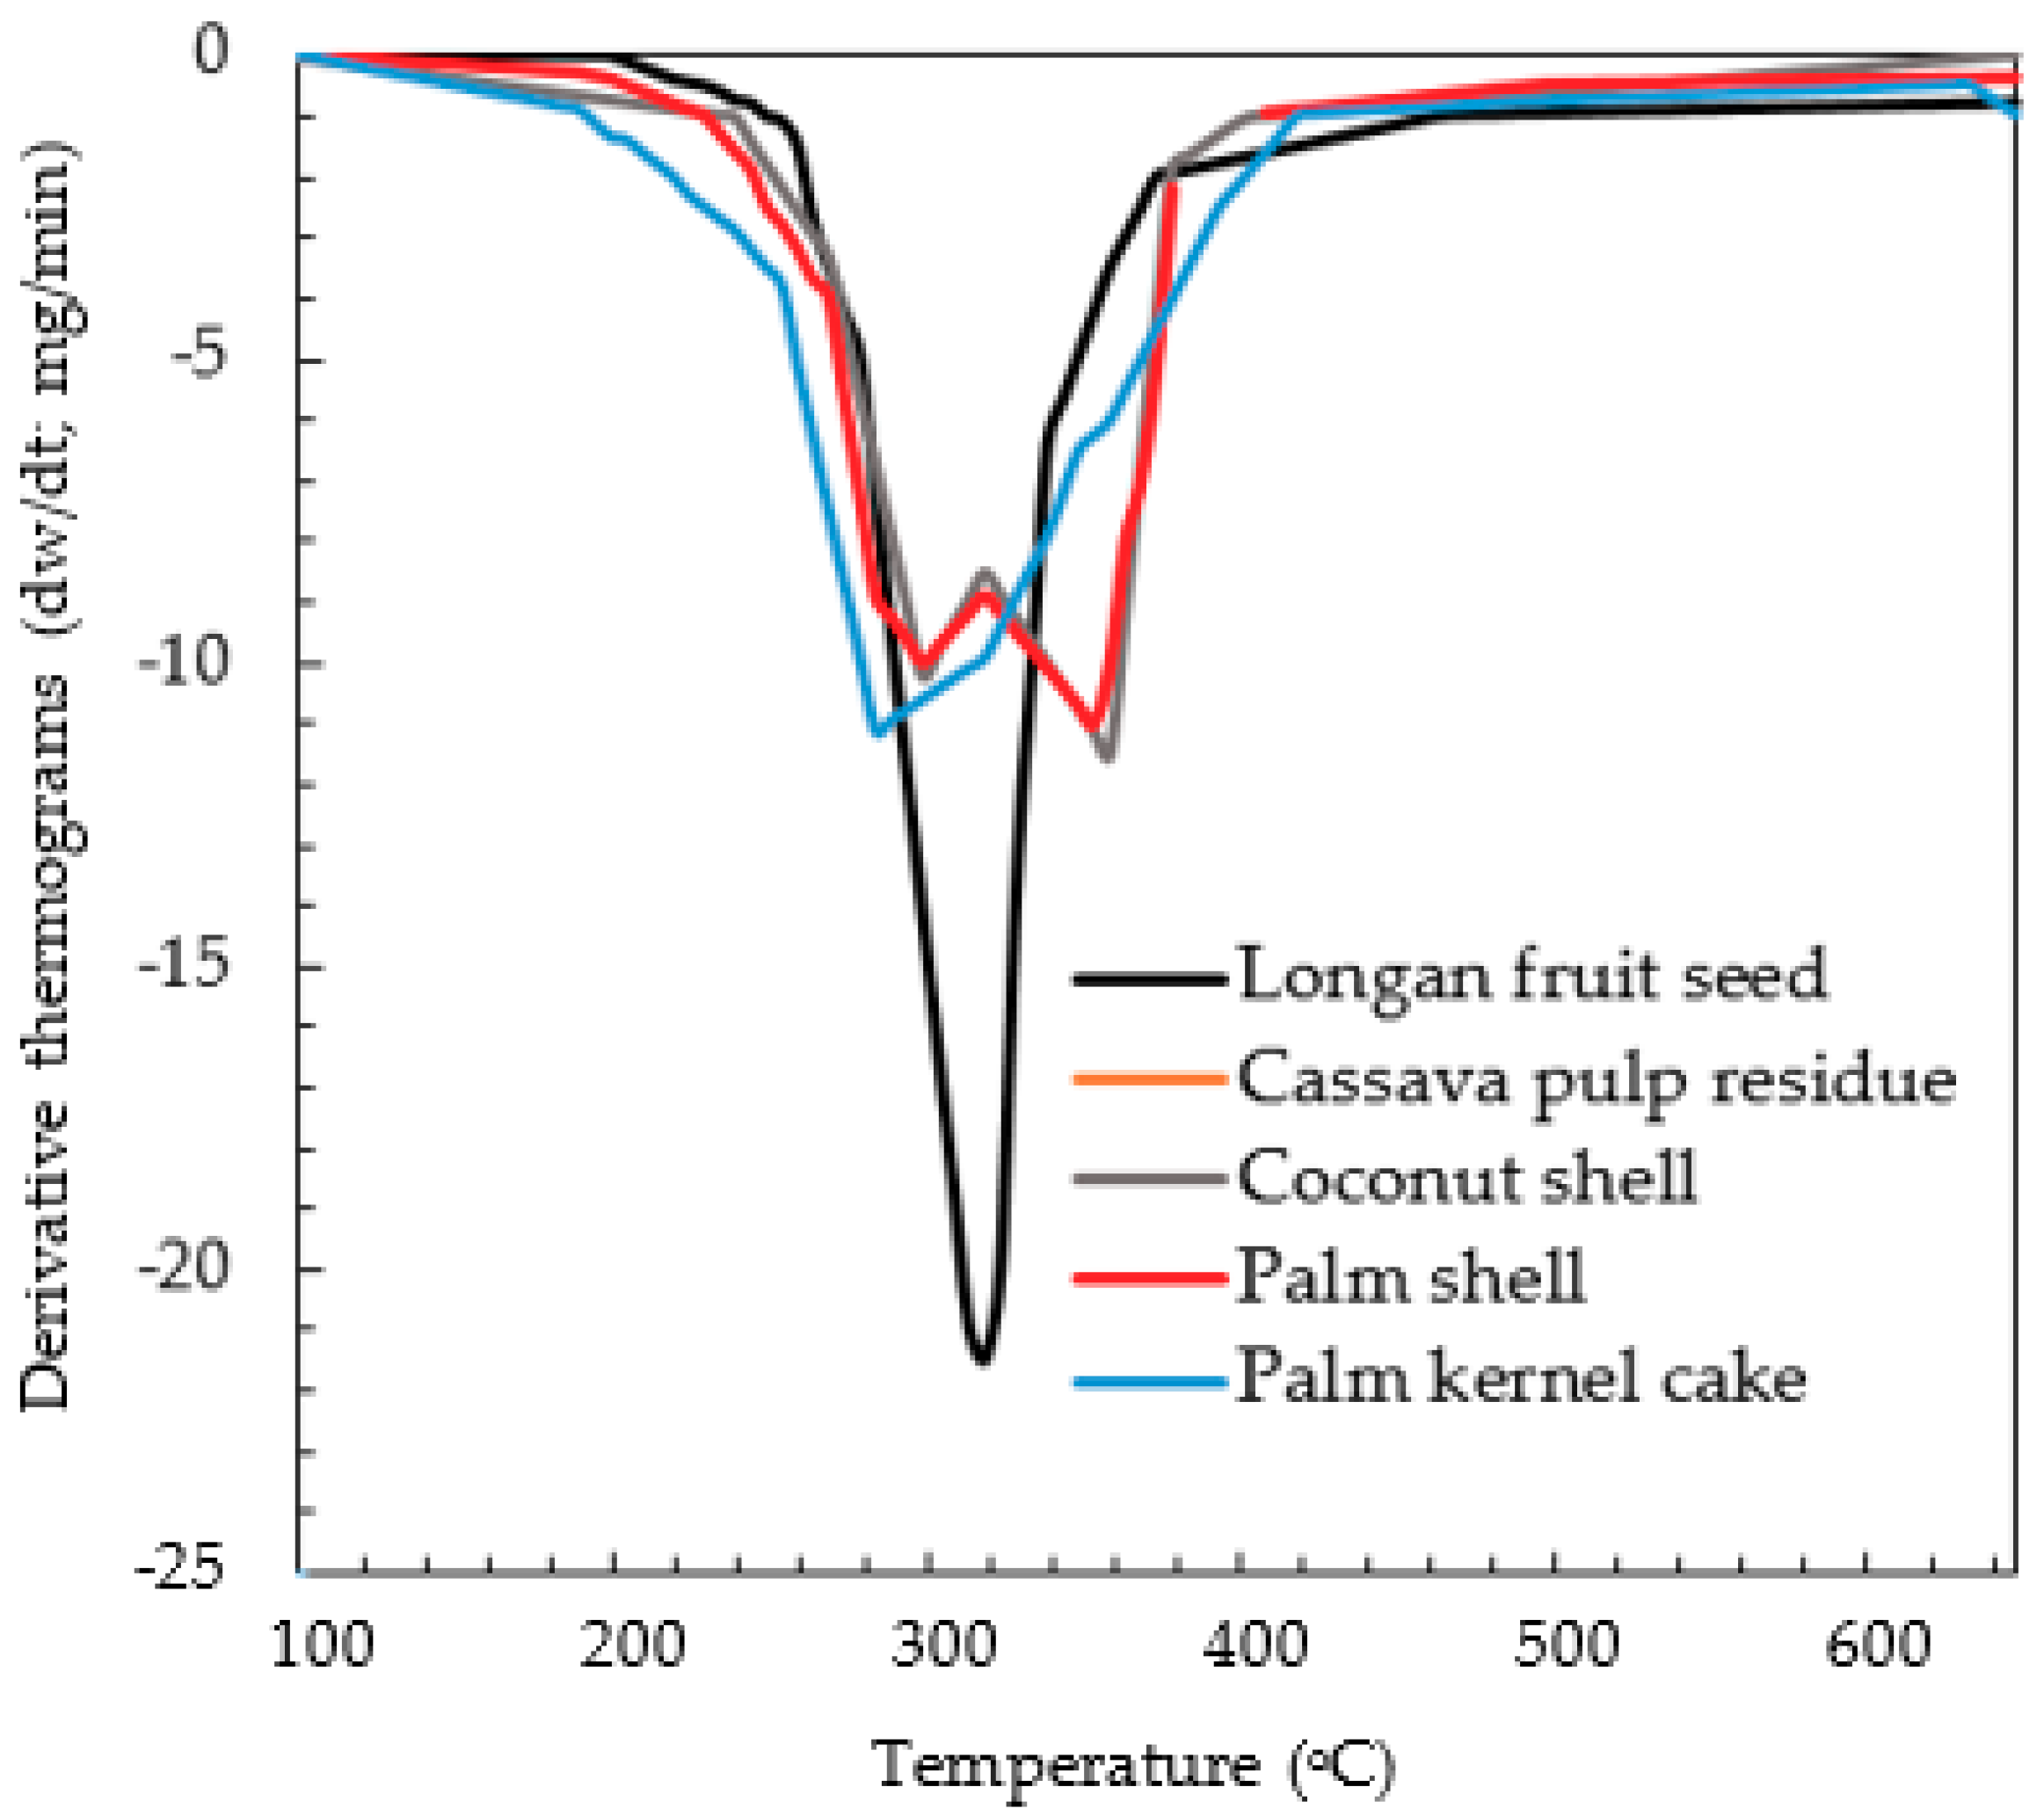
It is generally known that the pyrolysis behavior of biomass is highly complex, resulting from different decomposition rates and behavior of its cellulosic components, as well as a large number of secondary reactions among the released products [36,37]. The difference in the decomposition behavior of different biomasses is manifested in the derivative thermogravimetry (DTG) curves, as shown in Figure 5. Palm shell and coconut shell, which are hard and dense, show a distinct two-peak curve, while cassava pulp residue, palm kernel cake and longan seed, which are much softer, exhibit a single-peak characteristic curve. Based on this distinct decomposition behavior, it was, thus, decided to run the simulation program by using two separate chemical formulae (biomass structure) for these two groups of biomasses. They are C4.33H6.26O2.56 for palm shell and coconut shell (model G01) and C3.63H6.18O3.04 for palm kernel cake, cassava pulp residue and longan fruit seed (model G02). The atomic ratio numbers for carbon, hydrogen and oxygen representing the chemical formulae for G01 and G02 were estimated by averaging the atomic ratio numbers of the respective biomasses in each biomass group. For example, the number 4.33 for the carbon of model G01 was calculated from (4.11 + 4.55)/2 = 4.33, where the numbers 4.11 and 4.55 are the atomic mole numbers of palm shell (PS) and coconut shell (CS) from Table 1, respectively. The reason for trying this simulation approach is an attempt to generalize the simulation of biomass pyrolysis based on the differences in the thermal decomposition behavior of biomass, as reflected in the DTG curves.
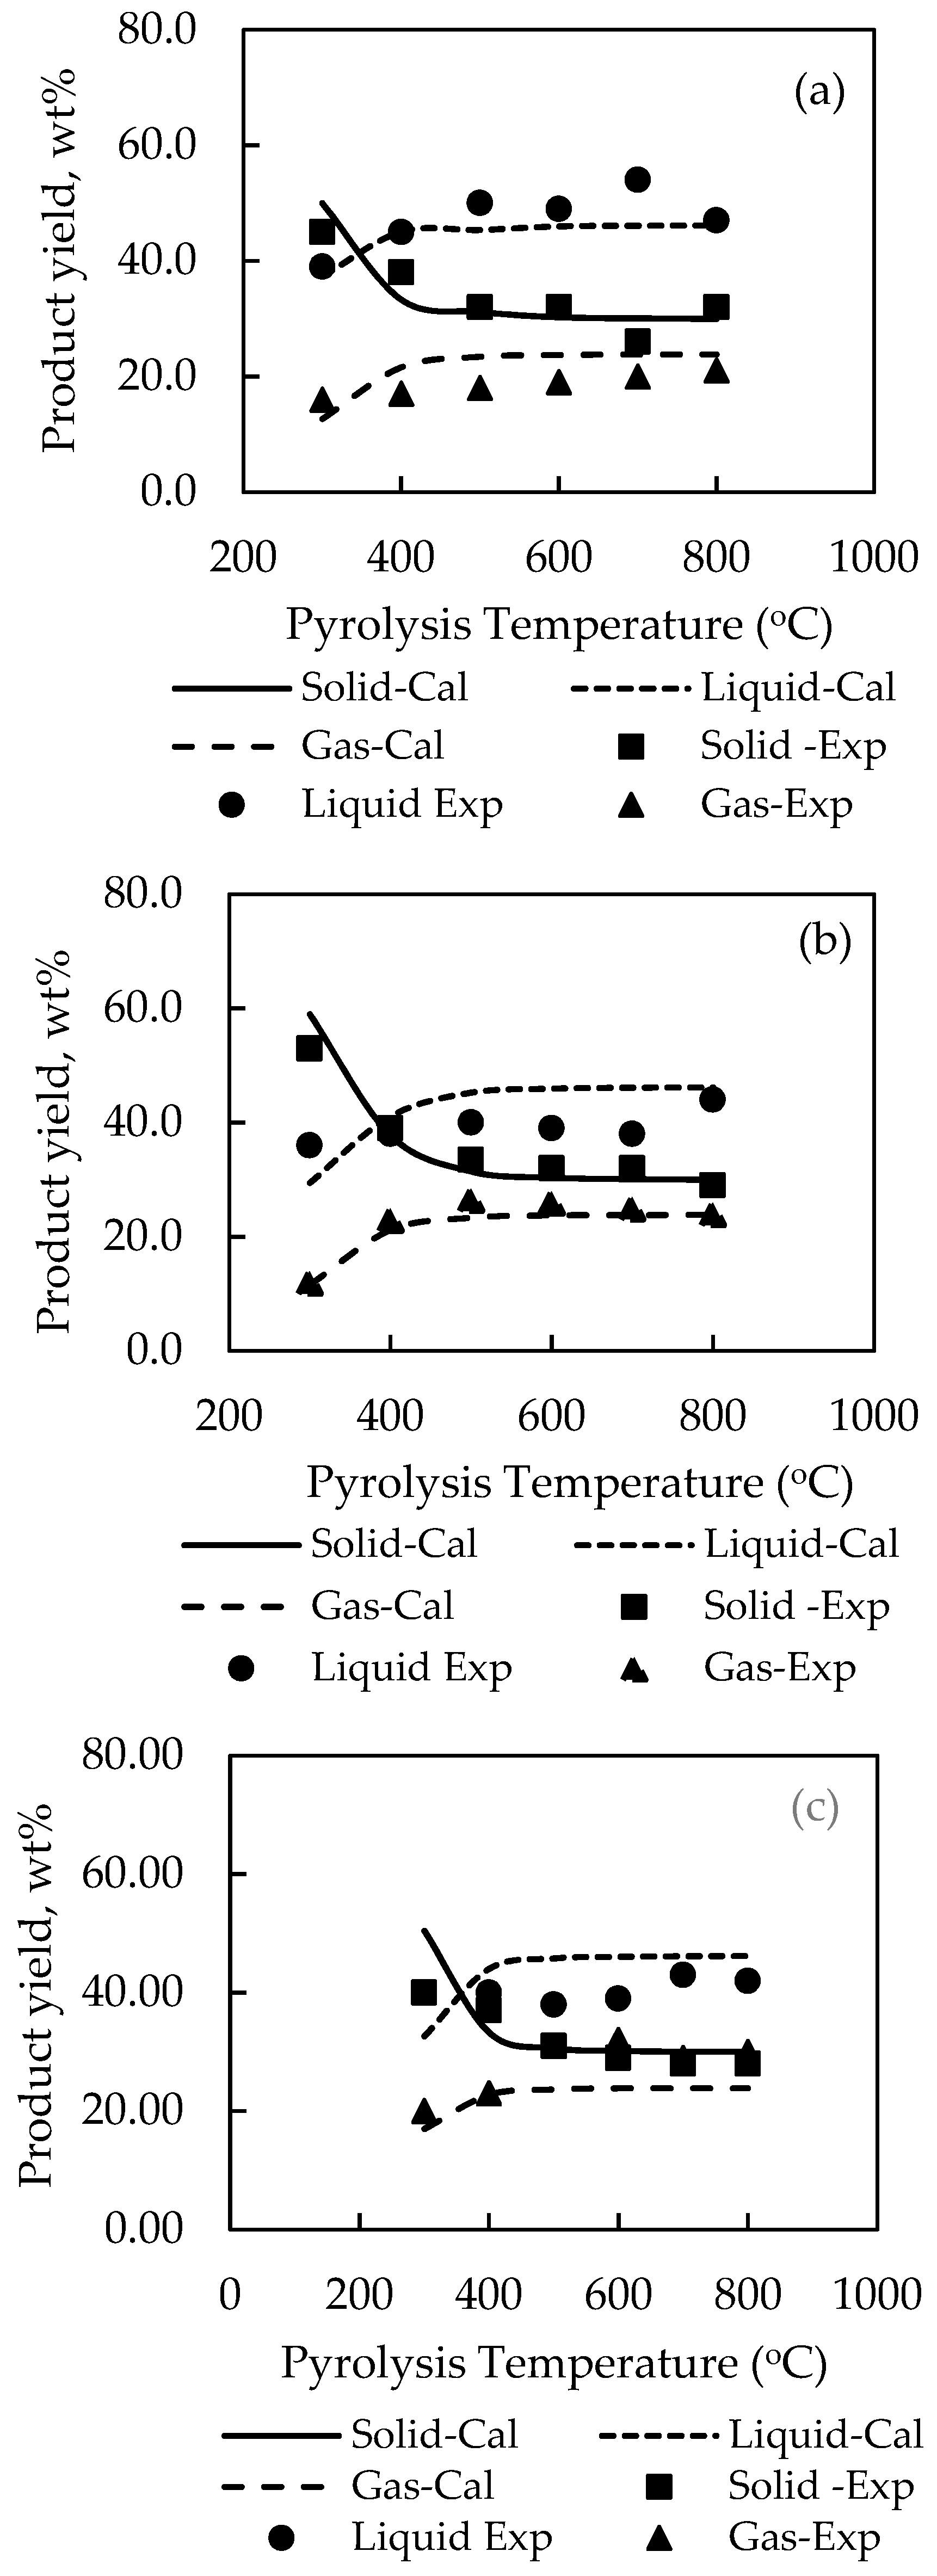
Table 4 shows the optimum set of stoichiometry derived for model G01 and model G02 and Figure 6; Figure 7 compares the experimental and computed product yields. It is visually observed that the simulation program is able to predict the correct effect of temperature on the product yields. The general agreement between the simulated and experimental results is satisfactory, although relatively large errors exist for the prediction of liquid yields for palm kernel cake and cassava pulp residue. The SSE were found for model G01 to be 0.1120 for palm shell (cf. 0.1065 for P01) and 0.0983 for coconut shell (cf. 0.0877 for P02), and for model G02 to be 0.4215 for palm kernel cake (cf. 0.1253 for P03), 0.4427 for cassava pulp residue (cf. 0.1258 for P04) and 0.1093 for longan fruit seed (cf. 0.1117 for P05). The pre-exponential factor (A) was kept constant as 7 × 10⁶ (s−1) as in the previous cases. The optimum values of activation energy were 7.8 × 10⁴, 8.0 × 10⁴, 7.9 × 10⁴, 7.45 × 10⁴ and 8.0 × 10⁴ J/mol for palm shell, coconut shell, palm kernel cake, cassava pulp residue and longan fruit seed, respectively.
Next, the simulation scheme proposed in this work for the modelling of biomass pyrolysis using the COCO simulation program was extended to the analysis of previous works on the slow pyrolysis of various biomasses. The systems selected were based on the same mode of slow pyrolysis and same types of biomass used in the present study. Table 5 summarizes the results using models P01–P04, with the respective stoichiometric numbers and kinetic parameters being obtained from Table 2 and Table 3, respectively. Table 6 presents the analysis of error of simulated results in Table 5. Overall, the simulation does not give good predictive results for all pyrolysis products, although Table 5 shows the correct trend for the effect of temperature on the product yields. The sum of squared errors (SSE) of estimation for P01–P04 is much larger than those reported in Table 3. The percentage error for predicting the yield of each pyrolysis product (solid, liquid and gas) varies rather widely, and the maximum error is relatively large, particularly for the gas products. However, the prediction of liquid and solid yields by the simulation program seems to be reasonable, considering the overall average error of around 10.4% and with about 89% of the simulated results being within ±20% error range. In view of the biomass precursors (P01–P04) and from the values of average percentage error, the approximate order of decreasing predictive accuracy for the yields of solid and liquid products (excluding gas yields) is as follows: P01 (PS) > P02 (CS) > P03 (PK) > P04 (CP). The relatively large discrepancies between the experimental and simulated product yields could be due to the differences in the pyrolysis conditions, for example, heating rate, particle size, chemical properties of the biomass, etc.
To improve the simulation accuracy, it is proposed that there should be an optimum set of kinetic parameters (A and E) and stoichiometry numbers (a to q) pertaining to a specific pyrolysis condition. To test this hypothesis, the pyrolysis data of Abdul Rahman (2016) [40] in Table 5 were directly used in the simulation to search for the optimum set of model parameters and the results on product yields calculated. The calculated optimum stoichiometric numbers are presented in Table 7, while the computed rate constants and the product yields are listed in Table 8. As compared with the results in Table 5, it is seen that the simulation capability improves considerably, notably for the gas product yields. The average percentage error of model prediction on product yields over the temperature range of 300–500 °C decreases for the solid, liquid and gas products from 8.1 to 5.3%, 3.8 to 3.1% and 45.4 to 20.6% for the solid, liquid and gas products, respectively. It is, therefore, concluded that the prediction of product yields from the slow pyrolysis of biomass using the COCO simulator is most accurate for a particular set of pyrolysis condition. However, the simulation program can still be applied for the prediction of pyrolysis behavior of the biomass under pyrolysis conditions differing from those used in the simulation, but with a certain loss of prediction accuracy.
Next, the results on liquid and gas product compositions generated from the simulation program are presented. Table 9 shows the typical comparison of experimental and simulated compositions of gas and liquid products from the pyrolysis of cassava pulp residue and palm kernel cake at 500 °C. The simulation program could predict the compositions of the four gas products fairly well with an overall average error of about 55%, as compared to the experimental results. Furthermore, the simulation could predict the correct proportions of the gas contents as in the following order, CO2 > CO > CH4 > H2. It is further observed that the prediction accuracy by the simulation for the liquid product compositions is not as good as that for the gas compositions, but the error of prediction is quite random. To improve the model capability for better prediction of both the product yields and compositions, the program algorithm needs to be modified that involves the minimization of the objective function of SSE for both the product yields and compositions. Due to a large number of chemicals presenting in the liquid bio-oil products, it may be necessary to limit the liquid compositions to some major compounds, possibly the group of oxygenated compounds.
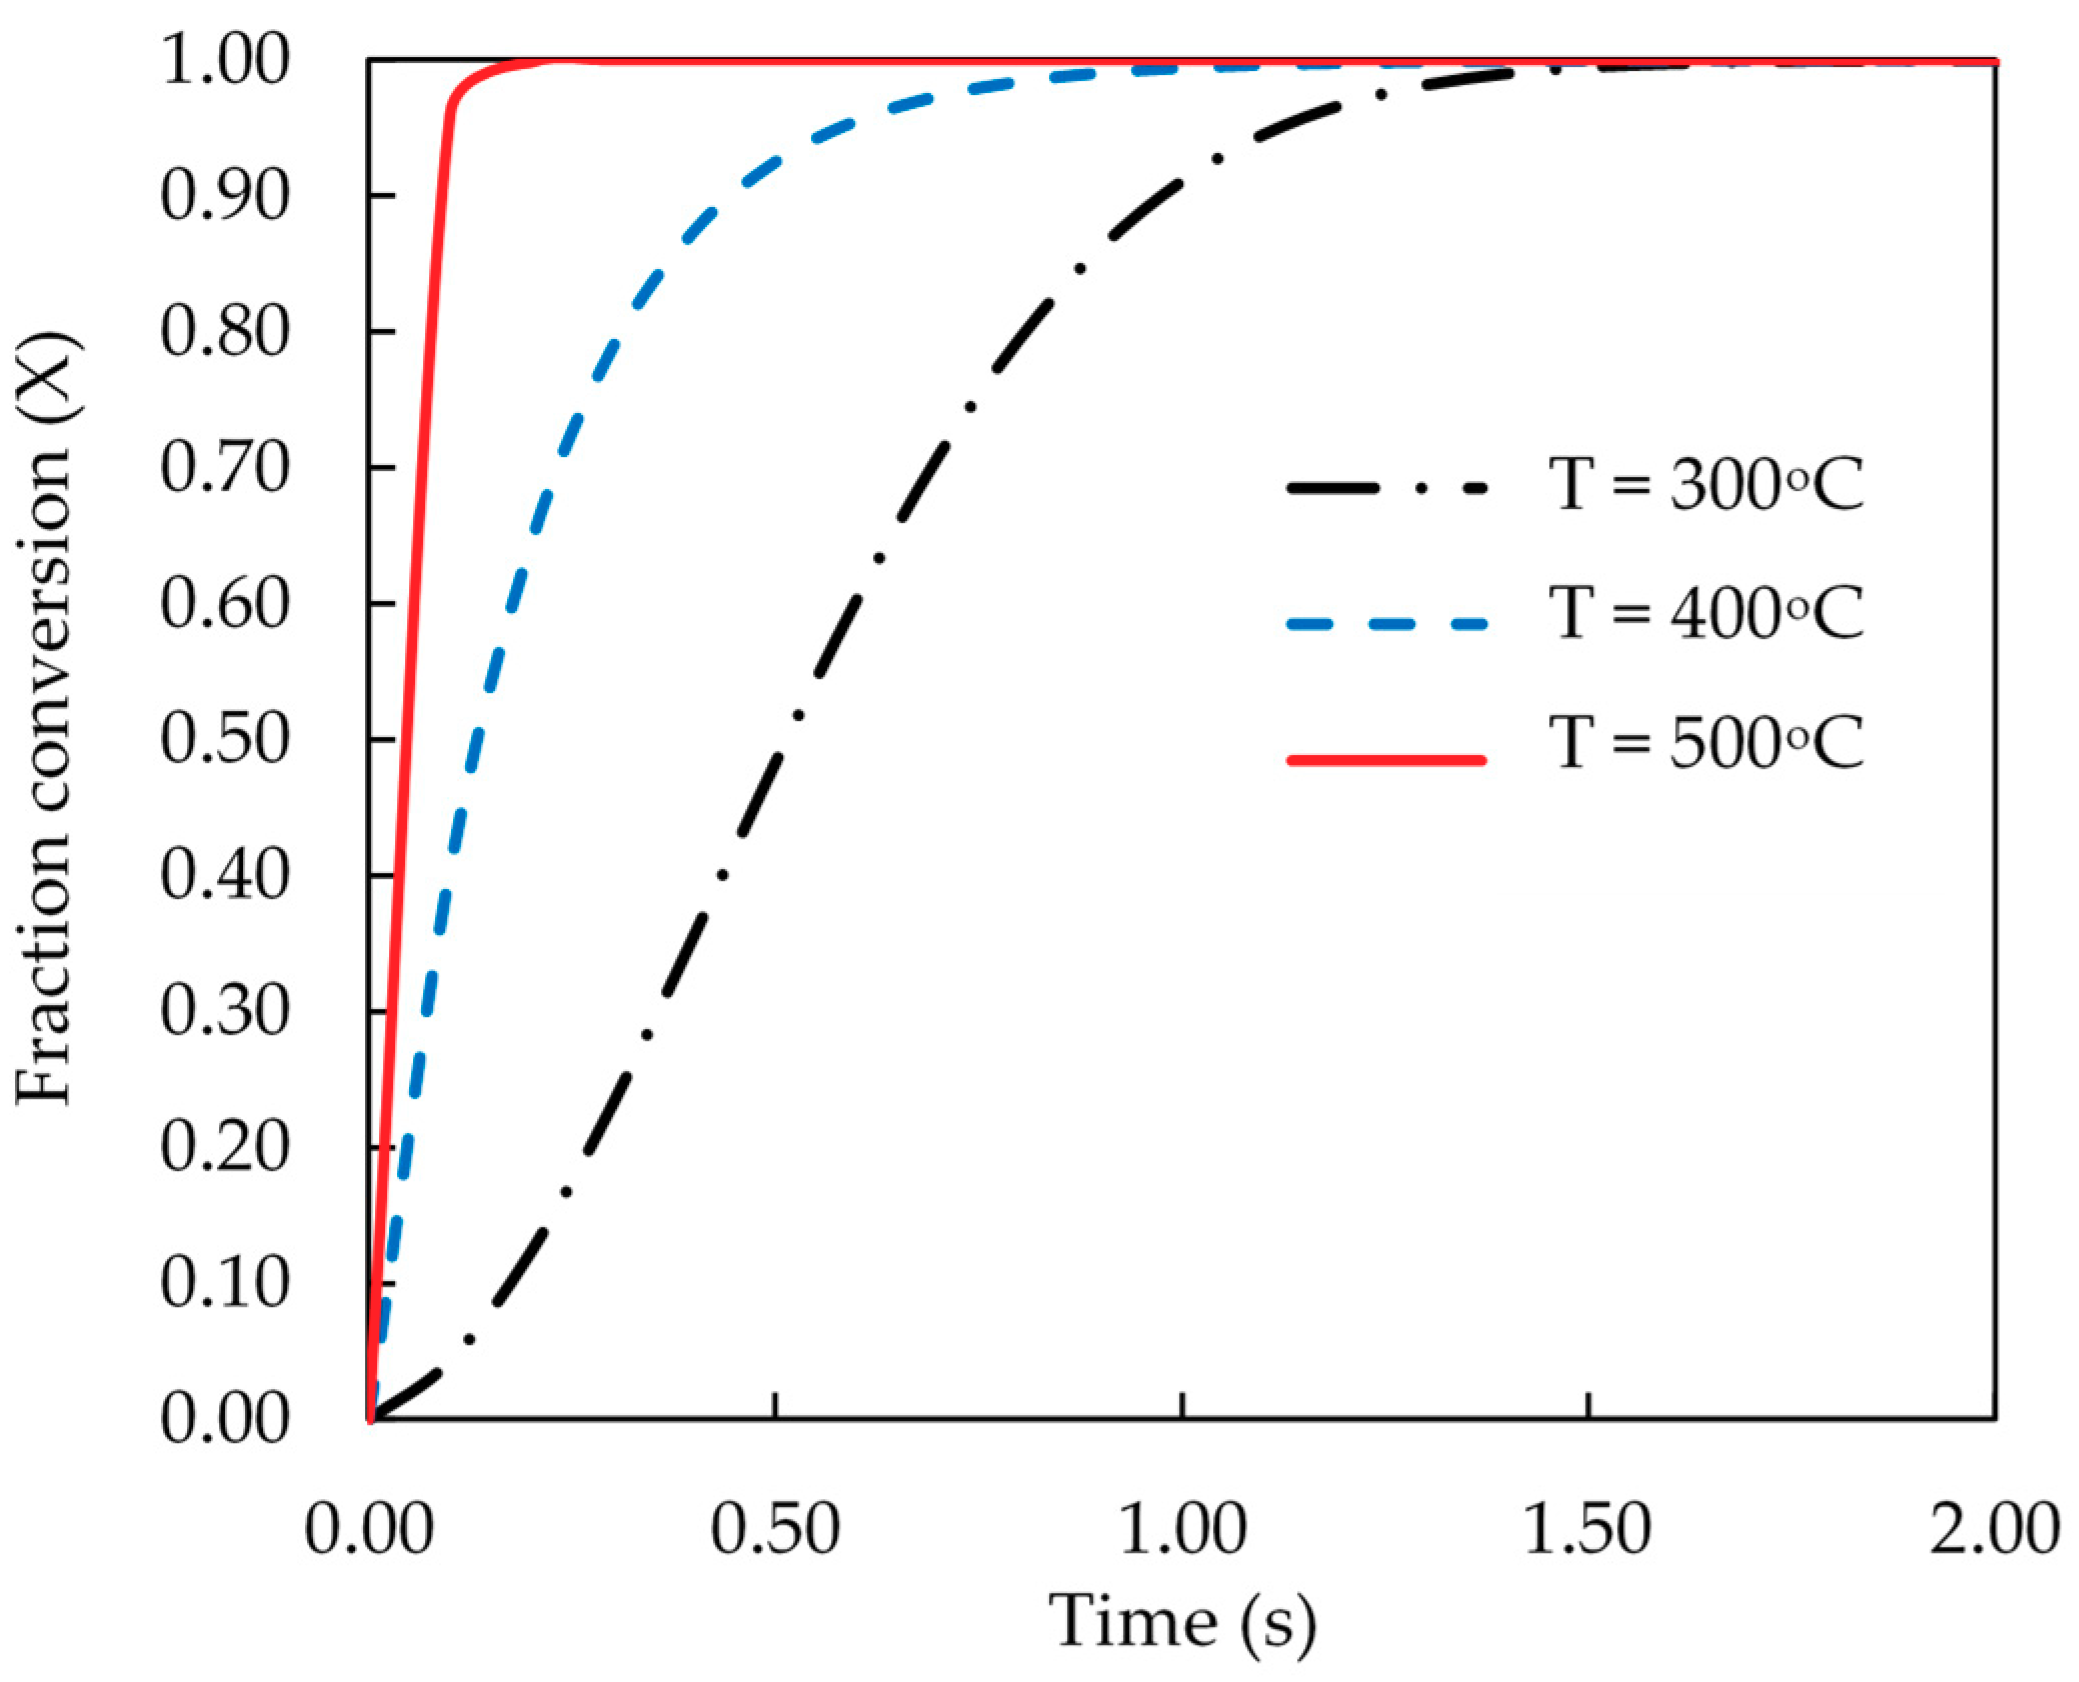
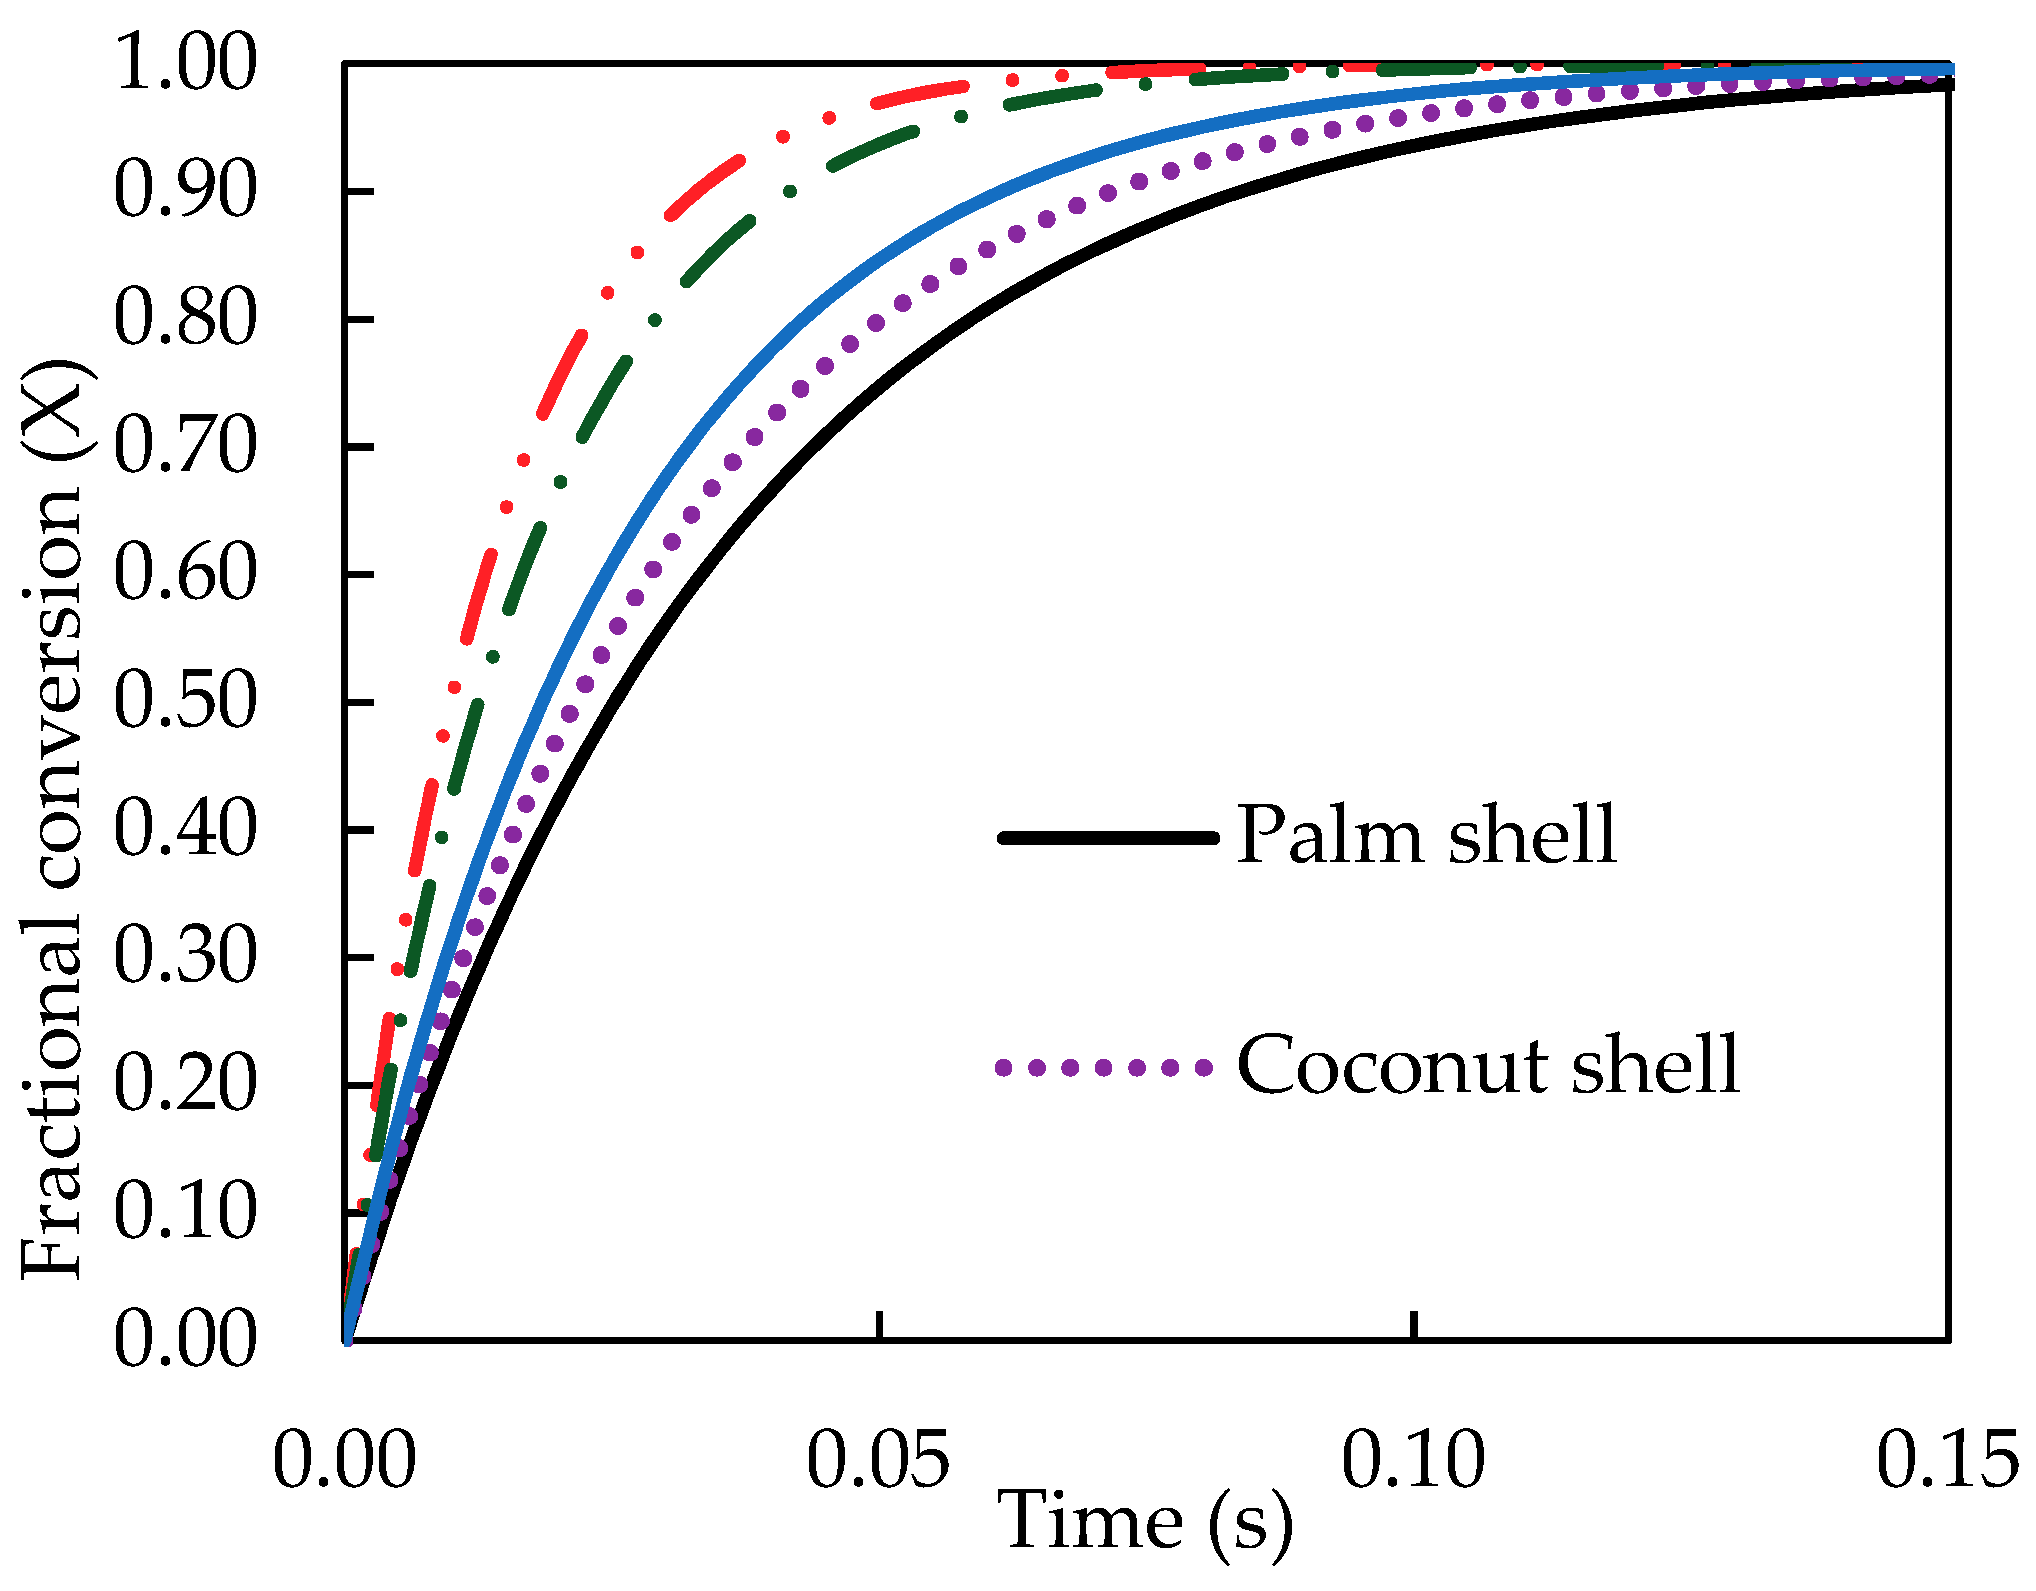
Finally, the kinetic data of pyrolysis reaction was computed and presented as the fractional conversion of biomass versus pyrolysis time. Figure 8 and Figure 9 show the results for the effects of pyrolysis temperature (for coconut shell) and biomass type (at 500 °C), respectively. It is seen that the pyrolysis kinetics of coconut shell is strongly dependent on the temperature. The initial conversion rates (dX/dt) were estimated to be 1.07, 3.33 and 10.10 s−1 for the pyrolysis temperatures of 300, 400 and 500 °C, respectively. A tenfold increase in the conversion rate is noticed for the increasing of pyrolysis temperature from 300 to 500 °C. As to the biomass type, palm kernel cake shows the highest conversion rate and palm shell gives the lowest one, in accord with the results of the rate constant (k) previously reported.
In summary, the simulation method proposed in the present study was able to provide complete information on the yields and compositions of pyrolysis products, as well as the pyrolysis kinetic data for different biomasses over the range of pyrolysis temperature from 300 to 800 °C. It should be noted that a similar but more sophisticated approach was proposed [23] for modelling the fast pyrolysis of beech wood biomass over the temperature range from 470 to 570 °C by incorporating the kinetic reaction model for the decomposition of the three lignocellulosic components into the Aspen Plus program.

5. Conclusions

The COCO simulation program was employed to simulate and study the slow pyrolysis behavior of five different biomasses, including palm shell, coconut shell, cassava pulp residue, palm kernel cake and longan fruit seed. The following conclusions can be drawn.
  • For each biomass, the best set of kinetic parameter (A and E) and stoichiometric numbers for the decomposition reaction, capable of describing the pyrolysis product yields, were generated by the program.
  • The derived set of stoichiometric numbers depended strongly on the biomass type, with the stoichiometric number of CO2 and water being largest for the gas and liquid products, respectively.
  • The simulation could predict the correct trend of temperature effect on the product yields over the temperature range of 300–800 °C.
  • The simulation could predict the yields of pyrolysis products with reasonable accuracy, giving the overall average errors of 6.02, 5.45 and 7.03% for the solid, liquid and gas products, respectively.
  • The biomass pyrolysis was alternatively simulated by separating the tested biomasses into two groups based on the single-peak and two-peak characteristics of the DTG curves. The agreement between the simulated and experimental product yields using this approach was satisfactory.
  • The validity of the proposed simulation scheme was further tested against the slow pyrolysis results of previous investigations based on the same type of biomass, but with differing pyrolysis conditions. Overall, the prediction error of product yields varied over a relatively wide range with the average error being 12.3%, 10.6% and 27.5% for the solid, liquid and gas products, respectively. The predictive capability could be substantially improved if an optimum set of model parameters relevant to a specific pyrolysis condition was applied.
  • The simulation program also generated the data on liquid and gas compositions of the pyrolysis products. The program was able to predict the correct percentage proportions of gas contents, but there were large discrepancies of the liquid compositions between the experiments and simulation results.
  • The kinetics of biomass pyrolysis generated from the simulation program in terms of fractional conversion against time was derived from observing the effect of temperature and biomass type. Palm kernel cake showed the largest conversion rate, while longan fruit seed gave the lowest conversion rate.

Author Contributions

Conceptualization, C.T. and N.P.; Methodology, C.T., N.P. and P.W.; Validation, C.T. and N.P.; Formal analysis, C.T. and N.P.; Investigation, C.T. and N.P.; Resources, C.T. and N.P.; Writing—original draft preparation, N.P.; Writing—review and editing, C.T.; Visualization, C.T. and N.P.; Supervision, C.T.; Project administration, C.T.; Funding acquisition, C.T.

Funding

The financial support of this work was provided by The Research and Development Fund, Suranaree University of Technology, and is gratefully acknowledged.

Conflicts of Interest

The authors declare no conflict of interest.

References

  1. Chiaramonti, D.; Oasmaa, A.; Solantausta, Y. Power Generation Using Fast Pyrolysis Liquids from Biomass. Renew Sustain. Energy Rev. 2007, 11, 1056–1086. [Google Scholar] [CrossRef]
  2. Said, M.; Ghani, W.; Boon, H.; Hussain. Thermochemical Conversion of Napier Grass for Production of Renewable Syngas. Processes 2019, 7, 705. [Google Scholar] [CrossRef]
  3. Salman, B.; Ong, M.; Saifuddin, N.M.; Salema, A.; Sankaran, R.; Pau Loke, S. Thermal Analysis of Nigerian Oil Palm Biomass with Sachet-Water Plastic Wastes for Sustainable Production of Biofuel. Processes 2019, 7, 475. [Google Scholar] [CrossRef]
  4. Jain, A.K.; Sharma, S.K.; Singh, D. Reaction Kinetics of Paddy Husk Thermal Decomposition. In Proceedings of the 31st Intersociety Energy Conversion Engineering Conference—IECEC 96, Washington, DC, USA, 11–16 August 1996; IEEE: Piscataway, NJ, USA, 2002; Volume 4, pp. 2274–2279. [Google Scholar]
  5. Bridgwater, A.V.; Peacocke, G.V.C. Fast Pyrolysis Processes for Biomass. Renew Sustain. Energy Rev. 2000, 4, 1–73. [Google Scholar] [CrossRef]
  6. Goyal, H.B.; Seal, D.; Saxena, R.C. Bio-Fuels from Thermochemical Conversion of Renewable Resources: A Review. Renew Sustain. Energy Rev. 2008, 12, 504–517. [Google Scholar] [CrossRef]
  7. Czernik, S.; Bridgwater, A.V. Overview of Applications of Biomass Fast Pyrolysis Oil. Energy Fuels 2004, 18, 590–598. [Google Scholar] [CrossRef]
  8. Kim, S.-S.; Agblevor, F.A. Pyrolysis Characteristics and Kinetics of Chicken Litter. Waste Manag. 2007, 27, 135–140. [Google Scholar] [CrossRef]
  9. Fagbemi, L.; Khezami, L.; Capart, R. Pyrolysis Products from Different Biomasses: Application to the Thermal Cracking of Tar. Appl. Energy 2001, 69, 293–306. [Google Scholar] [CrossRef]
  10. Aguado, R.; Olazar, M.; San José, M.J.; Aguirre, G.; Bilbao, J. Pyrolysis of Sawdust in a Conical Spouted Bed Reactor. Yields and Product Composition. Ind. Eng. Chem. Res. 2000, 39, 1925–1933. [Google Scholar] [CrossRef]
  11. Agrawal, R.K. Kinetics of Reactions Involved in Pyrolysis of Cellulose I. The Three Reaction Model. Can. J. Chem. Eng. 1988, 66, 403–412. [Google Scholar] [CrossRef]
  12. Diebold, J.P. A Unified, Global Model for the Pyrolysis of Cellulose. Biomass Bioenergy 1994, 7, 75–85. [Google Scholar] [CrossRef]
  13. Thurner, F.; Mann, U. Kinetic Investigation of Wood Pyrolysis. Ind. Eng. Chem. Process. Des. Dev. 1981, 20, 482–488. [Google Scholar] [CrossRef]
  14. Ding, Y.; Zhang, J.; He, Q.; Huang, B.; Mao, S. The Application and Validity of Various Reaction Kinetic Models on Woody Biomass Pyrolysis. Energy 2019, 179, 784–791. [Google Scholar] [CrossRef]
  15. Sharma, A.; Pareek, V.; Zhang, D. Biomass Pyrolysis—A Review of Modelling, Process Parameters and Catalytic Studies. Renew Sustain. Energy Rev. 2015, 50, 1081–1096. [Google Scholar] [CrossRef]
  16. Mian, I.; Li, X.; Jian, Y.; Dacres, O.D.; Zhong, M.; Liu, J.; Ma, F.; Rahman, N. Kinetic Study of Biomass Pellet Pyrolysis by Using Distributed Activation Energy Model and Coats Redfern Methods and Their Comparison. Bioresour. Technol. 2019, 294, 122099. [Google Scholar] [CrossRef]
  17. Ganguly, T.; Das, O.; Saini, H.; Sharma, A. Modeling of Heat Transfer through a Single Biomass Particle as a Function of Time inside a Continuous Auger Pyrolysis Reactor. Curr. Trends Biotechnol. Chem. Res. 2012, 2, 100–104. [Google Scholar]
  18. Sobamowo, G.M.; Ojolo, S.J.; Osheku, C.A.; Kehinde, A.J. Analysis of Heat Transfer in the Pyrolysis of Differently Shaped Biomass Particles Subjected to Different Boundary Conditions: Integral Transform Methods. J. Heat Mass Transf. Res. 2017, 4, 21–34. [Google Scholar]
  19. Ruiz, M.; Martin, E.; Blin, J.; Van de Steene, L.; Broust, F. Understanding the Secondary Reactions of Flash Pyrolysis Vapors inside a Hot Gas Filtration Unit. Energy Fuels 2017, 31, 13785–13795. [Google Scholar] [CrossRef]
  20. Gomez, C.; Velo, E.; Barontini, F.; Cozzani, V. Influence of Secondary Reactions on the Heat of Pyrolysis of Biomass. Ind. Eng. Chem. Res. 2009, 48, 10222–10233. [Google Scholar] [CrossRef]
  21. Davidsson, K.O.; Pettersson, J.B.C. Birch Wood Particle Shrinkage during Rapid Pyrolysis. Fuel 2002, 81, 263–270. [Google Scholar] [CrossRef]
  22. Onarheim, K.; Solantausta, Y.; Lehto, J. Process Simulation Development of Fast Pyrolysis of Wood Using Aspen Plus. Energy Fuels 2015, 29, 205–217. [Google Scholar] [CrossRef]
  23. Peters, J.F.; Banks, S.W.; Bridgwater, A.V.; Dufour, J. A Kinetic Reaction Model for Biomass Pyrolysis Processes in Aspen Plus. Appl. Energy 2017, 188, 595–603. [Google Scholar] [CrossRef]
  24. COCO-the Cape-Open to Cape-Open Simulator. Available online: https://www.cocosimulator.org (accessed on 20 August 2019).
  25. Weerachanchai, P. Studies of Biomass Pyrolysis and Gasification for Fuel Production. Ph.D. Thesis, Suranaree University of Technology, Nakhon Ratchasima, Thailand, January 2009. [Google Scholar]
  26. Weerachanchai, P.; Tangsathitkulchai, C.; Tangsathitkulchai, M. Characterization of Products from Slow Pyrolysis of Palm Kernel Cake and Cassava Pulp Residue. Korean J. Chem. Eng. 2011, 28, 2262–2274. [Google Scholar] [CrossRef]
  27. Hashim, K.; Tahiruddin, S.; Asis, A.J. 8-Palm and Palm Kernel Oil Production and Processing in Malaysia and Indonesia. In Palm Oil; Lai, O.-M., Tan, C.-P., Akoh, C.C., Eds.; AOCS Press: Urbana, IL, USA, 2012; pp. 235–250. [Google Scholar]
  28. Mohd Yunos, N.F.D.; Zaharia, M.; Ahmad, K.; Nath, D.; Iwase, M.; Sahajwalla, V. Structural Transformation of Agricultural Waste/Coke Blends and Their Implications during High Temperature Processes. ISIJ Int. 2011, 51, 1185–1193. [Google Scholar] [CrossRef] [Green Version]
  29. Abnisa, F.; Arami Niya, A.; Daud, W.; Sahu, J. Characterization of Bio-Oil and Bio-Char from Pyrolysis of Palm Oil Wastes. BioEnergy Res. 2013, 6, 830–840. [Google Scholar] [CrossRef]
  30. Zhao, C.; Yan, H.; Liu, Y.; Huang, Y.; Zhang, R.; Chen, C.; Liu, G. Bio-Energy Conversion Performance, Biodegradability, and Kinetic Analysis of Different Fruit Residues during Discontinuous Anaerobic Digestion. Waste Manag. 2016, 52, 295–301. [Google Scholar] [CrossRef]
  31. Djuma’ali, D.; Soewarno, N.; Sumarno, S.; Primarini, D.; Sumaryono, W. Cassava Pulp as a Biofuel Feedstock of an Enzymatic Hydrolysis Proces. Makara J. Technol. 2011, 15, 183–192. [Google Scholar] [CrossRef]
  32. Demirbas, A. Effect of Temperature on Pyrolysis Products from Four Nut Shells. J. Anal. Appl. Pyrolysis 2006, 76, 285–289. [Google Scholar] [CrossRef]
  33. Demirbas, A. The Influence of Temperature on the Yields of Compounds Existing in Bio-Oils Obtained from Biomass Samples via Pyrolysis. Fuel Process. Technol. 2007, 88, 591–597. [Google Scholar] [CrossRef]
  34. Hu, X.; Gholizadeh, M. Biomass Pyrolysis: A Review of the Process Development and Challenges from Initial Researches up to the Commercialisation Stage. J. Energy Chem. 2019, 39, 109–143. [Google Scholar] [CrossRef]
  35. Luangkiattikhun, P.; Tangsathitkulchai, C.; Tangsathitkulchai, M. Non-Isothermal Thermogravimetric Analysis of Oil-Palm Solid Wastes. Bioresour. Technol. 2008, 99, 986–997. [Google Scholar] [CrossRef] [PubMed]
  36. Ranzi, E.; Cuoci, A.; Faravelli, T.; Frassoldati, A.; Migliavacca, G.; Pierucci, S.; Sommariva, S. Chemical Kinetics of Biomass Pyrolysis. Energy Fuels 2009, 22, 4292–4300. [Google Scholar] [CrossRef]
  37. Burhenne, L.; Messmer, J.; Aicher, T.; Laborie, M.-P. The Effect of the Biomass Components Lignin, Cellulose and Hemicellulose on TGA and Fixed Bed Pyrolysis. J. Anal. Appl. Pyrolysis 2013, 101, 177–184. [Google Scholar] [CrossRef]
  38. Raju; Sitorus, A. Measurement of Pyrolysis Gases on Palm Oil Shell and Empty Fruit Bunch. In Proceedings of the 2017 International Conference on Computing, Engineering, and Design (ICCED), Kuala Lumpur, Malaysia, 23–25 November 2017; IEEE: Piscataway, NJ, USA, 2018; pp. 1–4. [Google Scholar]
  39. Rout, T.; Pradhan, D.; Singh, R.K.; Kumari, N. Exhaustive Study of Products Obtained from Coconut Shell Pyrolysis. J. Environ. Chem. Eng. 2016, 4, 3696–3705. [Google Scholar] [CrossRef]
  40. Abdul Rahman, A.; Sulaiman, F.; Abdullah, N. Influence of Washing Medium Pre-Treatment on Pyrolysis Yields and Product Characteristics of Palm Kernel Shell. J. Phys. Sci. 2016, 27, 53–75. [Google Scholar]
  41. Ki, O.L.; Kurniawan, A.; Lin, C.X.; Ju, Y.-H.; Ismadji, S. Bio-Oil from Cassava Peel: A Potential Renewable Energy Source. Bioresour. Technol. 2013, 145, 157–161. [Google Scholar] [CrossRef]
Figure 1. Process simulation flowsheet for batch pyrolysis study.
Processes 07 00775 g001
Figure 2. Comparison of experimental and simulated pyrolysis product yields as a function of pyrolysis temperature for (a) palm shell (PS), (b) coconut shell (CS), (c) palm kernel cake (PK), (d) longan fruit seed (LS) and (e) cassava pulp residue (CP), using pyrolysis models P01–P05.
Processes 07 00775 g002
Figure 3. TGA curves of different biomass precursors [25].
Processes 07 00775 g003
Figure 4. Effect of pyrolysis temperature on the computed rate constant (k) of pyrolysis reaction for different biomass precursors.
Processes 07 00775 g004
Figure 5. DTG curves of different biomass precursors used in the present study [25].
Processes 07 00775 g005
Figure 6. Comparison of experimental and calculated pyrolysis yields for (a) palm shell and (b) coconut shell by using pyrolysis reaction model G01.
Processes 07 00775 g006
Figure 7. Comparison of experimental and simulated pyrolysis yields for (a) palm kernel cake, (b) longan fruit seed and (c) cassava pulp residue by using pyrolysis reaction model G02.
Processes 07 00775 g007
Figure 8. Effect of pyrolysis temperature on the computed fractional conversion of coconut shell as a function of time.
Processes 07 00775 g008
Figure 9. Effect of biomass type on the computed fractional conversion as a function of time at pyrolysis temperature of 500 °C.
Processes 07 00775 g009
Table 1. Proximate and ultimate analyses of biomass precursors used in the present study.
BiomassPSCSPKLSCP
Proximate analysis (Dry basis, wt %)
Volatiles75.6982.3879.5784.5181.98
Fixed carbon19.2016.3316.7414.7911.83
Ash5.111.293.690.706.19
Ultimate analysis ( wt %)
C48.7449.7647.1943.7535.89
H4.995.606.386.305.47
O45.6344.2943.2848.8158.27
N0.640.353.151.140.36
Cellulosic composition ( wt %)
Cellulose29.70 [28]19.80 [28]24.07 [29]19.49 [30]61.83 [31]
Hemicellulose16.90 [28]50.10 [28]25.00 [28]61.58 [30]21.37 [31]
Lignin53.40 [28]30.10 [28]50.92 [28]18.92 [30]16.79 [31]
Chemical formulaC4.11H6O2.72C4.55H6.52O2.36C3.65H6.13O2.93C3.64H6.30O3.05C3.59H6.10O3.15
Table 2. The optimum set of stoichiometric numbers for decomposition reaction of biomass generated from the simulation program.
ComponentChemical FormulaStoichiometric Number
Equation (1)PSCSPKCPLS
HydrogenH2a0.0122610.0170420.0043870.0044000.004387
Carbon dioxideCO2b0.1143220.1341880.1876040.2941520.187604
Carbon monoxideCOc0.0541330.0752500.0598950.0644680.059895
MethaneCH4d0.0130220.0308620.0071990.0073340.007199
WaterH2O (L)e1.3800141.1900921.4669031.4210311.466903
OctaneC8H18f0.0068340.0163830.0078510.0079960.007851
PhenolC6H5OHg0.2342440.0422530.0533670.0557980.053367
FufuralC5H4O2h0.0036970.0030790.0411260.0406790.041126
TolueneC7H8i0.0020150.0021430.0003920.0003920.000392
BenzeneC6H6j0.0000780.0000780.0473440.0489420.047344
XyleneC8H10k0.0000380.0000380.0016430.0016470.001643
StyreneC8H8l0.0876910.2324600.0010030.0010030.001003
NonaneC9H20m0.0066560.0167890.0092970.0094880.009297
HeptadecaneC17H36n0.0042050.0113750.0169510.0162760.016951
NonadecaneC19H40o0.0038040.0103030.0193360.0174760.019336
Carboxylic acidCH3COOHp0.0360700.0162360.1225970.1202560.122597
CharC(H0.22)(O0.51)q1.4577021.4615611.5042701.3696581.504270
Model NameP01P02P03P04P05
Table 3. Optimum values of kinetic parameters and the comparison of experimental and simulated product yields of solid (S), liquid (L), and gas (G) using models P01(PS), P02(CS), P03(PK), P04(CP), and P05(LS).
Biomass (Model Name)Temp (°C)Kinetic ParameterYield ( wt %)% ErrorSSE
AE (J/mole)K (1/s)ExperimentSimulation
SLGSLGSLG
PS (P01)3007.0 × 1068.0 × 1040.3661.028.011.062.327.310.42.1−2.4−5.50.1065
4004.3239.042.019.045.739.514.817.2−6.0−22.1
50027.4836.046.018.038.145.016.95.7−2.1−6.1
600114.3535.046.019.034.747.517.9−1.03.2−6.0
700354.9935.046.019.032.948.818.3−6.06.0−3.5
800892.2436.044.020.033.048.718.3−8.310.6−8.3
CS (P02)3007.0 × 1067.9 × 1040.4465.024.011.064.725.99.4−0.47.8−14.50.0877
4005.1733.048.019.037.545.816.713.5−4.5−12.1
50032.1035.047.018.031.550.218.3−10.16.91.7
600131.2429.052.019.030.451.018.64.9−1.9−2.3
700401.7030.051.019.030.251.118.60.80.3−1.9
800998.0829.051.020.030.251.118.64.30.3−6.8
PK (P03)3007.0 × 1067.4 × 1041.2645.039.016.049.935.514.610.8−9.0−8.50.1253
40012.6338.045.017.034.046.819.2−10.64.013.1
50069.9032.050.018.031.648.519.9−1.3−3.110.7
600261.3732.049.019.031.248.820.1−2.6−0.55.6
700745.3026.054.020.031.148.820.119.5−9.60.5
8001748.1532.047.021.031.048.920.1−3.14.0−4.3
CP (P04)3007.0 × 1067.6 × 1040.9240.040.020.044.535.320.211.3−11.81.20.1258
4009.6637.040.023.032.039.828.2−13.5-0.422.5
50055.3531.038.031.028.841.729.5−7.29.8−4.8
600212.5729.039.032.028.242.029.7−2.67.8−7.1
700619.1628.043.029.028.142.129.80.4−2.12.8
8001477.5928.042.030.028.042.229.80.10.4−0.7
LS (P05)3007.0 × 1067.8 × 1040.5453.036.012.053.731.914.41.3−11.420.30.1117
4006.1839.038.023.036.739.723.5−5.84.62.3
50037.5133.540.026.532.142.725.2−4.26.7−4.8
600150.6332.039.026.031.343.225.5−2.210.7−1.8
700454.5532.038.025.031.143.325.6−2.813.92.4
8001116.4729.044.024.031.143.325.67.1−1.66.8
Note: % Error = (100)( % yield sim % yield exp )/ % yield exp .
Table 4. The optimum set of stoichiometric numbers for pyrolysis model G01 and model G02.
ComponentChemical FormulaMWStoichiometric Number
Equation (1)G01 (C4.33H6.26O2.56)G02 (C3.63H6.18O3.04)
BiomassCxHyOz -0.0241730.004356
HydrogenH22a0.1247780.180219
Cabon dioxideCO244b0.0972530.061425
Carbon monoxideCO28c0.0434320.007003
MethaneCH416d1.1281231.444615
WaterH2O18e0.0230360.007628
OctaneC8H18114f0.2891960.064787
PhenolC6H5OH94g0.0025400.046825
FufuralC5H4O296h0.0024510.000393
TolueneC7H892i0.0000780.055113
BenzeneC6H678j0.0000390.001651
XyleneC8H10106k0.0014370.001007
StyreneC8H8104l0.0209160.008942
NonaneC9H20128m0.0112050.014359
HeptadecaneC17H36240n0.0100030.015407
NonadecaneC19H40268o0.0085420.137839
Carboxylic acidCH3COOH60p1.5170701.449810
CharC(H0.22)(O0.51)20.38q0.0241730.004356
Table 5. Comparison of experimental and simulated pyrolysis product yields using data from previous works.
Model NameBiomassReactor TypeTemp (°C)K (1/s)Yield (wt %)% ErrorSSERef.
ExperimentSimulation
SLGSLGSLG
P01PSFixed Bed3000.3663.822.813.562.327.310.4−2.420.1−22.80.0760[38]
4004.3244.338.317.445.739.514.83.23.1−14.9
50027.4835.343.321.438.145.016.97.74.1−21.0
600114.3535.043.321.734.747.517.9−0.99.7−17.8
50027.4831.746.122.138.045.017.019.8−2.4−23.2 [29]
P02CSTGA45013.7232.038.629.433.249.017.83.626.9−39.31.0645[39]
47521.2930.541.428.132.149.818.15.220.3−35.6
50032.1029.343.826.931.450.318.37.314.8−32.0
52547.1929.144.326.631.150.518.46.814.1−30.8
55067.7528.345.526.230.850.818.58.711.6−29.5
57595.2226.349.524.230.650.918.516.22.8−23.4
600131.2425.443.730.930.451.018.619.816.7−39.9
P03PKFixed bed3001.2653.036.011.049.735.714.7−6.3−0.933.31.5349[40]
3504.3744.044.012.038.643.517.9−12.2−1.148.9
40012.6340.050.010.034.046.719.3−15.0−6.592.7
45031.5234.053.013.032.348.019.7−5.1−9.451.8
50069.9031.049.020.031.648.519.91.9−1.1−0.3
P04CPFixed bed4009.6637.538.723.831.939.828.2−14.82.918.60.9409[41]
42515.6643.332.823.930.640.728.8−29.424.020.4
45024.5629.646.923.529.741.229.10.2−12.224.0
47537.3726.848.225.029.141.529.48.7−13.917.5
50055.3525.150.324.628.841.729.514.6−17.019.9
52579.9724.351.224.528.541.929.617.4−18.220.8
550112.9922.948.728.428.441.929.724.0−13.94.5
575156.4321.445.433.228.342.029.732.2−7.5−10.5
600212.5720.841.637.628.242.029.735.71.0−20.9
Table 6. Analysis of error of simulated results in Table 5.
Pyrolysis ProductRange of Error for Models P01–P04 (%)Average Error (%)Percentage of Simulated Data to be Within ±20% Error
Solid0.20–35.712.388.5
Liquid0.90–26.910.688.5
Gas0.30–92.727.530.8
Simulation ModelAverage Error (%)
SolidLiquidGas
P01 (PS)6.87.919.9
P02 (CS)9.715.332.9
P03 (PK)8.13.845.4
P04 (CP)19.712.317.5
Table 7. The optimum stoichiometric numbers for the pyrolysis of palm kernel cake from the work of Abdul Rahman (2016) [40].
ComponentChemical FormulaStoichiometry
Equation (1)Abdul Rahman [40]
HydrogenH2a0.003899
Carbon dioxideCO2b0.055694
Carbon monoxideCOc0.046181
MethaneCH4d0.004509
WaterH2Oe1.739999
OctaneC8H18f0.004838
PhenolC6H5OHg0.158452
FurfuralC5H4O2h0.038079
TolueneC7H8i0.000398
BenzeneC6H6j0.105208
XyleneC8H10k0.001727
StyreneC8H8l0.001059
NonaneC9H20m0.005058
HeptadecaneC17H36n0.003896
NonadecaneC19H40o0.003373
Carboxylic acidCH3COOHp0.017021
CharC(H0.22)(O0.51)q1.497605
Table 8. Comparison of experimental and simulated pyrolysis yields using experimental data from the work of Abdul Rahman (2016) [40].
BiomassReactor TypeTemp (°C)K (1/s)Yield (wt %)% ErrorSSE
ExperimentSimulation
SLGSLGSLG
PKFixed bed3001.0253.036.011.054.934.910.3−4.14.74.20.3364
3503.6044.044.012.041.745.113.2−10.06.014.7
40010.5640.050.010.035.649.814.6−13.30.948.3
45026.6934.053.013.033.251.615.2−3.3−2.117.4
50059.8231.049.020.032.352.315.43.77.0-22.8
Table 9. Comparison of experimental and simulated compositions of gas and liquid products from the pyrolysis of cassava pulp residue(CP) and palm kernel cake (PK) at 500 °C.
ComponentChemical Concentration ( wt %)
CPPK
Exp.Sim.Exp.Sim.
Gas products
H20.120.060.270.12
CO265.1786.9552.2076.41
CO29.8712.1842.321.83
CH44.840.805.201.64
Total100.00100.00100.00100.00
Liquid products (aromatics and hydrocarbons) (excluding water)
Toluene29.450.100.530.10
Benzene6.5512.310.0010.47
Xylene2.540.560.000.48
StyreneND0.2943.960.30
n-Octane, C835.222.873.102.41
n-Nonane, C90.083.833.683.26
n-Heptadecane, C171.1012.446.4610.05
n-Nonadecane, C190.1715.316.363.20
Total75.1147.7164.2430.29
Liquid products (oxygenates) (excluding water)
Carboxylic acidND23.2412.4538.29
Phenol24.8916.7822.6416.39
FurfuralND12.270.8415.04
Total24.8952.2935.9369.71
Note: ND = Not detected.

