Experimental Study on Forced Convection Heat Transfer from Plate-Fin Heat Sinks with Partial Heating

Abstract
1. Introduction
2. Experimental Procedure
3. Results
- (a)
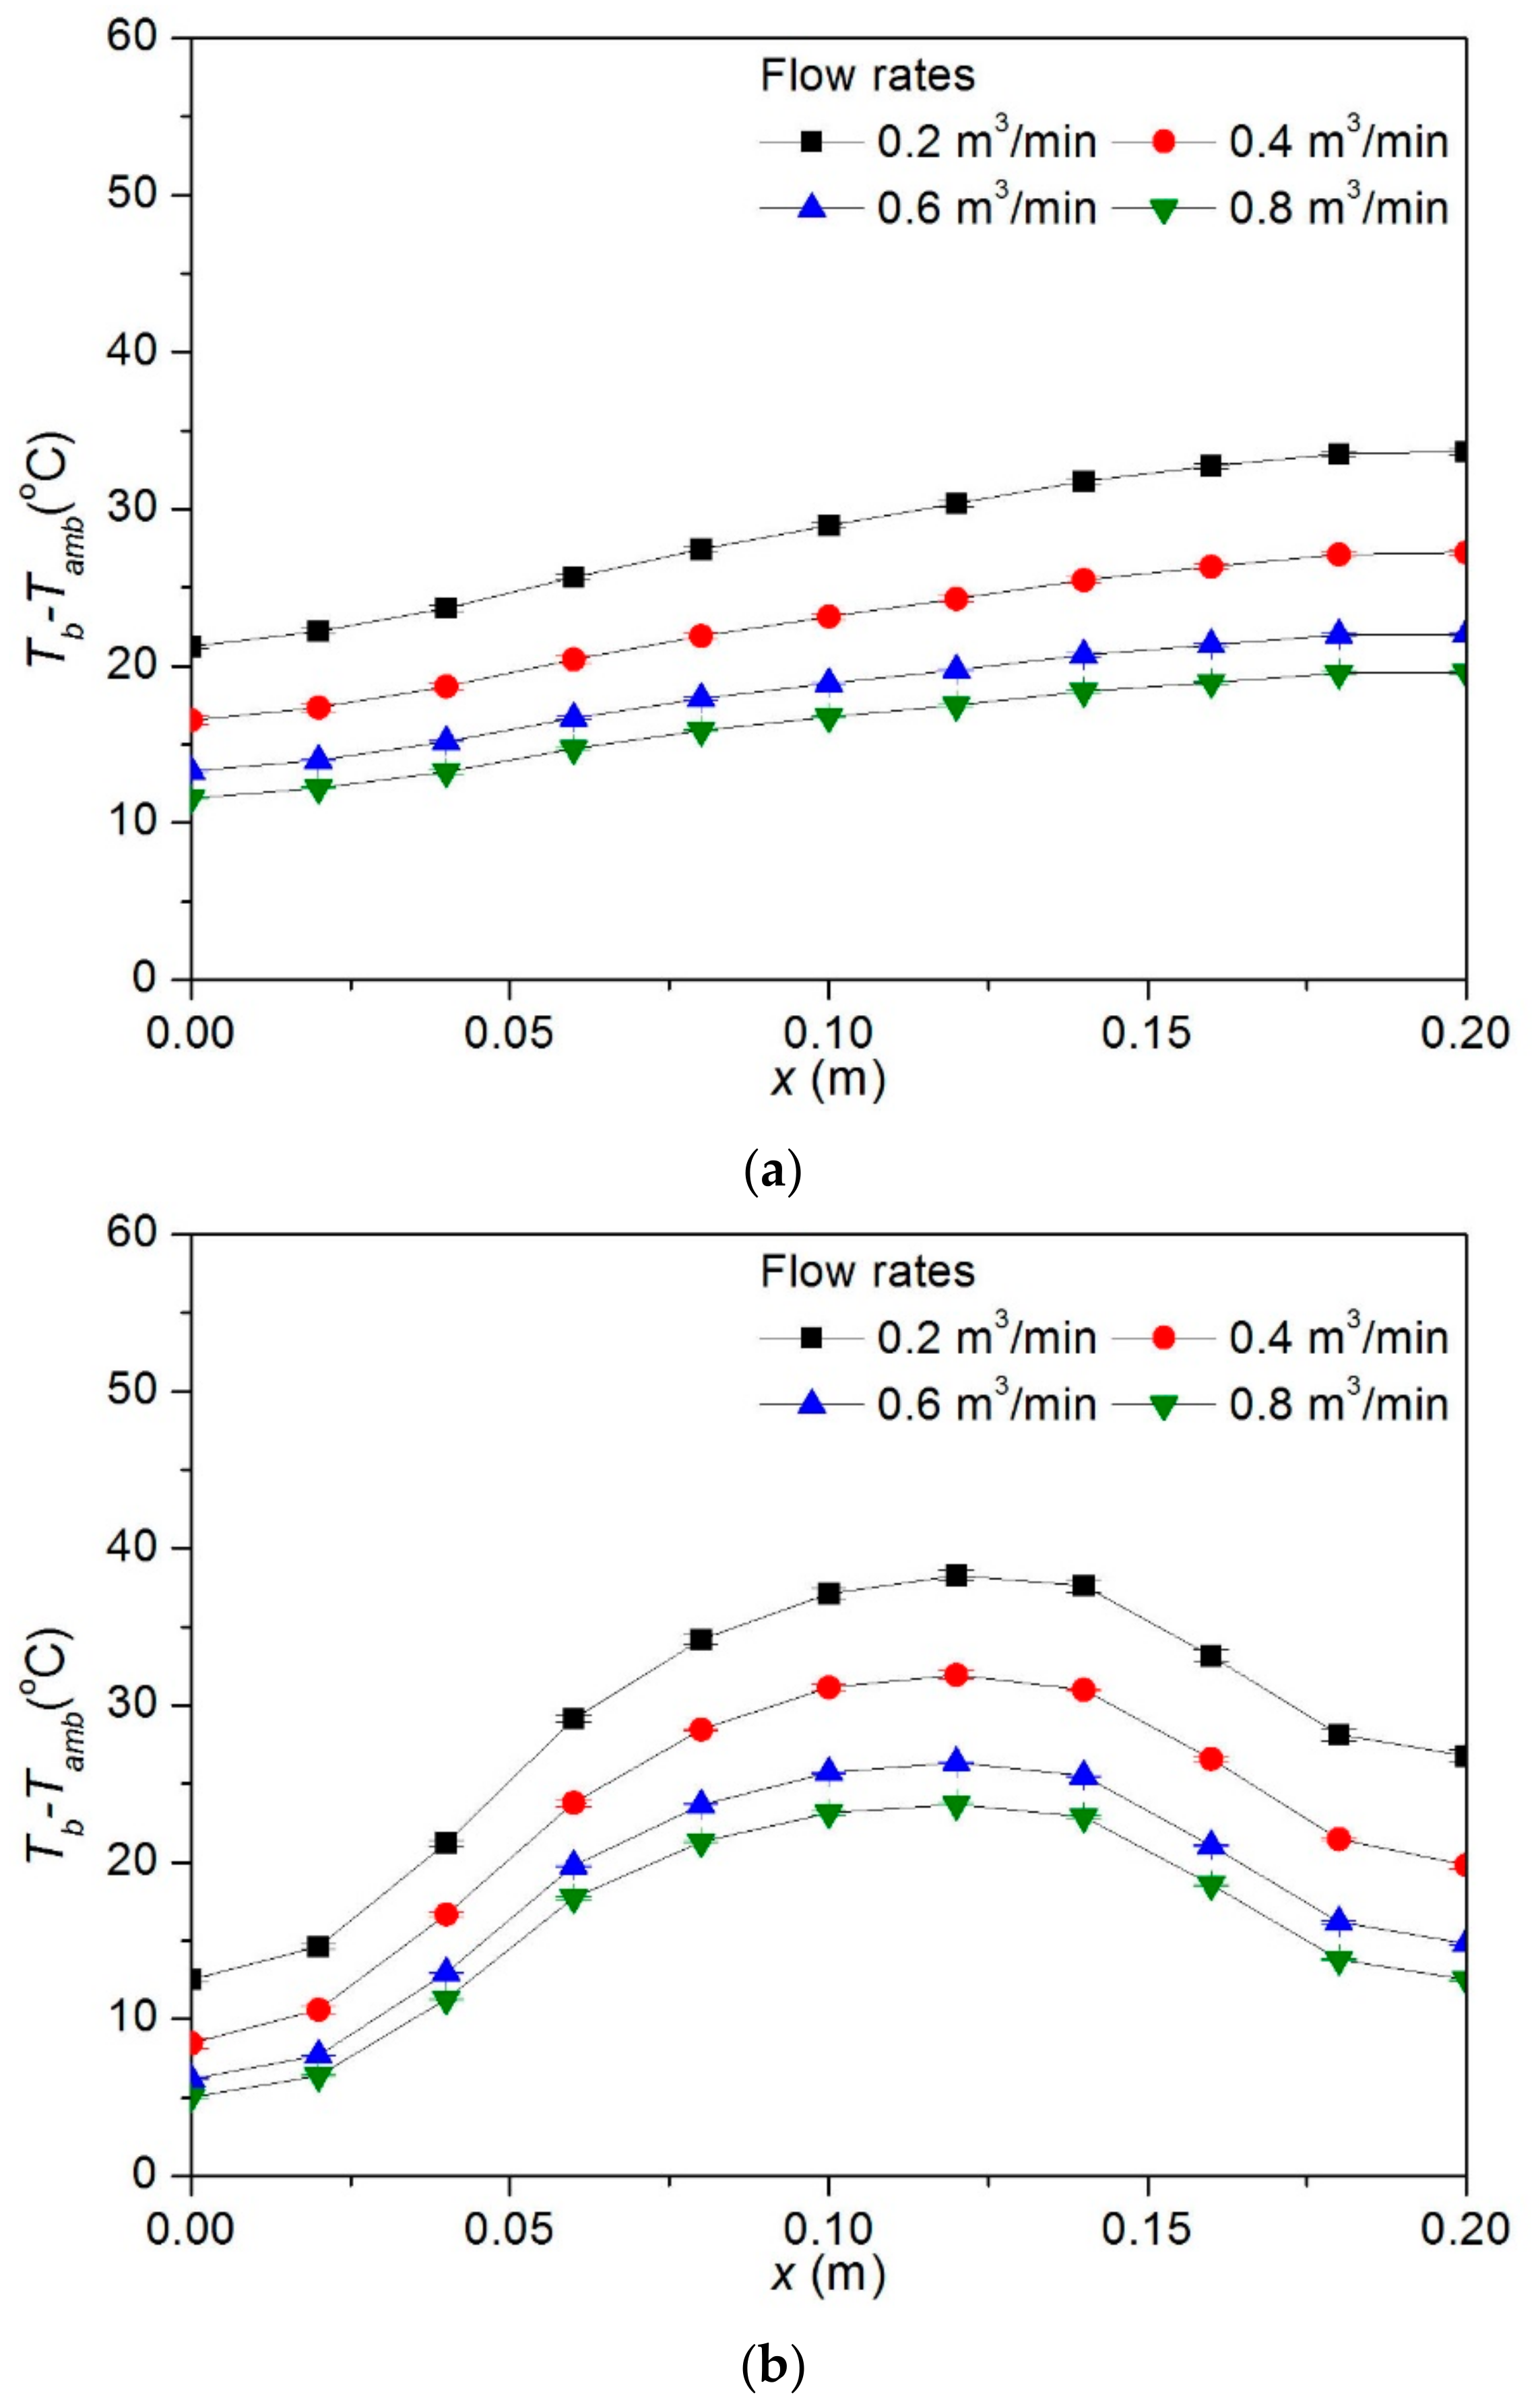
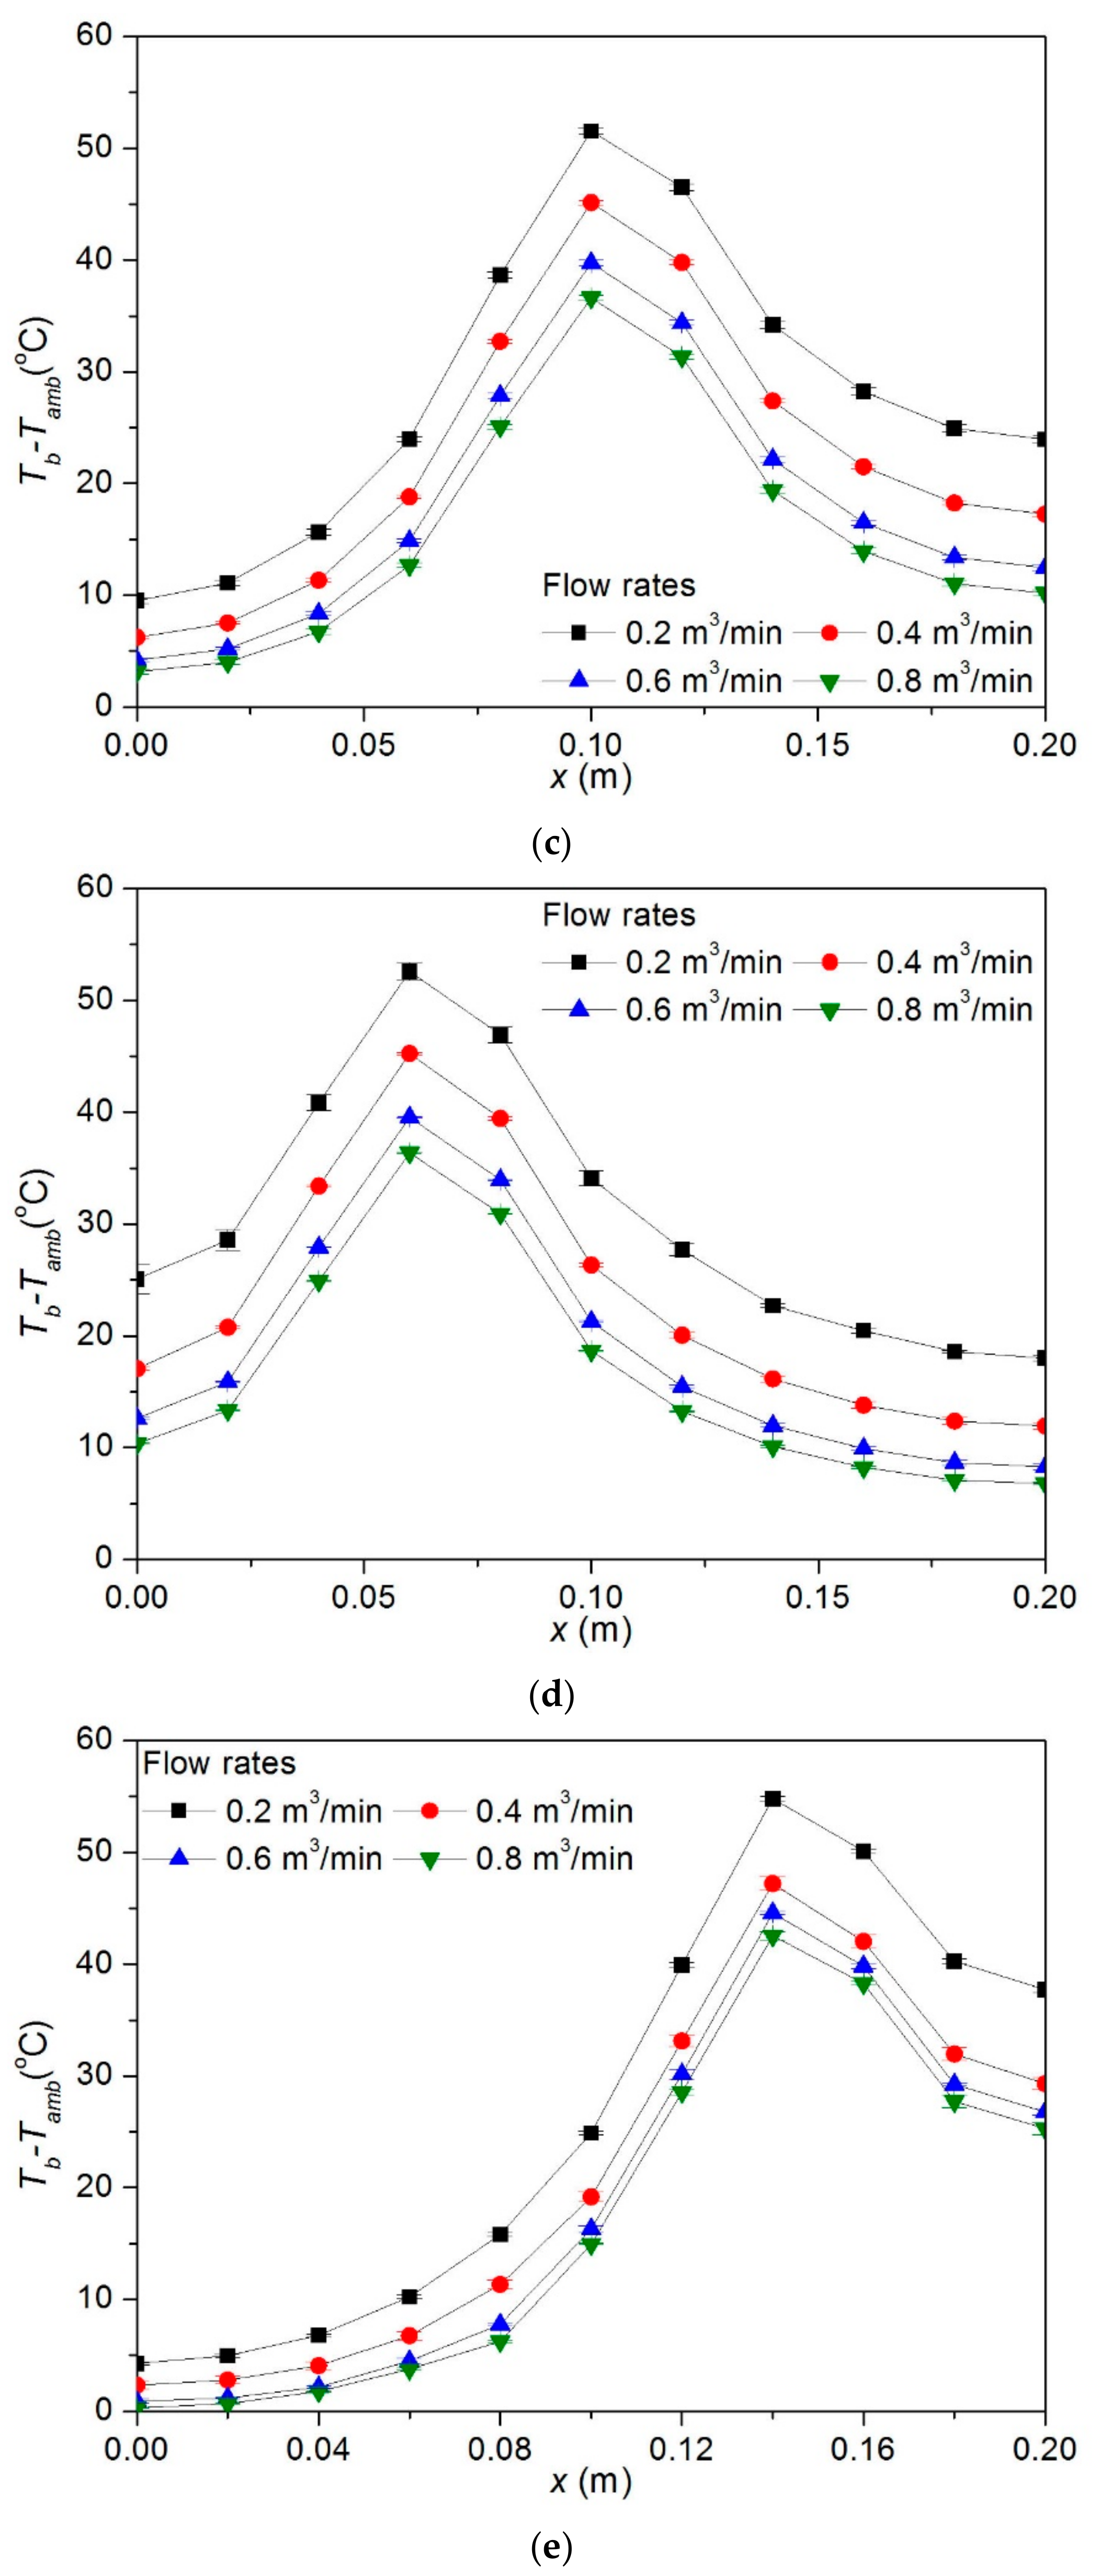
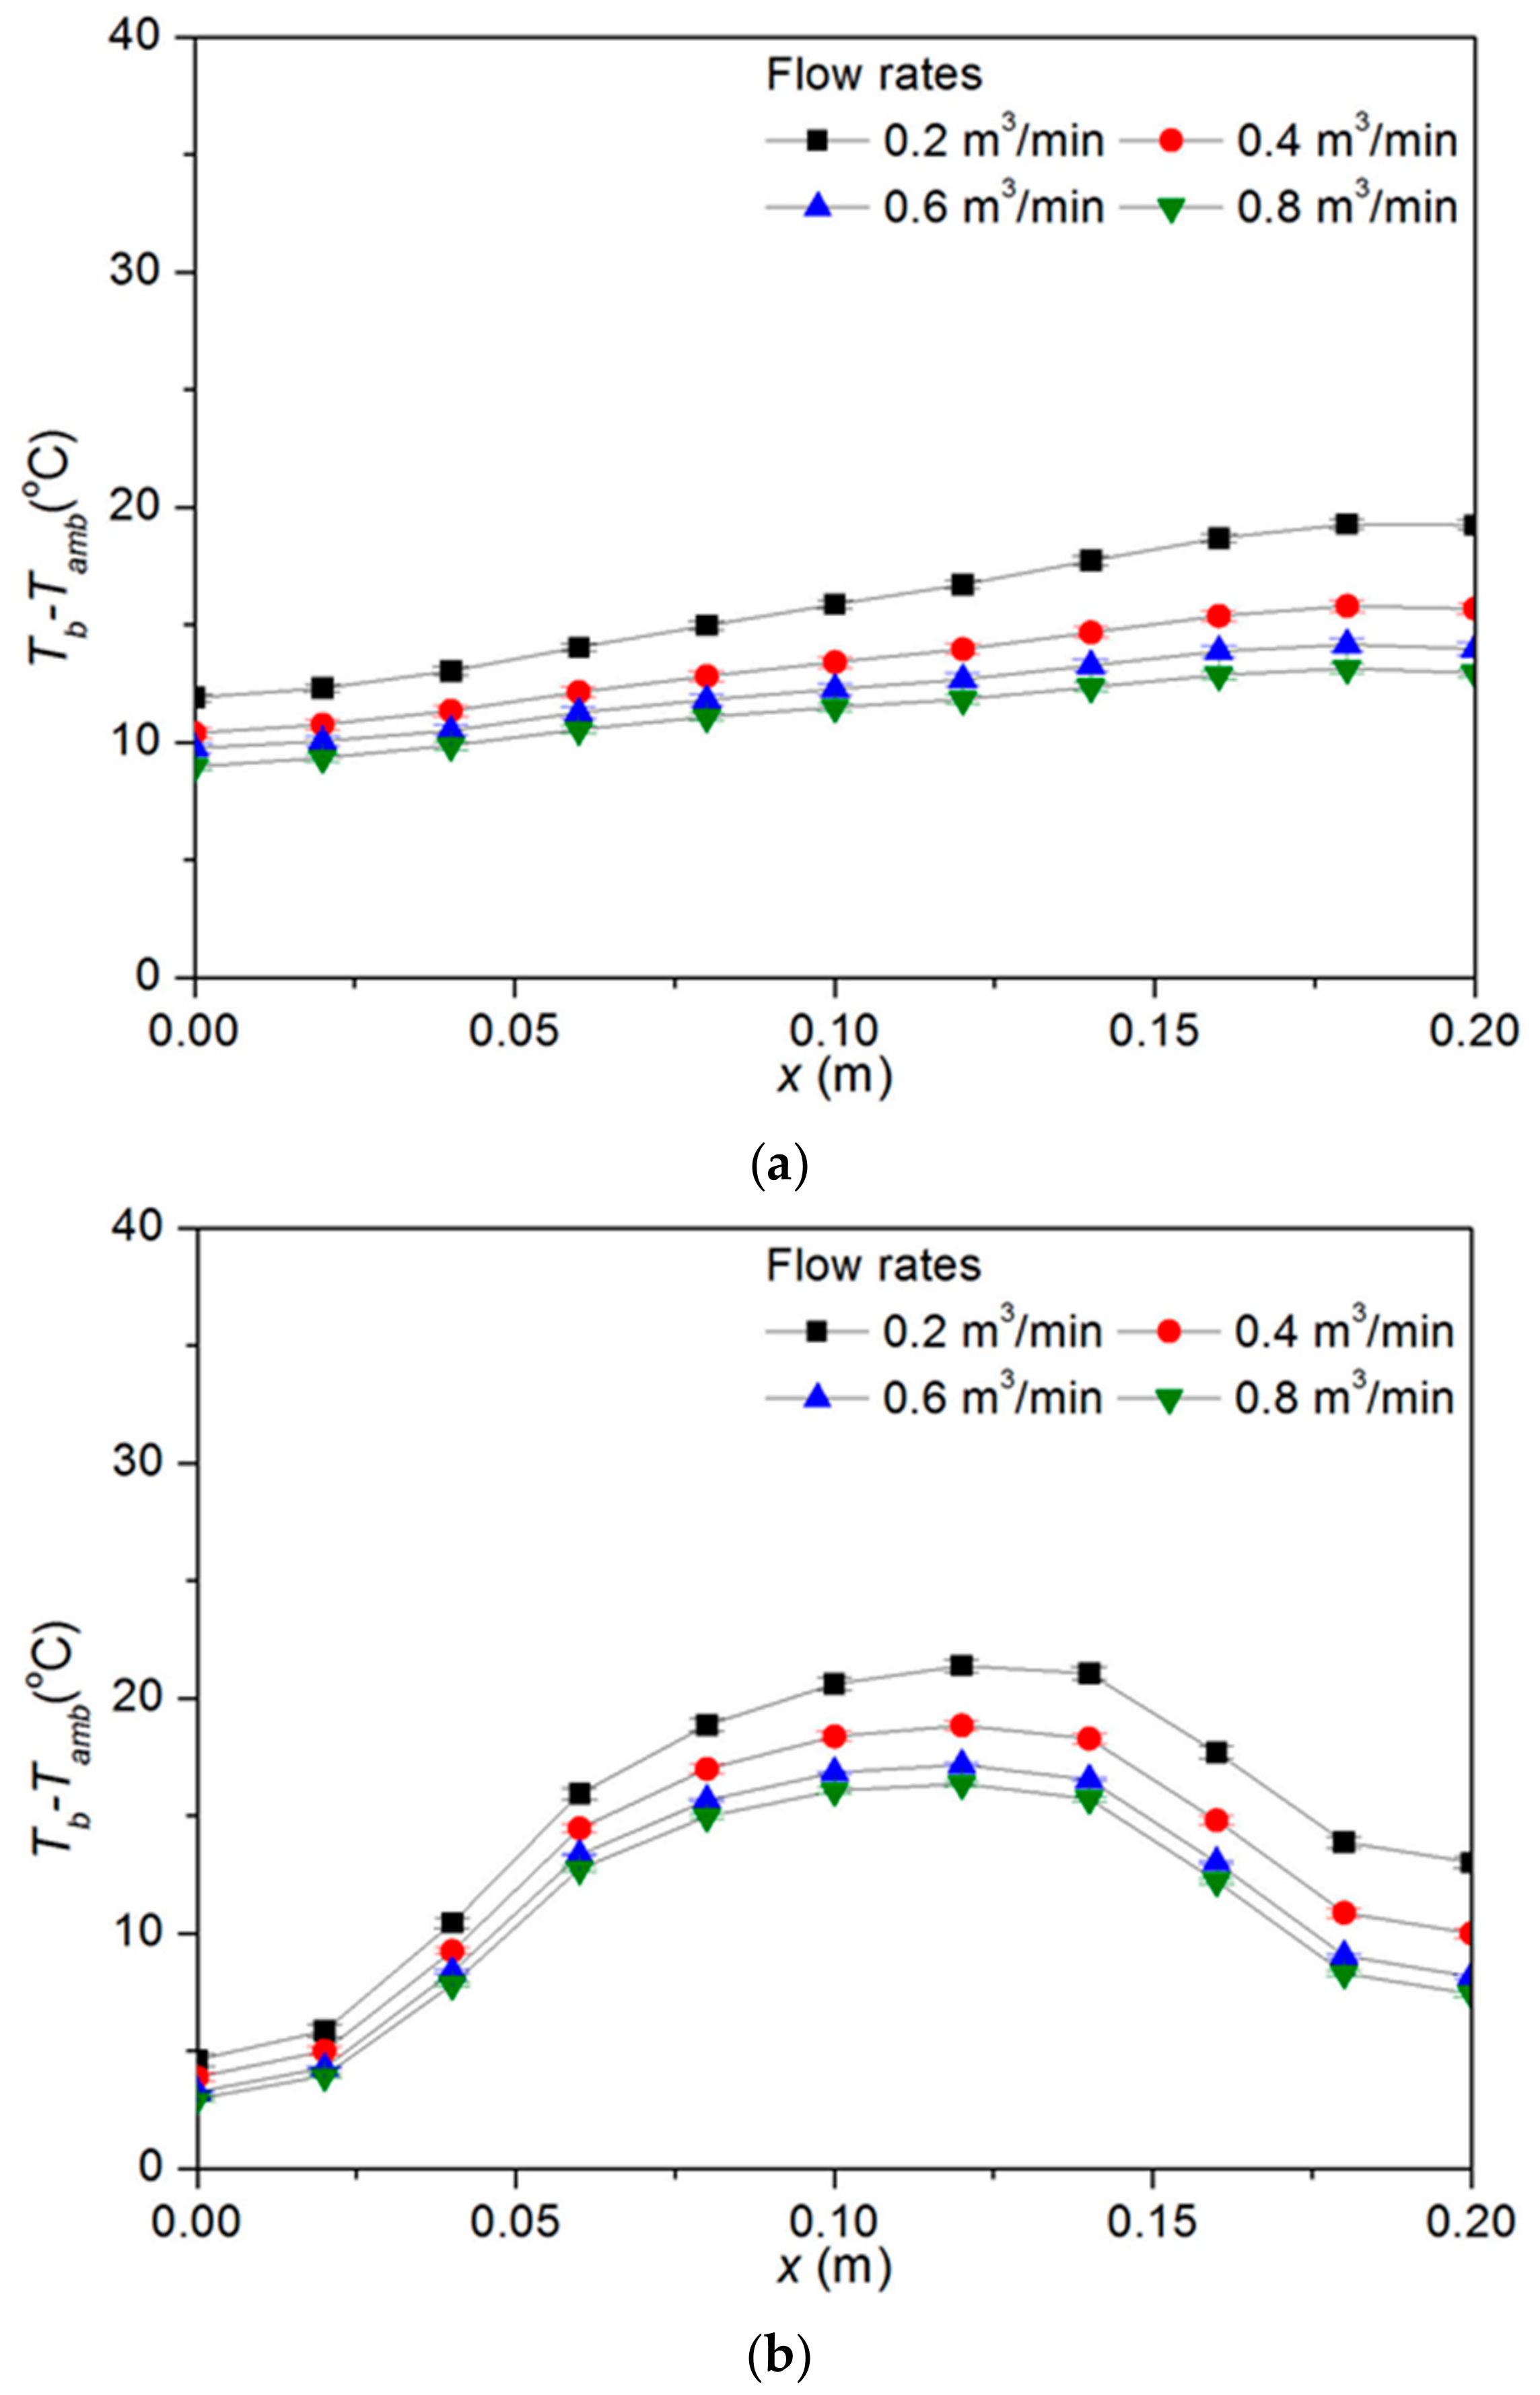
- In all cases shown in Figure 4a–e, regardless of the value of x, the base temperature decreased as the flow rate increased. This was mainly because the temperature of the fluid flowing inside the heat sink decreased as the flow rate increased. This was also because the local heat transfer coefficient, which was inversely proportional to the temperature difference between the fluid temperature and the base temperature, increased as the flow rate increased.
- (b)
- The extent to which the base temperature decreased with an increase in the flow rate, decreased as the flow rate increased.
- (c)
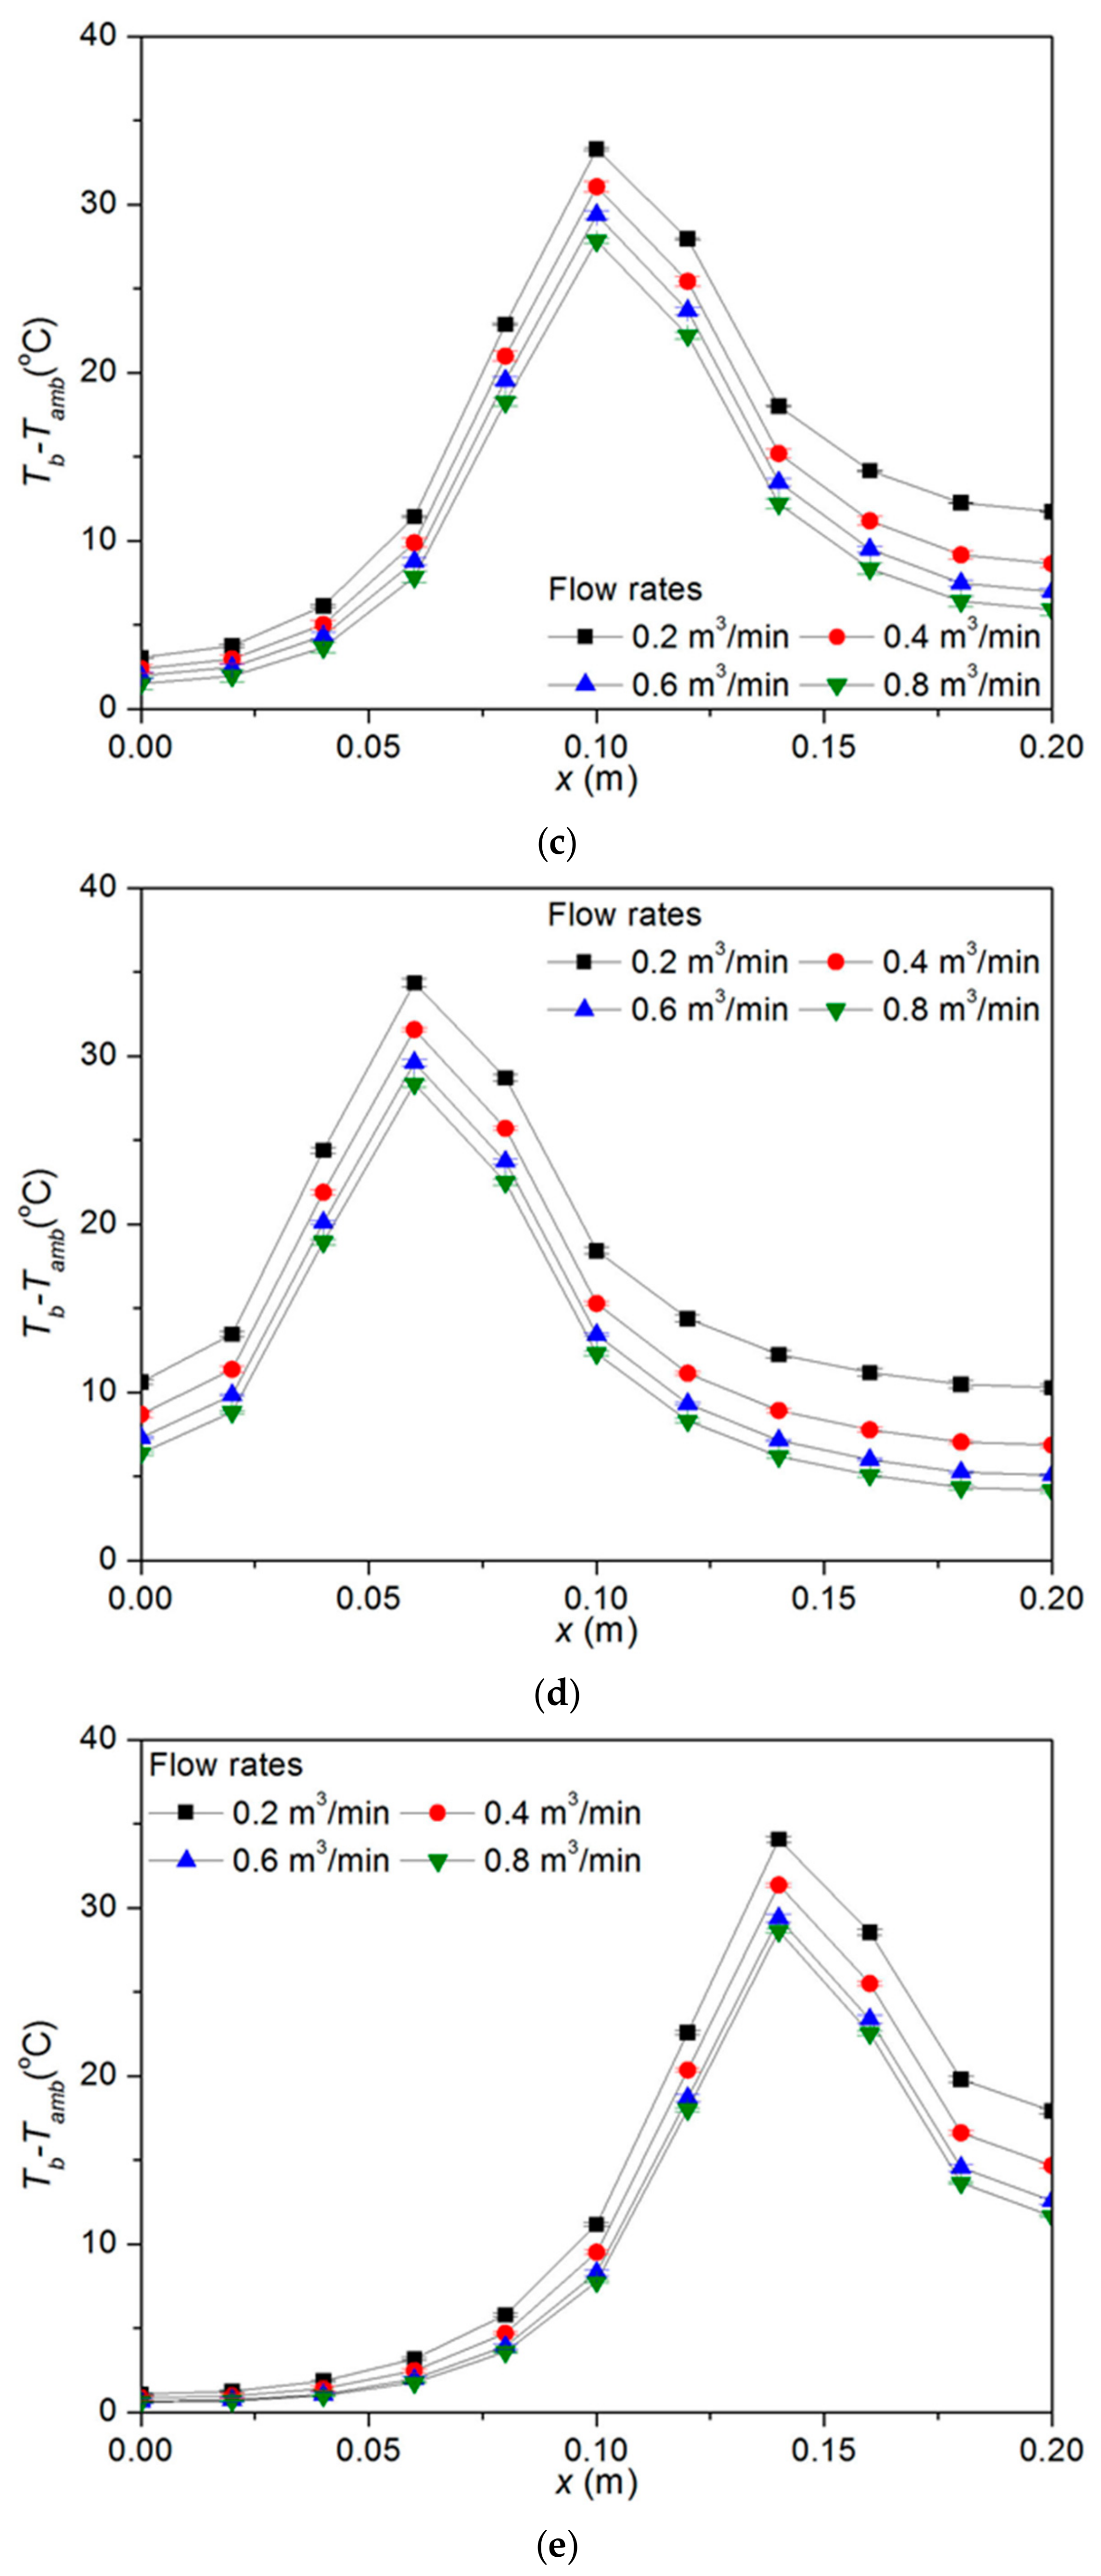
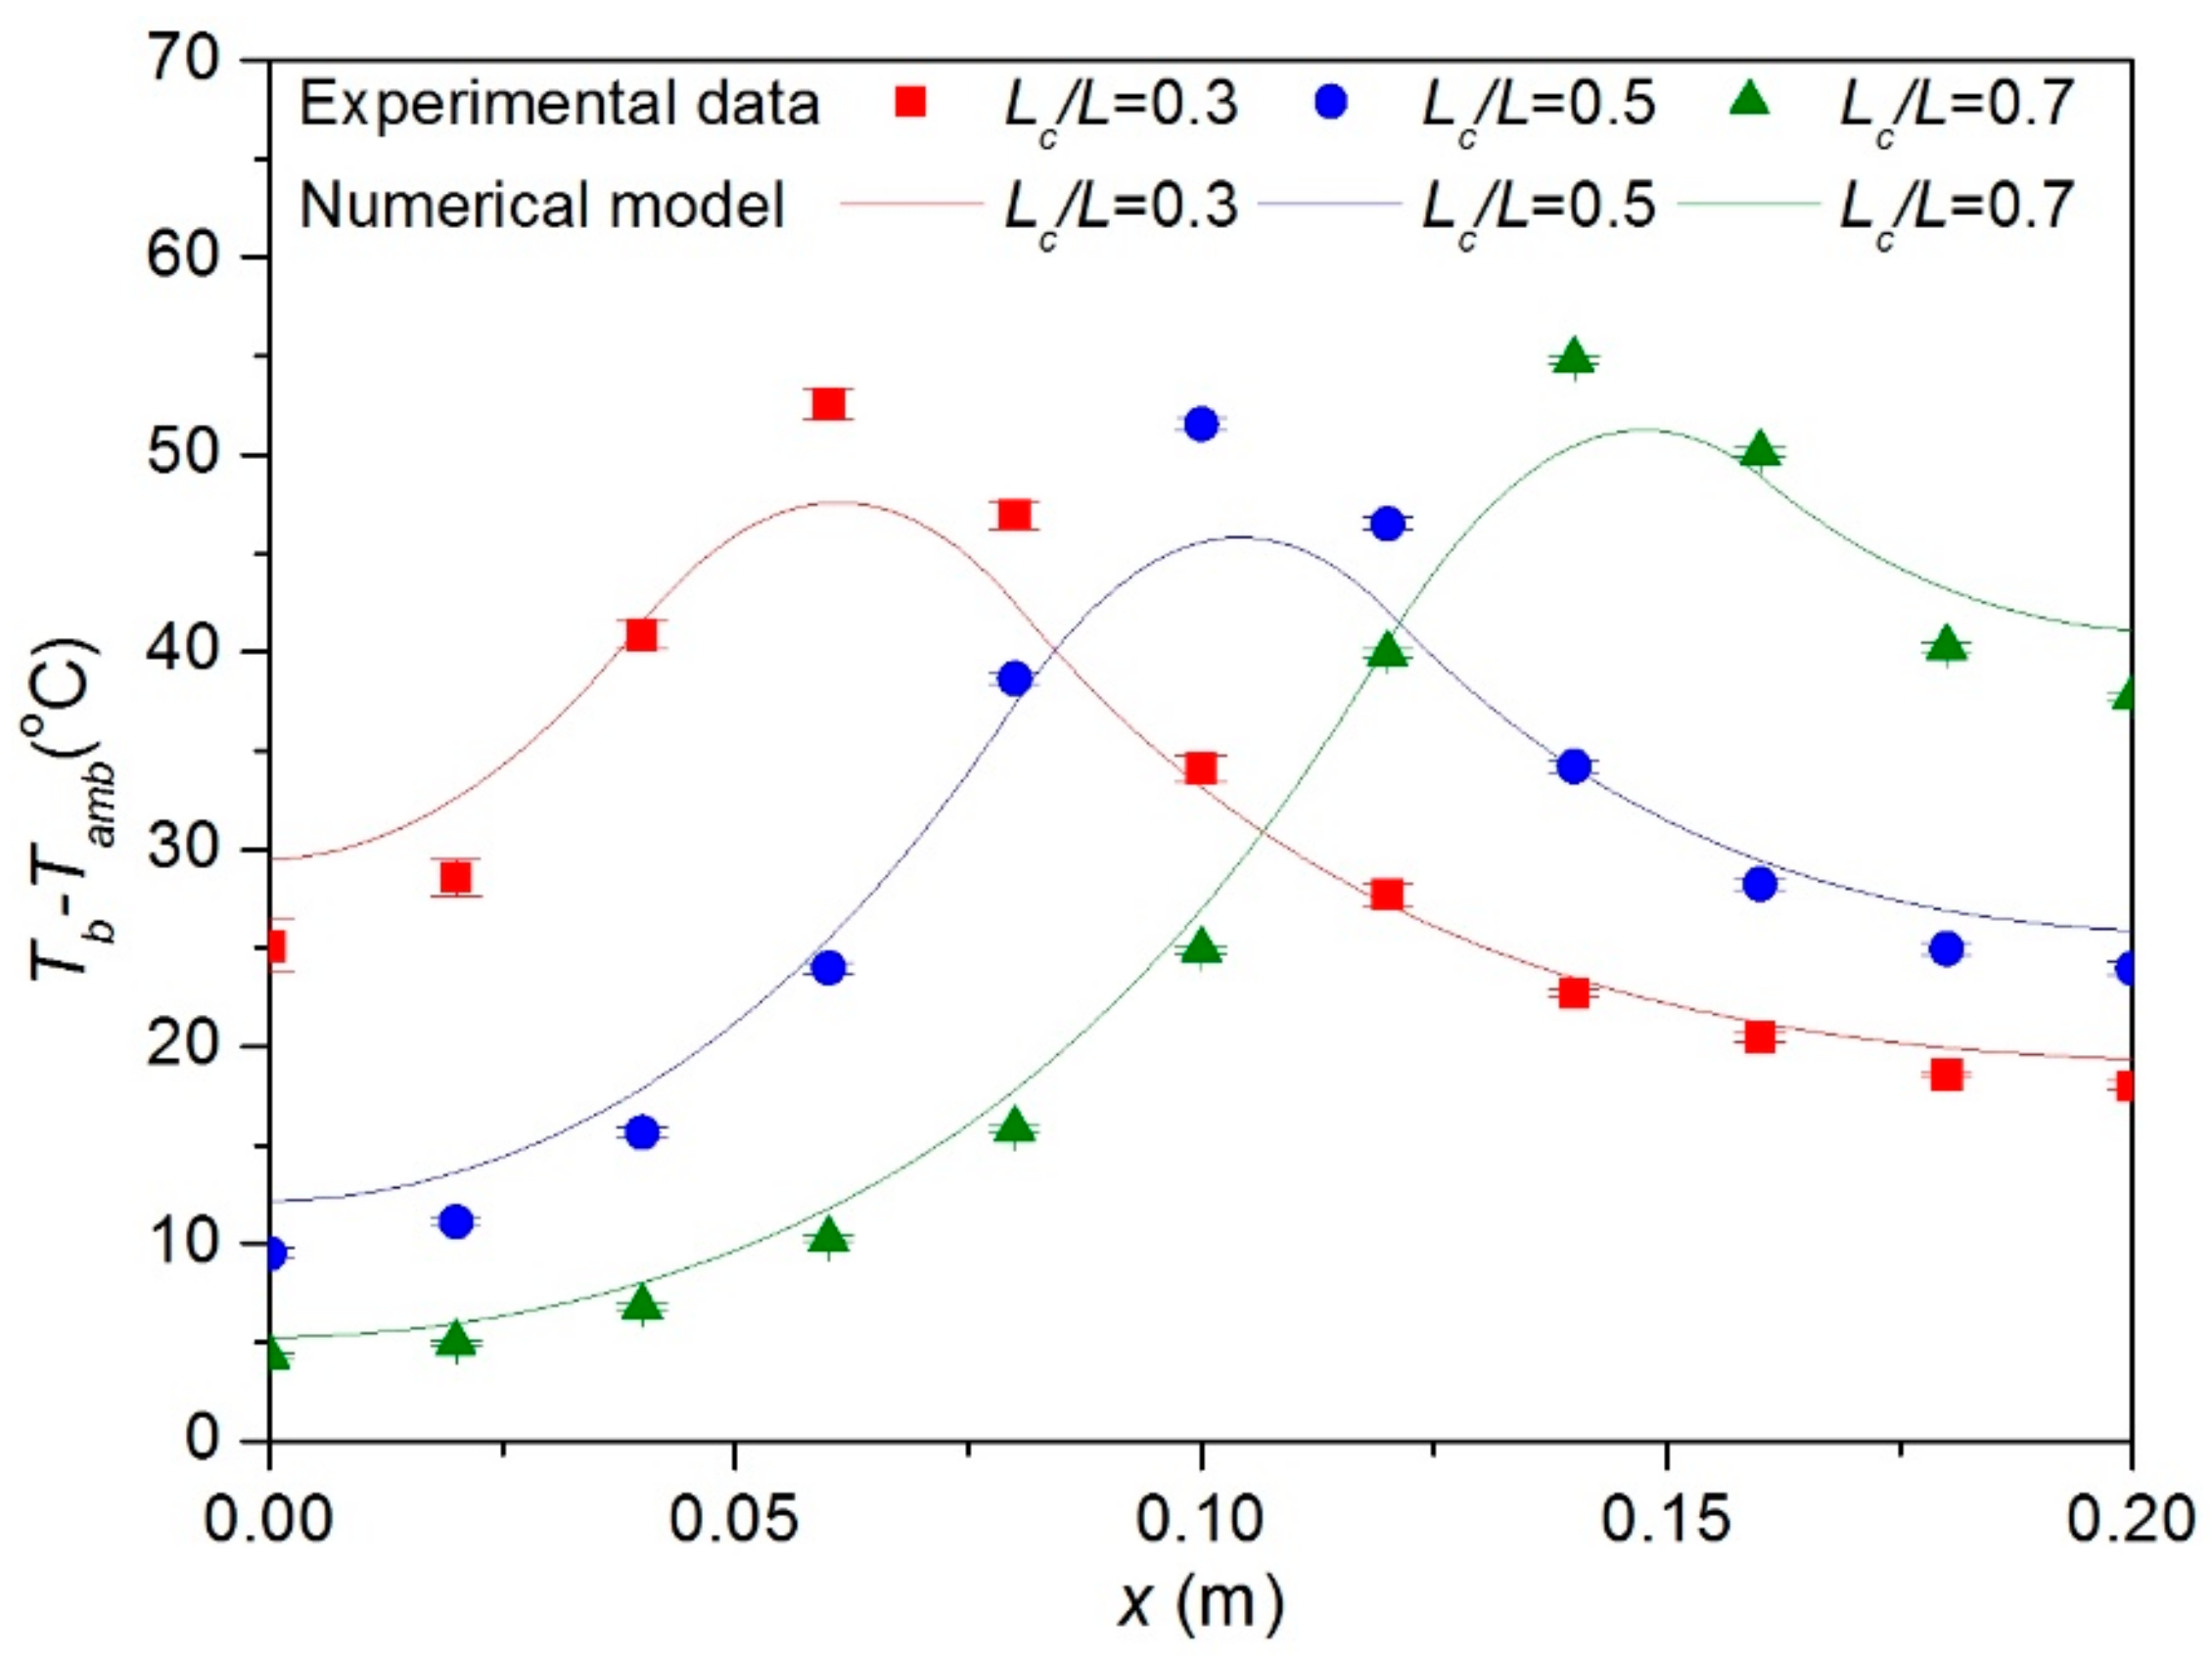
- The point at which the base temperature was maximized always existed in the portion where the heat sink was heated. When the size of the heating portion was equal to the size of the heat sink, the point at which the base temperature was maximized lay almost at the end of the heating portion where x was the largest. When the size of the heating portion was much smaller than the size of the heat sink, the point where the base temperature was maximized was almost at the center of the heating portion.
- (d)
- The base temperature at x = Lc + Δx was larger than the base temperature at x = Lc − Δx, regardless of the value of Δx. This was mainly because the fluid temperature monotonically increased as x increased.
- (e)
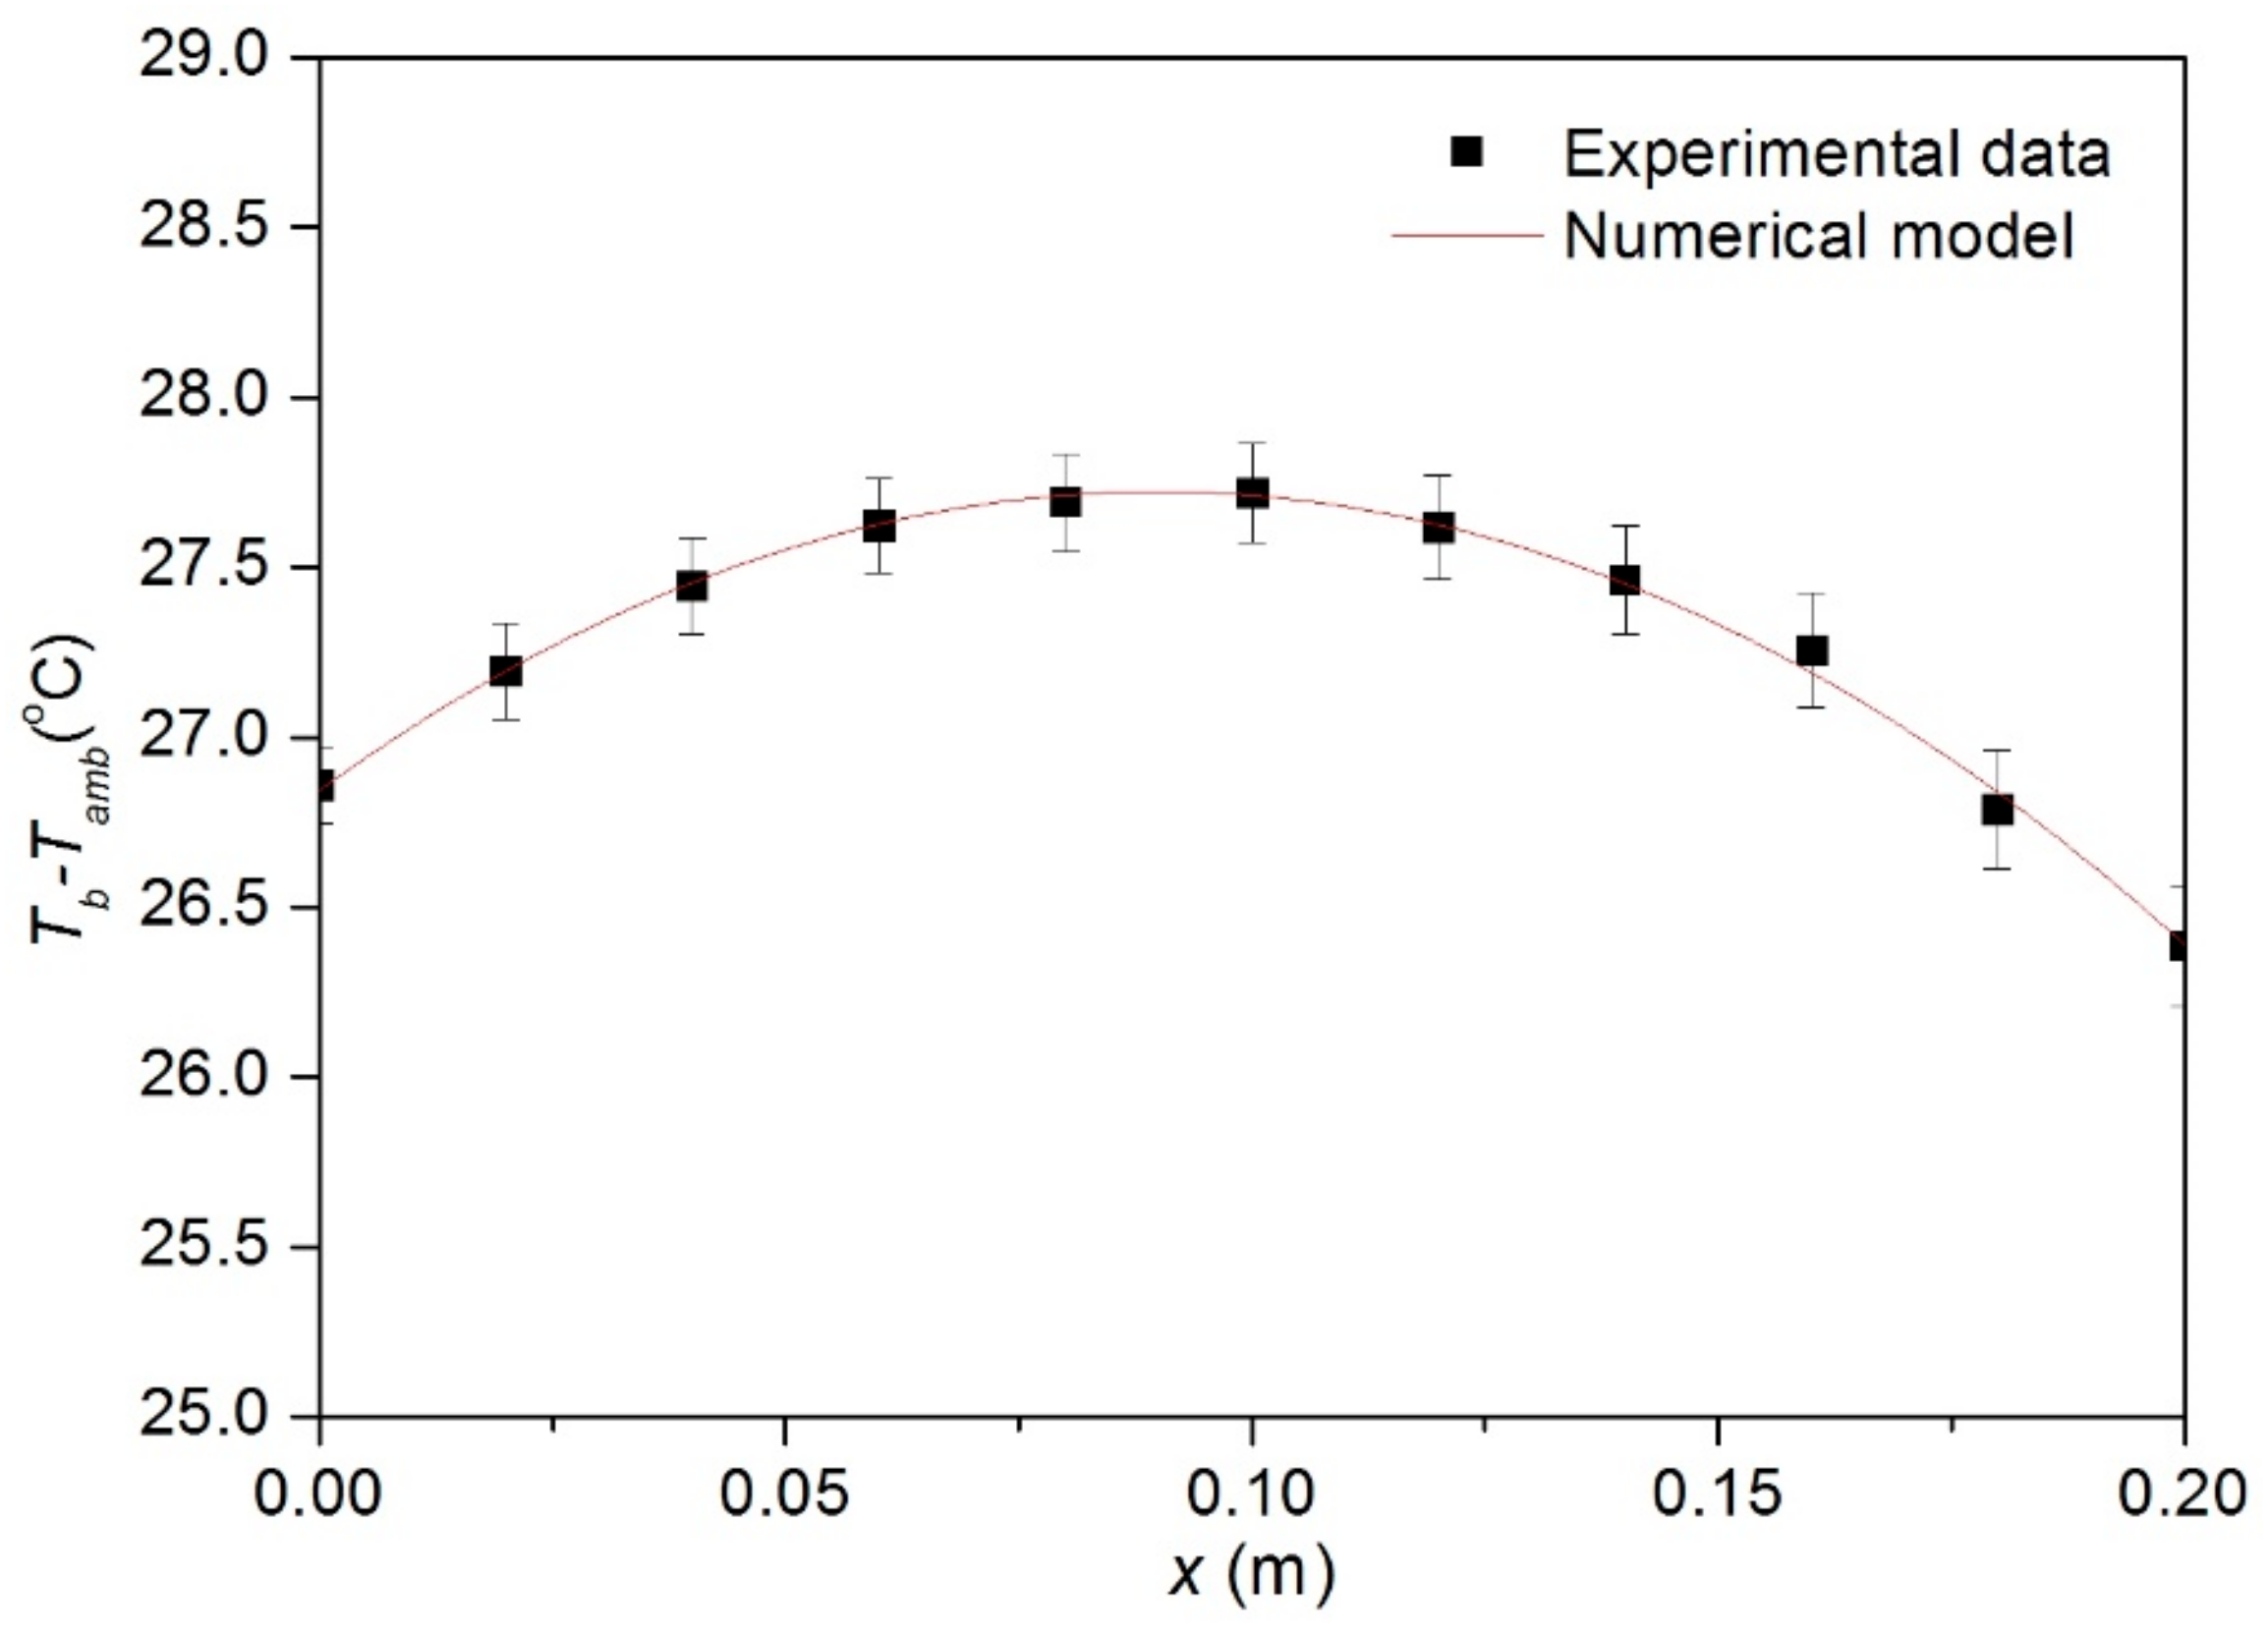
- As shown in Figure 4a, when the heat sink was uniformly heated, the base temperature increased monotonically with an increase in x. This was because the temperature of the fluid increased as x increased. This was also because the heat transfer coefficient, which was inversely proportional to the temperature difference between the fluid temperature and the base temperature, decreased as x increased.
- (a)
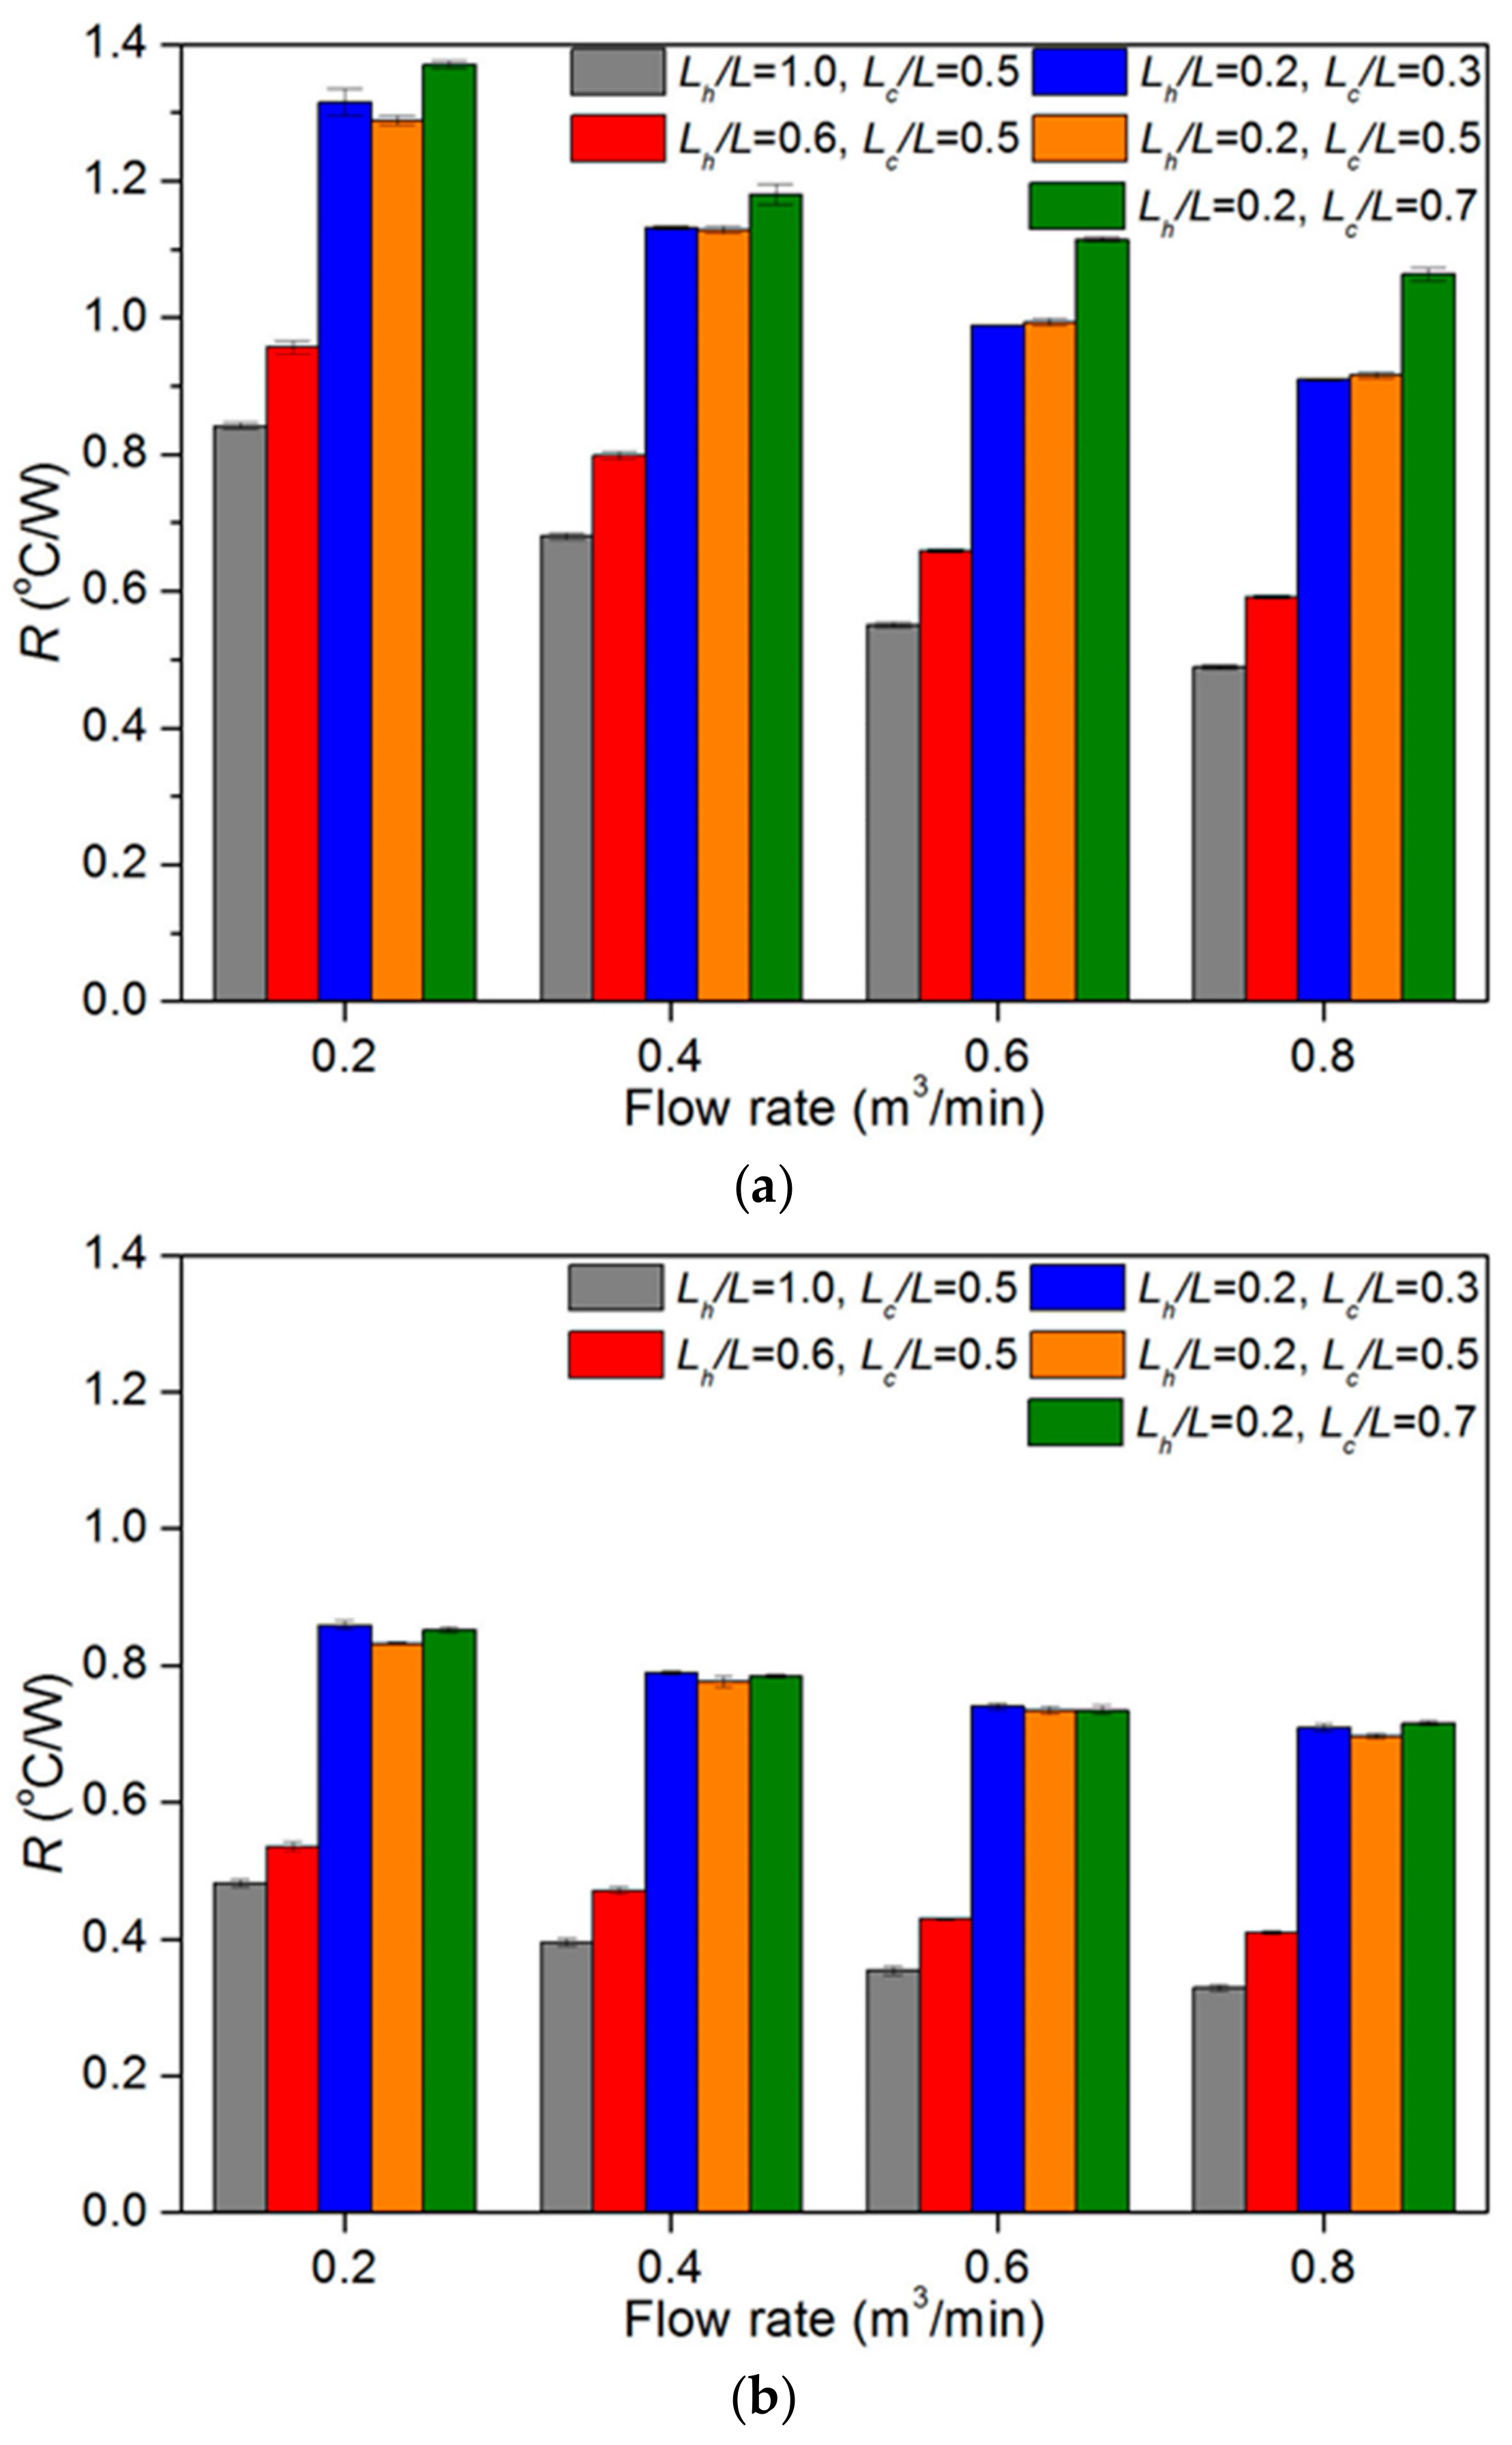
- Regardless of the heating position and channel width, the thermal resistance decreased monotonically as the flow rate increased. This was because the temperature of the cooling fluid filling the inside of the heat sink decreased as the flow rate increased.
- (b)
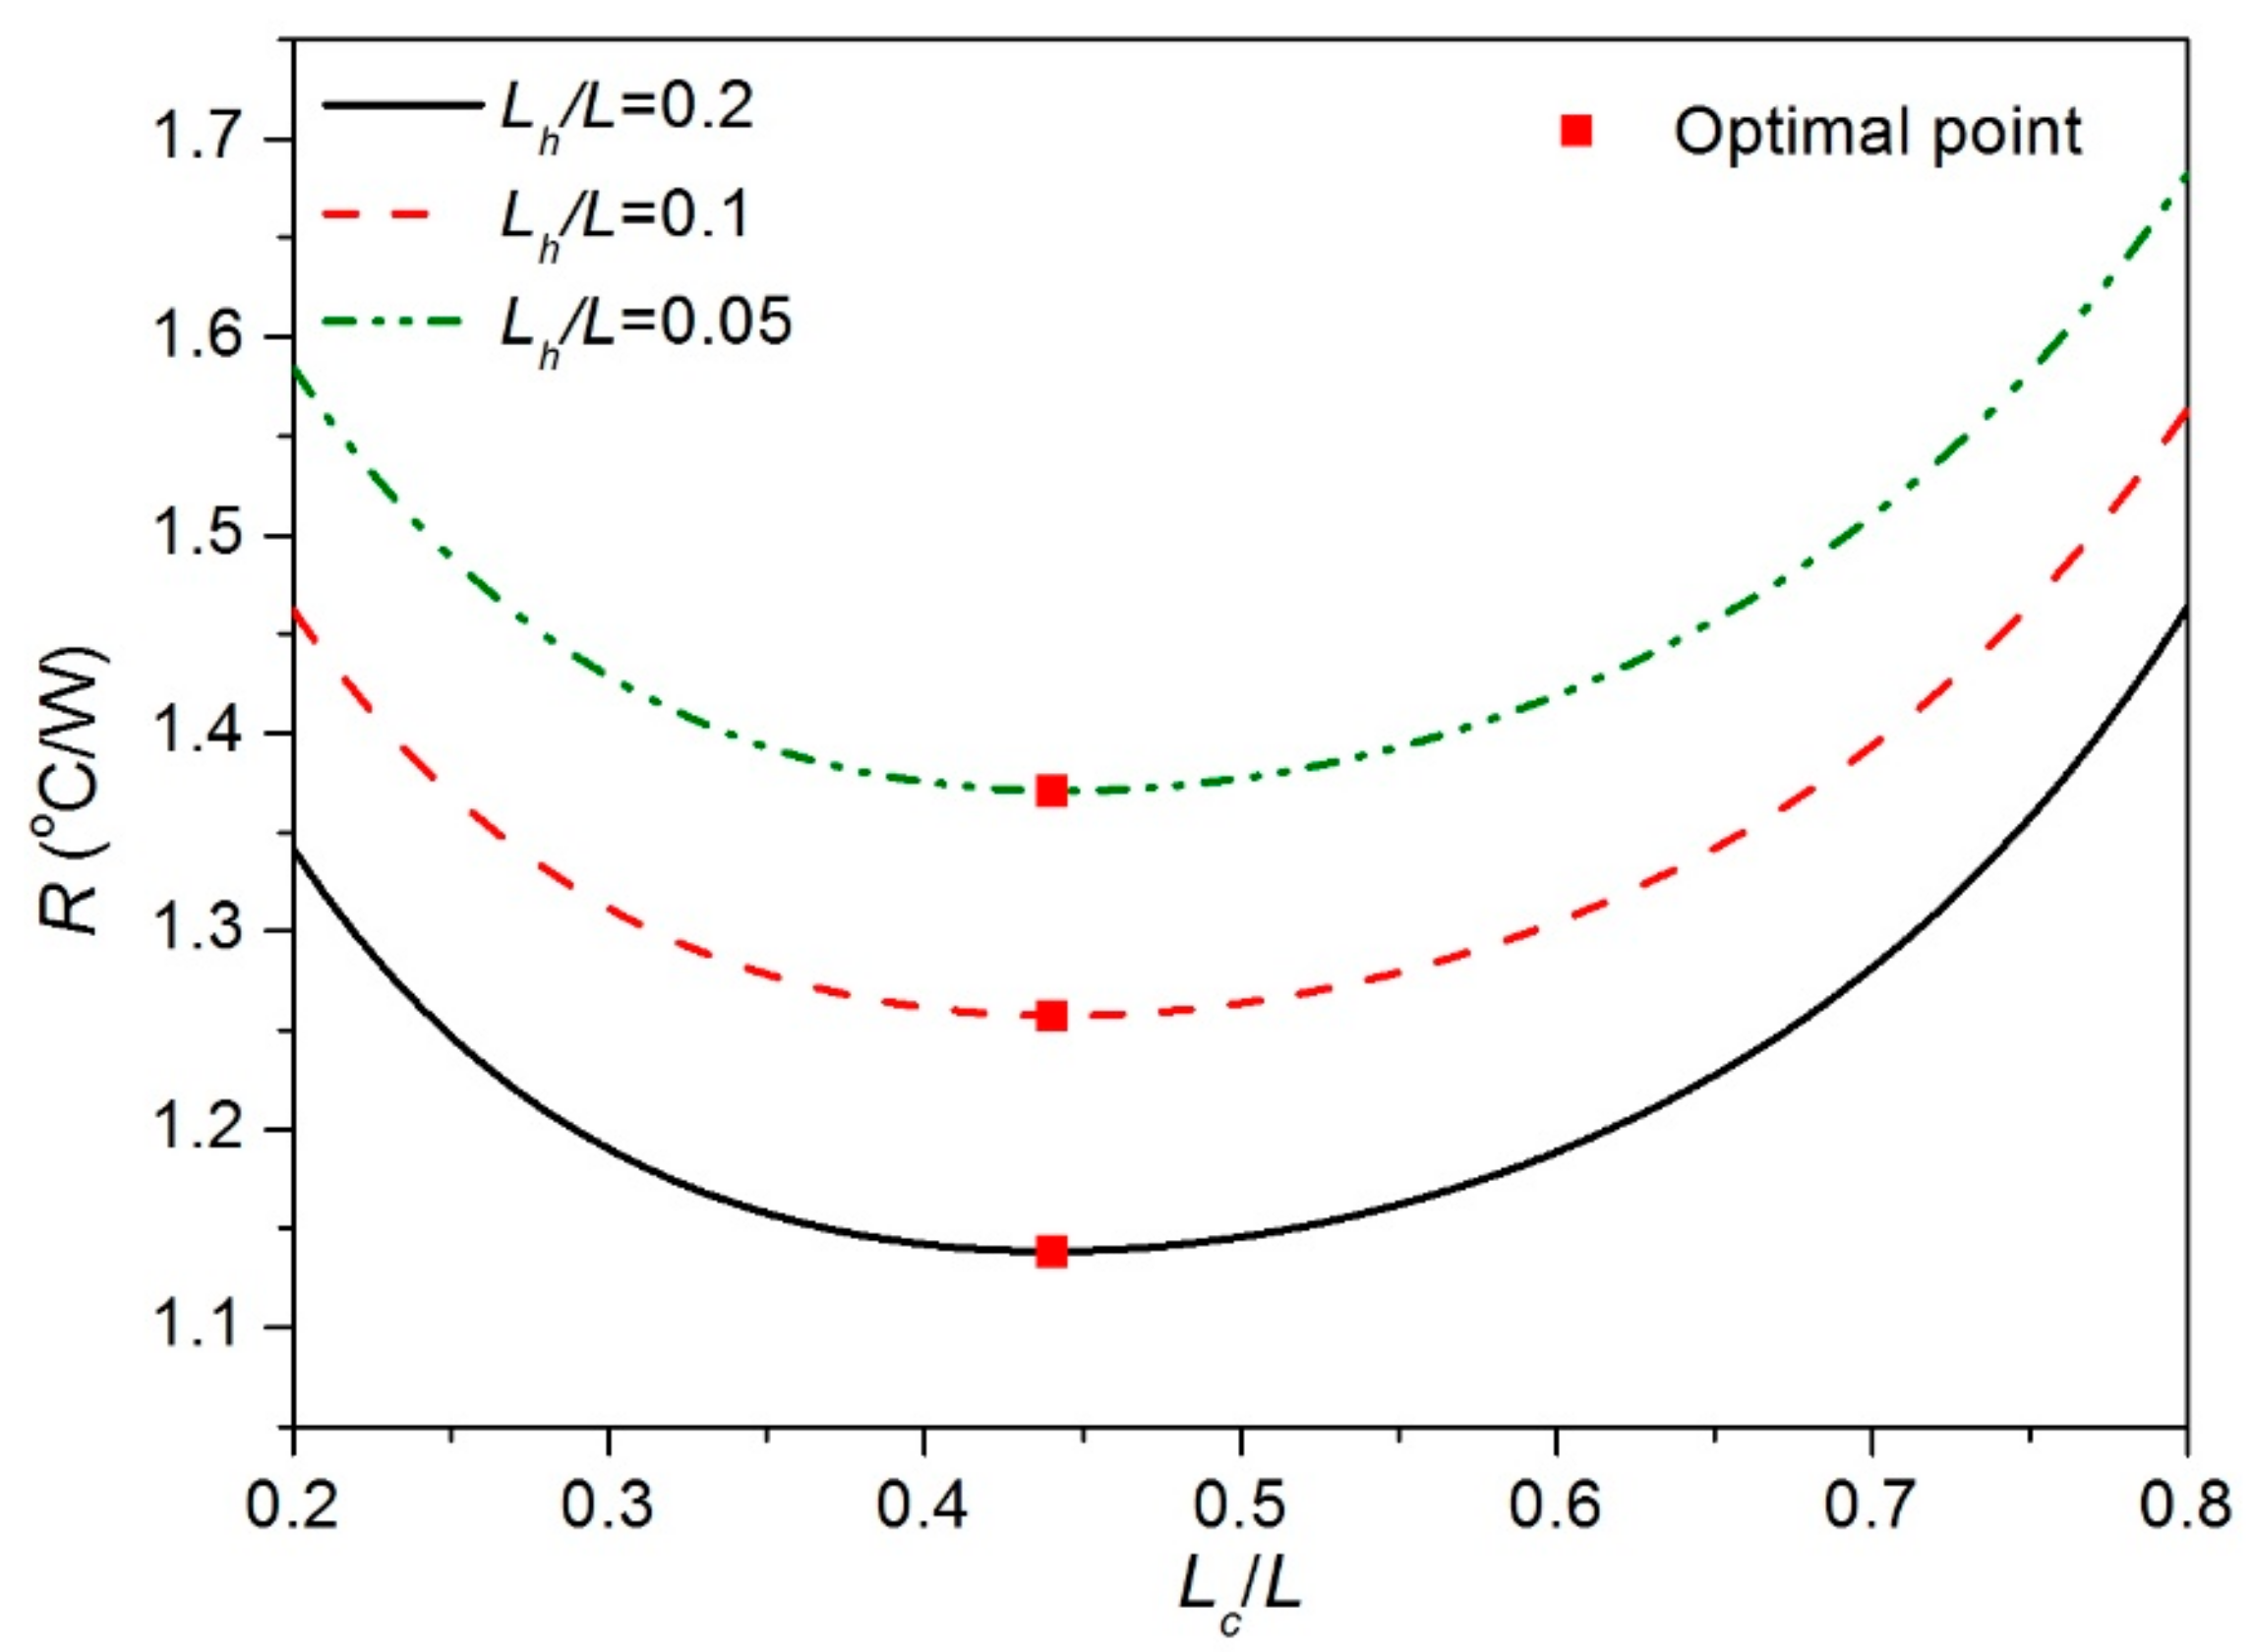
- Regardless of the channel width and flow rate, the thermal resistance increased as the heating length decreased. This was because the heat sink base was more heavily heated locally, owing to an increase in heat flux (amount of heat per unit area) applied to the heated portion of the heat sink base as the heating length decreased. When the heat sink base was uniformly heated, heat was uniformly dissipated from the heat sink to the fluid through the heat sink surface. In contrast, only a part of the surface was mainly used for the heat dissipation in the case of the locally heated heat sink.
- (c)
- There was an optimal heating position that minimized the thermal resistance when the heating length was fixed. However, as shown in Figure 6a, the optimal heating position was not fixed and could be changed by changing the flow rate.
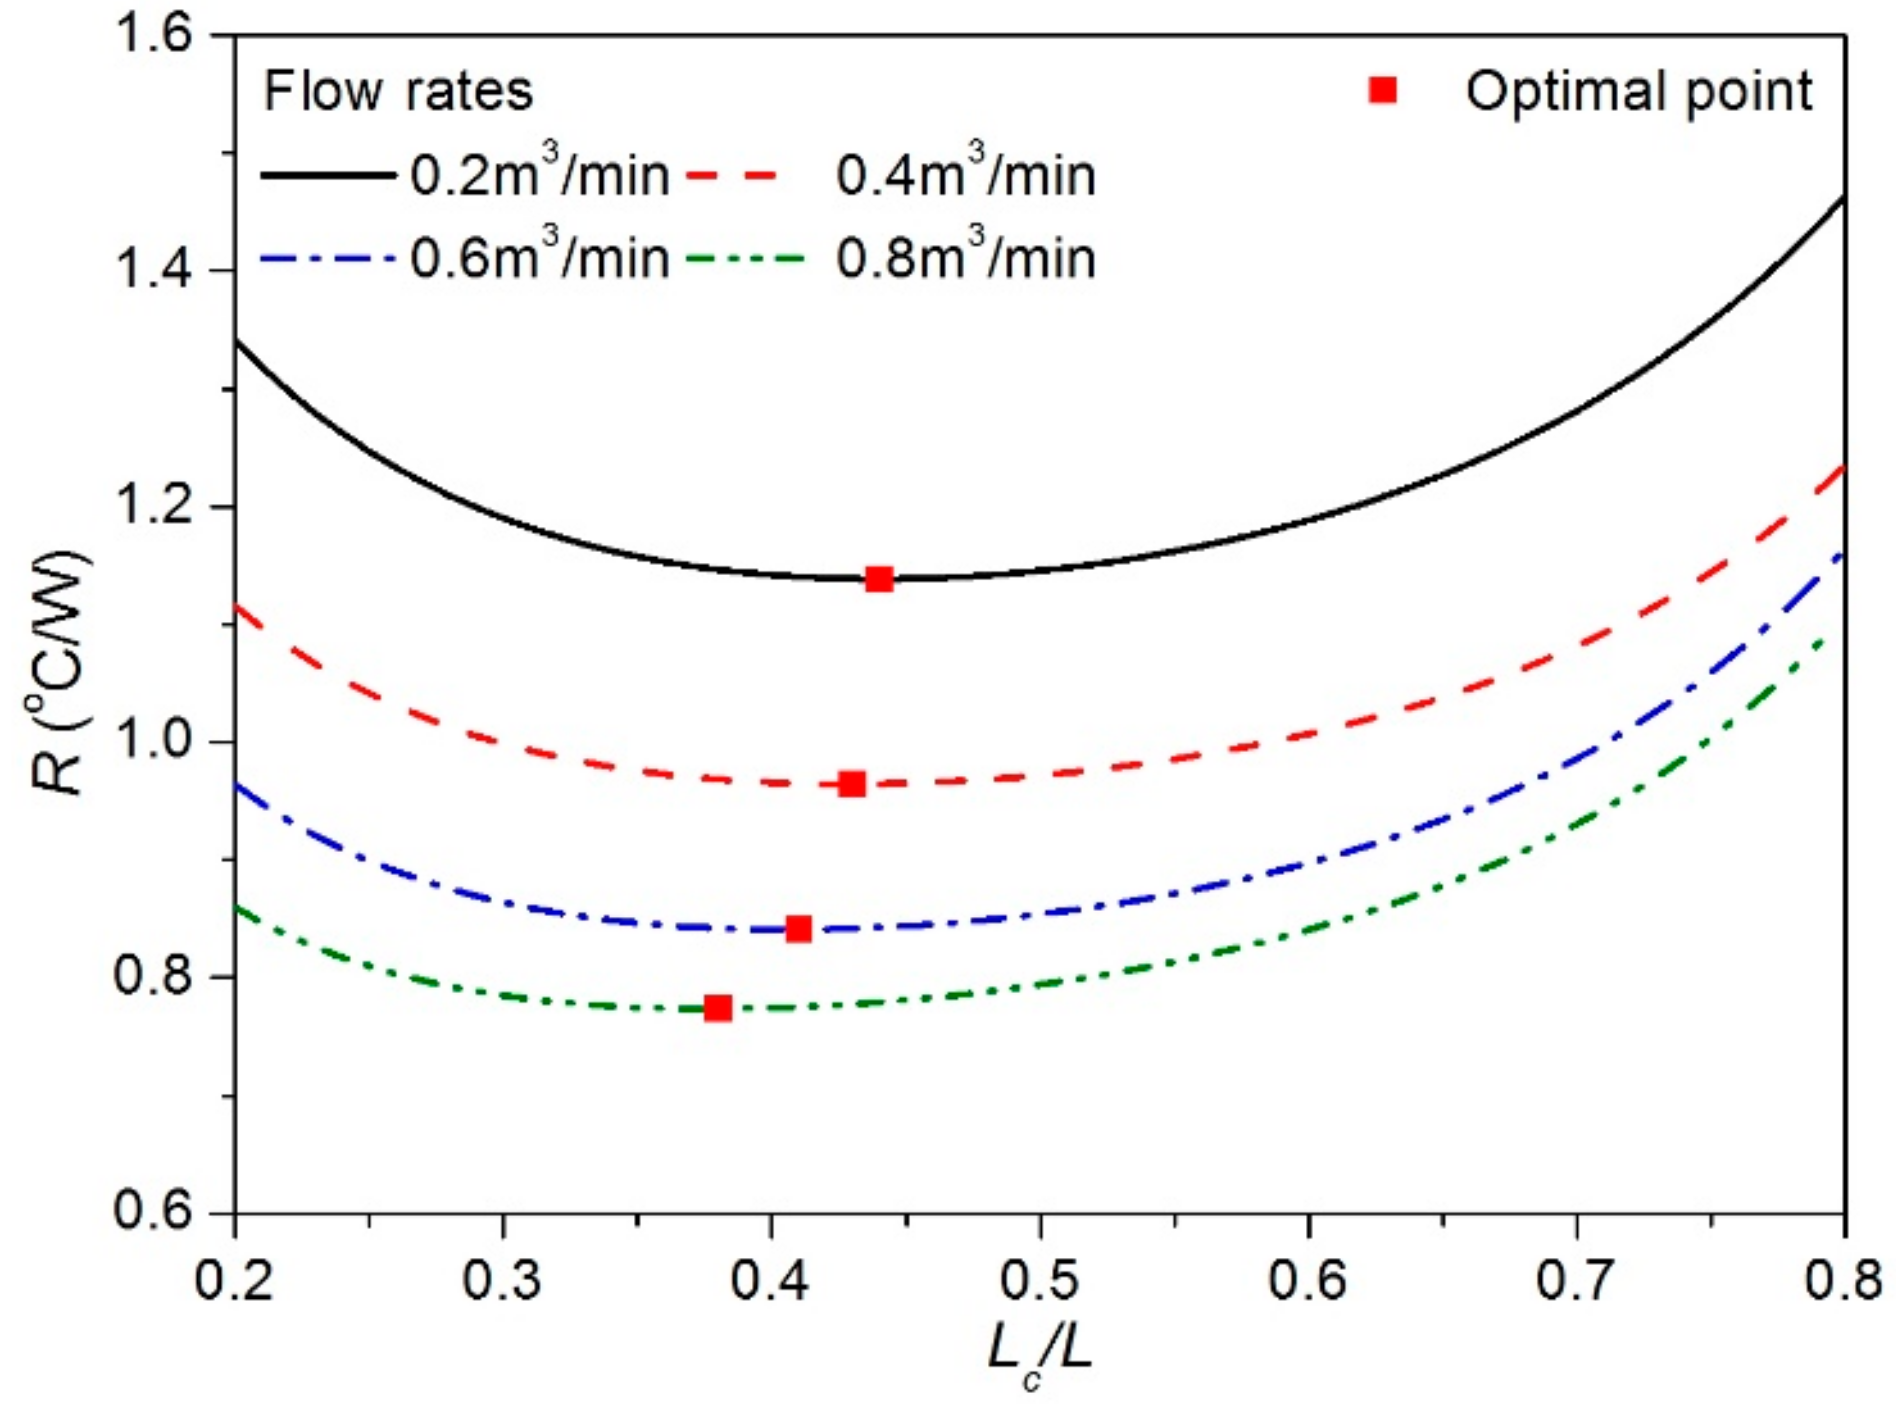
- (a)
- When the flow rate was fixed, there was an optimal heating position that minimized the thermal resistance.
- (b)
- The optimal heating position was not independent of the flow rate. In this study, the optimal heating position moved toward the smaller x as the flow rate increased. Therefore, when controlling the flow rate from the fan in an actual situation, this fact should be considered to determine the heating position.
- (c)
- If the heating position moved slightly in the positive x direction or in the negative x direction from the optimal heating position, the thermal resistance did not increase significantly. Therefore, in an actual situation, a slight change of the heating position from the optimal heating position was acceptable.
- (d)
- However, if the heating position was far from the optimal heating position, the thermal resistance could be very large. Therefore, in an actual situation, the heating position should not be close to the front or rear ends of the heat sink.
- (e)
- As presented earlier, Emekwuru et al. showed that the thermal resistance was minimized when the heating position was centrally located for most Reynolds numbers [21]. On the other hand, Yoon et al. showed that the thermal performance was maximized when the heating position was located on the downstream side near the center of the heat sink [14]. However, these conclusions from the previous studies did not apply to the situation examined in this study. Figure 7 indicates that the thermal performance was maximized when the heating position was located on the upstream side. In addition, Figure 6a also shows that the optimal heating position was located on the upstream side in some cases. The main reason why the conclusions from the previous studies did not apply to the situation examined in this study was that the previous study was focused on heat sinks under turbulent flows with very high flow rates and the present experiments were conducted for heat sinks under laminar developing flows. The fact that Lelea also observed that upstream heating had a better thermal performance than central or downstream heating for the heat sink under laminar flow in his study [19] supported this reasoning, although his study was focused on water-cooled microchannel heat sinks.
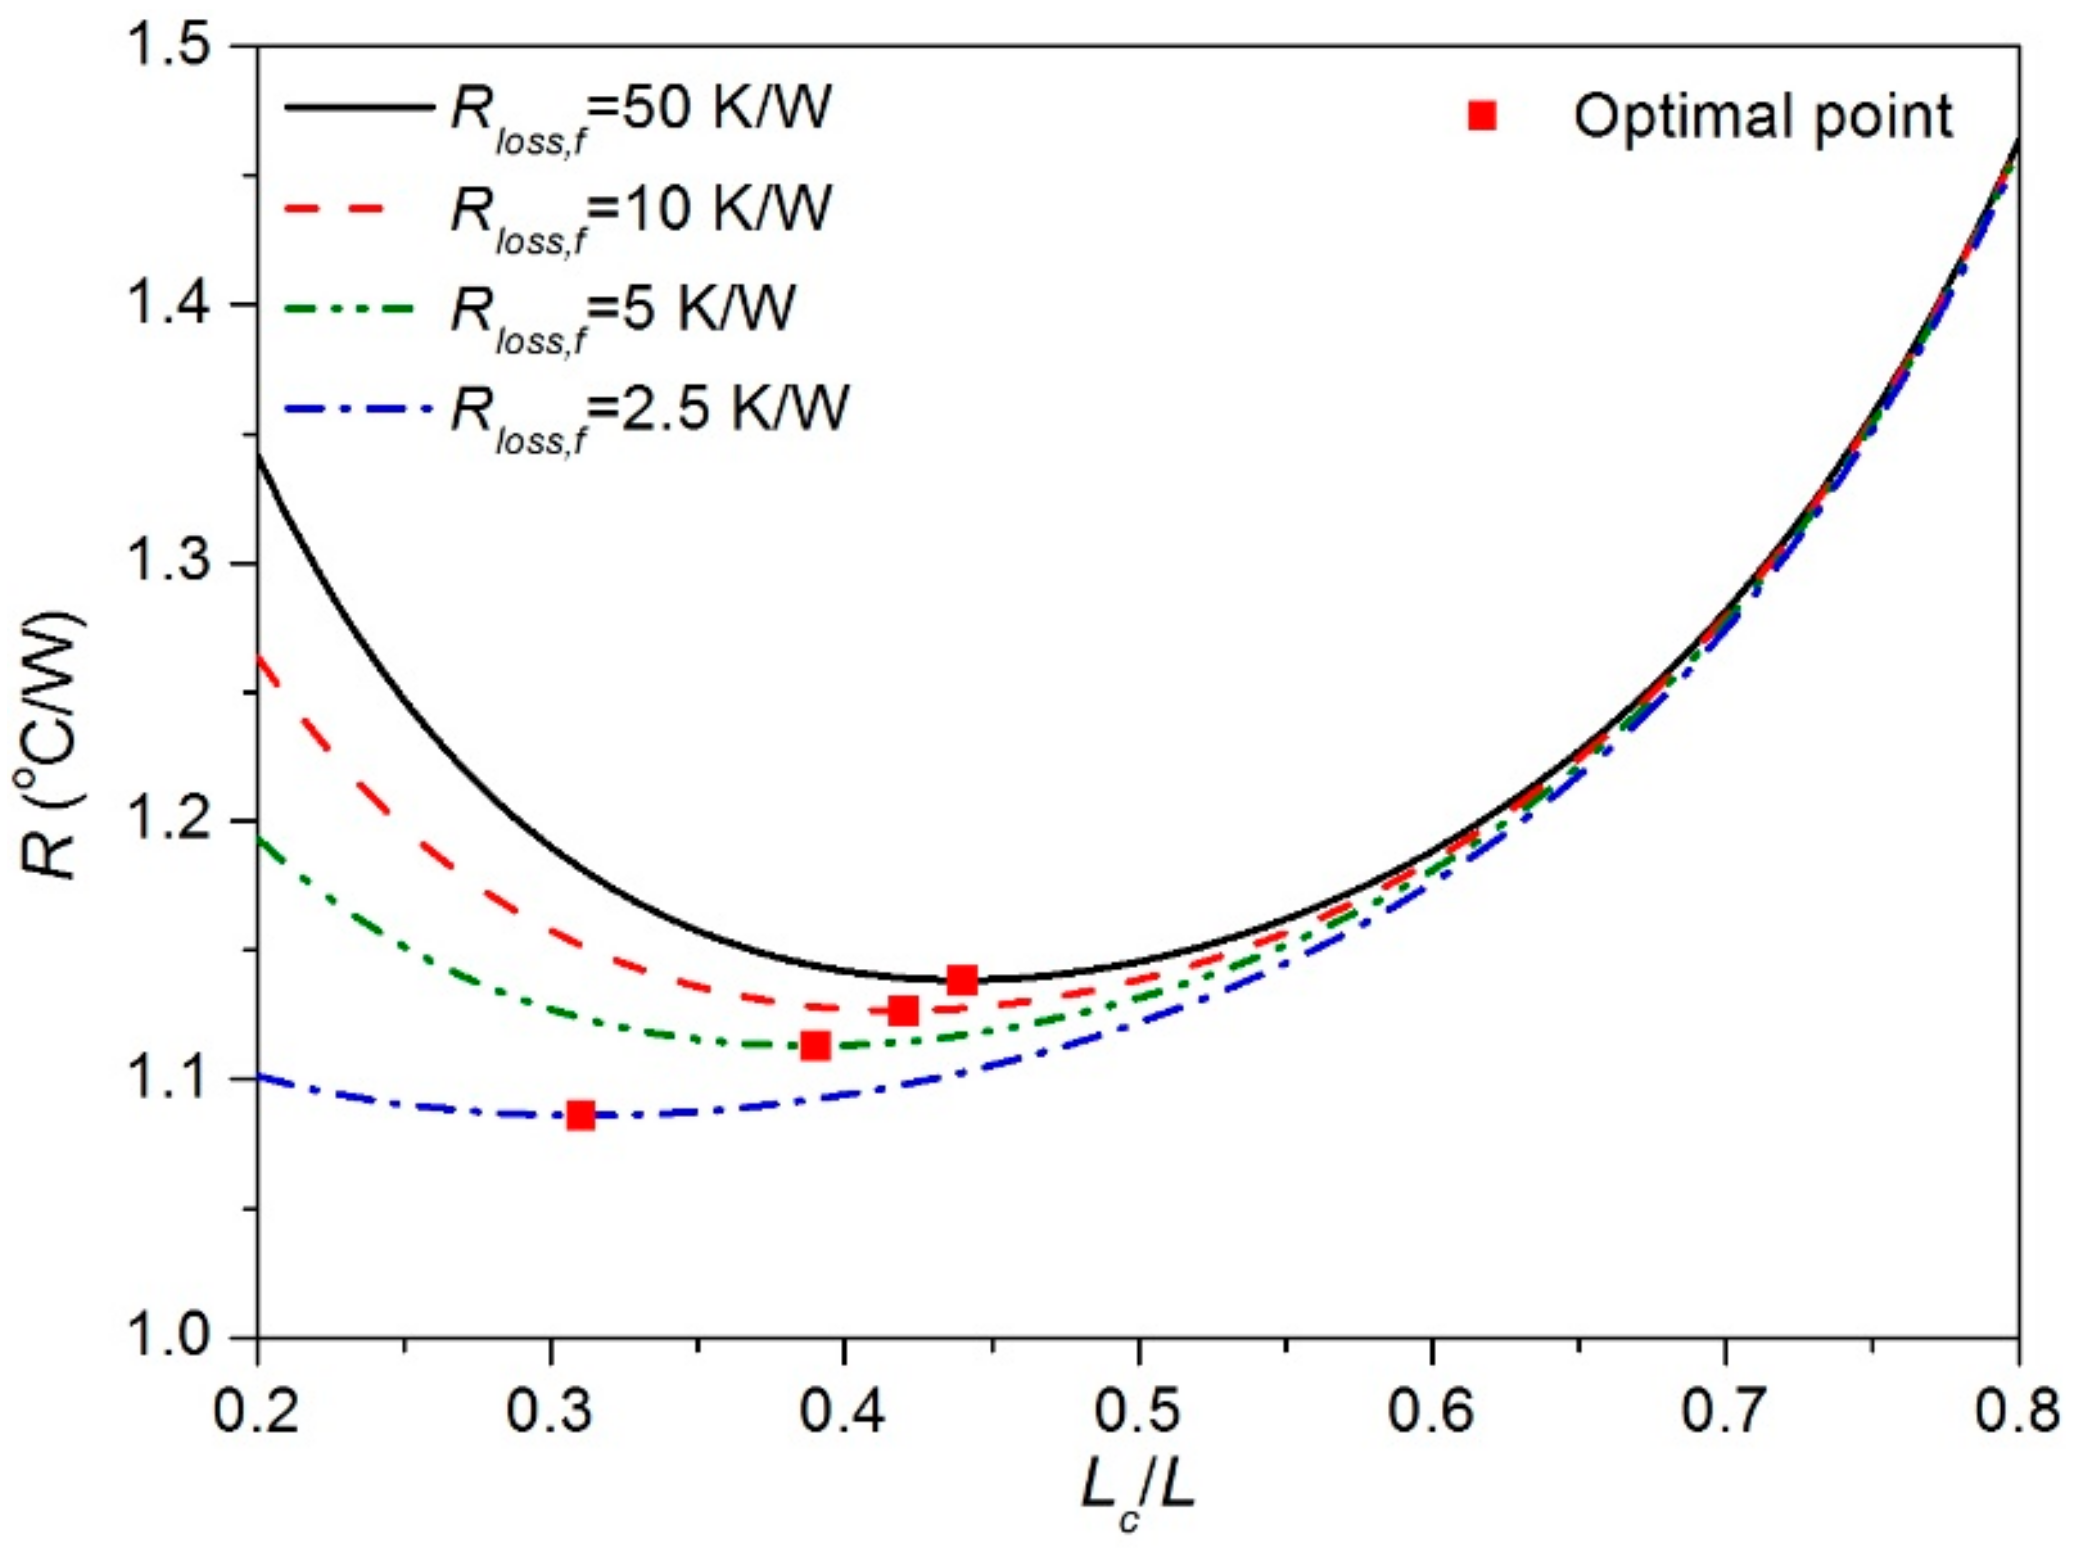
- (a)
- The optimal heating position could change significantly due to heat losses through the front and back of heat sink. Therefore, even when the heat sink with the same dimensions was under the same flow rate, the optimal heating position could be completely different depending on how the heat sink was connected to the other devices in the thermal system.
- (b)
- The optimal heating position moved toward the smaller x as the heat loss through the front of the heat sink increased.
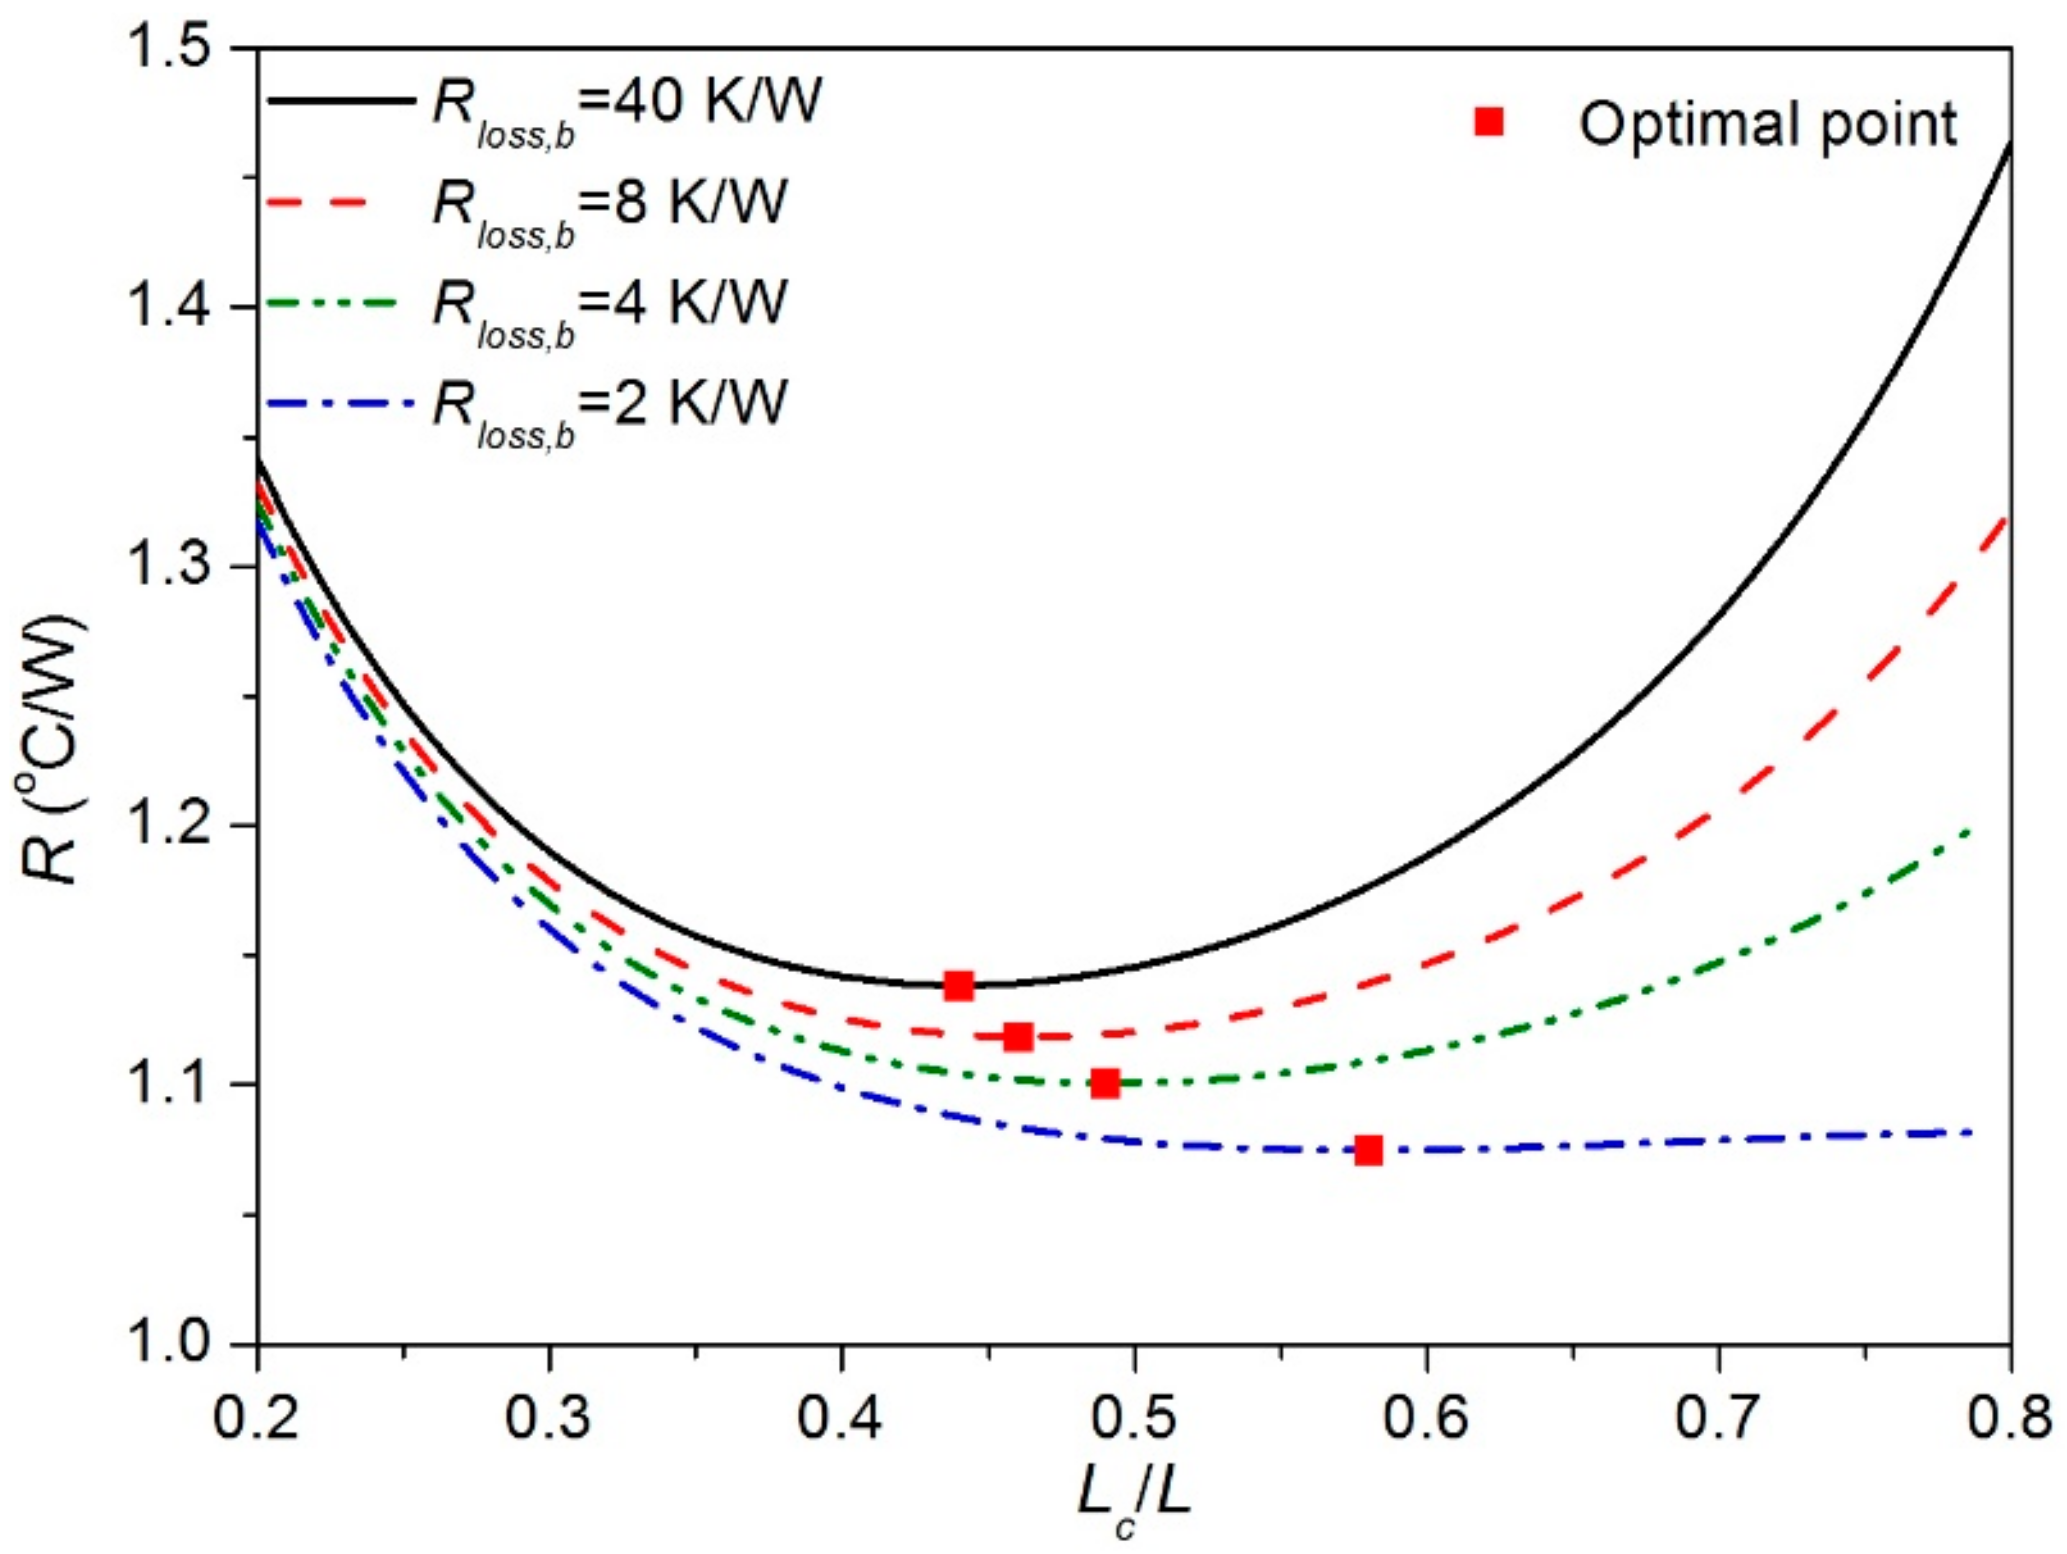
- (c)
- The optimal heating position moved toward the larger x as the heat loss through the back of the heat sink increased.
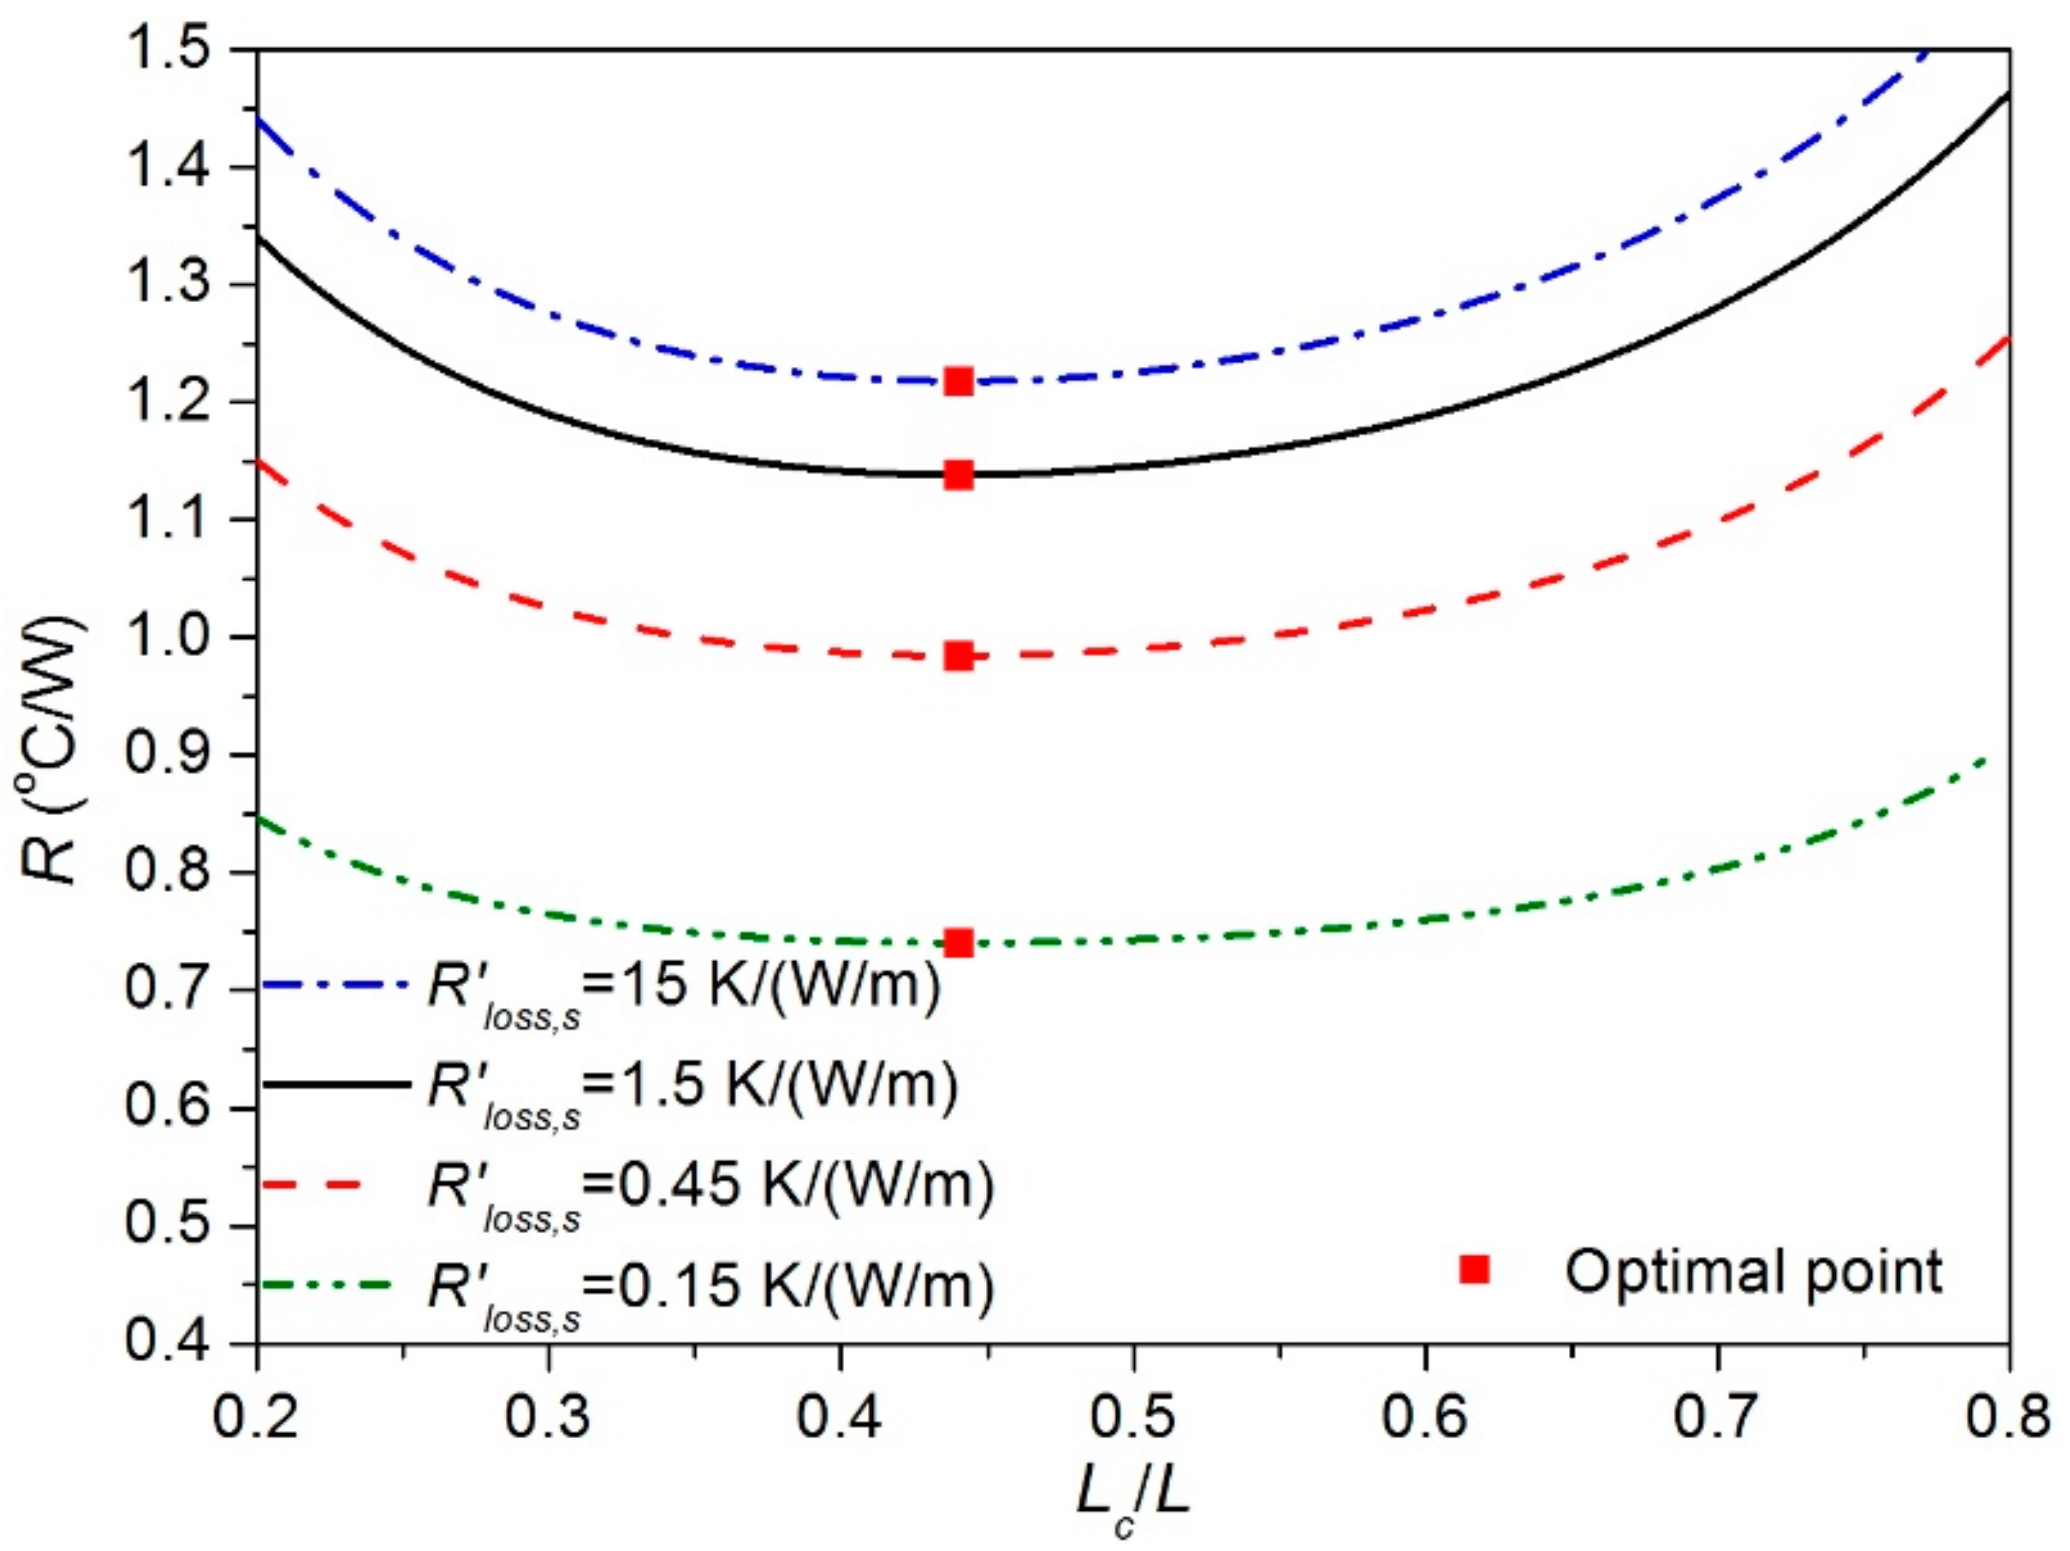
- (d)
- The optimal heating position was almost independent to the heat loss through the sides of the heat sink.
4. Conclusions
- (a)
- The optimal heating position was on the upstream side in the case of the heat sinks under a laminar developing flow that were investigated in the present study. On the contrary, as shown in a previous study [14], the optimal heating position was on the downstream side in the case of the heat sinks under turbulent flow.
- (b)
- The optimal heating position could change significantly due to heat losses through the front and back of heat sink. Therefore, even when the heat sink with the same dimensions was under the same flow rate, the optimal heating position could be completely different depending on how the heat sink was connected to other devices in the thermal system.
- (c)
- The optimal heating position was independent to the heat loss through the sides of the heat sink. The optimal heating position also did not depend strongly on the heated length.
- (d)
- The one-dimensional numerical model with empirical coefficients could reflect the important trends in the measured temperature profiles, thermal resistances, and optimal heating lengths.
- (a)
- The point at which the base temperature was maximized always existed in the portion where the heat sink was heated. When the size of the heating portion was equal to the size of the heat sink, the point at which the base temperature was maximized lay almost at the end of the heating portion where x was the largest. When the size of the heating portion was much smaller than the size of the heat sink, the point where the base temperature was maximized was almost at the center of the heating portion.
- (b)
- Regardless of the heating position and the channel width, the thermal resistance decreased monotonically as the flow rate increased. Regardless of the channel width and flow rate, the thermal resistance increased as the heating length decreased.
- (c)
- The optimal heating position was not independent of the flow rate.
- (d)
- If the heating position moved slightly in the positive x direction or in the negative x direction from the optimal heating position, the thermal resistance did not increase significantly. However, if the heating position was far from the optimal heating position, the thermal resistance could be very large.
Author Contributions
Funding
Conflicts of Interest
Nomenclature
| As | solid cross-sectional area |
| C1, C2, C3, C4 | empirical coefficients |
| cf | fluid heat capacity |
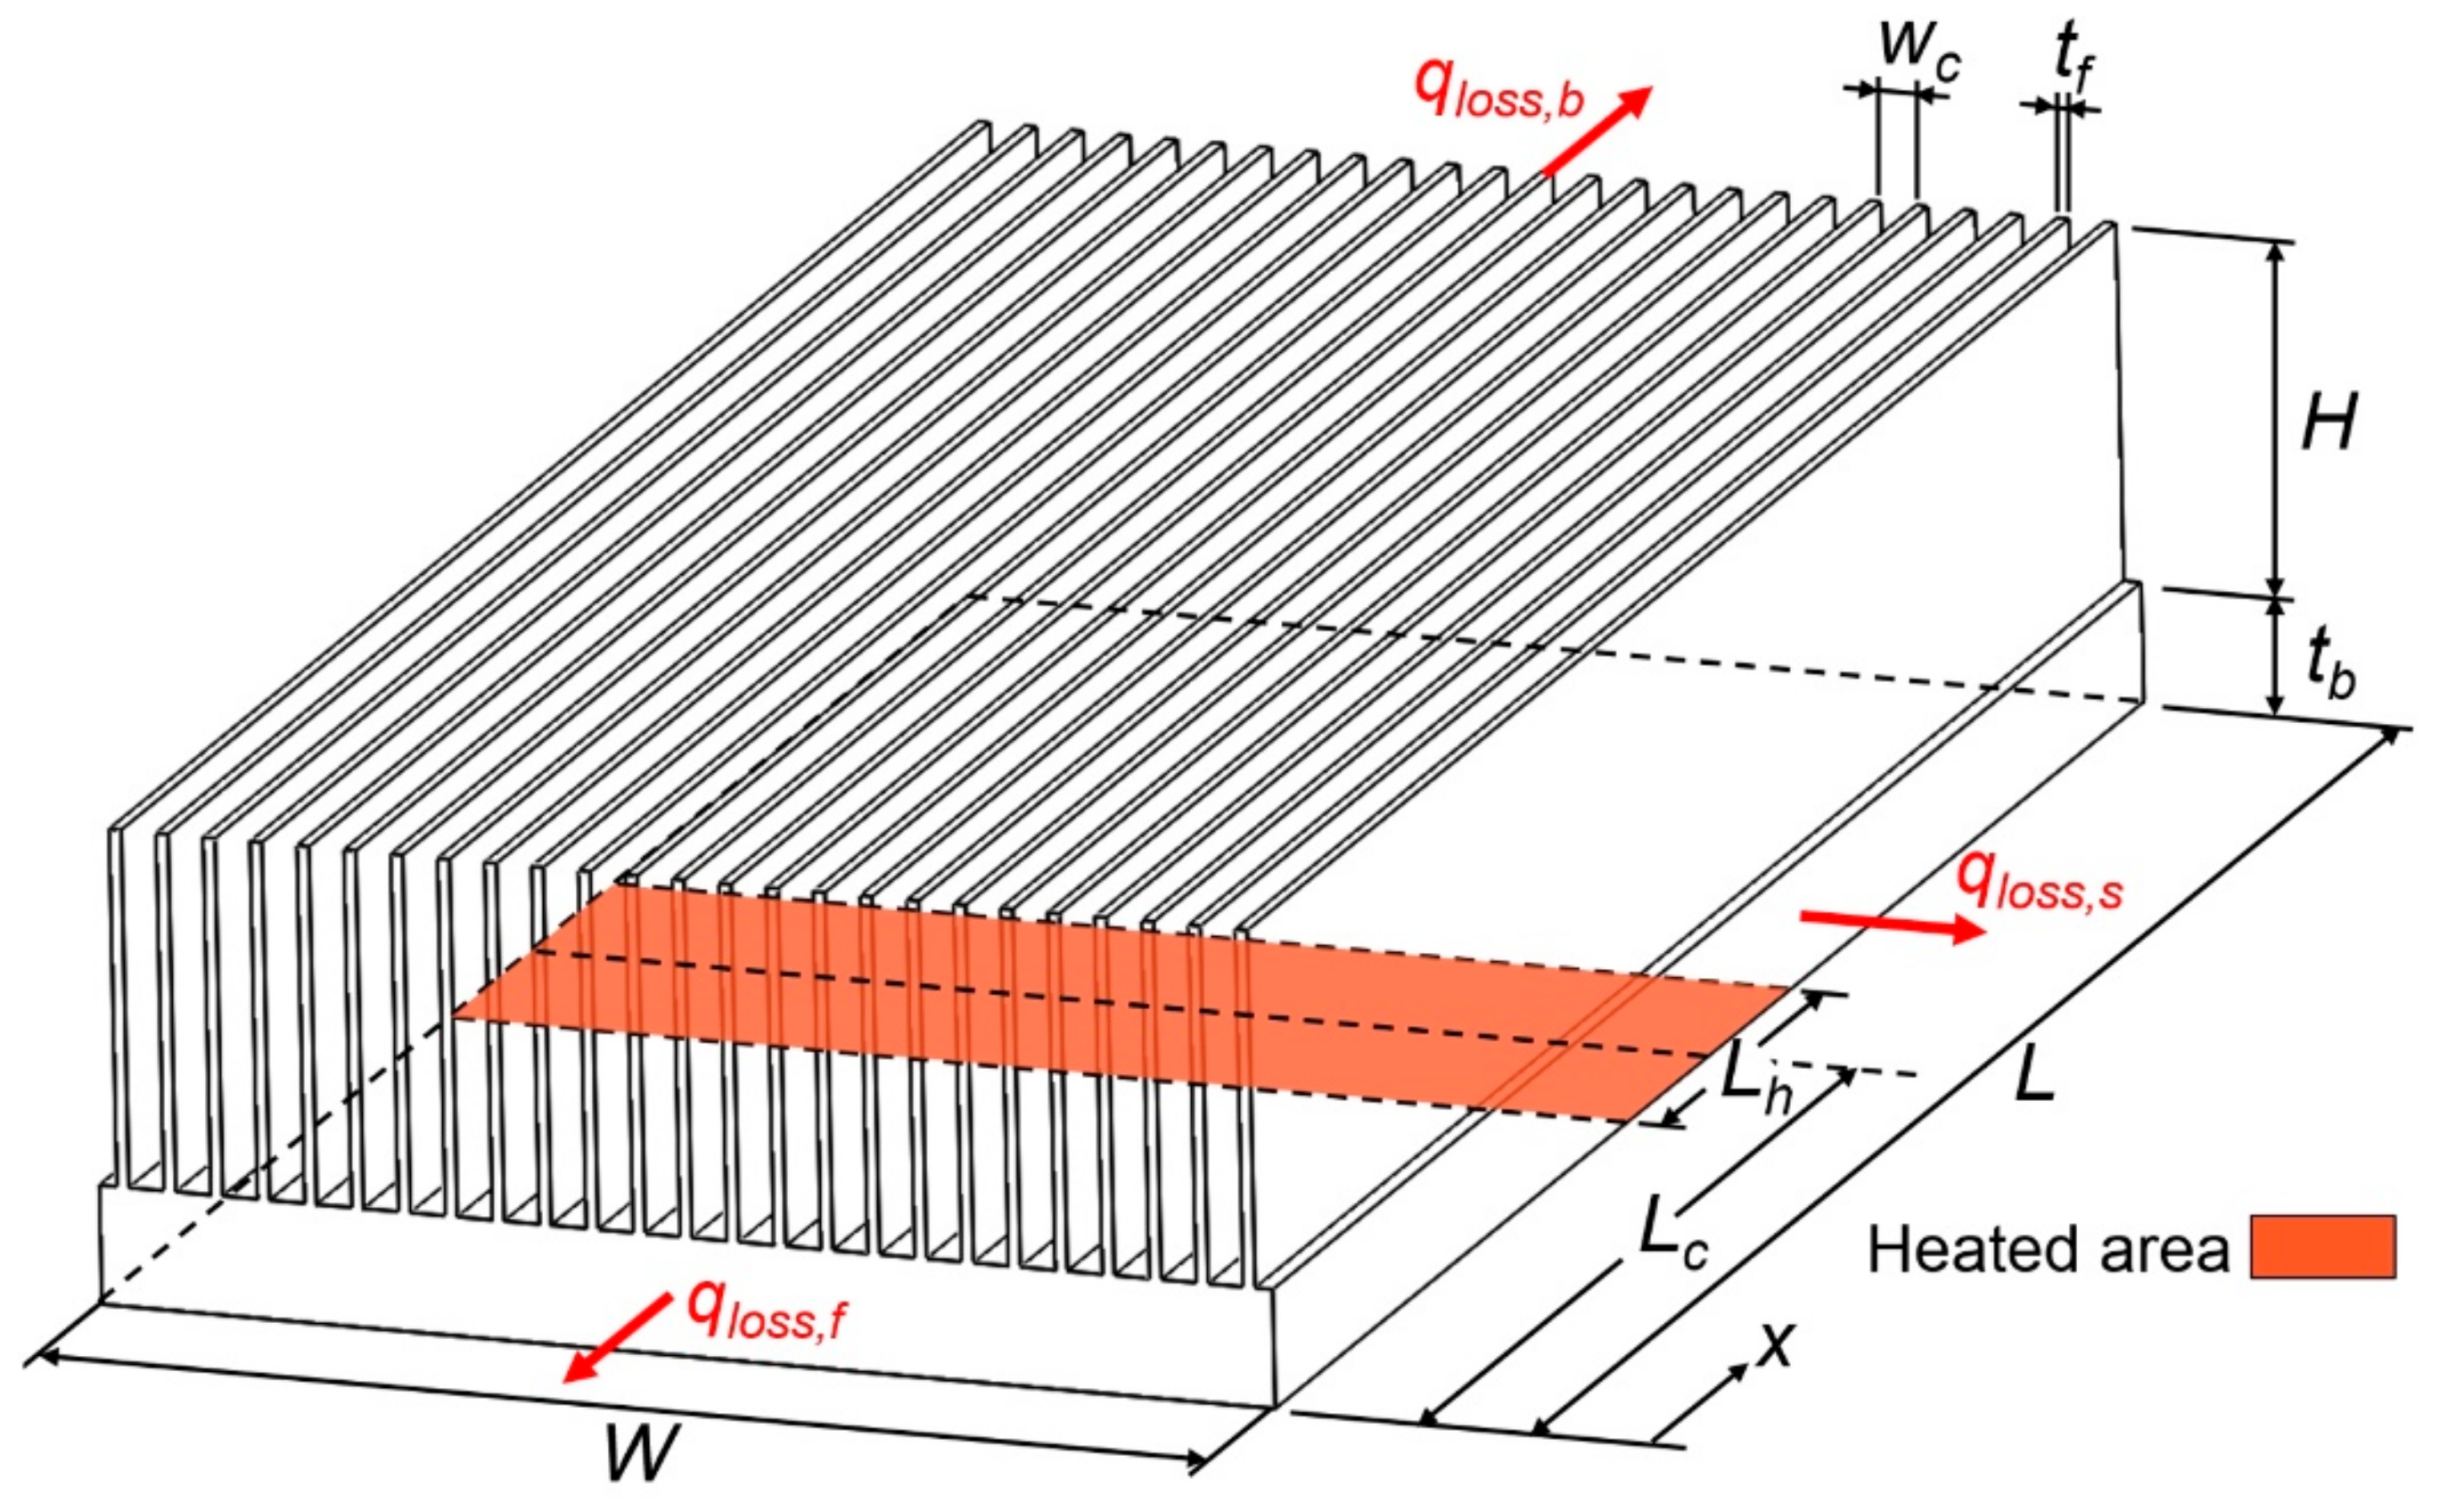
| H | height of heat sink |
| h | heat transfer coefficient |
| ks | solid thermal conductivity |
| L | length of heat sink |
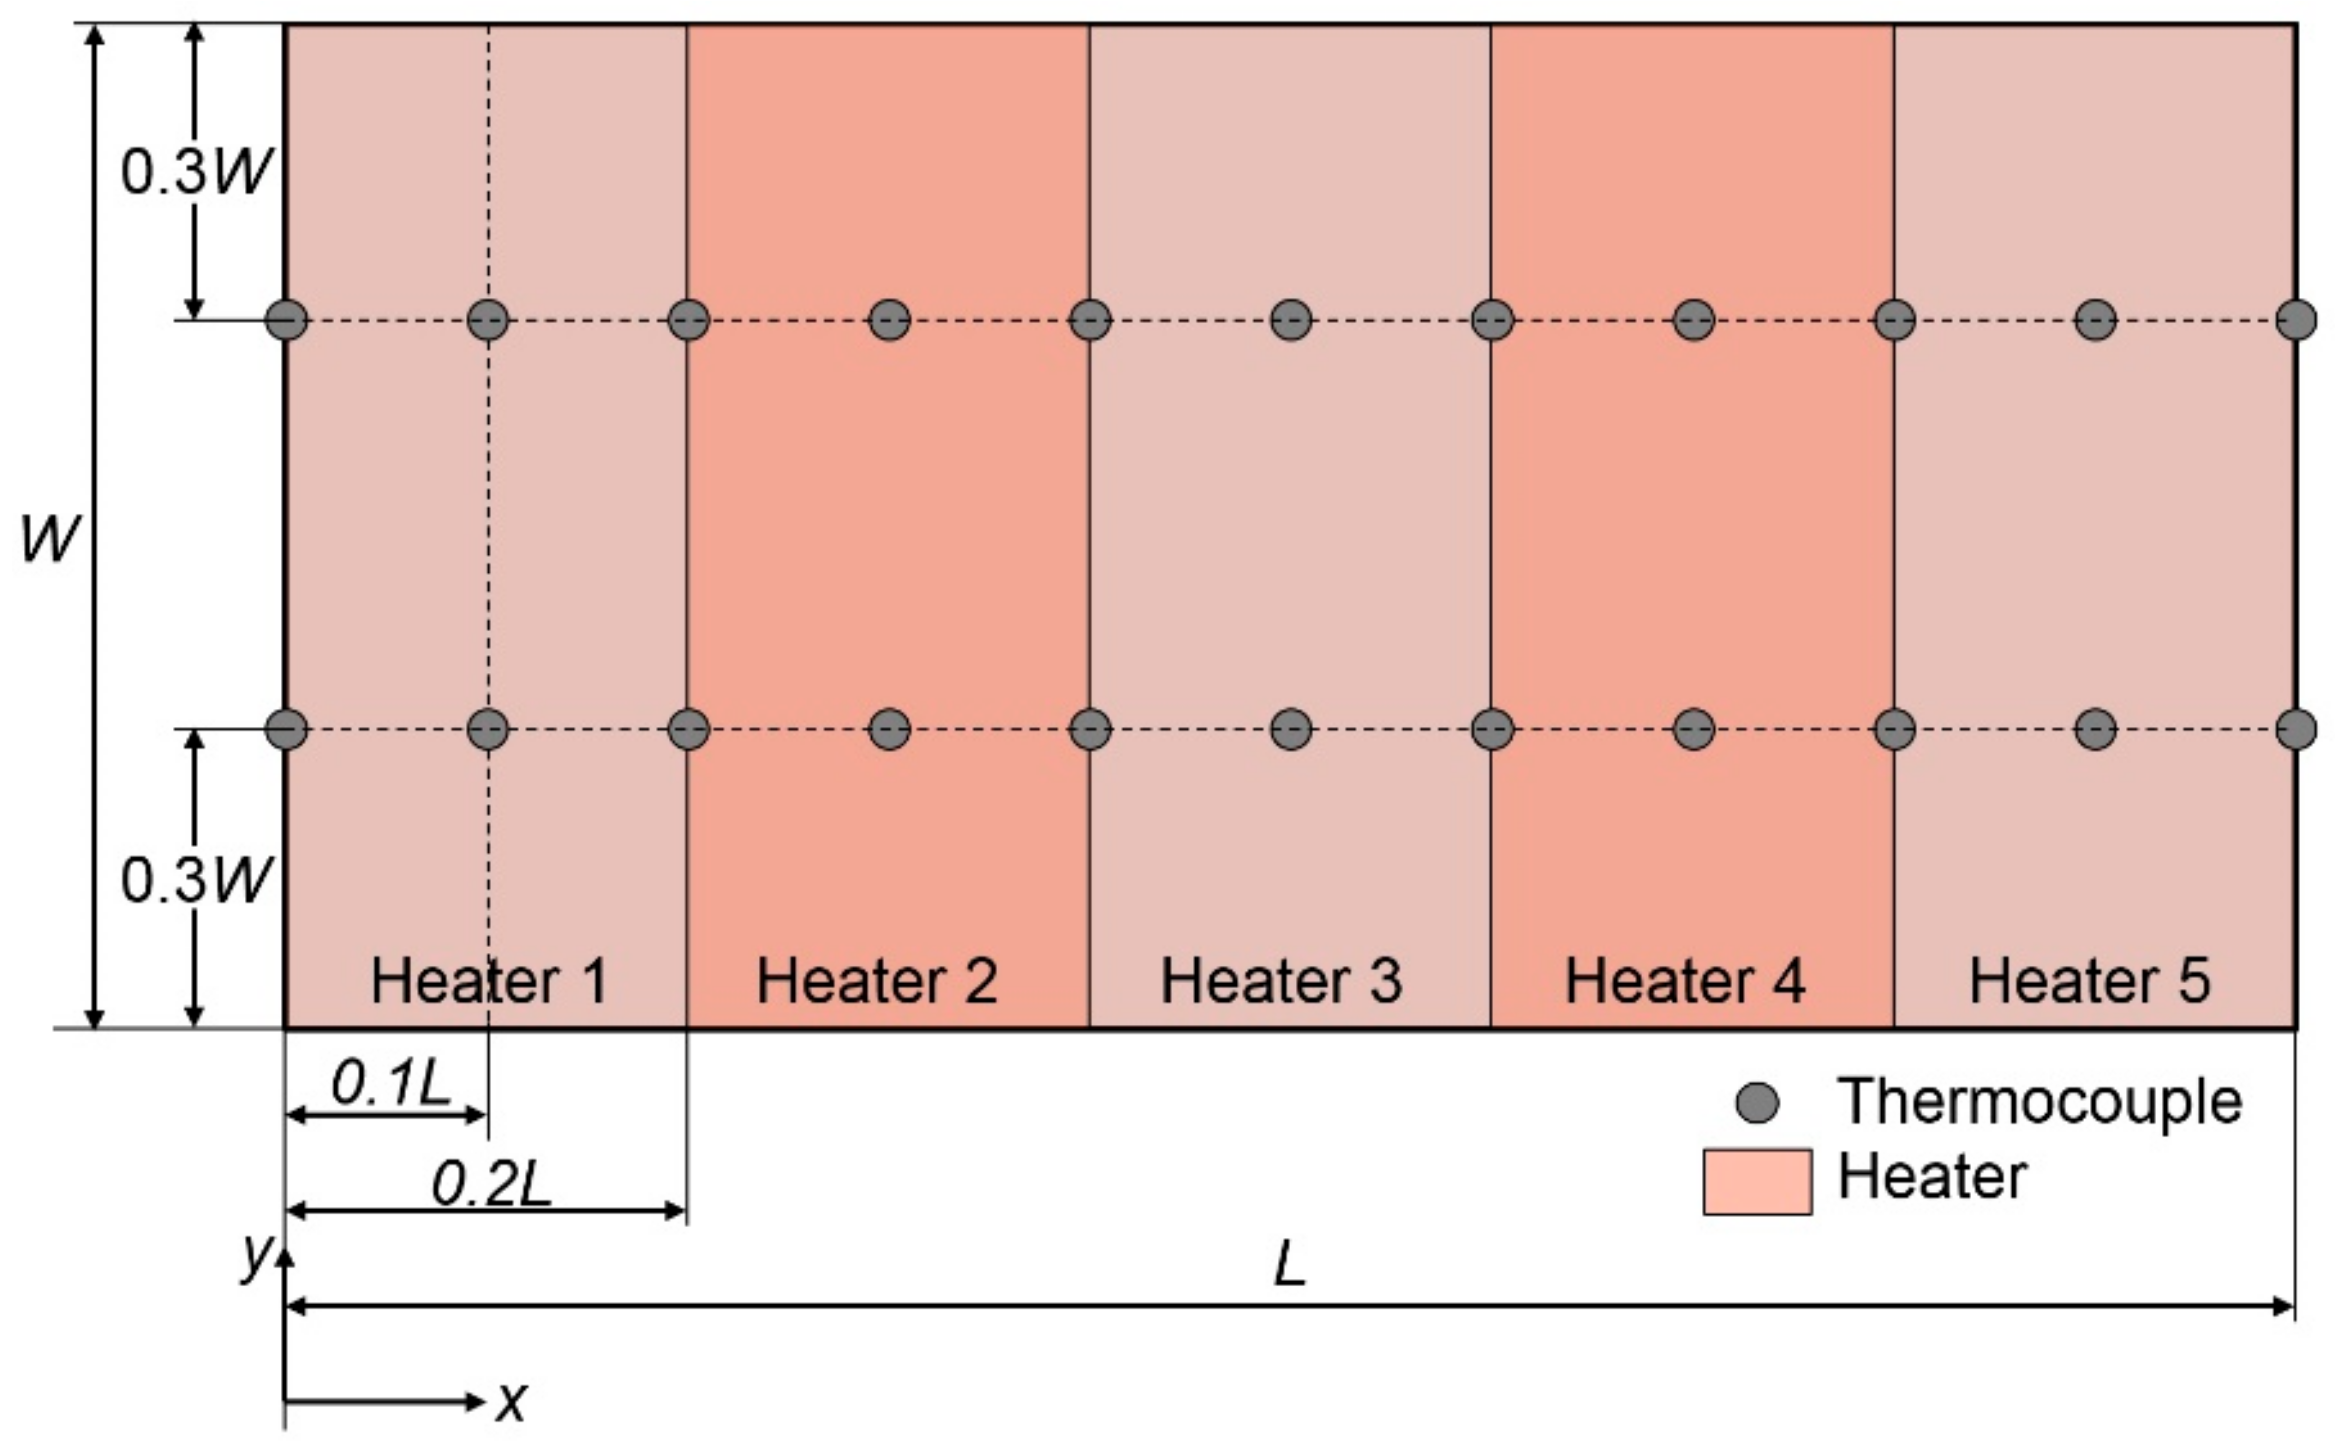
| Lc | distance from the upstream end to the center of the heated area |
| Lh | heated length |
| mass flow rate | |
| N | fin number |
| P | wetted perimeter |
| Q | flow rate |
| q | amount of heat applied to heat sink |
| Q′ | heat input per unit length |
| qloss,b | heat loss through the back of the heat sink |
| qloss,f | heat loss through the front of the heat sink |
| qloss,s | heat loss through the sides of the heat sink |
| R | thermal resistance |
| Rloss,b | thermal resistance related heat loss through the back of the heat sink |
| Rloss,f | thermal resistance related heat loss through the front of the heat sink |
| R′loss,s | thermal resistance per unit length related to heat loss through the sides of the heat sink |
| Tamb | ambient temperature |
| Tb | base temperature |
| Tb,max | maximum temperature of the heat sink base |
| tb | base thickness |
| tf | fin thickness |
| W | width of heat sink |
| wc | channel width |
| ηo | overall surface efficiency |
Appendix A
Experimental Uncertainties

| Measurement Type | Error |
|---|---|
| Temperature | <0.5 K |
| Voltage | <0.01% |
| Current | <0.1% |
| Pressure | <0.5% |
Appendix B
Detailed Explanation for the One-Dimensional Numerical Model


References
- Mudawar, I. Assessment of high-heat-flux thermal management schemes. IEEE Trans. Compon. Packag. Technol. 2001, 24, 22–141. [Google Scholar] [CrossRef]
- Anandan, S.S.; Ramalingam, V. Thermal management of electronics: A review of literature. Therm. Sci. 2008, 12, 5–26. [Google Scholar] [CrossRef]
- Yang, J.; Ning, S. Experimental and Numerical Study of Double-Pipe Evaporators Designed for CO2 Transcritical Systems. Processes 2019, 7, 547. [Google Scholar] [CrossRef]
- Zhou, H.; Chen, M.; Han, X.; Cao, P.; Yao, F.; Wu, L. Enhancement Study of Ice Storage Performance in Circular Tank with Finned Tube. Processes 2019, 7, 266. [Google Scholar] [CrossRef]
- Xue, R.; Ruan, Y.; Liu, X.; Chen, L.; Liu, L.; Hou, Y. Numerical Study of the Effects of Injection Fluctuations on Liquid Nitrogen Spray Cooling. Processes 2019, 7, 564. [Google Scholar] [CrossRef]
- He, M.; Li, Z.; Han, X.; Cabassud, M.; Dahhou, B. Development of a Numerical Model for a Compact Intensified Heat-Exchanger/Reactor. Processes 2019, 7, 454. [Google Scholar] [CrossRef]
- Teertstra, P.; Yovanovich, M.M.; Culham, J.R. Analytical forced convection modeling of plate fin heat sinks. J. Electron. Manuf. 2000, 10, 253–261. [Google Scholar] [CrossRef]
- Culham, J.R.; Muzychka, Y.S. Optimization of plate fin heat sinks using entropy generation minimization. IEEE Trans. Compon. Packag. Technol. 2001, 24, 159–165. [Google Scholar] [CrossRef]
- Jonsson, H.; Moshfegh, B. Modeling of the thermal and hydraulic performance of plate fin, strip fin, and pin fin heat sinks-Influence of flow bypass. IEEE Trans. Compon. Packag. Technol. 2001, 24, 142–149. [Google Scholar] [CrossRef]
- Iyengar, M.; Bar-Cohen, A. Least-energy optimization of forced convection plate-fin heat sinks. IEEE Trans. Compon. Packag. Technol. 2003, 26, 62–70. [Google Scholar] [CrossRef]
- Kim, D.K.; Jung, J.; Kim, S.J. Thermal optimization of plate-fin heat sinks with variable fin thickness. Int. J. Heat Mass Transf. 2010, 53, 5988–5995. [Google Scholar] [CrossRef]
- Muzychka, Y.S.; Yovanovich, M.M.; Culham, J.R. Influence of geometry and edge cooling on thermal spreading resistance. J. Thermophys Heat Transf. 2006, 20, 247–255. [Google Scholar] [CrossRef]
- Musallam, M.; Johnson, C.M. Real-time compact thermal models for health management of power electronics. IEEE Trans. Power Electron. 2010, 25, 1416–1425. [Google Scholar] [CrossRef]
- Yoon, Y.; Park, S.J.; Kim, D.R.; Lee, K.S. Thermal performance improvement based on the partial heating position of a heat sink. Int. J. Heat Mass Transf. 2018, 124, 752–760. [Google Scholar] [CrossRef]
- Culham, J.R.; Khan, W.A.; Yovanovich, M.M.; Muzychka, Y.S. The influence of material properties and spreading resistance in the thermal design of plate fin heat sinks. J. Electron. Packag. 2007, 129, 76–81. [Google Scholar] [CrossRef]
- Ellison, G.N. Maximum thermal spreading resistance for rectangular sources and plates with nonunity aspect ratios. IEEE Trans. Compon. Packag. Technol. 2003, 26, 439–454. [Google Scholar] [CrossRef]
- Cho, E.S.; Choi, J.W.; Yoon, J.S.; Kim, M.S. Experimental study on microchannel heat sinks considering mass flow distribution with non-uniform heat flux conditions. Int. J. Heat Mass Transf. 2010, 53, 2159–2168. [Google Scholar] [CrossRef]
- Yoon, S.H.; Saneie, N.; Kim, Y.J. Two-phase flow maldistribution in minichannel heat-sinks under non-uniform heating. Int. J. Heat Mass Transf. 2014, 78, 527–537. [Google Scholar] [CrossRef]
- Lelea, D. The heat transfer and fluid flow of a partially heated microchannel heat sink. Int. Commun. Heat Mass Transf. 2009, 36, 794–798. [Google Scholar] [CrossRef]
- Toh, K.C.; Chen, X.Y.; Chai, J.C. Numerical computation of fluid flow and heat transfer in microchannels. Int. J. Heat Mass Transf. 2002, 45, 5133–5141. [Google Scholar] [CrossRef]
- Emekwuru, N.G.; Hall, F.R.; Spence, P.J. Partially heated heat sinks in a zero-bypass. Int. Commun. Heat Mass Transf. 2012, 39, 343–349. [Google Scholar] [CrossRef]
- Lee, M.; Kim, H.J.; Kim, D.K. Nusselt number correlation for natural convection from vertical cylinders with triangular fins. Appl. Therm. Eng. 2016, 93, 1238–1247. [Google Scholar] [CrossRef]
- Kim, D.K.; Han, I.Y.; Kim, S.J. Study on the steady-state characteristics of the sensor tube of a thermal mass flow meter. Int. J. Heat Mass Transf. 2007, 50, 1206–1211. [Google Scholar] [CrossRef]
- Liu, D.; Garimella, S.V. Analysis and optimization of the thermal performance of microchannel heat sinks. Int. J. Numer. Methods Heat Fluid Flow 2005, 15, 7–26. [Google Scholar] [CrossRef]
- Incropera, F.P.; Lavine, A.S.; Bergman, T.L.; DeWitt, D.P. Fundamentals of Heat and Mass Transfer, 6th ed.; John Wiley & Sons: Hoboken, NJ, USA, 2007; pp. 153–155. [Google Scholar]


| N | wc [mm] | Lh/L | Lc/L | Flow Rate Q [m3/min] |
|---|---|---|---|---|
| 25 | 3 | 1.0 | 0.5 | 0.2, 0.4, 0.6, 0.8 |
| 0.6 | 0.5 | 0.2, 0.4, 0.6, 0.8 | ||
| 0.2 | 0.3 | 0.2, 0.4, 0.6, 0.8 | ||
| 0.5 | 0.2, 0.4, 0.6, 0.8 | |||
| 0.7 | 0.2, 0.4, 0.6, 0.8 | |||
| 13 | 7 | 1.0 | 0.5 | 0.2, 0.4, 0.6, 0.8 |
| 0.6 | 0.5 | 0.2, 0.4, 0.6, 0.8 | ||
| 0.2 | 0.3 | 0.2, 0.4, 0.6, 0.8 | ||
| 0.5 | 0.2, 0.4, 0.6, 0.8 | |||
| 0.7 | 0.2, 0.4, 0.6, 0.8 |
© 2019 by the authors. Licensee MDPI, Basel, Switzerland. This article is an open access article distributed under the terms and conditions of the Creative Commons Attribution (CC BY) license (http://creativecommons.org/licenses/by/4.0/).
Share and Cite
Lee, J.J.; Kim, H.J.; Kim, D.-K. Experimental Study on Forced Convection Heat Transfer from Plate-Fin Heat Sinks with Partial Heating. Processes 2019, 7, 772. https://doi.org/10.3390/pr7100772
Lee JJ, Kim HJ, Kim D-K. Experimental Study on Forced Convection Heat Transfer from Plate-Fin Heat Sinks with Partial Heating. Processes. 2019; 7(10):772. https://doi.org/10.3390/pr7100772
Chicago/Turabian StyleLee, Jae Jun, Hyun Jung Kim, and Dong-Kwon Kim. 2019. "Experimental Study on Forced Convection Heat Transfer from Plate-Fin Heat Sinks with Partial Heating" Processes 7, no. 10: 772. https://doi.org/10.3390/pr7100772
APA StyleLee, J. J., Kim, H. J., & Kim, D.-K. (2019). Experimental Study on Forced Convection Heat Transfer from Plate-Fin Heat Sinks with Partial Heating. Processes, 7(10), 772. https://doi.org/10.3390/pr7100772