Arsenic Removal from Mining Effluents Using Plant-Mediated, Green-Synthesized Iron Nanoparticles


Abstract
1. Introduction
2. Material and Methods
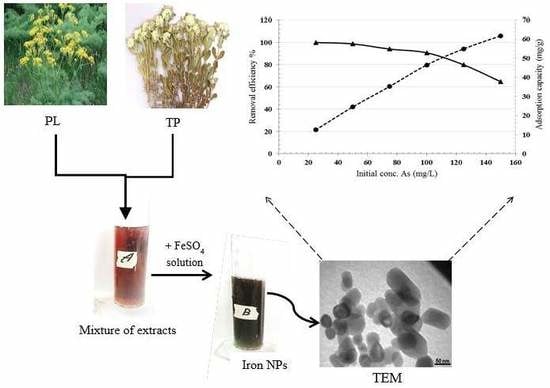
2.1. Synthesis of Iron Nanoparticles
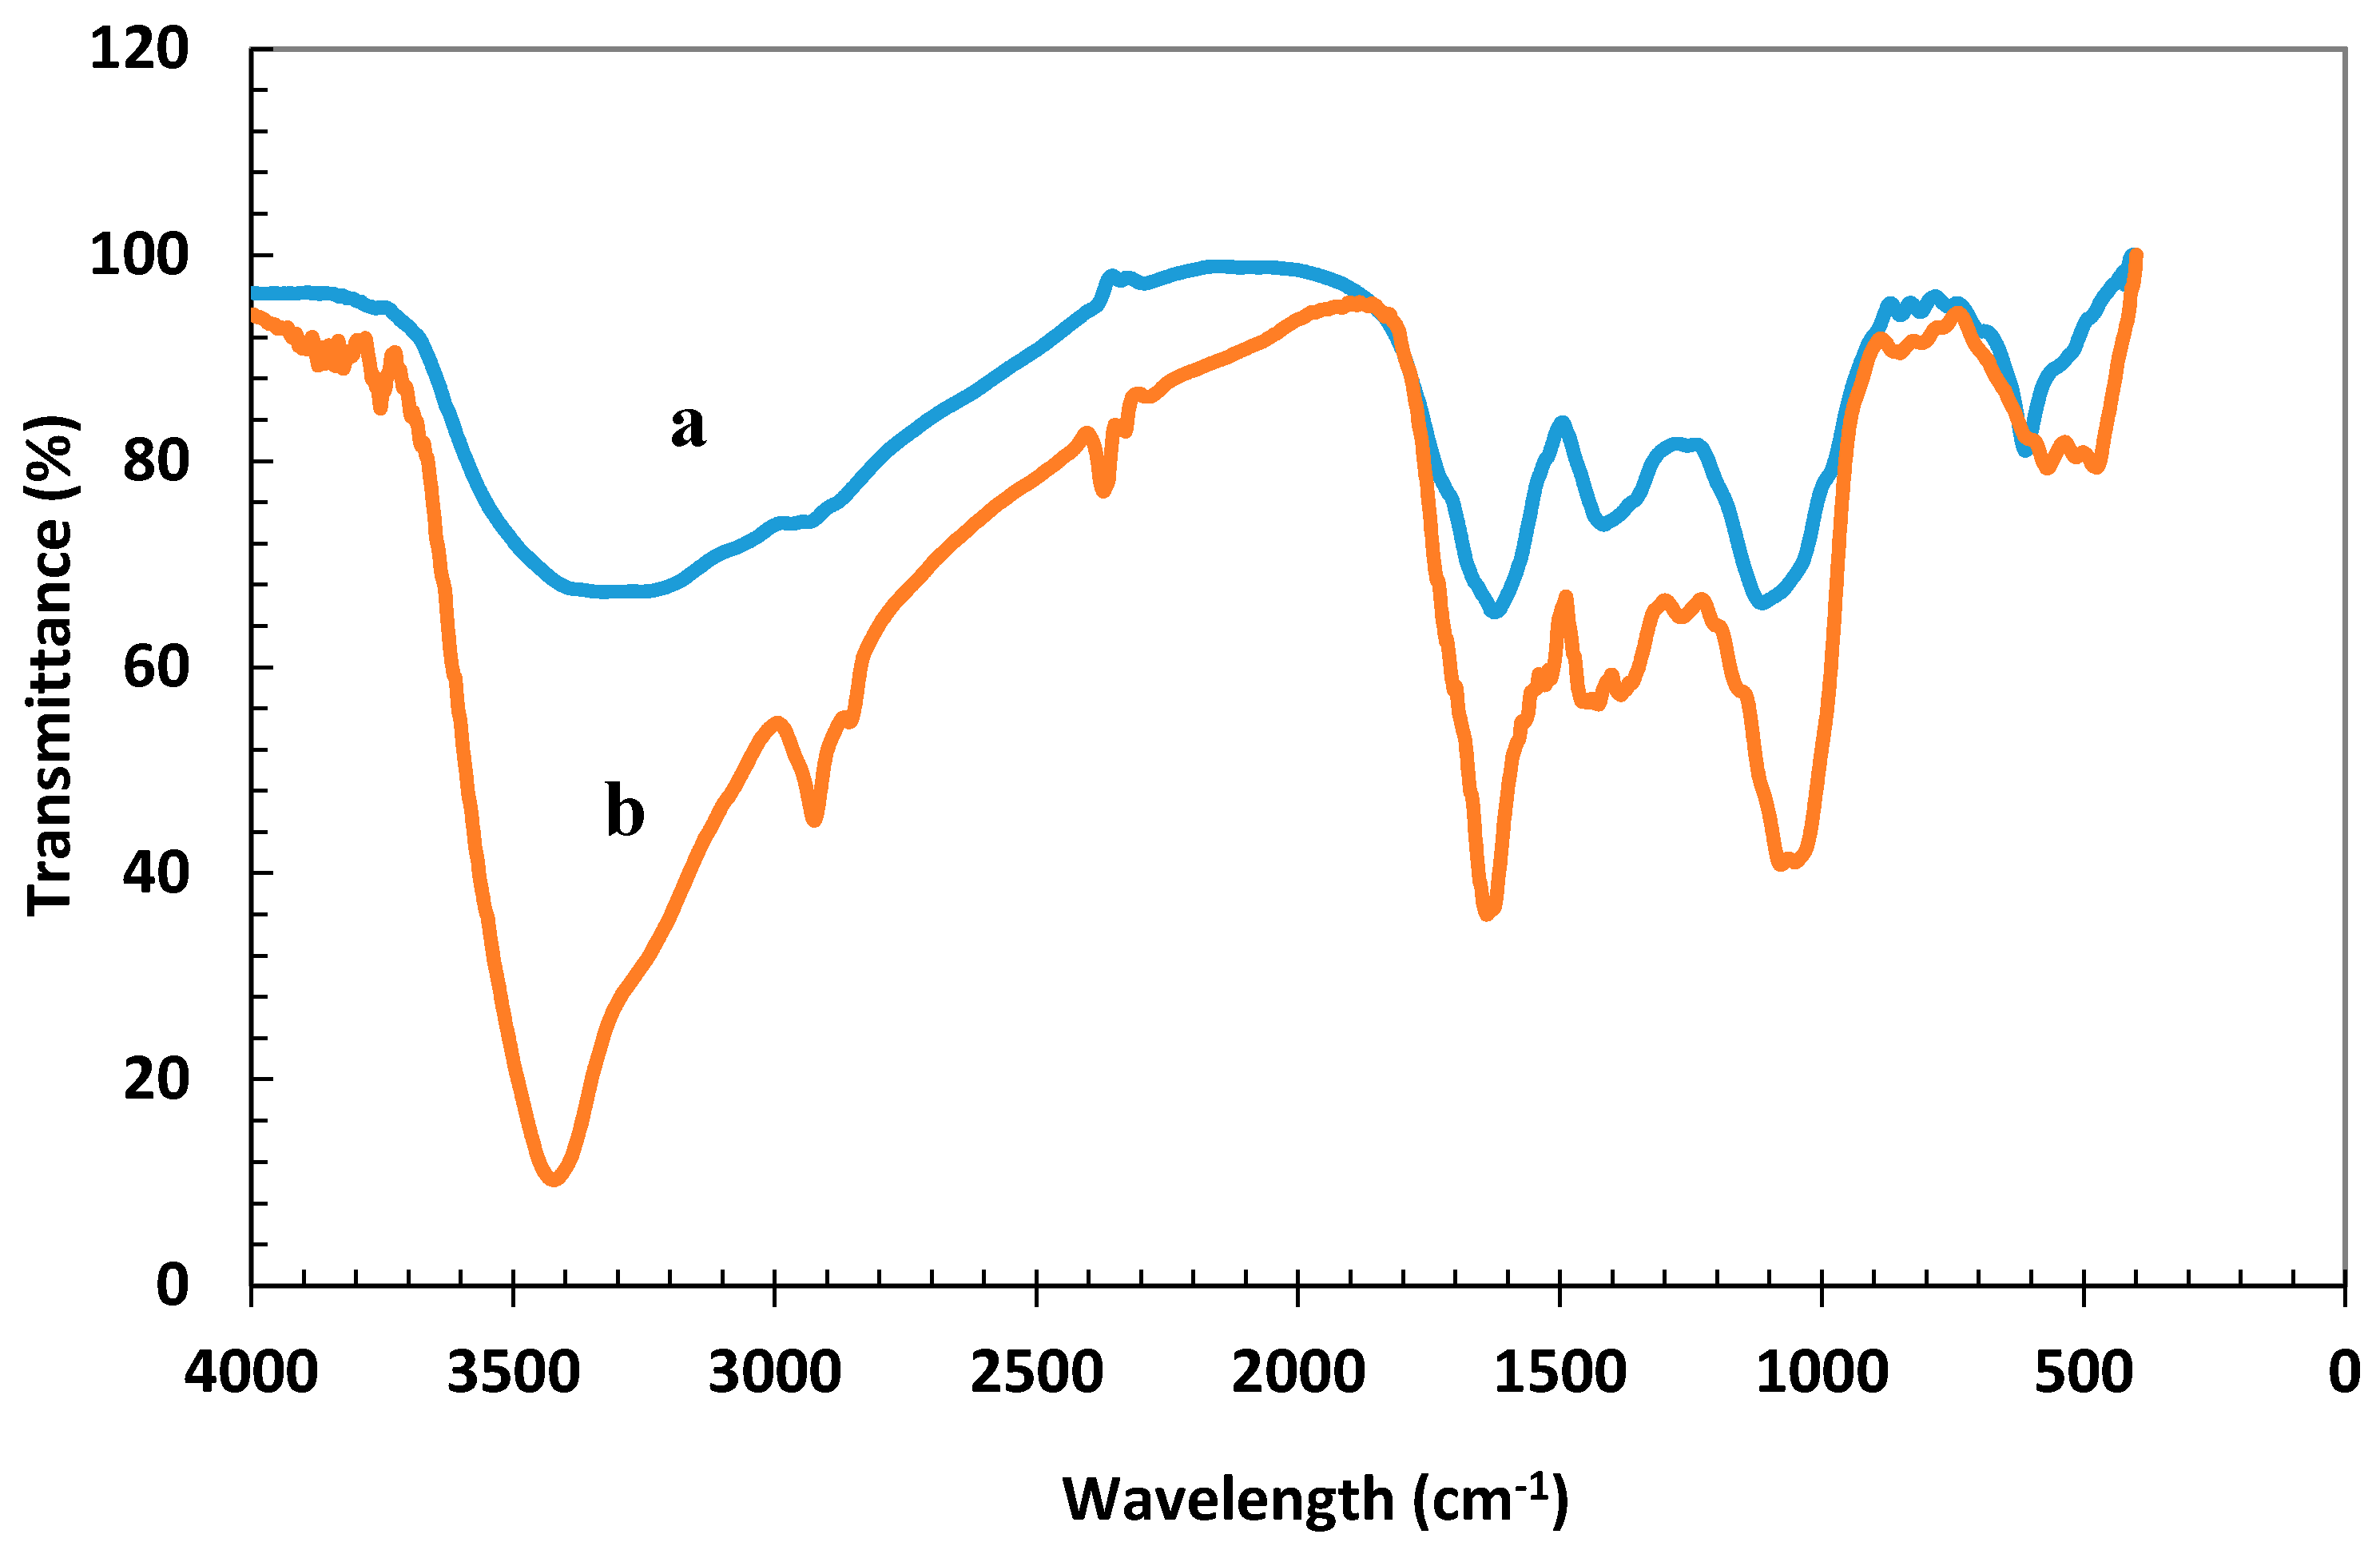
2.2. Characterization of Iron Nanoparticles
2.3. Adsorption Experiments
3. Results and Discussion
3.1. Characterization of the Synthesized Nanoparticles
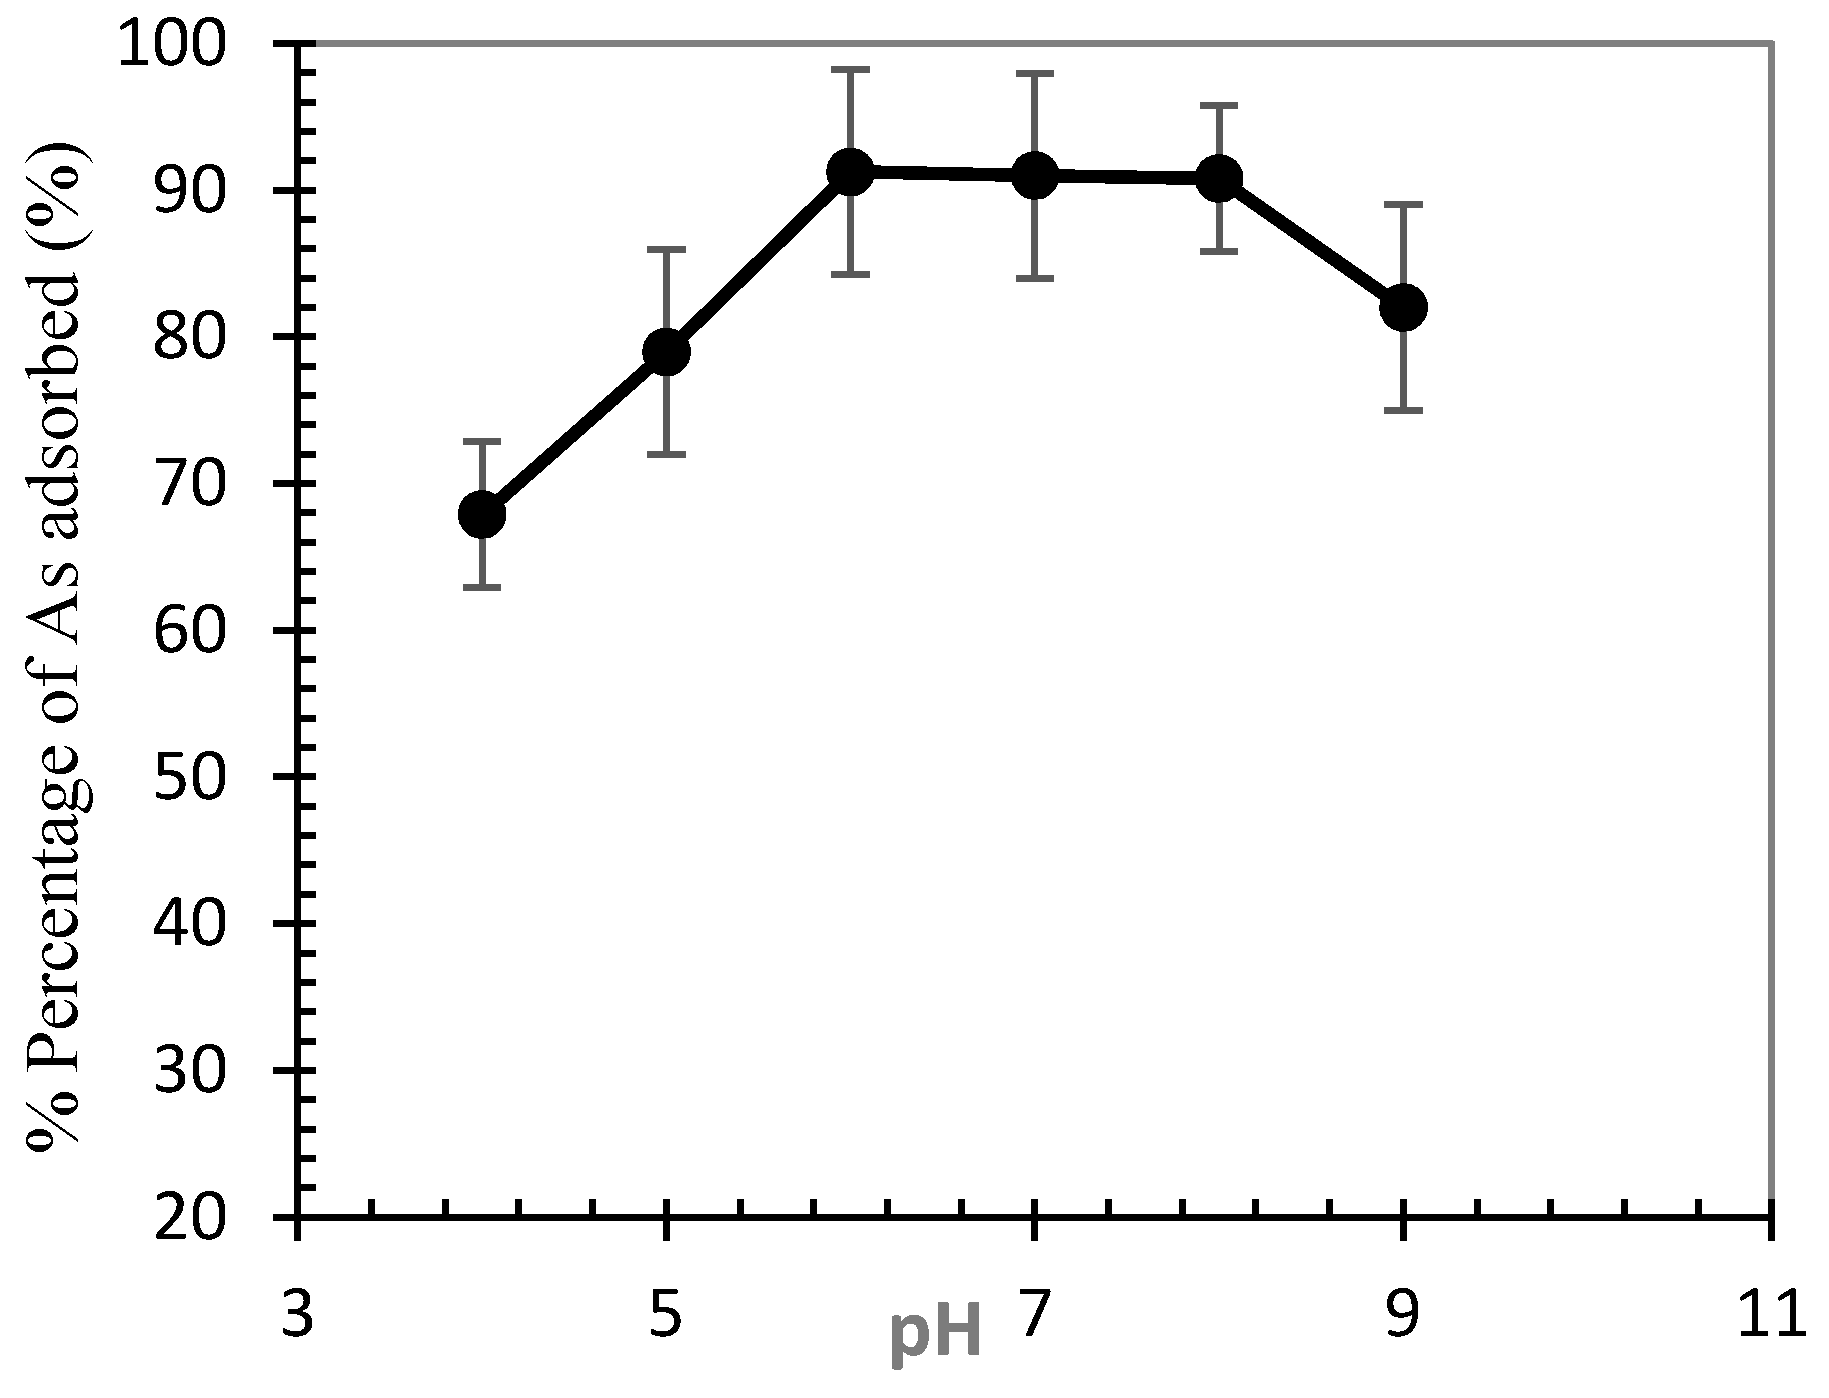
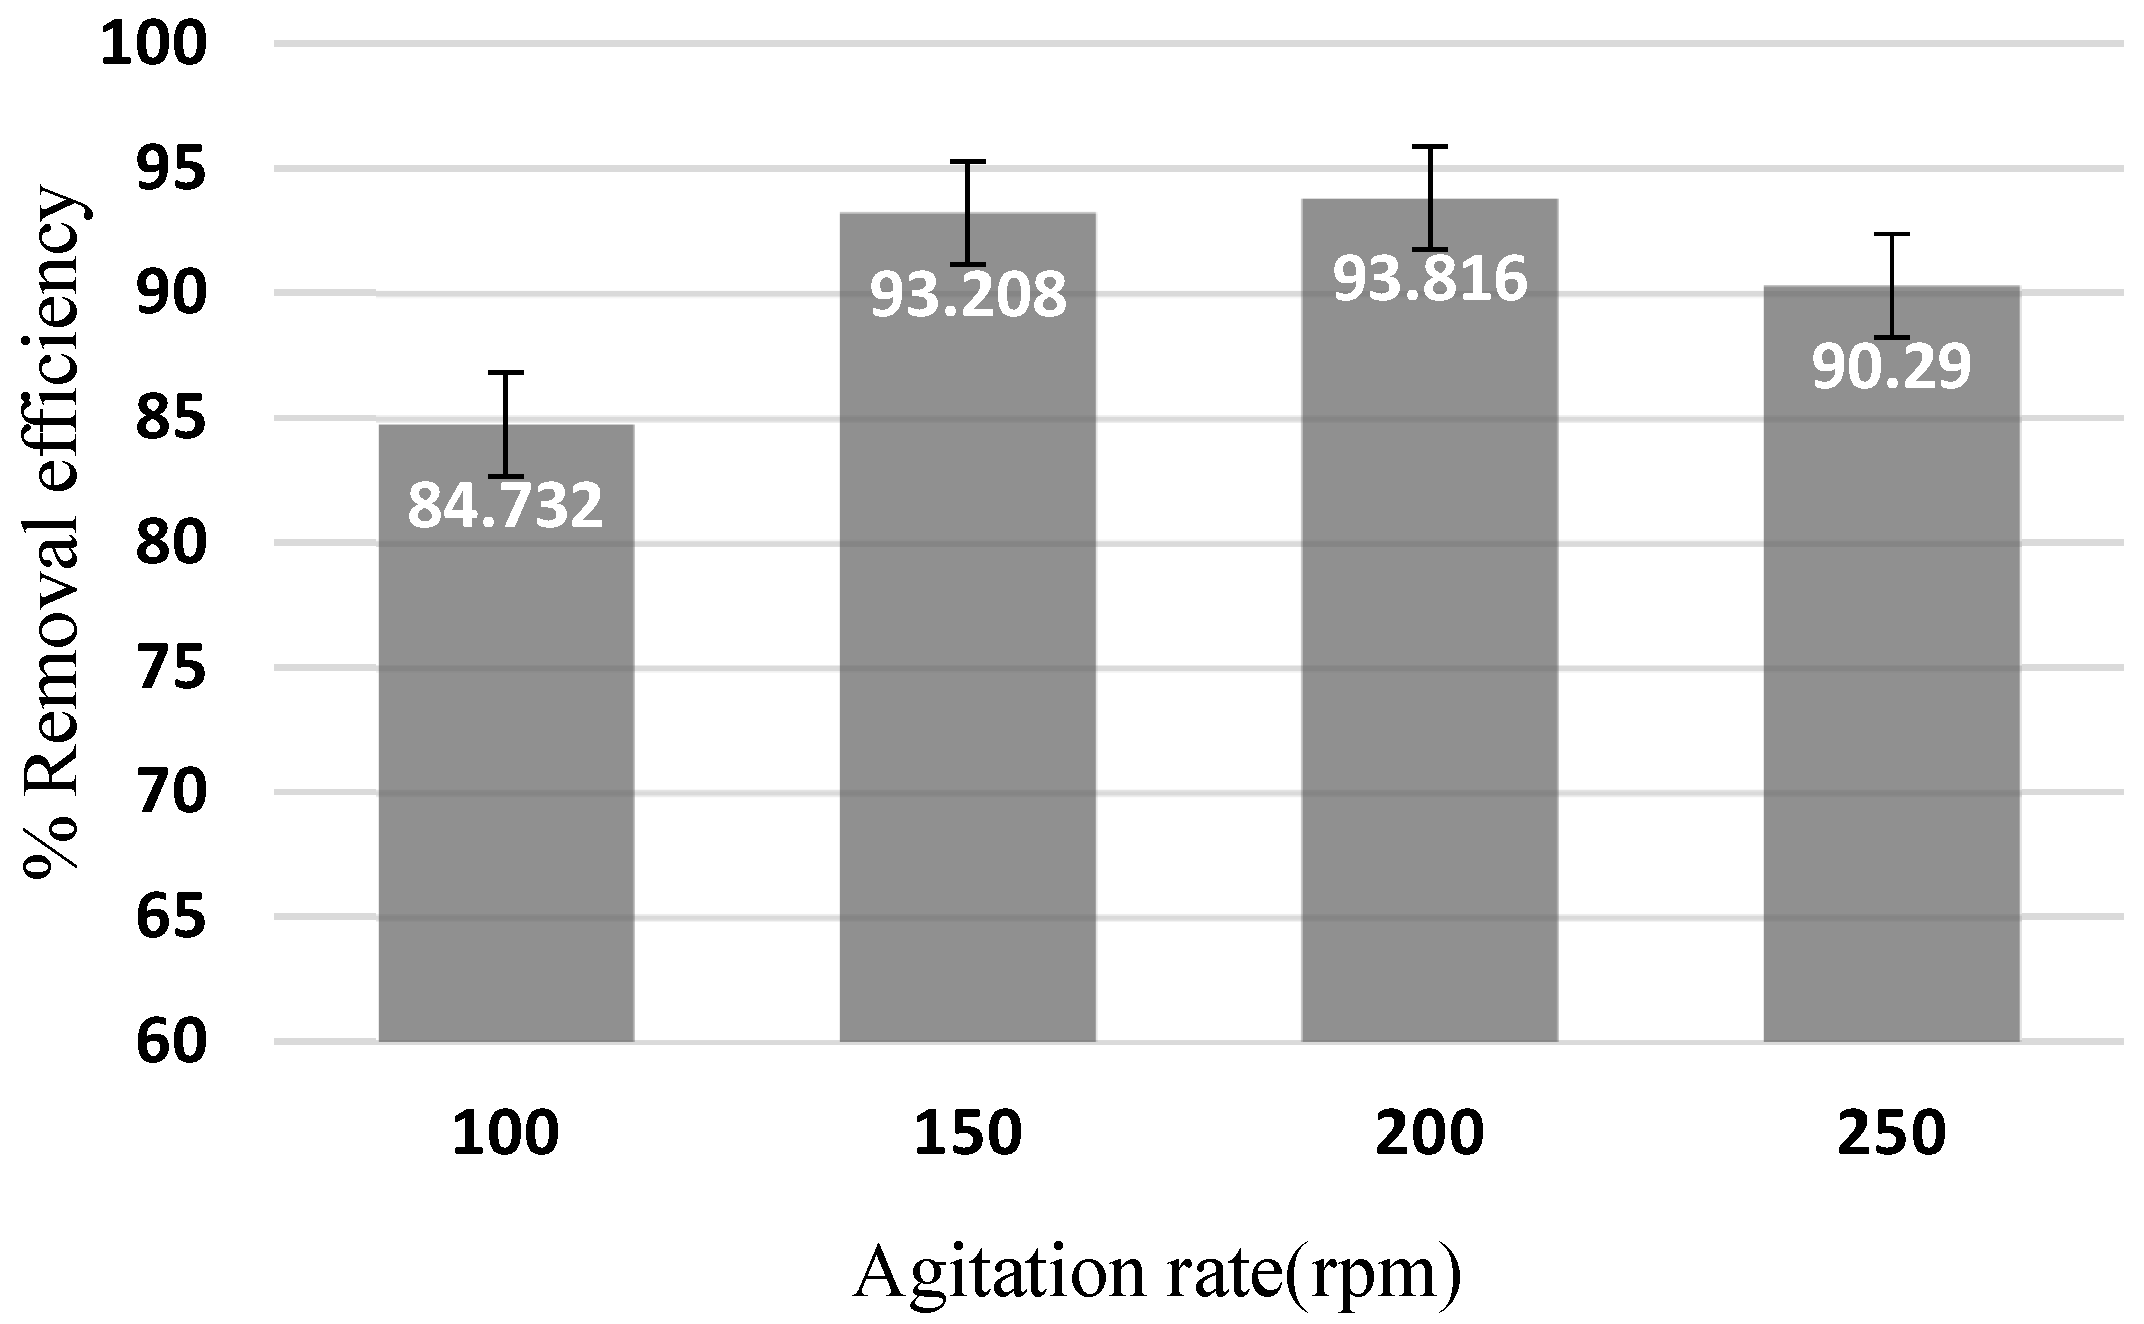
3.2. Optimization of Arsenic Sorption onto Iron Nanoparticles
3.3. Arsenic Adsorption Isotherm
3.4. Adsorption Kinetics
3.5. Thermodynamic Studies
3.6. The Activation Energy of Adsorption
3.7. Arsenic Removal from Real Mining Effluents
3.8. Comparison of Arsenic Sorption Capacity for Different Adsorbents
4. Conclusions
- Iron nanoparticles were synthesized via green chemistry methods. XRD, UV-Vis, and FTIR analyses confirmed the successful formation of iron nanoparticles using Prangos ferulacea and Teucrium polium leaf extracts, and the morphology was determined as spherical particles of average 40 nm diameter by SEM and TEM analysis.
- The influence of parameters such as contact time, pH, adsorbent dosage, initial arsenic concentration, temperature, and agitation rate was investigated. Results showed that 93.9% of arsenic was eliminated at a stirring speed of 200 rpm, pH 6, 2 g/L nanoparticle dosage, and initial concentration of 0.075 g/L within 20 min.
- The synthesized nanoparticles were able to absorb 61.7 mg/g arsenic from the solution at 298 °K, which is a considerable capacity in comparison with most of the available sorbents. This was also confirmed through post-sorption FTIR analysis.
- The adsorption behavior of the synthesized nanoparticles is represented by different isotherm models.
- Thermodynamic adsorption investigations showed the negative values for enthalpy and entropy of the adsorption process, which revealed its exothermic and spontaneous nature. Moreover, the activation energy for arsenic removal was obtained as −17 kJ/mol, which indicated the physical sorption mechanism and that the process is not temperature-sensitive.
- Arsenic adsorption tests performed over the real industrial effluent samples collected from two different mines confirmed that the proposed adsorbent is capable of removing more than 70% of arsenic contamination in real cases.
- The comparison of arsenic sorption capacity shows that iron nanoparticles synthesized by Prangos ferulacea and Teucrium polium leaf extracts still demonstrate a remarkable uptake capacity and may be a promising arsenic removal option to be used in various industrial applications.
Author Contributions
Funding
Acknowledgments
Conflicts of Interest
References
- Tyrovola, K.; Nikolaidis, N.P.; Veranis, N.; Kallithrakas-Kontos, N.; Koulouridakis, P.E. Arsenic removal from geothermal waters with zero-valent iron-Effect of temperature, phosphate and nitrate. Water Res. 2006, 40, 2375–2386. [Google Scholar] [CrossRef] [PubMed]
- Solgi, E.; Esmaili-Sari, A.; Bakhtiari, A.R.R.; Hadipour, M. Soil Contamination by Arsenic in Urban Areas: A case study of Arak City. Iran. J. Health Environ. 2015, 8, 1–10. [Google Scholar]
- Sayadi, M.H.; Rezaei, A.; Sayyed, M.R.G. Grain size fraction of heavy metals in soil and their relationship with land use. Proc. Int. Acad. Ecol. Environ. Sci. USA 2017, 7, 1–11. [Google Scholar]
- World Health Organization. Arsenic in Drinking Water, Background Document for Preparation of WHO Guidelines for Drinking Water Quality; World Health Organization: Geneva, Switzerland, 2003. [Google Scholar]
- Wei, B.; Yang, L. A review of heavy metal contaminations in urban soils, urban road dusts and agricultural soils from China. Microchem. J. 2010, 94, 99–107. [Google Scholar] [CrossRef]
- Garelick, H.; Dybowska, A.; Valsami-Jones, E.; Priest, N. Remediation Technologies for Arsenic Contaminated Drinking Waters (9 pp). J. Soils Sediments 2005, 5, 182–190. [Google Scholar] [CrossRef]
- Cui, J.; Jing, C.; Che, D.; Zhang, J.; Duan, S. Groundwater arsenic removal by coagulation using ferric(III) sulfate and polyferric sulfate: A comparative and mechanistic study. J. Environ. Sci. 2015, 32, 42–53. [Google Scholar] [CrossRef]
- Shih, M.C. An overview of arsenic removal by pressure-drivenmembrane processes. Desalination 2005, 172, 85–97. [Google Scholar] [CrossRef]
- Molgora, C.C.; Dominguez, A.M.; Avila, E.M.; Drogui, P.; Buelna, G. Removal of arsenic from drinking water: A comparative study between electrocoagulation-microfiltration and chemical coagulation-microfiltration processes. Sep. Purif. Technol. 2013, 118, 645–651. [Google Scholar] [CrossRef]
- Azhdarpoor, A.; Nikmanesh, R.; Samaei, M.R. Removal of arsenic from aqueous solutions using waste iron columns inoculated with iron bacteria. Environ. Technol. 2015, 36, 2525–2531. [Google Scholar] [CrossRef]
- Sayadi, M.H.; Shekari, H. Biosorption of cadmium and lead from aqueous solutions using Spirogyra. Environ. Stud. 2017, 43, 379–390. [Google Scholar] [CrossRef]
- Iravani, S. Green synthesis of metal nanoparticles using plants. Green Chem. 2011, 13, 2638–2650. [Google Scholar] [CrossRef]
- Memon, S.; Bhanger, M.; Memon, J.U.R. Evaluation of banana peel for treatment of arsenic contaminated water. In Proceedings of the 1st Technical Meeting of Muslim Water Researchers Cooperation (MUWAREC), Kuala Lumpur, Malaysia, 15–16 December 2008; pp. 104–109. [Google Scholar]
- Asif, Z.; Chen, Z. Removal of arsenic from drinking water using rice husk. Appl. Water Sci. 2017, 7, 1449–1458. [Google Scholar] [CrossRef]
- Altundoğan, H.S.; Altundoğan, S.; Tümen, F.; Bildik, M. Arsenic adsorption from aqueous solutions by activated red mud. Waste Manag. 2002, 22, 357–363. [Google Scholar] [CrossRef]
- Mohammadiazar, S.; Maham, M.; Hasanli, F. Corn-like stationary phase for solid phase microextraction prepared by electro-assisted deposition of sol-gel/silica nanoparticles composite. Microchem. J. 2019, 147, 914–920. [Google Scholar] [CrossRef]
- Rahim, M.; Haris, M.R.H.M. Application of biopolymer composites in arsenic removal from aqueous medium: A review. J. Radiat. Res. Appl. Sci. 2015, 8, 255–263. [Google Scholar] [CrossRef]
- Habuda-Stanic, M.; Stjepanovic, M.N. Arsenic removal by nanoparticles: A review. Environ. Sci. Pollut. Res. 2015, 22, 8094–8123. [Google Scholar] [CrossRef]
- Herlekar, M.; Barve, S.; Kumar, R. Plant-Mediated Green Synthesis of Iron Nanoparticles. J. Nanopart. Res. 2014, 2014, 9. [Google Scholar] [CrossRef]
- Arsiya, F.; Sayadi, M.H.; Sobhani, S. Green synthesis of palladium nanoparticles using Chlorella vulgaris. Mater. Lett. 2017, 186, 113–115. [Google Scholar] [CrossRef]
- Shekari, H.; Sayadi, M.H.; Rezaei, M.R.; Allahresani, A. Synthesis of nickel ferrite/titanium oxide magnetic nanocomposite and its use to remove hexavalent chromium from aqueous solutions. Surf. Interfaces 2017, 8, 199–205. [Google Scholar] [CrossRef]
- Dashora, A.; Sharma, K. Green Synthesis of Nanoparticles and Their Applications. Adv. Sci. Eng. 2018, 10, 523–541. [Google Scholar] [CrossRef]
- Azarkish, P.; Moghadem, M.; Khakdan, F.; Pirbalooti, Y. Variability in morphological traits, total phenolic contents and antioxidant activity in different populations from three species of Prangos from Fars, Kohklouye and Boyerahmad provinces. EJMP 2018, 6, 20. [Google Scholar]
- Stankovic, M.; Martinovic, N.; Mihailovic, V.; Marina, T.; Slavica, S. Antioxidant activity, total phenolic content and flavonoid concentrations of different plant parts of Teucrium polium L. Subsp. polium. Acta Soc. Bot. Pol. 2012, 81, 5. [Google Scholar] [CrossRef]
- Peternela, J.; Silva, M.F.; Vieira, M.F.; Bergamasco, R.; Vieira, A.M.S. Synthesis and Impregnation of Copper Oxide Nanoparticles on Activated Carbon through Green Synthesis for Water Pollutant Removal. Mater. Res. 2018, 21, 11. [Google Scholar] [CrossRef]
- Sayadi, M.H.; Salmani, N.; Heidari, A.; Rezaei, M.R. Bio-synthesis of palladium nanoparticle using Spirulina platensis alga extract and its application as adsorbent. Surf. Interfaces 2018, 10, 136–143. [Google Scholar] [CrossRef]
- Latha, N.; Gowri, M. Bio Synthesis and Characterisation of Fe3o4 nanoparticles using Caricaya papaya leaves extract. Int. J. Sci. Res. 2014, 3, 1551–1556. [Google Scholar]
- Ali, I.; Al-Othman, Z.A.; Alwarthan, A. Green synthesis of functionalized iron nano particles and molecular liquid phase adsorption of ametryn from water. J. Mol. Liq. 2016, 221, 1168–1174. [Google Scholar] [CrossRef]
- Chen, Z.; Luo, F.; Yang, D.; Mallavarapu, M.; Naidu, R. Biomolecules in grape leaf extract involved in one-step synthesis of iron-based nanoparticles. RSC Adv. 2014, 4, 53467–53474. [Google Scholar]
- Shahwan, T.; Sirriah, S.A.; Nairat, M.; Boyacı, E.; Eroğlu, A.E.; Scott, T.B.; Hallam, K.R. Green synthesis of iron nanoparticles and their application as a Fenton-like catalyst for the degradation of aqueous cationic and anionic dyes. Chem. Eng. J. 2011, 172, 258–266. [Google Scholar] [CrossRef]
- Okoth, O.J.K. Synthesis and Characterization of Iron Nanoparticles Using Banana Peels Extracts and their Application in Aptasensor. Ph.D. Thesis, University of Nairobi, Nairobi, Kenya, November 2016. [Google Scholar]
- Njagi, E.; Huang, H.; Stafford, L.; Genuino, H.; Galindo, H.M.; Collins, J.B.; Hoag, G.; Suib, S. Biosynthesis of Iron and Silver Nanoparticles at Room Temperature Using Aqueous Sorghum Bran Extracts. Langmuir 2011, 27, 264–271. [Google Scholar] [CrossRef]
- Wang, T.; Jin, X.; Chen, Z.; Megharaj, M.; Naidu, R. Green synthesis of Fe nanoparticles using eucalyptus leaf extracts for treatment of eutrophic wastewater. Sci. Total Environ. 2014, 466, 210–213. [Google Scholar] [CrossRef]
- Saif, S.; Tahir, A.; Chen, Y. Green Synthesis of Iron Nanoparticles and Their Environmental Applications and Implications. Nanomaterials 2016, 6, 209. [Google Scholar] [CrossRef] [PubMed]
- Tandon, P.K.; Shukla, R.C.; Singh, S.B. Removal of Arsenic (III) from Water with Clay-Supported Zerovalent Iron Nanoparticles Synthesized with the Help of Tea Liquor. Ind. Eng. Chem. Res. 2013, 52, 10052–10058. [Google Scholar] [CrossRef]
- Chiban, M.; Zerbet, M.; Carja, G.; Sinan, F. Application of low-cost adsorbents for arsenic removal: A review. J. Environ. Chem. Ecotoxicol. 2012, 4, 91–102. [Google Scholar]
- Johnston, R.; Heijnen, H. Safe Water Technology for Arsenic Removal. Technologies for Arsenic Removal from Drink-ing Water, Bangladesh University of Engineering and Technology, Dhaka, Bangladesh. 2001. Available online: https://www.google.com.tw/url?sa=t&rct=j&q=&esrc=s&source=web&cd=3&ved=2ahUKEwiQtsqJ0aLlAhWv3mEKHS1lAh0QFjACegQIAhAC&url=http%3A%2F%2Farchive.unu.edu%2Fenv%2FArsenic%2FHan.pdf&usg=AOvVaw0vhEva1YqNNvNGVO-wCfJB (accessed on 17 September 2019).
- Bazrafshan, E.; Faridi, H.; Mostafapour, F.K.; Mahvi, A. Removal of Arsenic from Aqueous Environments Using Moringa peregrina Seed Extract as a Natural Coagulant. Asian J. Chem. 2013, 25, 5. [Google Scholar] [CrossRef]
- Yao, S.; Liu, Z.; Shi, Z. Arsenic removal from aqueous solutions by adsorption onto iron oxide/activated carbon magnetic composite. J. Environ. Health Sci. Eng. 2014, 12, 58. [Google Scholar] [CrossRef]
- Khaled, A.; Nemr, A.E.; El-Sikaily, A.; Abdelwahab, O. Removal of Direct N Blue-106 from artificial textile dye effluent using activated carbon from orange peel: Adsorption isotherm and kinetic studies. J. Hazard. Mater. 2009, 165, 100–110. [Google Scholar] [CrossRef]
- Padmavathy, V. Biosorption of nickel (II) ions by baker’s yeast: Kinetic, thermodynamic and desorption studies. Bioresour. Technol. 2008, 99, 3100–3109. [Google Scholar] [CrossRef]
- Hao, L.; Liu, M.; Wang, N.; Li, G. A critical review on arsenic removal from water using iron-based adsorbent. RSC Adv. 2018, 8, 39545–39560. [Google Scholar] [CrossRef]
- Shafique, U.; Ijaz, A.; Salman, M.; Zaman, W.U.; Jamil, N.; Rehman, R.; Javaid, A. Removal of arsenic from water using pine leaves. J. Taiwan Inst. Chem Eng. 2012, 43, 256–263. [Google Scholar] [CrossRef]
- Karimi, P. Evaluating of Arsenic Adsorption from the Aqueous Solutions Using Porous Nanostructures; University of Birjand: Birjand, Iran, 2018. [Google Scholar]


| Parameters | |||||
|---|---|---|---|---|---|
| pH | Time (min) | Agitation Rate (rpm) | Adsorbent Dose (g/L) | Initial Arsenic Concentration (mg/L) | |
| Series 1 | 4, 5, 6, 7, 8,9 | 15 | 150 | 2 | 75 |
| Series 2 | 6 | 5, 15, 20, 40, 60, 80, 100, 120 | 150 | 2 | 75 |
| Series 3 | 6 | 20 | 100, 150, 200, 250 | 2 | 75 |
| Series 4 | 6 | 20 | 200 | 0.5, 1, 1.5, 2, 2.5, 3 | 75 |
| Series 5 | 6 | 20 | 200 | 2 | 25, 50, 75, 100, 150 |
| Isotherms | Equations | Linear Expression | Plot | Parameters |
|---|---|---|---|---|
| Freundlich | KF = exp(intercept) n = (slope)−1 | |||
| Langmuir | Type(I) | qm = (slope)−1 KL = slope/intercept | ||
| Temkin | qm = exp (intercept/slope) KL = slope | |||
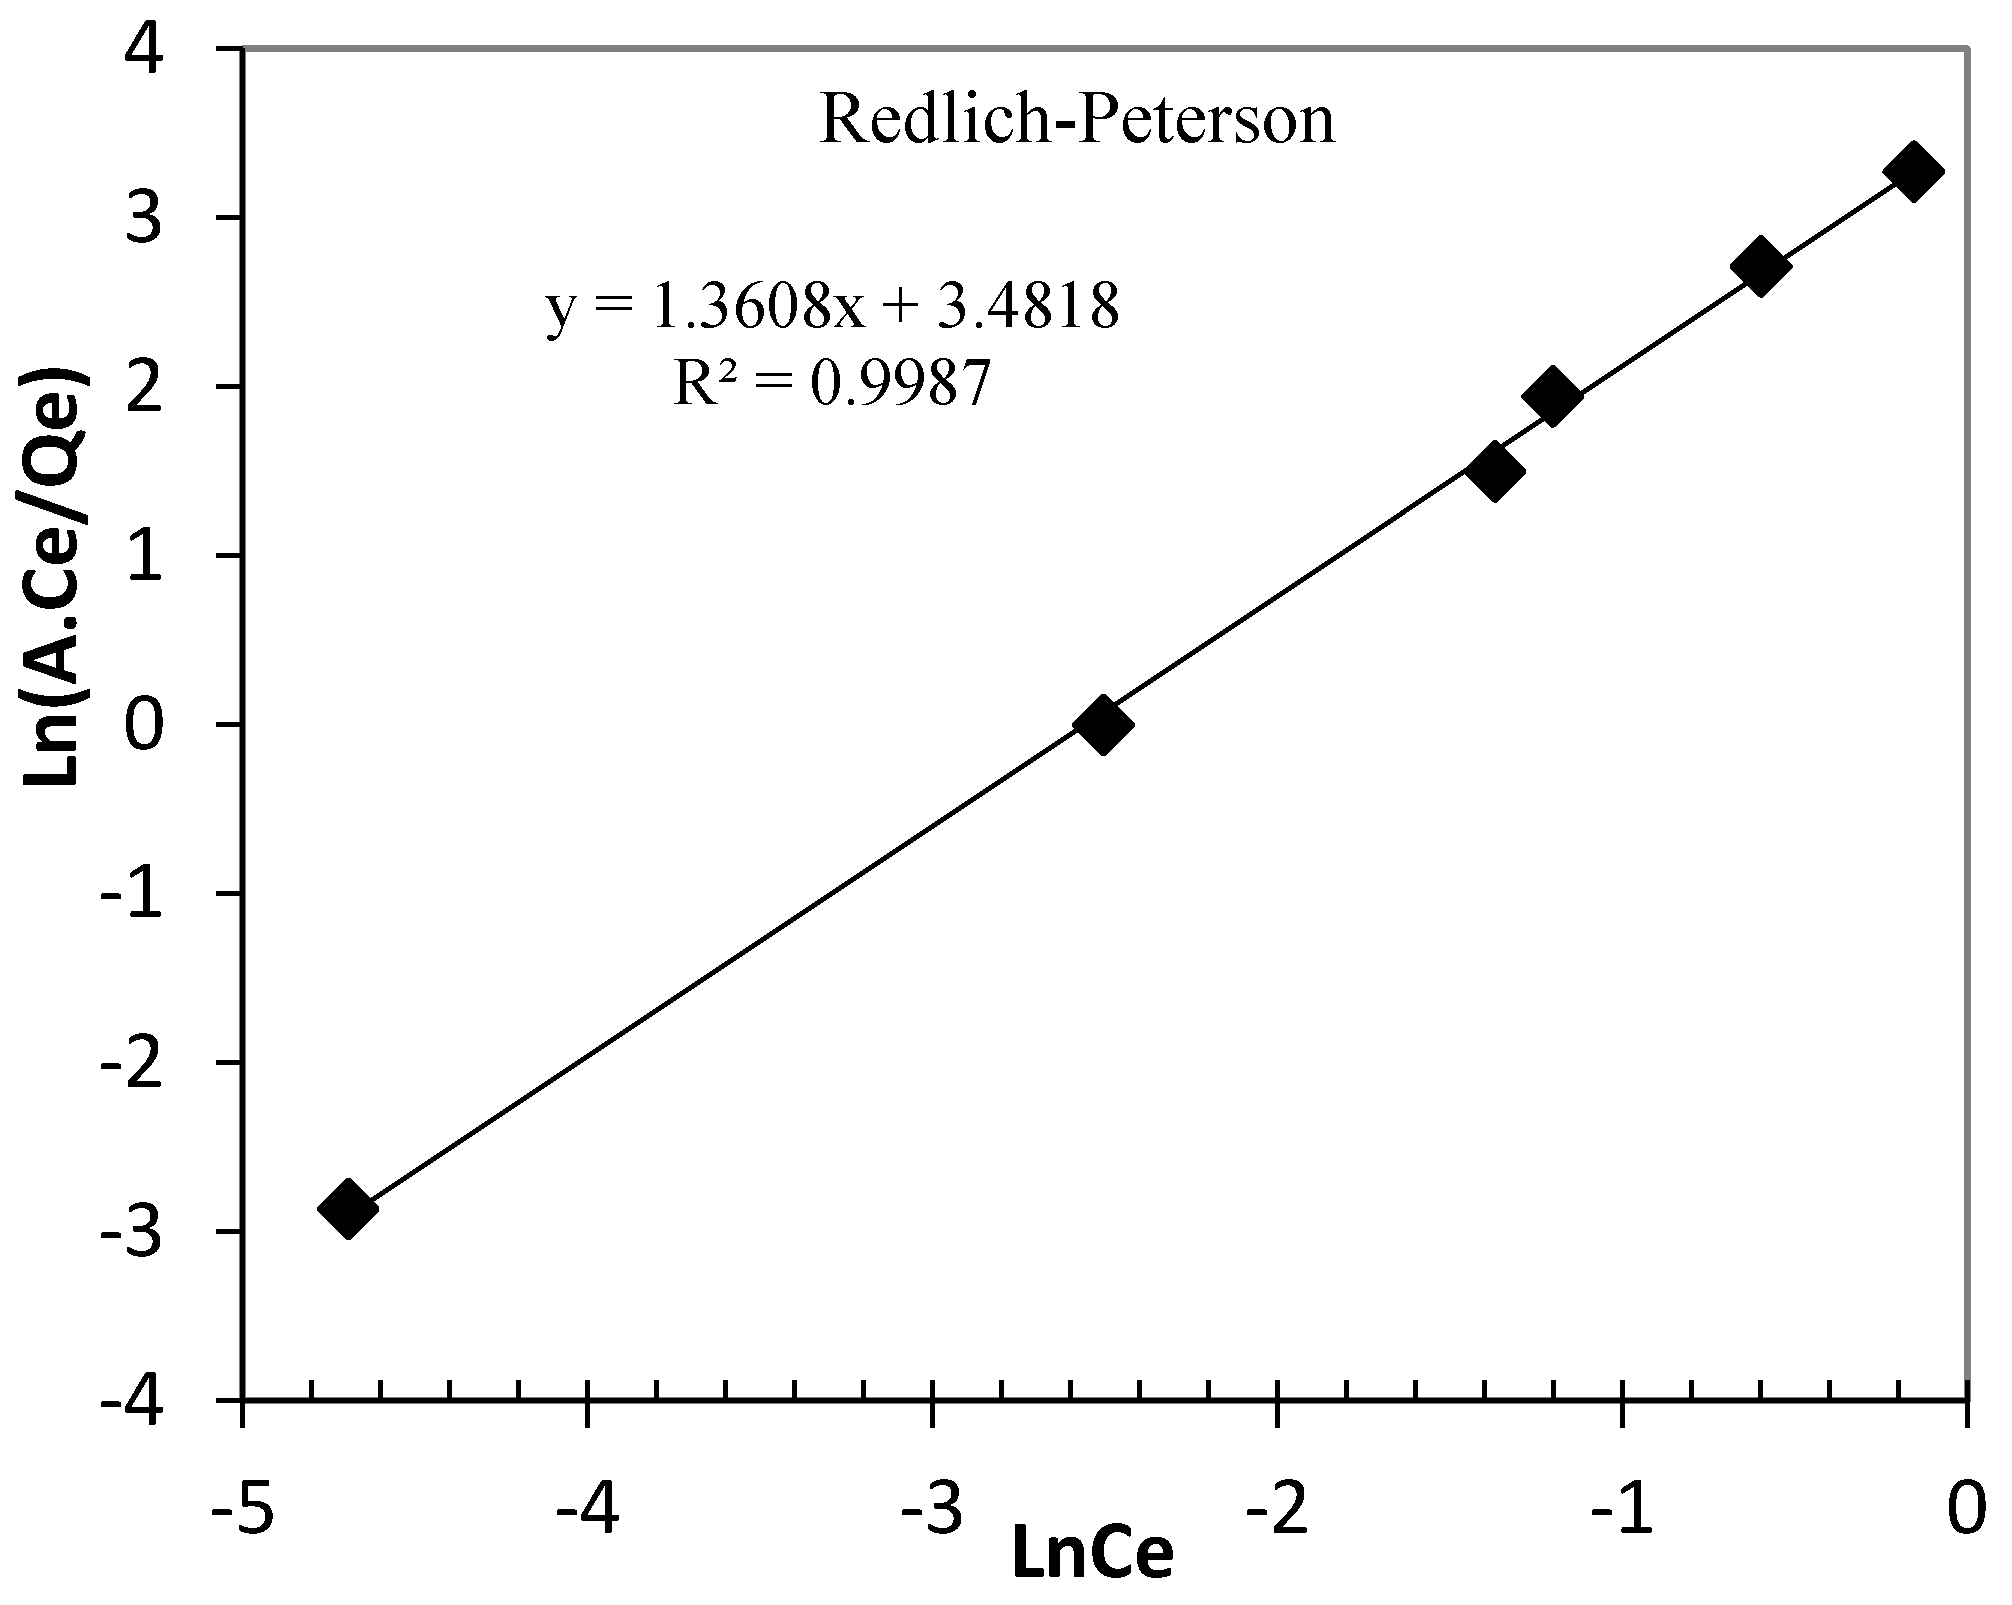
| Redlich-Peterson | G = slope BRP = exp (intercept) ARP * | |||
| Koble–Corrigan | AKC= (slope)−1 BKC = intercept/slope P * |
| Kinetic Model | Equations | Linear Expression | Plot | Parameters |
|---|---|---|---|---|
| Zero order | qt = qe − k0t | qt = qe − k0t | qt vs. t | k0 = −slope qe = intercept |
| First order | qe = qtexp (k1t) | Ln(qe/qt) = k1t | ln(qt) vs. t | k1 = −slope qe = exp (intercept) |
| Pseudo-first order | qt = qe[1 − exp (k1pt)] | k1 = −slope qe = exp (intercept) | ||
| Pseudo-second order | qt = k2pqe2t/(1 + qek2pt) | k2p = (slope)2/intercept qe = (slope)−1 | ||
| Elovich | Β = (slope)−1 α = (slope) exp (intercept/slope) | |||
| Exponential function | V = slope K = exp(intercept) |
| Plants | Part Used | Size and Morphology |
|---|---|---|
| Green tea | Leaf | 40–60 nm, Amorphous |
| Tea | Tea powder | 40–50 nm, Spherical |
| Pomegranate | Leaf | 100–200 nm |
| Azadirachta indica | Leaf | 50–100 nm, Spherical |
| Melaleuca nesophila and Rosemarinus officinalis | Leaf | 50–80 nm, Spherical |
| Grapes | Leaf | 15–100 nm, Quasi-spherical |
| Tridax procumbens | Leaf | 80–100 nm, Crystalline, irregular sphere shapes |
| Eucalyptus tereticornis | Leaf | 40–60 nm, Cubic |
| Isotherms | Parameters | R2 |
|---|---|---|
| Freundlich | KF = 25.81 mg g−1 (L mg−1)1/n n = 3.75 | 0.9901 |
| Langmuir | qm = 64.51 mg g−1 KL = 0.49 L mg−1 | 0.9849 |
| Temkin | qm = 8.0041 mg g−1 KL = 45.02 L mg−1 | 0.917 |
| Redlich-Peterson | g = 1.361 BRP = 32.52 (L mg−1) ARP = 2 mg g−1 (L mg−1) | 0.9987 |
| Koble–Corrigan | AKC = 0.052 mg g−1 (L mg−1) BKC = 0.012 (L mg−1)P P = 0.2 | 0.9974 |
| Isotherms | Parameters | R2 |
|---|---|---|
| Zero-order | K0 = −0.0731 mg/g h qe = 41.784 mg/g | 0.29 |
| First-order | K1 = −0.00181/h qe = 41.09 mg/g | 0.28 |
| Pseudo-first-order | K1 = 0.003 1/h qe = 18.81 mg/g | 0.32 |
| Pseudo-second-order | K2 = 0.017 g/mg h qe = 48.87 mg/g | 0.99 |
| Elovich | β = 0.24 g/mg α = 478.1 mg/g h | 0.63 |
| Exponential function | V = 0.1031 K = 31.31 mg/g h | 0.61 |
| Adsorbent | Initial Concentration (mg/L) | ΔH (kJ/mol) | ΔS (J/mol·k) | T (°K) | ΔG (kJ/mol) |
|---|---|---|---|---|---|
| Iron nanoparticles | 100 | −20.7 | −57.3 | 293 | −3898.3 |
| 313 | −2751.9 | ||||
| 323 | −2178.6 | ||||
| 333 | −1605.4 | ||||
| 343 | −1032.2 |
| No. | Adsorbent | Uptake Capacity (mg/g) | Ref. |
|---|---|---|---|
| 1 | Granular ferric hydroxide (GFH) | 1.1 | [43] |
| 2 | a-FeOOH nanoparticles | 76 | [43] |
| 3 | Ultra-fine δ-FeOOH | 37.3 | [43] |
| 4 | Hematite | 0.2 | [44] |
| 5 | Magnetite–maghemite nanoparticles | 3.71 | [43] |
| 6 | Red mud | 0.94 | [44] |
| 7 | Fe3O4 nanoparticles | 46.06 | [43] |
| 8 | Alumina | 25 | [43] |
| 9 | Activated carbon | 3.15 | [43] |
| 10 | γ-Fe2O3 nanoparticles | 2.9 | [43] |
| 11 | Fe3O4–γ-Fe2O3 nanoparticles | 3.71 | [43] |
| 12 | Nano zero valent iron (NZVI) | 1.8–2.0 | [43] |
| 13 | NZVI/montmorillonite | 59.9 | [43] |
| 14 | Fe–Al layered double hydroxide | 40.6 | [43] |
| 15 | Nano-iron/oyster shell | 0.9 | [43] |
| 16 | NZVI-synthetized by mint | 86.53 | [44] |
| 17 | Iron oxide coated fungal biomass | 5.4 | [43] |
| 18 | Modified iron oxide | 0.73 | [44] |
| 19 | PVA–alginate-supported iron oxide nanoparticles (IONPs) | 40.3 | [35] |
| 20 | chitosan-alginate-supported IONPs | 34.4 | [35] |
| 21 | Iron nano particle/Pf-Tp | 61.7 | Present study |
© 2019 by the authors. Licensee MDPI, Basel, Switzerland. This article is an open access article distributed under the terms and conditions of the Creative Commons Attribution (CC BY) license (http://creativecommons.org/licenses/by/4.0/).
Share and Cite
Karimi, P.; Javanshir, S.; Sayadi, M.H.; Arabyarmohammadi, H. Arsenic Removal from Mining Effluents Using Plant-Mediated, Green-Synthesized Iron Nanoparticles. Processes 2019, 7, 759. https://doi.org/10.3390/pr7100759
Karimi P, Javanshir S, Sayadi MH, Arabyarmohammadi H. Arsenic Removal from Mining Effluents Using Plant-Mediated, Green-Synthesized Iron Nanoparticles. Processes. 2019; 7(10):759. https://doi.org/10.3390/pr7100759
Chicago/Turabian StyleKarimi, Pari, Sepideh Javanshir, Mohammad Hossein Sayadi, and Hoda Arabyarmohammadi. 2019. "Arsenic Removal from Mining Effluents Using Plant-Mediated, Green-Synthesized Iron Nanoparticles" Processes 7, no. 10: 759. https://doi.org/10.3390/pr7100759
APA StyleKarimi, P., Javanshir, S., Sayadi, M. H., & Arabyarmohammadi, H. (2019). Arsenic Removal from Mining Effluents Using Plant-Mediated, Green-Synthesized Iron Nanoparticles. Processes, 7(10), 759. https://doi.org/10.3390/pr7100759