Article

Equilibrium and Kinetic Studies of Biosorptive Removal of 2,4,6-Trichlorophenol from Aqueous Solutions Using Untreated Agro-Waste Pine Cone Biomass

by
Nadavala Siva Kumar
1,*,
Mohammad Asif
1,
Anesh Manjaly Poulose
1,
Madala Suguna
2 and
Mansour I. Al-Hazza
1
1
Department of Chemical Engineering, King Saud University, P.O. Box 800, Riyadh 11421, Saudi Arabia
2
Vemu Institute of Technology, P. Kothakota, Chitoor, Andhra Pradesh 517112, India
*
Author to whom correspondence should be addressed.
Processes 2019, 7(10), 757; https://doi.org/10.3390/pr7100757
Submission received: 25 September 2019 / Revised: 10 October 2019 / Accepted: 12 October 2019 / Published: 16 October 2019
(This article belongs to the Special Issue Advanced Liquid Waste and Gas Waste Treatment Processes)

Abstract

:
The present work discusses the adsorptive removal of a phenolic pollutant, i.e., 2,4,6-trichlorophenol (TCP), using low cost untreated agricultural waste pine cone powder (PCP). The present biosorbent was thoroughly characterized with the help of FTIR, SEM, XRD, and CHN analysis. The presence of amine (-NH2), hydroxyl (-OH) and carbonyl (C=O) functional groups was detected by the FTIR analysis. The important biosorption factors like agitation time, biomass dosage, initial adsorbate concentration, and the initial pH were examined by batch studies. The biosorption kinetic process was fast, reaching equilibrium in 75 min. The experimental kinetic data revealed an excellent agreement with the pseudo second order (PSO) model. On the other hand, the Langmuir isotherm model best described the equilibrium data with the maximum biosorption capacity (qmax) of 243.90 mg/g. These values are better than the adsorption capacities of most agro-based untreated adsorbents previously reported in the literature. Owing to fast removal rates and high biosorption capacity, PCP can be used for cost-effective treatment of TCP from aqueous streams.

1. Introduction

The phenolic derivatives are widely used as herbicides, pharmaceuticals, dyes, fungicides, algicides, insecticides, ovicides, preservatives, and numerous intermediate compounds [1]. The removal of chlorophenols such as 2,4,6-Trichlorophenol (TCP) from contaminated wastewater is essential because of their high toxicity, carcinogenicity, teratogenicity, mutageneticity, persistency, and low biodegradability. Its accumulation can cause serious environmental damage and harm the human health through direct exposure [2,3]. Effluents released from agricultural irrigation, petroleum refineries, pharmaceutical drugs, pulp and paper industries, synthetic resins, pesticides and industrial waste-water from paints are often heavily contaminated with chlorophenolic compounds [4,5]. Even at trace levels, these compounds can affect aquatic-life and lead to an accumulation in the food chain. Chlorinated phenols are highly toxic to both human and aquatic lives [6,7]. Moreover, chlorinated phenols are carcinogenic for animals, and are reported to cause leukemia, liver cancer, and lymphomas via oral exposure. In fact, 2,4,6-trichlorophenol has been classified as a probable human carcinogen (Group B2) by EPA (ATSDR, U.S. Public Health Service, Atlanta, GA. 1990) [8]. Therefore, it is essential to develop cost-effective treatment strategy for the contaminated waste-water prior to release into the environment.
The elimination of organic contaminants from the waste-water effluents using various methods like physical (membrane filtration, adsorption, biosorption and solvent extraction), chemical-biological oxidation, electrochemical oxidation, photocatalytic degradation, microbial degradation, ion exchange resins, catalytic oxidation, advanced oxidation processes have been proposed in the recent literature [9,10,11,12]. Among these techniques, the biosorption using various agricultural wastes has been thoroughly investigated for the elimination of organic contaminants and heavy metals from the standpoint of cost-effectiveness and eco-friendly considerations [13,14,15,16,17]. Several studies proved biosorption is a simple yet effective method for the elimination of pollutants, in which the significant factor is the utilization of agricultural wastes. Many authors highlighted the fact that the biosorption of phenol and phenolic derivatives using lignocellulosic residues and agricultural by-products do not require recycling and regeneration studies due to their low-cost and abundant availability in nature [2,18,19,20,21].
Pine trees annually produce large amounts of pine cones as an agricultural waste. Each cone consists of an axis, which is composed of several woody scales arranged in a spiral fashion. These scales comprise of epidermal and a sclerenchyma cell, which is mainly composed of lignin, tannins, and rosin etc. besides cellulose and hemicelluloses in their cell wall structures [22]. Pine cone biomass have newly used for removing heavy metals, dyes, and phenols from aqueous media [23,24,25,26,27,28]. However, its use for removing chlorophenols from contaminated wastewater has not yet been reported in the literature.
Despite being a common pollutant found in the environment, the biosorptive removal of TCP using pinecone biomass, to our knowledge, has not yet been discussed in the literature. Therefore, the present study examines the biosorption efficacy of the untreated PCP to remove TCP from contaminated waste-water. The biosorbent characterization was carried out with the help of FTIR, BET, SEM, XRD and CHN analysis. Several key factors influence the sorption of TCP, such as the solution pH, agitation time, biosorbent dosage, and the initial concentration of TCP were studied for greater understanding and subsequent optimization of the biosorption process.

2. Materials and Methods

2.1. Materials

2,4,6-Trichlorophenol (C6H3Cl3O) has a molecular weight of 197.46 g/mol. We first prepared 1000 mg/L stock solution of analytical grade TCP (Aldrich, St. Louis, MO, USA). The experimental solutions of concentration varying from 100 to 400 mg/L were prepared by diluting the original stock solution in required proportions. The pH of the solution was adjusted in the range of 2.0–10 by adding 0.1 M acid (HCl) or base (NaOH) solutions.

2.2. Preparation of Pine Cone Biosorbent

Pine trees produce large amounts of pine cone as agricultural waste. The first step was to wash with distilled water for removing impurities, e.g., leaves and sand. Pine cones were then dried in an oven maintained at 80 °C for 48 h. The next step involved removal of the scales from cones and blending the sample with the help of a food processing blender. We then ground the blended sample to get a fine powder of wide size distribution. The pine cone powder was finally obtained by using Mesh 200 and Mesh 270 sieves, which yielded biosorbent particles in the size range of 53–74 μm. This final product was named ‘PCP’ (Pine cone powder) and used without any further treatment for chlorophenol biosorption studies.

2.3. Batch Biosorption Studies

The biosorption equilibrium was investigated by carrying out batch experiments using amber glass reagent bottle (125 mL capacity) containing 0.1 g PCP in 100 mL solution containing TCP with a 100–400 mg/L concentration. We stirred the samples using a shaking water bath at 220 rpm with controlled temperature (30 ± 1 °C) till steadiness was attained. The solution pH was varied in the range of 2–10. For filtration, a paper filter with 2.7 μm size particle retention was used to get the supernatant solution. TCP concentration was measured using UV-Vis spectrophotometer (Model: Shimadzu UV-1601, Tokyo, Japan) at a wavelength of 296 nm.
In order to determine the biosorption uptake capacity (qe, mg/g) and the removal efficiency, following equations were utilized,
q e = ( C 0 C e ) V W .
R e m o v a l   ( % ) = ( C 0 C e ) × 100 C 0
where, qe = equilibrium biosorption capacity, C0 = TCP concentration (mg/L) at time = 0, Ce = TCP concentration (mg/L) at equilibrium, V = volume (L) of the solution, W = PCP biosorbent mass (g).
During batch kinetics studies, the TCP uptake, qt (mg/g), at time t was calculated using,
q t = V ( C 0 C t ) W
where, Ct is the concentration of solute (mg/L) at time, t (min).

2.4. Normalized Standard Deviation

The validity of the kinetic and equilibrium isotherm models was evaluated using the normalized standard deviation. Mathematically, it can be represented [29] as follows:
q ( % ) = 100 × i = 1 N [ ( q i , e x p q i , c a l ) / q i , e x p ] 2 ( N 1 )
where qi,exp and qi,cal are time dependent investigation data and the corresponding model predictions, respectively, whereas N is represent the number of data points.

2.5. Chi-Square Test (χ2)

Chi-square analysis was also carried out for comparing the agreement among the investigational data and the predictions models of kinetic and equilibrium isotherm. This is defined as [30],
χ 2 = i = 1 N ( q e q e , m o d e l ) 2 q e , m o d e l
where qe and qe,model (mg/g) are the biosorbed amount of TCP contaminant achieved experimentally and predicted by the relevant model, respectively.

3. Results

3.1. Pine Cone Biomass Characterization

Analysis of the natural PCP powder which was carried out is shown in Table 1. The ash content, CHN, moisture content, surface properties, and bulk density.

3.1.1. Characteristics of Native PCP and after Biosorption

The identification of biosorbent surface functional groups in TCP biosorption was determined with the help of FTIR analyses. In Figure 1a,b shows the shift of some functional groups FTIR spectral data of the native PCP and TCP loaded PCP in the 400 to 4000 cm−1 range. The native PCP shows main broadband peaks observed at 3328 & 2938 cm−1 are due to N-H, O-H stretching vibration and aliphatic C-H stretching vibrations of -CH3 and -CH2 functional groups [20,31,32]. The peak at 1647 cm−1 show the functional group region of C=O stretch and one more peak at 1440 cm−1 indicates the phenolic -OH and -C=O is stretching of carboxylate group. While the other bands between 541, 626, 879, 975 and 1052 cm−1 may be attributed to the -C-H- bending and -C-Cl- stretching, respectively [33,34]. As shown in Figure 1b after biosorption of TCP on PCP showed small shifts, which may be due to the modifications in counter ions that are associated with hydroxyl, amino and carboxylic groups.

3.1.2. SEM

Figure 2 displays the SEM images of the PCP sorbent. As seen in Figure 2a natural pine cone shows significant surface with pores. It displays a flake type behavior with irregular surface structure with some agglomeration. In Figure 2b at a higher magnification, the irregular surface containing pores are clearly visible in the biosorbent. This kind of surface morphology can help trapping and adsorption of molecules of TCP.

3.1.3. XRD Analysis

XRD patterns were recorded with the help of using Siemens D 5000 X-ray diffractometer at 40 kV voltage and using 1.5406 Å Cu/Kα radiation (figure not shown). The angle diffraction was varied in the range of 10 to 60°. The broad peak cellulose at 2θ = 21.2–22.4° confirms the amorphous nature of the present adsorbent.

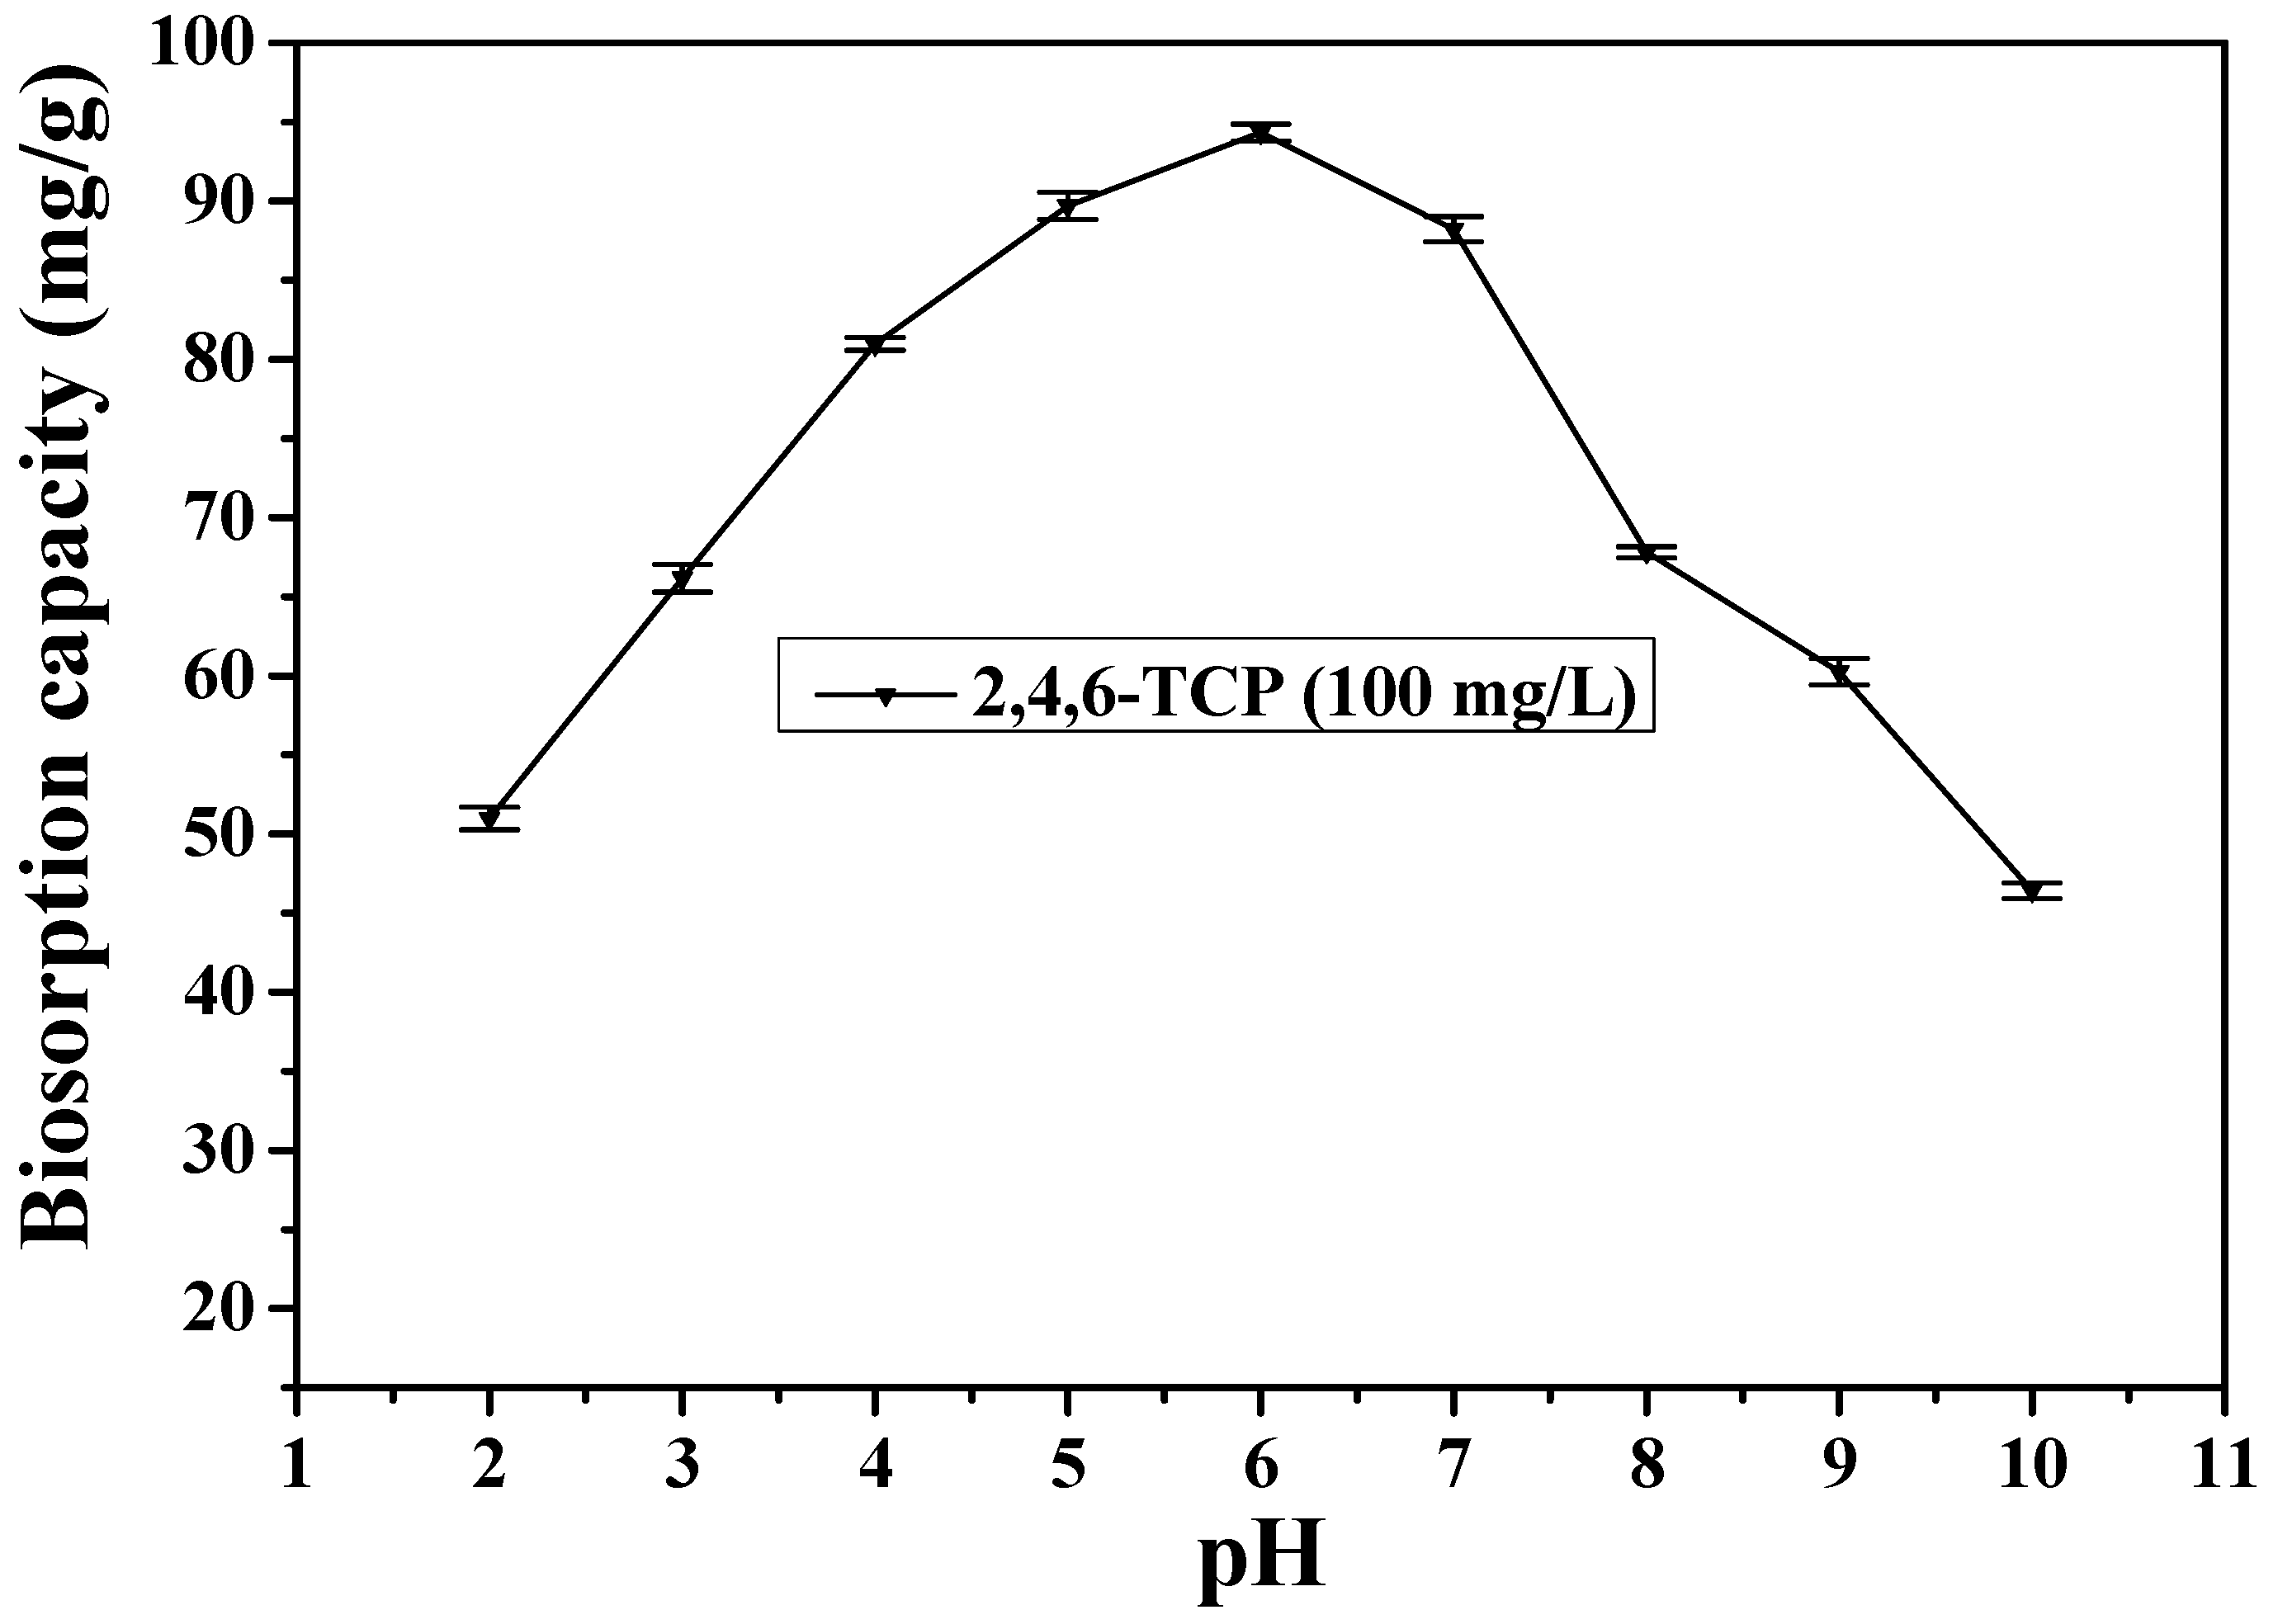
3.2. Investigation of Solution pH

Biosorption capacity is greatly affected by the solution pH. Its effect was therefore studied on the PCP uptake capacity by changing the solution pH range in 2–10. A strong correlation between the solution pH and the uptake of the TCP was noticed. As seen in Figure 3, the TCP uptake increases from 50.96 mg/g to 94.31 mg/g when the increased solution pH from 2 to 6. A further increase in the solution pH, however, lowers the biosorption capacity. Since the TCP is a weak acid with a dissociation constant (pKa) of 6.23, the acidic pH below the pKa value favors TCP to remain un-dissociated, and the dispersion interactions predominate [20,35]. At superior pH values (pH > 6), since chlorophenols are in the form of a salt which loses its negative charge easily, and hence becomes difficult to adsorb, resulting in a decrease in its biosorption [36]. At lower pH values, the protonated chlorophenols were more adsorbable than their ionized forms. The nature of the surface of the pine cone powder also affects the overall biosorption mechanism. Earlier, similar behavior was also observed the adsorption of chlophenols on other adsorbents, such as Acacia leucocephala bark [18], pine bark powder [20], activated carbon produced using palm empty fruit bunch, coconut husk, activated clay, coconut shell [37,38,39,40], and various agricultural wastes, e.g., sunflower seed hulls, pumpkin seed shells, walnut shells and peanut shells [21]. Therefore, all the remaining experiments were conducted at the optimum pH value of 6.

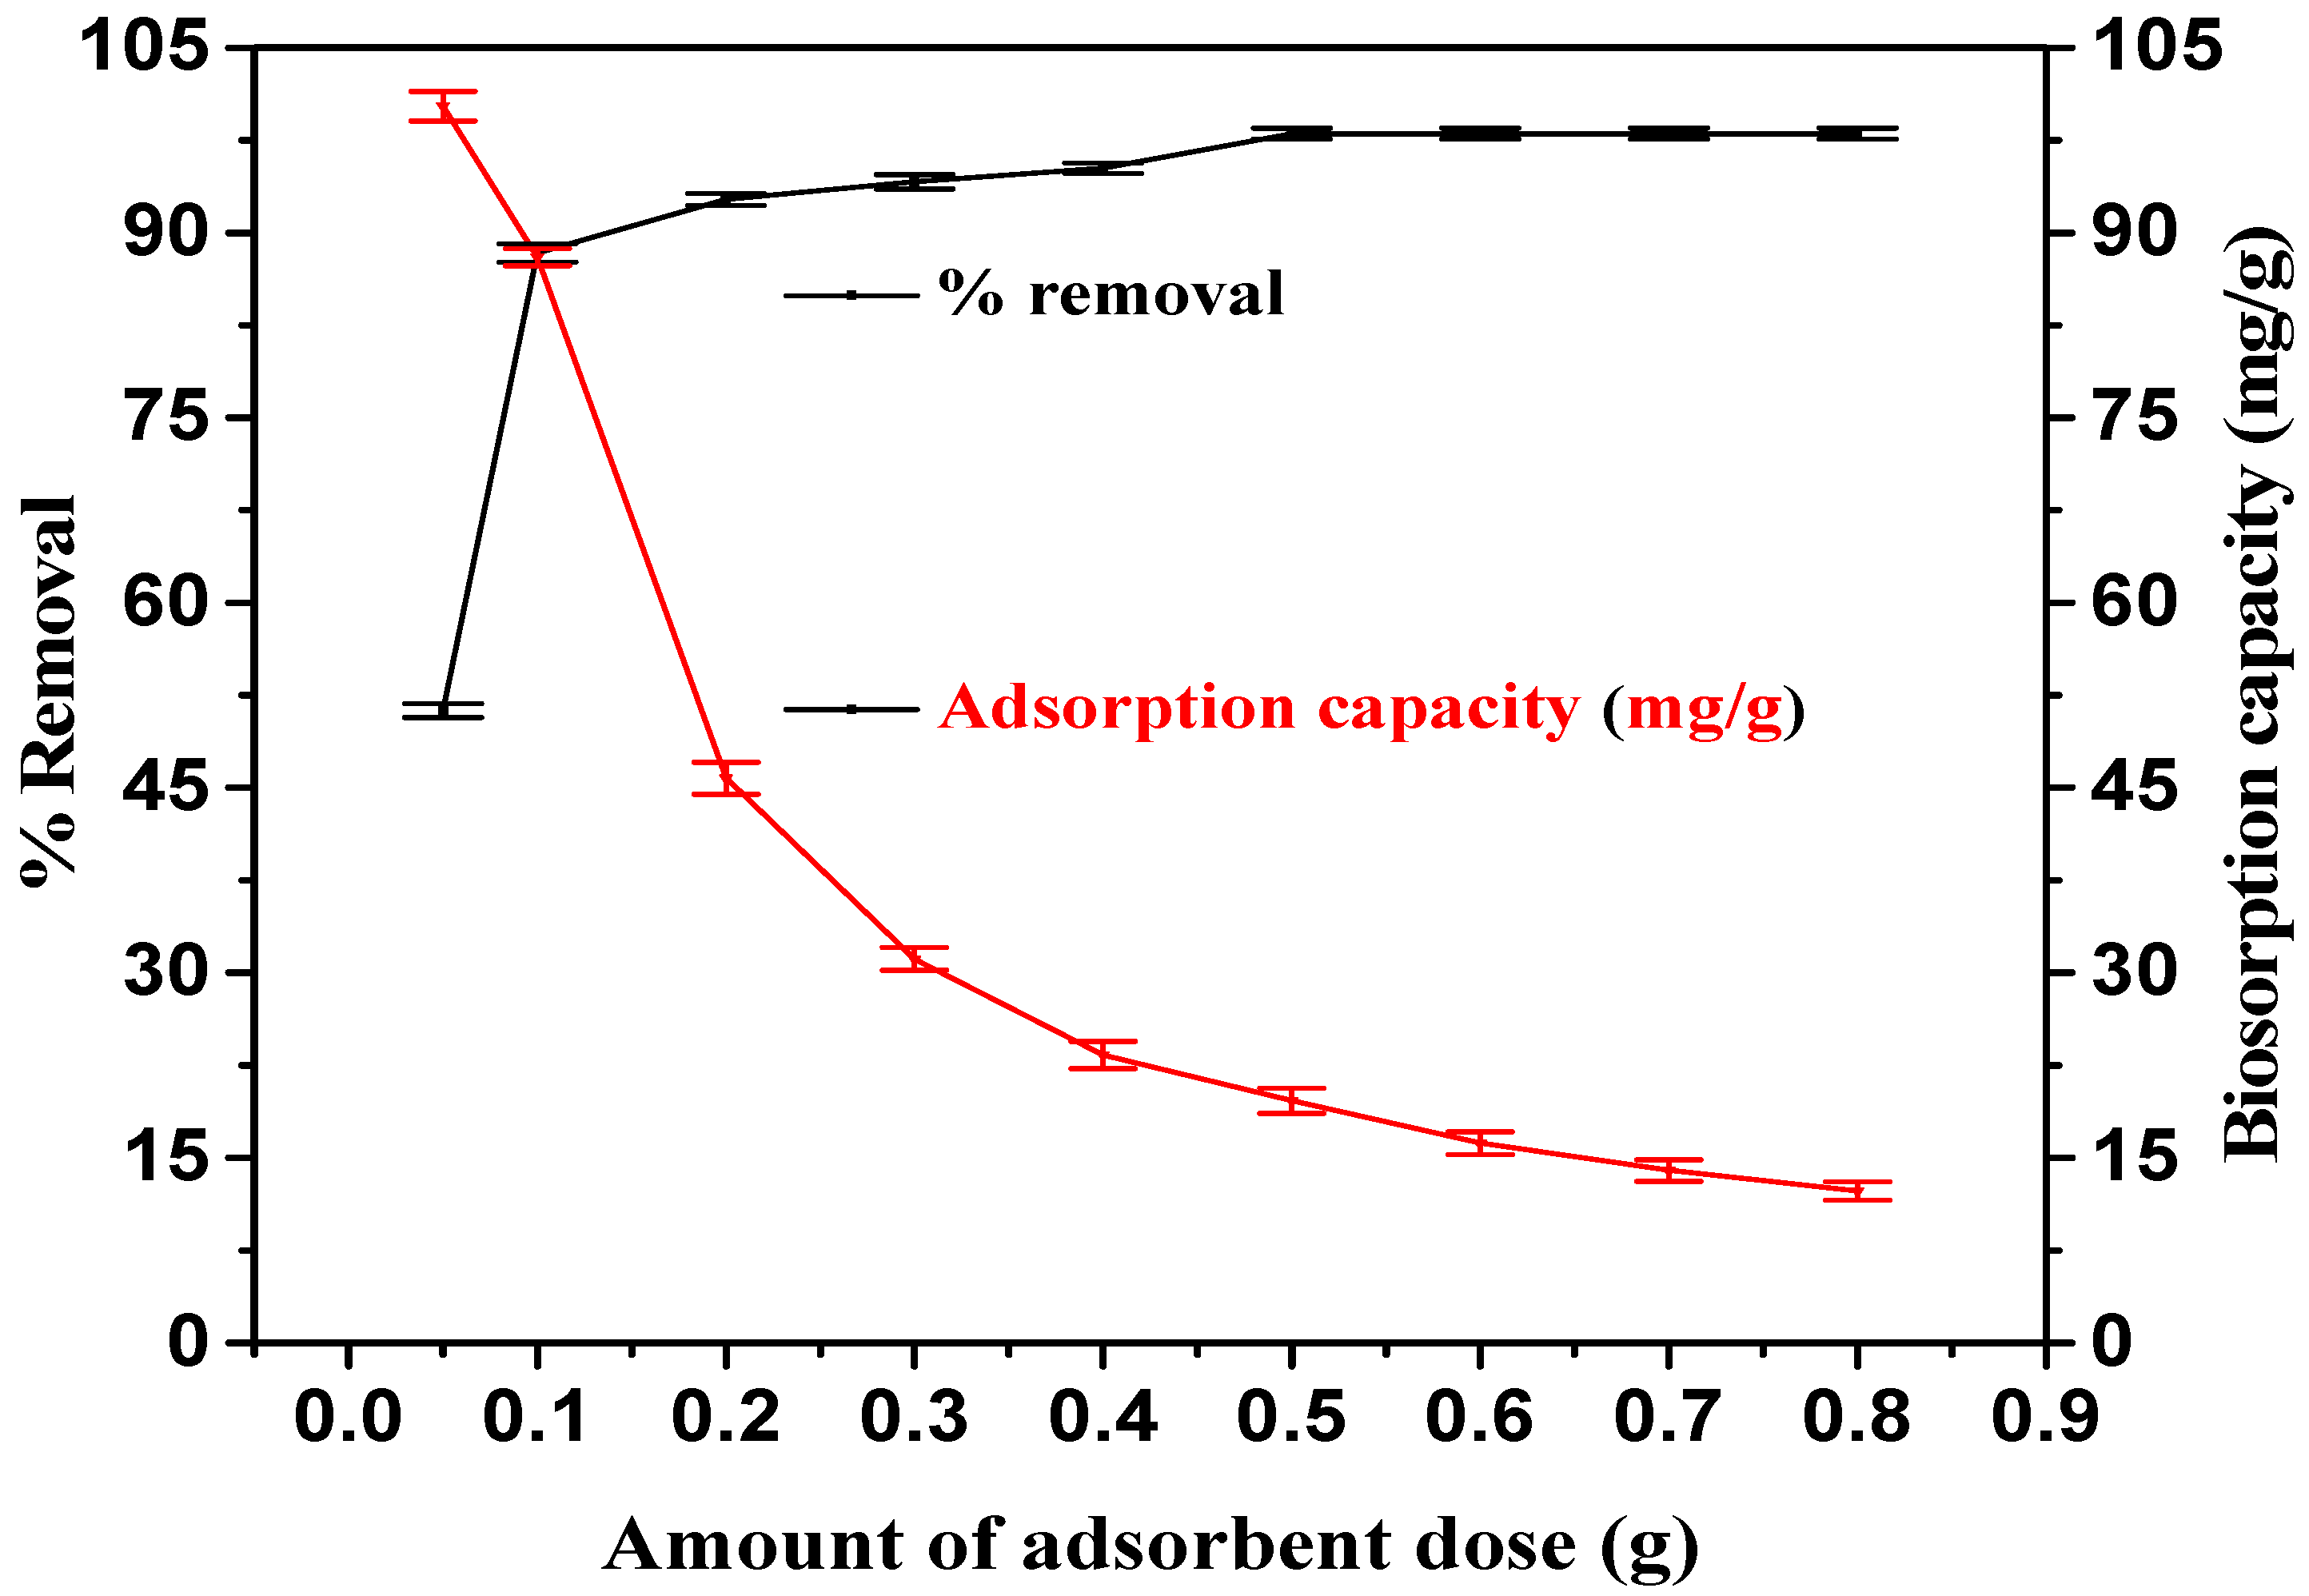
3.3. Influence of Sorbent Dosage

Biosorbent dosage is one of the important parameters which determines the efficacy of the process of the biosorption. Therefore, the biosorption experiments were performed by changing the biosorbent dose from 0.05–0.8 g in 100 mL test solution with 100 mg/L TCP concentration at optimum pH 6 for 3 h at 30 ± 1 °C to determine the effect of biosorbent dosage. As shown in Figure 4, the removal percentage of TCP was found to increase from 51.7 to 98.3% with increasing PCP dosage owing to enhanced active sites on the surface of the adsorbent, making TCP penetration easier into the active sites [20]. On the other hand, uptake capacity, which is the amount of TCP molecules adsorbed per unit PCP, considerably decreased. It can be attributed to the biosorbent agglomeration or interaction between sorbent atoms, thus decreasing the availability of active sorption sites [16,41]. Furthermore, above 0.5 g/L, there is hardly any enhancement in removal efficiency of TCP.

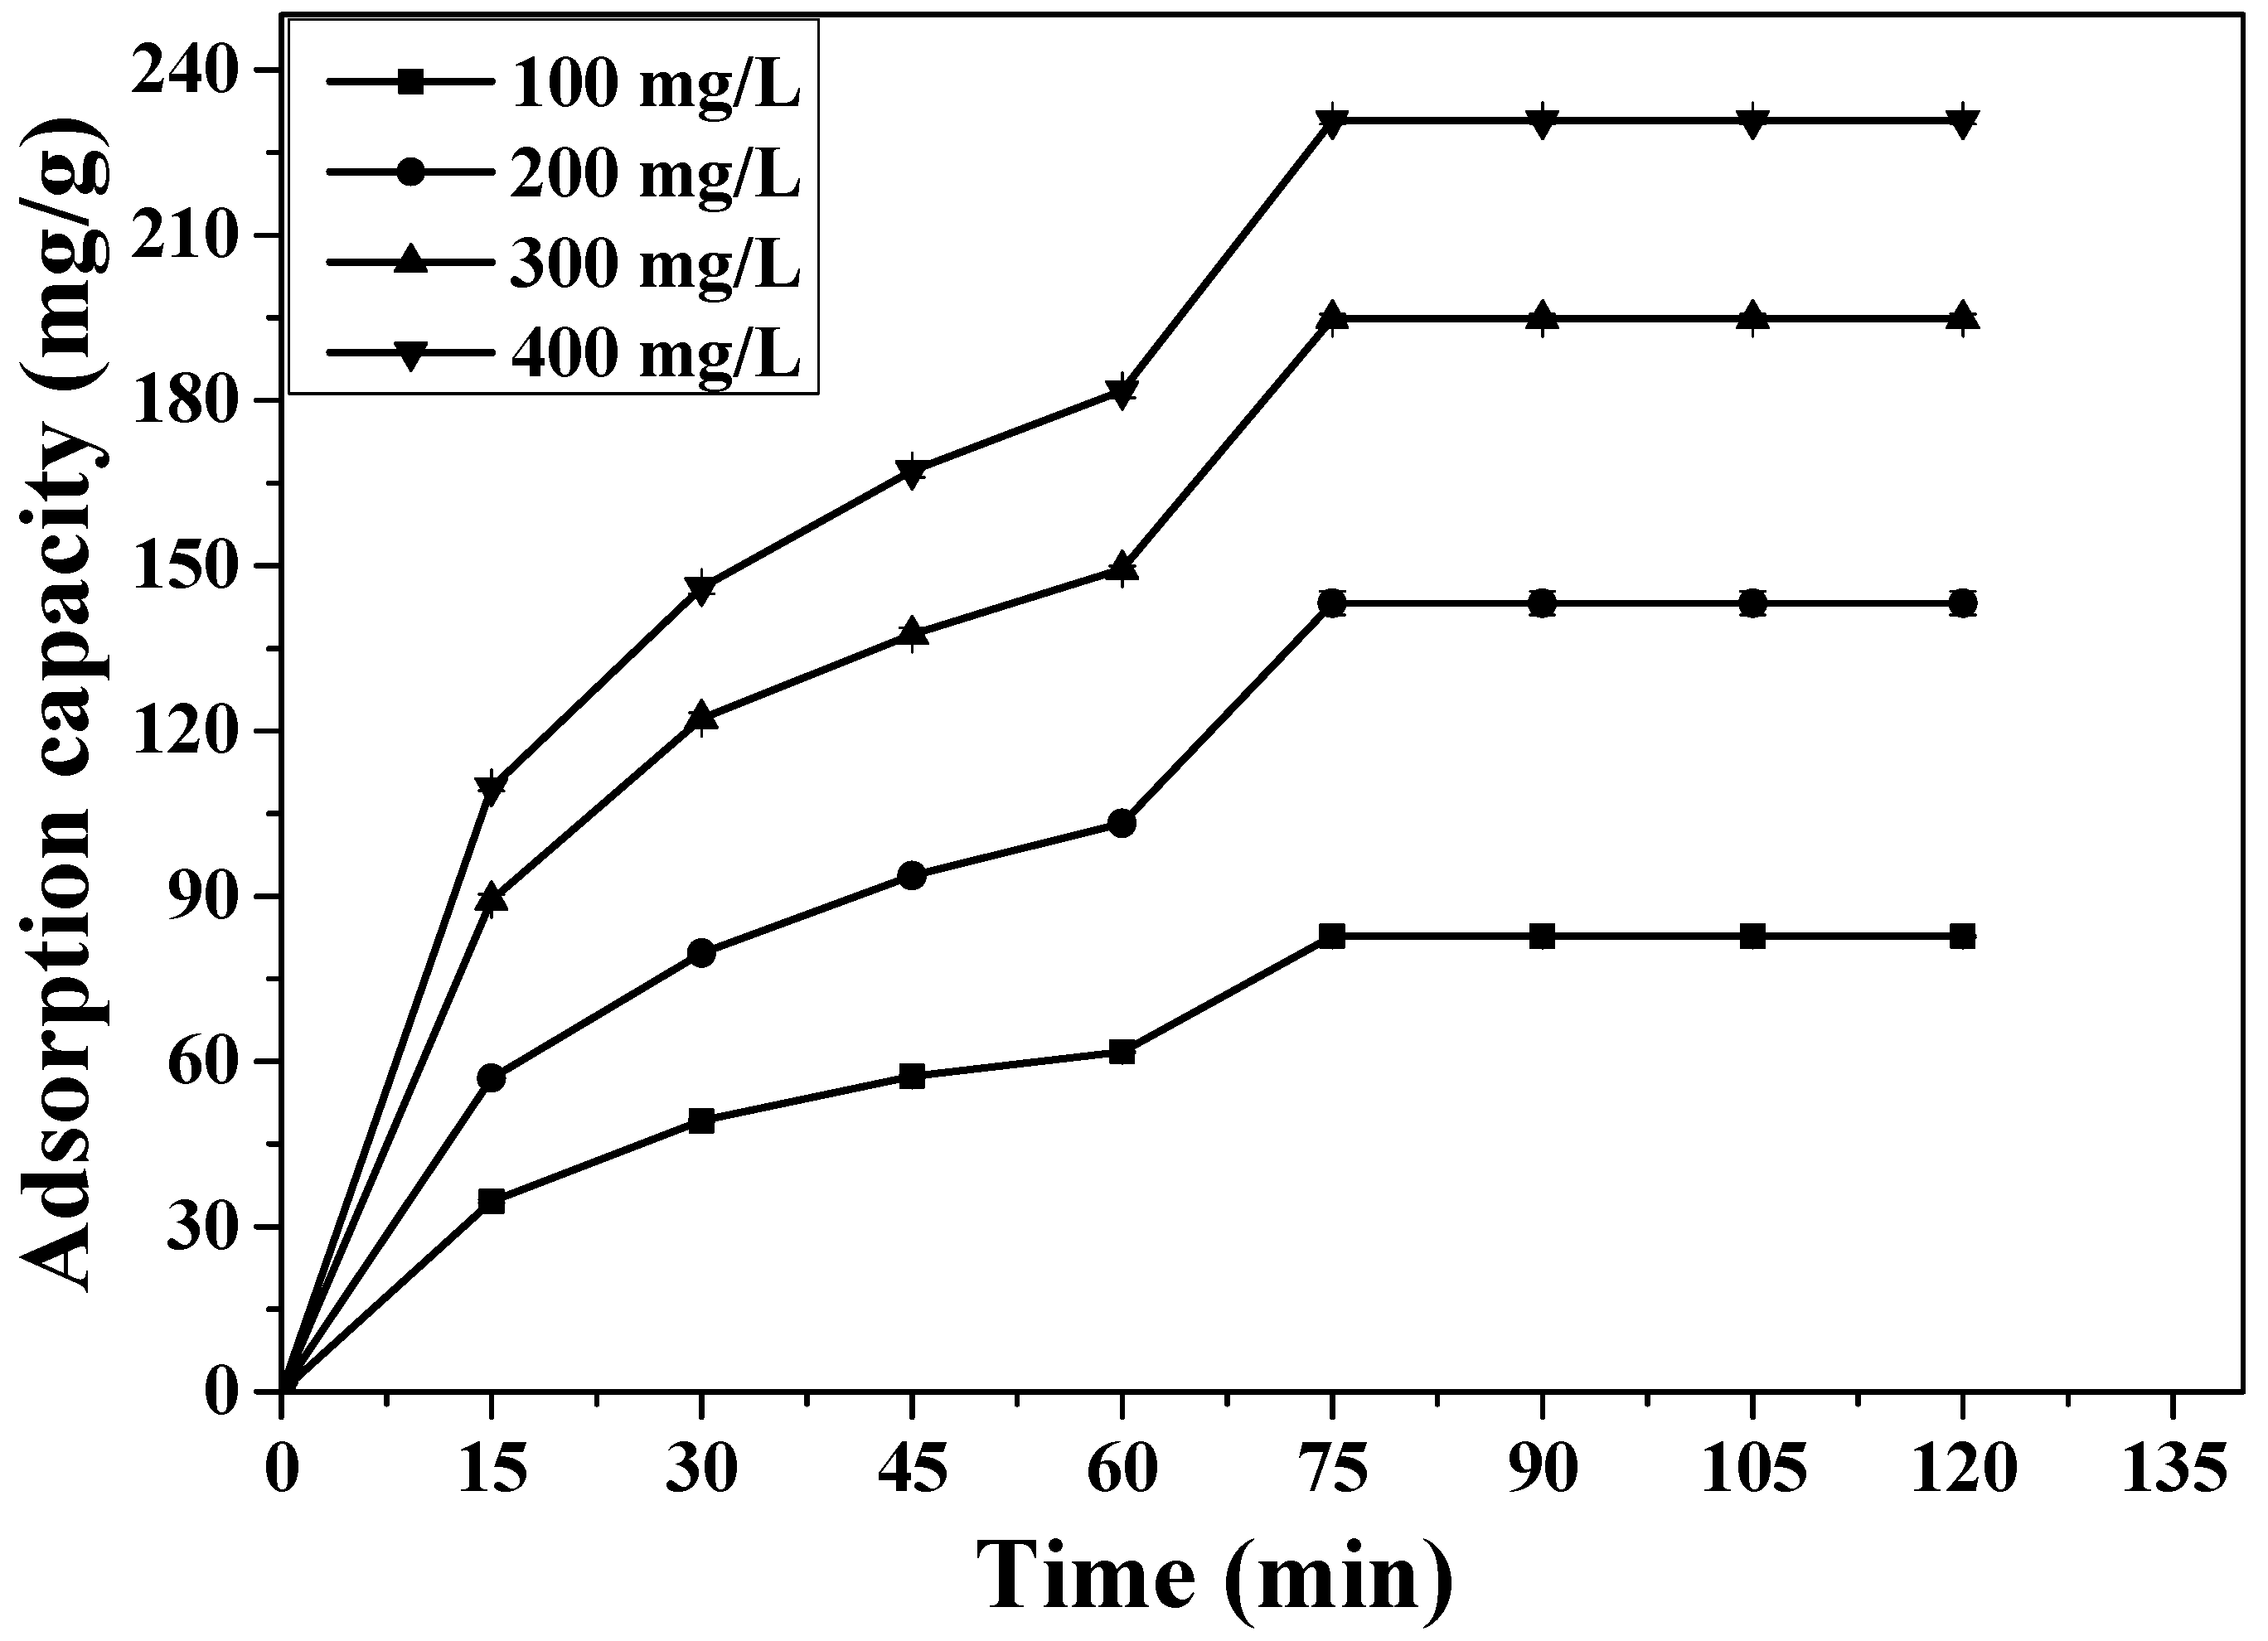
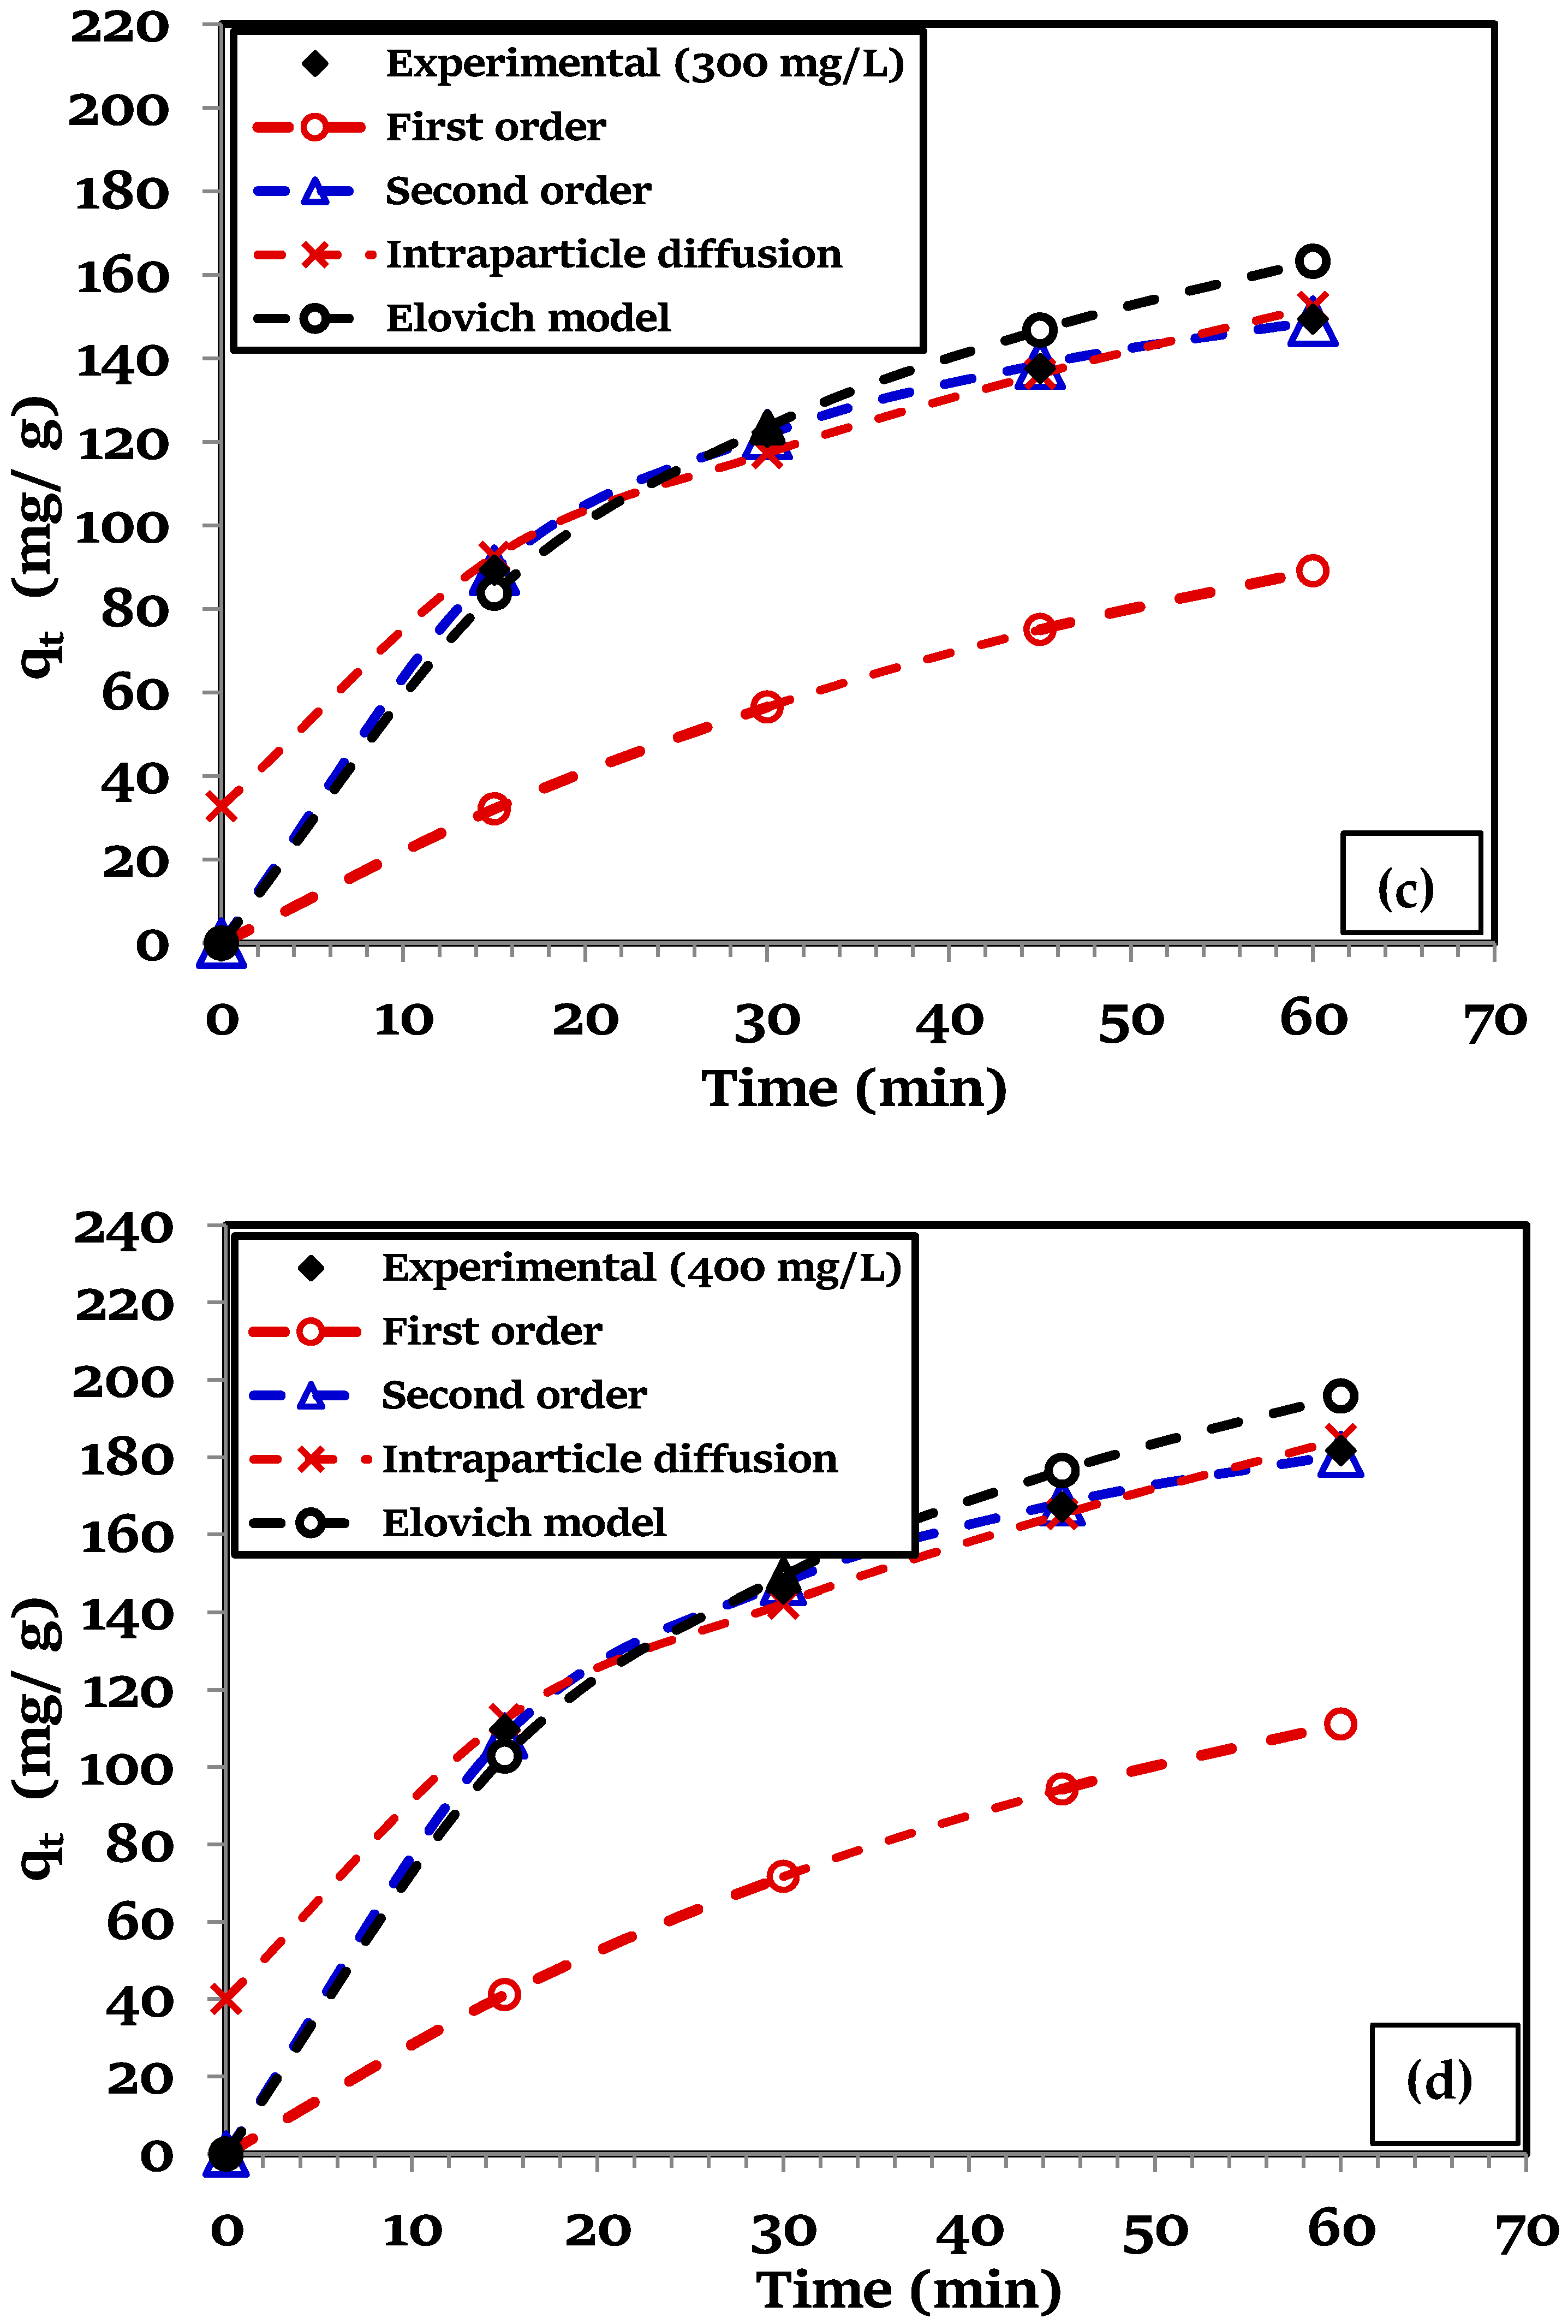
3.4. Effect of 2,4,6-TCP Initial Concentration and Contact Time

Contact time is another key parameter affecting the contaminant uptake by the biosorbent. The effect of agitation duration and the initial TCP concentration (100–400 mg/L) on the TCP uptake was carefully investigated at 30 °C. Figure 5 shows that the enhancement capacity with time and initial concentration. The uptake rate is initially fast until an equilibrium constant value is reached after 75 min. of contact. The fast uptake rate at the beginning of biosorption was caused by the greater affinity of the interacting groups and availability of the external surface of the biosorbent. Figure 5 shows that the equilibrium uptake capacity (qe) increases from 82.69 to 230.83 mg/g as the TCP initial concentrations is increased from 100–400 mg/L. Because higher initial concentration leads to greater mass transfer driving force, thus leading to higher TCP biosorption. Therefore, we fixed the contact time to 75 min for our batch experimental studies.
A wide range of equilibrium contact time for the TCP adsorption has been reported in the literature. Using commercial grade activated carbon produced from coconut shell-based, Radhika et al. found that the equilibrium time varied in the range of 60–210 min when the initial contaminant concentration was varied from 10 to 100 mg/L [40]. Using calcined Mg/Al-CO3 layered double hydroxide (CLDH), the equilibrium adsorption time of 180 min was reported for C0 = 25–400 mg/L [42]. On the other hand, 400 min was required for the removal of 2,4,6-TCP using PU@PDA@MSNs sponge for lower initial contaminant concentrations varying from 50 to 100 mg/L [43]. Denizli et al. also stated 240 min of equilibrium contact time for C0 = 500 mg/L [44]. Kumar et al. reported 180 min of equilibrium contact time for the 2,4,6-TCP biosorption on Acacia leucocephala bark for C0 = 50–200 mg/L [2]. Using activated carbon produced from oil palm empty fruit bunch, Tan et al. reported the agitation time of 1 h for the sorption of TCP for C0 = 25–150 mg/L, and 5–6 h for C0 = 200–250 mg/L [45]. In another study, 120 min was required for the removal of 2,4,6-TCP using pine bark powder for initial concentrations of 100–400 mg/L [20].

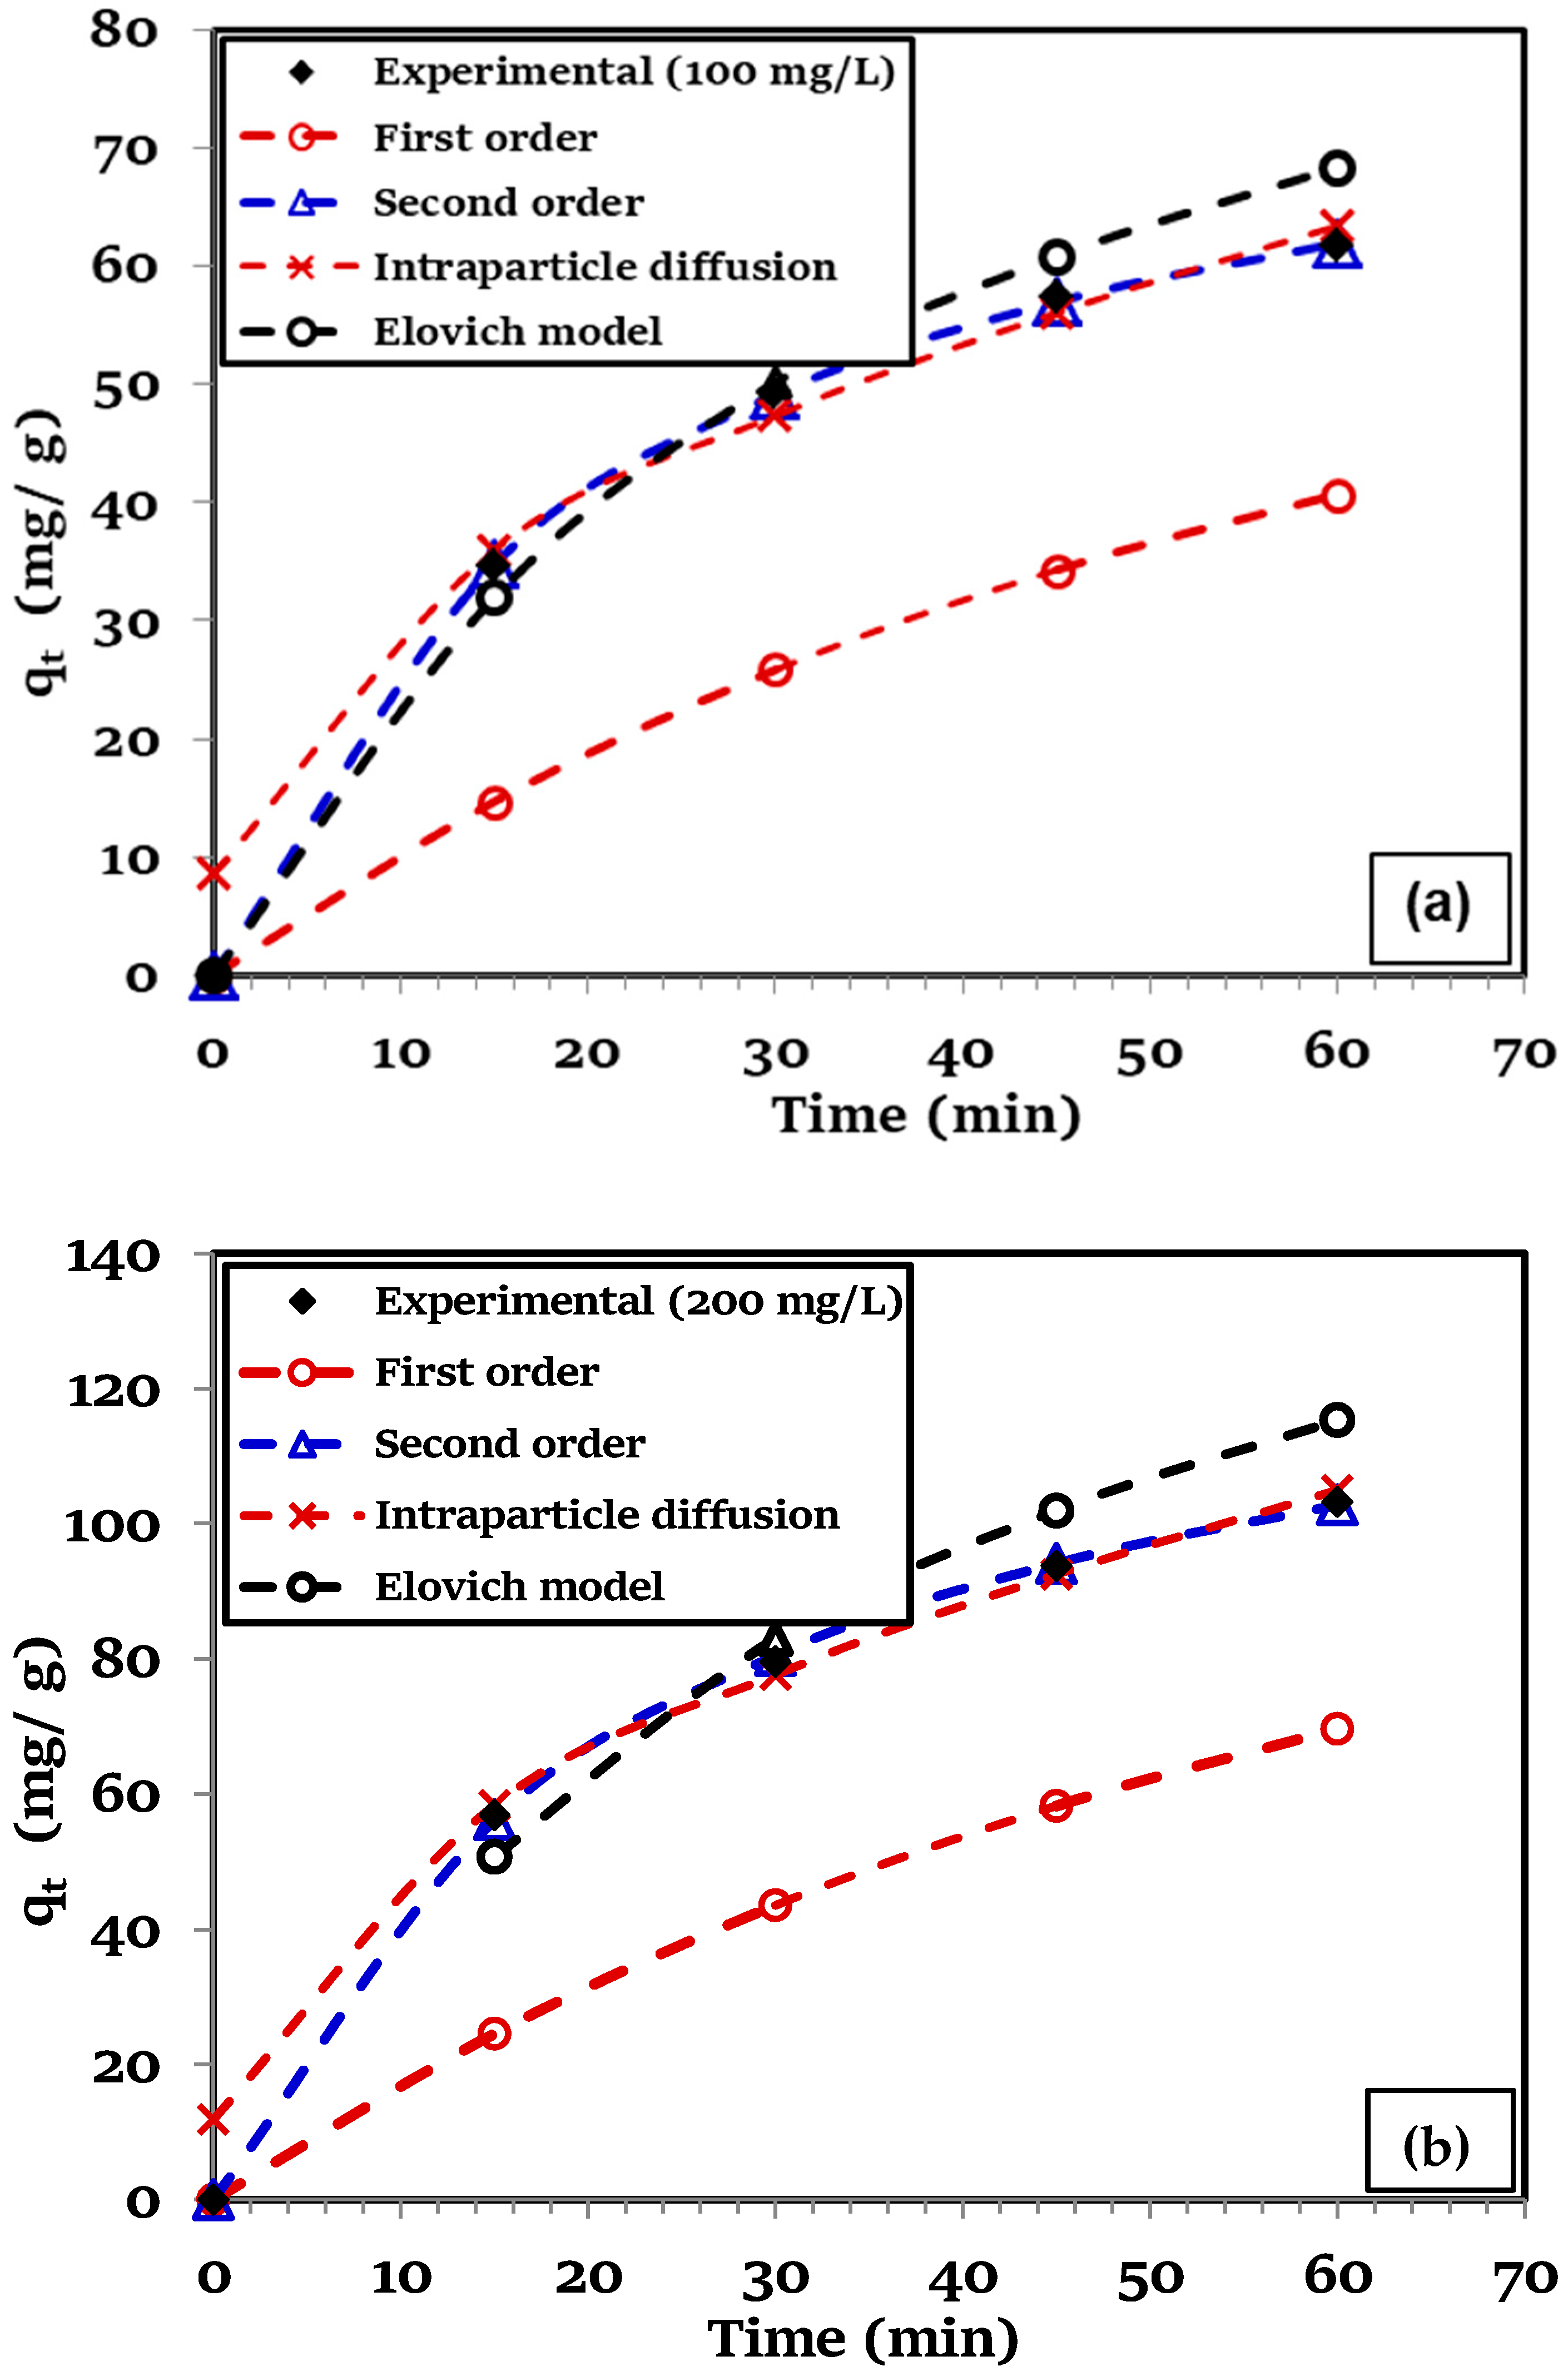
3.5. Biosorption Kinetics

The biosorption kinetics governs the uptake rate of the contaminant from aqueous media and is therefore crucial in determining the residence time for the design of continuous large-scale adsorption reactors. Several models of varied complexity have been proposed to predict the contaminant uptake rate by the adsorbent. However, besides commonly used PFO, PSO models, Elovich and IPD (intraparticle diffusion) models are also used here to explain the biosorption kinetics [46,47]. The PFO kinetic model is mathematically expressed as [48]:
l o g ( q e q t ) = k 1 2.303 t + l o g q e
where the rate constant k1 (1/min) can be evaluated using the slope of time versus l o g ( q e q t ) plot. Another commonly used model, the PSO kinetic model, can be stated as [49],
t q t = 1 q e t + 1 k 2 q e 2
Plotting t versus t/qt yields 1/qe (g/mg) as the slope while the PSO rate constant k2 (g/mg min) can be evaluated from the plot intercept. The rate constants of both kinetic models and their correlation coefficients are presented in Table 2. In addition, qe (exp) are also shown for comparison with corresponding predicted values. The PSO shows better agreement between experimental values and model predictions of qe in the range of initial TCP concentration (C0 = 100–400 mg/L) considered in the present study. The same trend is also seen for the correlation coefficients (R2). This confirms the superiority of the PSO kinetics as compared to the PFO kinetics in predicting the biosorption of TCP using the pine cone.
Elovich equation is also used to model the contaminant uptake rate. Without suggesting any clear mechanism governing the adsorbent and adsorbent interaction, the model uses the assumption that the adsorbent surfaces are energetically heterogeneous. Elovich equation’s linear form can be written as [50],
q t = 1 b ln t + ln ( a b ) b
where the parameter ‘a’ denotes the initial biosorption rate while the parameter ‘b’ (g/mg) is related to the extent of surface coverage and the chemisorption activation energy. The plot of lnt versus qt yields ( 1 / b ) as the slope and ln ( a b ) / b as the intercept. From Table 2, it can be seen that the calculated qe values of Elovich model does not show good agreement with experimental equilibrium values.

3.6. Intraparticle Diffusion Model

This model evaluates the relative significance of the intra-particle diffusion in the mass transport of the solute [51]. According to this model, the time dependence of the concentration of the adsorbate is mathematically described as,
q t = k i d t + C .
where kid is the slope (mg/g.min1/2) of t versus qt plot while the y-intercept C is a thickness of the boundary layer. The computed kid values are shown in Table 2. If Equation (9) yields a linear trend, passing through the origin, then the intraparticle diffusion is the predominant rate limiting step. As seen in Table 2, the intercept ranges from 8 to 40. Therefore, intra-particle diffusion model is not valid in this case. A large intercept shows that the adsorption mainly takes place on the biosorbent surface, and the mass transport is controlled by external mass transport resistance throughout the movement of the solute from the liquid phase to the external surface of the biosorbent.
Figure 6a–d compares the experimental data and model predictions for the TCP concentrations varying from 100 to 400 mg/L. The PFO, PSO, intraparticle diffusion and Elovich kinetic equations are considered in the comparison. It is clear from the figures that the predictions of the PSO kinetic model show an excellent agreement with the experimental data. Clearly, the PFO kinetics fail to provide an adequate description of the biosorption of TCP onto PCP. The results fitted with different kinetic models of TCP adsorption on PCP, their corresponding regression (R2), Chi-square (χ2) and Δq (%) values are listed in Table 2. The value of R2 for the PSO was greater than 0.999, which was much closer to unity than those of the PFO, Elovich, and Weber–Morris models. Using PSO, the calculated (qe,cal) values show excellent fit with the experimental values (qt,exp). This was evident from the Chi-square (χ2) and Δq (%) values, which ranged between 0.01–0.05 for the case of the former and 0.52–1.14% for the case of the latter. Thus, the investigational results indicate that the PSO appears to be a better fit for TCP biosorption on PCP, which is similar to the recent investigations, have shown that the kinetics of TCP adsorption onto other adsorbents also followed PSO kinetic models [21,42,52].

3.7. Biosorption Isotherm Models

The adsorption equilibrium isotherms play a key role in the biosorption system design. It shows the affinity of the biosorbent towards the solute and how the solute ions are dispersed between the liquid solution and the biosorbent surface in equilibrium state. In this study, we focus our attention on four different empirical models.
The Langmuir isotherm equation general form can be expressed as [53],
( 1 q e ) = 1 K L q m ( 1 C e ) + 1 q m
In this equation qe is the solute amount adsorbed per unit biosorbent mass (mg/g), qm is the monolayer biosorption capacity (mg/g), Ce is the equilibrium concentration of the solute in solution (mg/L), and KL (mg/L) is the Langmuir equilibrium constant. Plotting 1/qe versus 1/Ce yields values for both qm and KL.
An important aspect of the Langmuir isotherm is often indicated as a dimensionless parameter, RL, which can be expressed as [54],
R L = 1 1 + K L C 0
RL shows the nature of the biosorption process. For a favorable adsorption process, 0 < RL < 1, unfavorable for RL > 1, linear for RL = 1, and irreversible for RL = 0.
Freundlich isotherm model, correlating heterogeneous surface containing binding sites to their different energies, is given as [55],
q e = K F C e 1 n
where the parameter KF ((mg/g)(L/mg)1/n) represents ‘relative biosorption capacity’ while the parameter (1/n) denotes ‘adsorption intensity’. For values of parameter n greater than unity, sorption is favorable. The linearized form of Equation (10) is:
ln q e = ( 1 n ) ln C e + ln K F
This model accounts for the interactions between the adsorbent and adsorbate molecules [56]. Mathematically, it is represented as:
q e = ( R T b T ) ln ( A C e )
where isotherm parameter A (L/g) is the binding constant that corresponds to the maximum binding energy, R = 8.314 J/mol K is the universal gas constant, T (K) is the temperature and the factor RT/bT (J/mol) is a constant related to heat of sorption.
In order to improve greater insight of the biosorption process, Dubinin–Radushkevich isotherm has also been utilized to model the present equilibrium data [57]. It is represented as,
q e = q s exp ( B ε 2 )
where the parameter B is a measure of the sorption energy, and qs is the D-R monolayer capacity (mg/g). The ε parameter in the above equation is known as Polanyi potential, and is defined by,
ε = R T ln [ 1 + 1 C e ]
Using the parameter ‘B’ in Equation (15), the mean free adsorption energy (E) per adsorbate molecule can be computed as follows,
E = 1 2 B
A plot of ln(qe) versus ε2 will enable the evaluation of isotherm parameter qs and E. The parameter E characterizes the nature of the biosorption process in the present investigation. For biosorption by ion exchange, the value of E usually lies between 8 and 16 kJ/mol, while it is less than 8 kJ/mol for the case of physical adsorption. Correlation coefficients, parameter values, normalized standard deviation (Δq (%)) and Chi-square (χ2) for all four isotherms, i.e., Langmuir, Freundlich, Temkin and D-R are presented in Table 3 for the comparison. The predictions of all the four isotherm models are compared with the experimental data in Figure 7. It is evident that the Langmuir isotherm model shows better agreement with the experimental sorption data as compared to Freundlich, D-R and Temkin isotherm models. For the Langmuir isotherm, higher R2 (0.998), lower Δq (3.84%), and lower Chi-square (χ2) value (0.90) were obtained in the present study.

3.8. 2,4,6-TCP onto Pine Cone Powder (PCP) Biosorption Mechanism

The FTIR graph (Figure 1) reveals the existence of organic functional groups such as hydroxyl (-OH), amino (-NH2) and carboxylic groups (-COOH) on the surface of the biosorbent (PCP). Clearly, the functional groups at PCP shift their positions due to the biosorption of TCP. This can be predictable to the chemical interaction between adsorbate with surface functional groups of biosorbent. Moreover, the kinetic and isotherm experimental data prove that the biosorption of TCP involved chemical interaction and electrostatic interactions between the aqueous phase and biosorption sites.

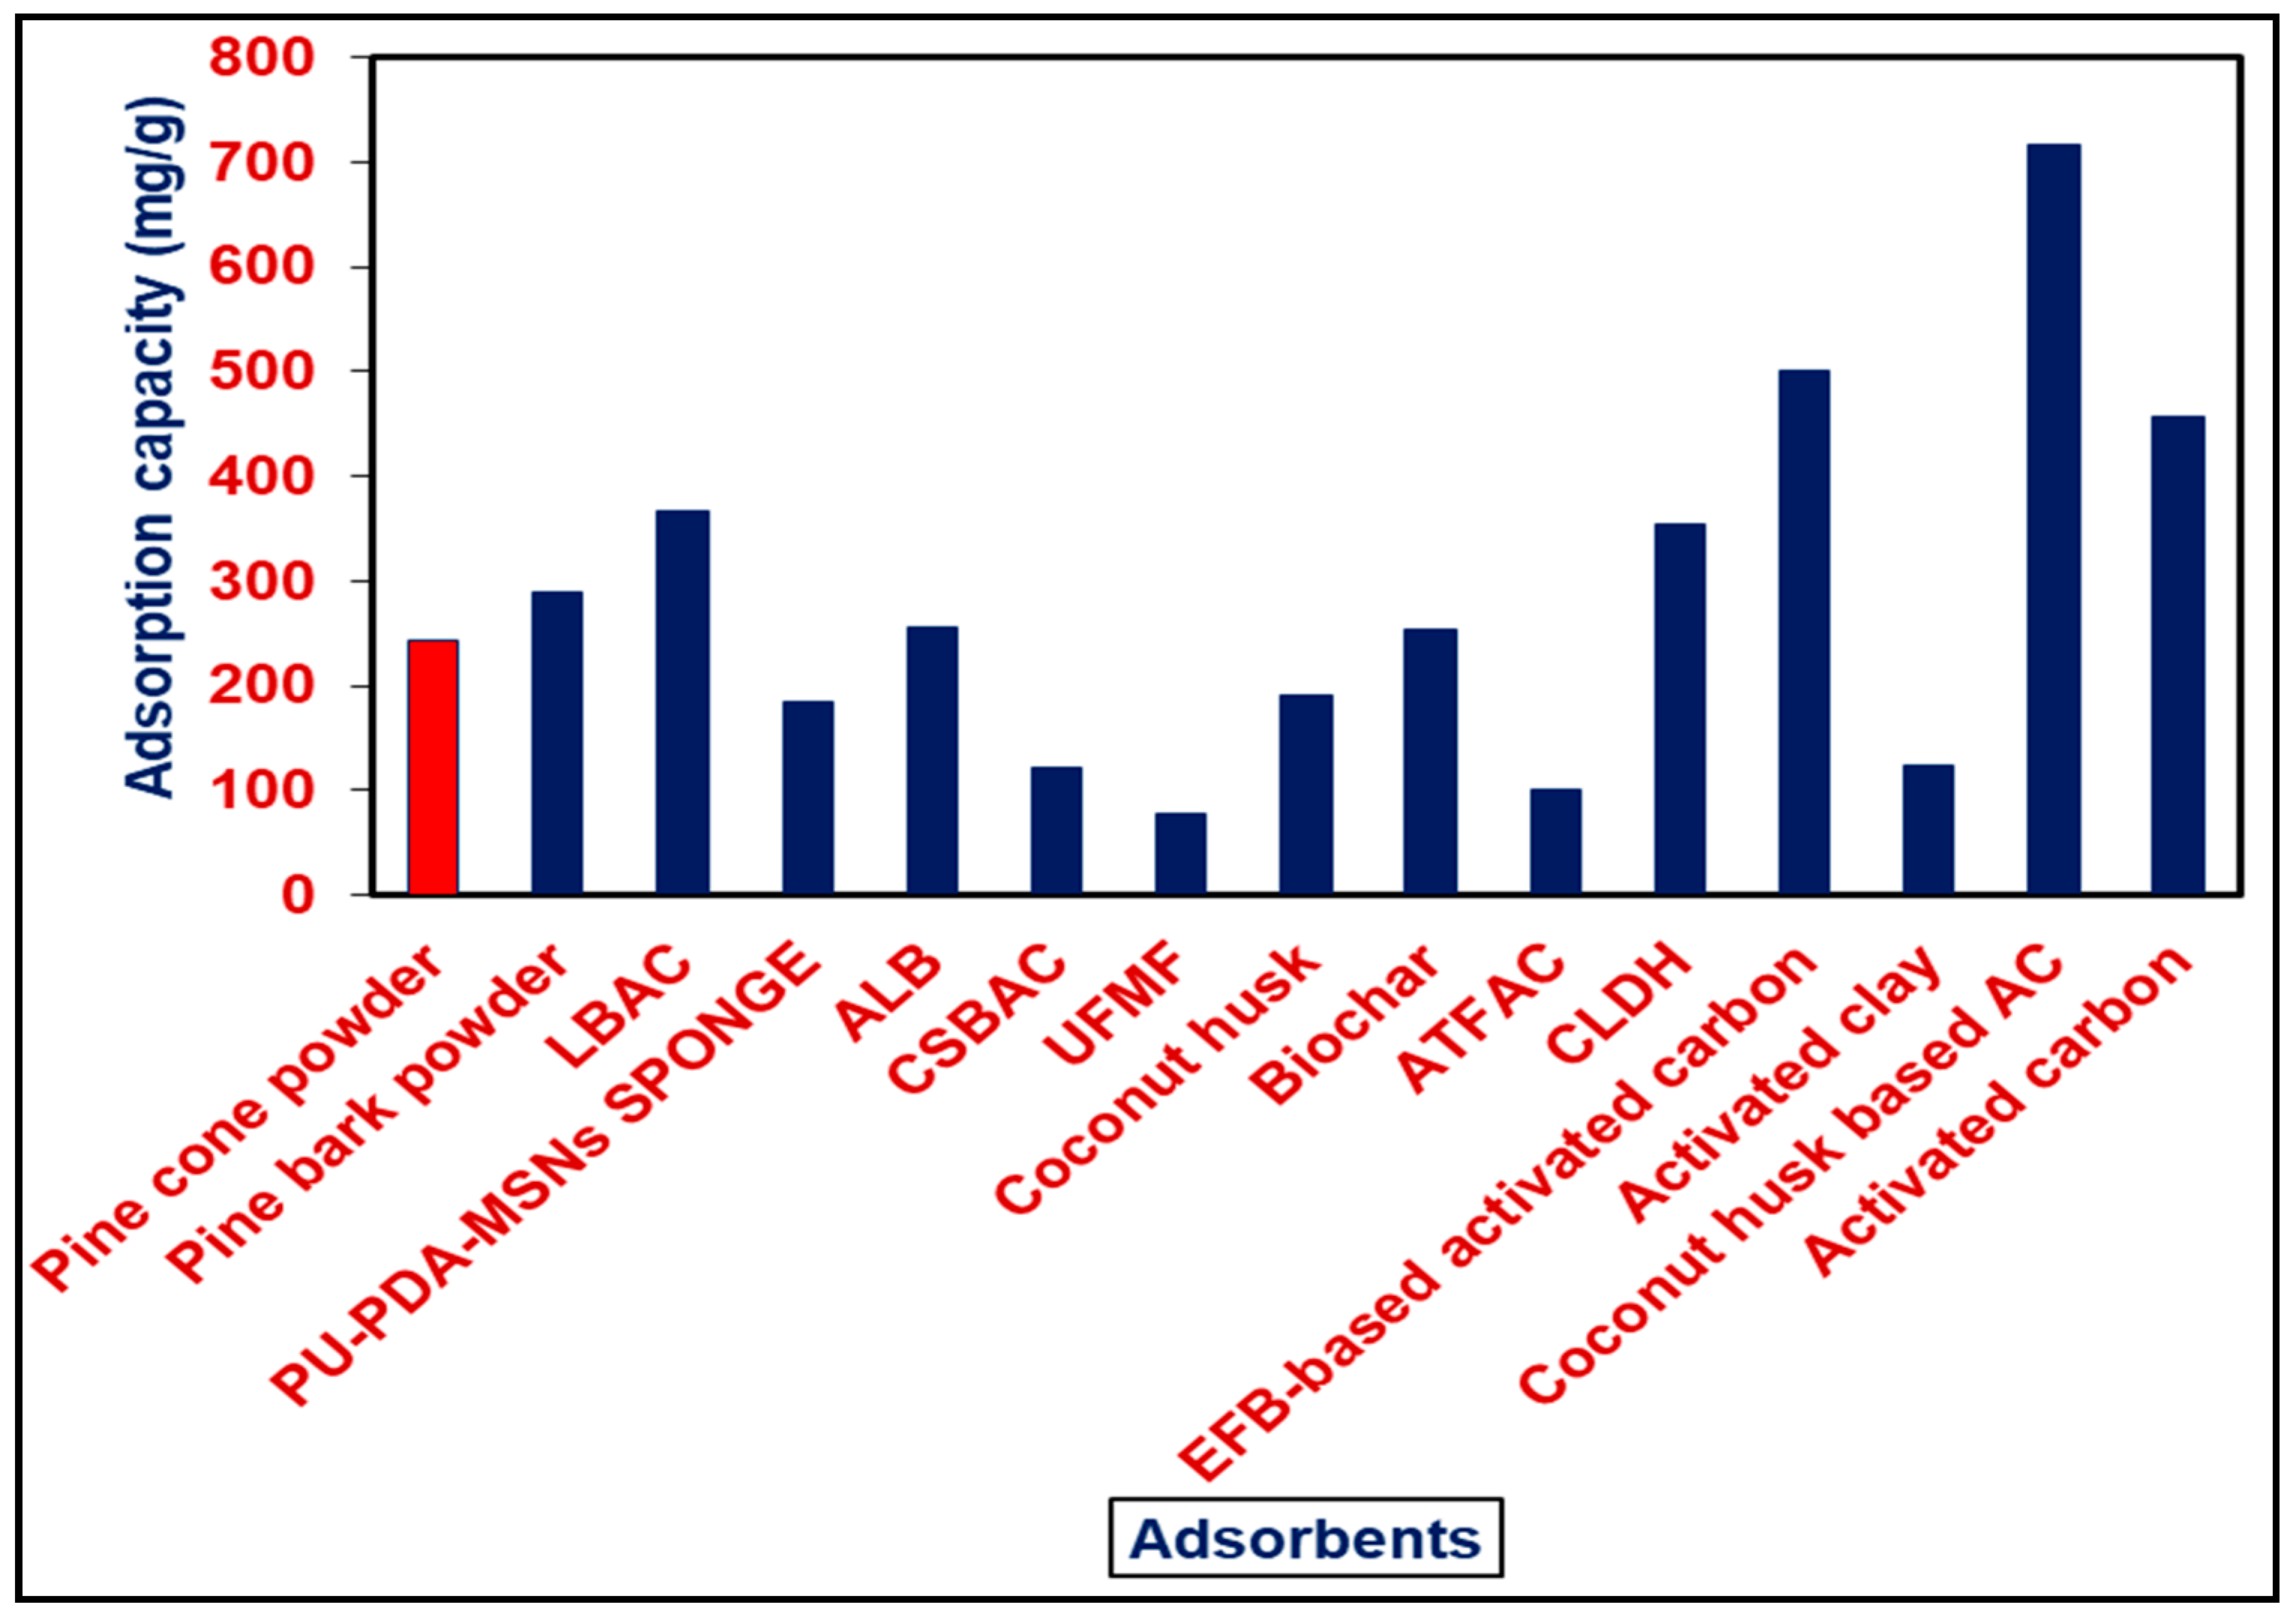
3.9. Comparison of PBP with other Adsorbents

The comparison of the uptake capacities of several adsorbents reported in the literature is made here. Clearly, PCP is a superior adsorbent for the removal of TCP as compared to other reported adsorbents (Figure 8). Its uptake capacity is found to be 243.90 mg/g, which is higher than most of other agro-waste-based adsorbent materials [2,20,37,38,39,40,42,43,45,58,59,60,61]. This clearly establishes the efficacy of the PCP as a cheap, abundant and efficient biosorbent for the removal of TCP from an aqueous medium that do not require regeneration for the cost-effectiveness of the present biosorption-based separation process.

4. Conclusions

We investigated the biosorption of TCP onto PCP, an untreated agro-waste material. The biosorption process was influenced by solution pH, the time of contact, biosorbent dosage, and the initial TCP concentration. Moreover, the biosorption process was fast as the equilibrium was achieved in 75 min of agitation time. The solution pH of 6 was found to be optimal. The removal efficacy of TCP initially improved with an increase in the biosorbent dosage before becoming almost constant when 0.3 g PCP in 100 mL solution was used. With an increase in the PCP dosage however, the adsorption capacity gradually decreased. The second order kinetic model best represents the sorption kinetics. Several isotherm models, e.g., Dubinin–Radushkevich, Freundlich, Langmuir, and Temkin were used to describe the equilibrium data obtained in the present investigation. The maximum uptake biosorption capacity of 243.90 mg/g at 30 ± 1 °C was predicted by the Langmuir model. Clearly, the PCP can be used as a cost-effective, eco-friendly and easily available biosorbent for the removal of high concentrations of TCP from contaminated wastewater.

Author Contributions

N.S.K. performed all the experiments and characterization tests as well as wrote the manuscript; A.M.P., M.S. and M.I.A.-H. carried out the literature review and proofread; M.A. and N.S.K. analyzed the data, finalized the paper and N.S.K. was the main corresponding author during the review process.

Funding

The Researchers Supporting Project at King Saud University Project No (RSP-2019/42).

Acknowledgments

The King Saud University authors would like to thank the Researchers Supporting Project, RSP-2019/42, King Saud University, Riyadh, Saudi Arabia for the financial support.

Conflicts of Interest

The author declares that there is no conflict of interest regarding this publication.

References

  1. Achard, C.; Jaoui, M.; Schwing, M.; Rogalski, M. Aqueous solubilities of phenol derivatives by conductivity measurements. J. Chem. Eng. Data 1996, 41, 504–507. [Google Scholar] [CrossRef]
  2. Kumar, N.S.; Woo, H.S.; Min, K. Equilibrium and kinetic studies on biosorption of 2,4,6-trichlorophenol from aqueous solutions by Acacia leucocephala bark. Colloids Surf. B Biointerfaces 2012, 94, 125–132. [Google Scholar] [CrossRef] [PubMed]
  3. Chen, M.; Tang, R.; Fu, G.; Xu, B.; Zhu, P.; Qiao, S.; Chen, X.; Xu, B.; Qin, Y.; Lu, C. Association of exposure to phenols and idiopathic male infertility. J. Hazard. Mater. 2013, 250, 115–121. [Google Scholar] [CrossRef] [PubMed]
  4. Zhong, W.; Wang, D.; Xu, X. Phenol removal efficiencies of sewage treatment processes and ecological risks associated with phenols in effluents. J. Hazard. Mater. 2012, 217, 286–292. [Google Scholar] [CrossRef] [PubMed]
  5. Zgola-Grzeskowiak, A.; Grzeskowiak, T.; Rydlichowski, R.; Lukaszewski, Z. Determination of nonylphenol and short-chained nonylphenol ethoxylates in drain water from an agricultural area. Chemosphere 2009, 75, 513–518. [Google Scholar] [CrossRef] [PubMed]
  6. Michalowicz, J.; Duda, W. Phenols-sources and toxicity. Pol. J. Environ. Stud. 2007, 16, 347–362. [Google Scholar]
  7. Marianna, C. Sources and transformations of chlorophenols in the natural environment. Sci. Total Environ. 2004, 322, 21–39. [Google Scholar]
  8. Agency for Toxic Substances and Disease Registry (ATSDR). Toxicological Profile for 2,4,6-Trichlorophenol; U.S. Public Health Service, U.S. Department of Health and Human Services: Atlanta, GA, USA, 1990.
  9. Kurian, M.; Babu, R. Iron aluminium mixed pillared montmorillonite and the rare earth exchanged analogues as efficient catalysts for phenol oxidation. J. Environ. Chem. Eng. 2013, 1, 86–91. [Google Scholar] [CrossRef]
  10. McAllister, K.A.; Lee, H.; Trevors, J.T. Microbial degradation of pentachlorophenol. Biodegradation 1996, 7, 1–40. [Google Scholar] [CrossRef]
  11. Oh, C.G.; Ahn, J.H.; Ihm, S.K. Adsorptive removal of phenolic compounds by using hypercrosslinked polystyrenic beads with bimodal pore size distribution. Reac. Funct. Polym. 2003, 57, 103–111. [Google Scholar] [CrossRef]
  12. Kumar, N.S.; Subbaiah, M.V.; Reddy, A.S.; Krishnaiah, A. Biosorption of phenolic compounds from aqueous solutions onto chitosan–abrus precatorius blended beads. J. Chem. Tech. Biotechnol. 2009, 84, 972–981. [Google Scholar] [CrossRef]
  13. Rama Rao, K.; Sahu, J.N.; Jayakumar, N.S. Optimal isotherm parameters for phenol adsorption from aqueous solutions onto coconut shell based activated carbon: Error analysis of linear and non-linear methods. J. Taiwan Inst. Chem. Eng. 2017, 80, 472–487. [Google Scholar]
  14. Siva Kumar, N.; Boddu, V.M.; Krishnaiah, A. Biosorption of phenolic compounds by Trametes versicolor polyporus fungus. Adsorpt. Sci. Technol. 2009, 27, 31–46. [Google Scholar] [CrossRef]
  15. Garbaa, Z.N.; Rahima, A.A. Evaluation of optimal activated carbon from an agricultural waste for the removal of para-chlorophenol and 2,4-dichlorophenol. Process Saf. Environ. Prot. 2016, 102, 54–63. [Google Scholar] [CrossRef]
  16. Lingamdinne, L.P.; Koduru, J.R.; Jyothi, R.K.; Chang, Y.Y.; Yang, J.K. Factors affect on bioremediation of Co (II) and Pb (II) onto Lonicera japonica flowers powder. Desalin. Water Treat. 2016, 57, 13066–13080. [Google Scholar] [CrossRef]
  17. Suguna, M.; Siva Kumar, N. Equilibrium, kinetic and thermodynamic studies on biosorption of lead (II) and cadmium (II) from aqueous solution by polypores biomass. Indian J. Chem. Technol. 2013, 20, 57–69. [Google Scholar]
  18. Nadavala, S.K.; Che Man, H.; Woo, H.S. Biosorption of phenolic compounds from aqueous solutions using pine (Pinus densiflora Sieb) bark powder. BioResources 2014, 9, 5155–5174. [Google Scholar] [CrossRef]
  19. Yildiz, D.; Keskin, F.; Demirak, A. Biosorption of 2,4 Dichlorophenol onto Turkish Sweetgum bark in a batch system: Equilibrium and kinetic study. Acta Chim. Slov. 2017, 64, 237–247. [Google Scholar] [CrossRef]
  20. Siva, K.N.; Asif, M.; Al-Hazzaa, M.I.; Ibrahim, A.A. Biosorption of 2,4,6-trichlorophenol from aqueous medium using agro-waste: Pine (Pinus densiflora Sieb) bark powder. Acta Chim. Slov. 2018, 65, 221–230. [Google Scholar] [CrossRef]
  21. Kusmierek, K.; Swiatkowski, A.; Dabek, L. Removal of 2,4,6-trichlorophenol from aqueous solutions using agricultural waste as low-cost adsorbents. Environ. Prot. Eng. 2017, 43, 149–163. [Google Scholar]
  22. Ucun, H.; Bayhan, Y.K.; Kaya, Y.; Cakici, A.; Algur, O.F. Biosorption of lead (II) from aqueous solution by cone biomass of Pinus sylvestris. Desalination 2003, 154, 233–238. [Google Scholar] [CrossRef]
  23. Niyaz, M.M.; Hayati, B.; Arami, M.; Lan, C. Adsorption of textile dyes on Pine Cone from colored wastewater: Kinetic, equilibrium and thermodynamic studies. Desalination 2011, 268, 117–125. [Google Scholar]
  24. Ofomaja, A.E.; Naidoo, E.B. Biosorption of lead (II) onto pine cone powder: Studies on biosorption performance and process design to minimize biosorbent mass. Carbohydr. Polym. 2010, 82, 1031–1042. [Google Scholar] [CrossRef]
  25. Ofomaja, A.E.; Naidoo, E.B.; Modise, S.J. Removal of copper (II) from aqueous solution by pine and base modified pine cone powder as biosorbent. J. Hazard. Mater. 2009, 168, 909–917. [Google Scholar] [CrossRef]
  26. Ofomaja, A.E.; Naidoo, E.B.; Modise, S.J. Biosorption of copper (II) and lead (II) onto potassium hydroxide treated pine cone powder. J. Environ. Manag. 2010, 91, 1674–1685. [Google Scholar] [CrossRef]
  27. Ofomaja, A.E.; Pholosi, A.; Naidoo, E.B. Application of raw and modified pine biomass material for cesium removal from aqueous solution. Ecol. Eng. 2015, 82, 258–266. [Google Scholar] [CrossRef]
  28. Ofomaja, A.E.; Pholosi, A.; Naidoo, E.B. Kinetics and competitive modeling of cesium biosortion onto chemically modified pine cone powder. J. Taiwan Inst. Chem. Eng. 2013, 44, 943–951. [Google Scholar] [CrossRef]
  29. Kumar, N.S.; Asif, M.; Al-Hazzaa, M.I. Adsorptive removal of phenolic compounds from aqueous solutions using pine cone biomass: Kinetics and equilibrium studies. Environ. Sci. Pollut. Res. 2018, 25, 21949–21960. [Google Scholar] [CrossRef]
  30. Nassar, N.N.; Arar, L.A.; Marei, N.N.; Abu Ghanim, M.M.; Dwekat, M.S.; Sawalha, S.H. Treatment of olive mill based wastewater by means of magnetic nanoparticles: Decolourization, dephenolization and COD removal. Environ Nanotechnol. Monit. Manag. 2014, 1–2, 14–23. [Google Scholar] [CrossRef]
  31. Jayaramudu, J.; Guduri, B.R.; Varada, R.A. Characterization of new natural cellulosic fabric Grewia tilifolia. Carbohydr. Polym. 2010, 79, 847–855. [Google Scholar] [CrossRef]
  32. Mas Haris, M.R.H.; Sathasivam, K. The removal of methyl red from aqueous solutions using banana pseudo stem fibers. Am. J. Appl. Sci. 2009, 6, 1690–1700. [Google Scholar]
  33. Malkoc, E. Ni (II) removal from aqueous solutions using cone biomass of Thujaorientalis. J. Hazard. Mater. 2006, 137, 899–908. [Google Scholar] [CrossRef] [PubMed]
  34. Barka, N.; Abdennouri, M.; El Makhfouk, M.; Qourzal, S. Biosorption characteristics of cadmium and lead onto eco-friendly dried cactus (Opuntia ficusindica) Cladodes. J. Environ. Chem. Eng. 2013, 1, 144–149. [Google Scholar] [CrossRef]
  35. Hamdaoui, O.; Naffrechoux, E. Modeling of adsorption isotherms of phenol and chlorophenols onto granular activated carbon: Part I. Two-parameter models and equations allowing determination of thermodynamic parameters. J. Hazard. Mater. 2007, 147, 381–394. [Google Scholar] [CrossRef] [PubMed]
  36. Rengaraj, S.; Moon, S.H.; Sivabalan, R.; Arabindoo, B.; Murugesan, V. Agricultural solid waste for the removal of organics: Adsorption of phenol from water and wastewater by palm seed coat activated carbon. Waste Manag. 2002, 22, 543–548. [Google Scholar] [CrossRef]
  37. Hameed, B.H. Equilibrium and kinetics studies of 2,4,6-trichlorophenol adsorption onto activated clay. Coll. Surf. A Physicochem. Eng. Asp. 2007, 307, 45–52. [Google Scholar] [CrossRef]
  38. Hameed, B.H.; Tan, I.A.W.; Ahmad, A.L. Adsorption isotherm, kinetic modeling and mechanism of 2,4,6-trichlorophenol on coconut husk-based activated carbon. Chem. Eng. J. 2008, 144, 235–244. [Google Scholar] [CrossRef]
  39. Tan, I.A.W.; Ahmad, A.L.; Hameed, B.H. Adsorption isotherms, kinetics, thermodynamics and desorption studies of 2,4,6-trichlorophenol on oil palm empty fruit bunch-based activated carbon. J. Hazard. Mater. 2009, 164, 473–482. [Google Scholar] [CrossRef]
  40. Radhika, M.; Palanivelu, K. Adsorptive removal of chlorophenols from aqueous solution by low cost adsorbent—Kinetics and isotherm analysis. J. Hazard. Mater. 2006, 138, 116–124. [Google Scholar] [CrossRef]
  41. Chakravarty, P.; Sarma, N.S.; Sarma, H.P. Removal of lead (II) from aqueous solution using heartwood of Areca catechu powder. Desalination 2010, 256, 16–21. [Google Scholar] [CrossRef]
  42. Zhang, D.; Zhao, G.; Yu, J.; Yan, T.; Zhu, M.; Jiao, F. Thermodynamic and kinetic studies of effective adsorption of 2,4,6-trichlorophenol onto calcine Mg/Al-CO3 layered double hydroxide. J. Wuhan Univ. Technol. Mater Sci. Ed. 2016, 31, 1211–1218. [Google Scholar] [CrossRef]
  43. Liu, S.; Pan, J.; Cao, J.; Dai, X.; Meng, M.; Wu, R.; Yao, J.; Yan, Y. Simultaneous removal of Pb (II) and 2,4,6-trichlorophenol by a hierarchical porous PU@PDA@MSNs sponge with reversible “shape memory” effect. Chem. Eng. J. 2016, 284, 10–20. [Google Scholar] [CrossRef]
  44. Denizli, A.; Cihangir, N.; Tuzmen, N.; Alsancak, G. Removal of chlorophenols from aquatic systems using the dried and dead fungus Pleurotus sajor caju. Bioresour. Technol. 2005, 96, 59–62. [Google Scholar] [CrossRef] [PubMed]
  45. Tan, I.A.W.; Ahmad, A.L.; Hameed, B.H. Preparation of activated carbon from coconut husk: Optimization study on removal of 2,4,6-trichlorophenol using response surface methodology. J. Hazard. Mater. 2008, 153, 709–717. [Google Scholar] [CrossRef] [PubMed]
  46. Aziz, A.S.A.; Manaf, L.A.; Man, H.C.; Kumar, N.S. Equilibrium studies and dynamic behavior of cadmium adsorption by palm oil boiler mill fly ash (POFA) as a natural low-cost adsorbent. Desalin. Water Treat. 2015, 54, 1956–1968. [Google Scholar] [CrossRef]
  47. Lagergren, S.Y. Zur Theorie der sogenannten adsorption geloster stoffe, Kungliga Svenska Vetenskapsakademiens. Handlingar 1898, 24, 1–39. [Google Scholar]
  48. Fakhri, A.; Rashidi, S.; Asif, M.; Ibrahim, A. Microwave-assisted synthesis of SiC Nanoparticles for the efficient adsorptive removal of Nitroimidazole Antibiotics from aqueous solution. Appl. Sci. 2017, 7, 205. [Google Scholar] [CrossRef]
  49. Ho, Y.S.; McKay, G. Pseudo-second order model for sorption processes. Process Biochem. 1999, 34, 451–465. [Google Scholar] [CrossRef]
  50. Suguna, M.; Kumar, N.S.; Sreenivasulu, V.; Krishnaiah, A. Removal of Pb (II) from aqueous solutions by using Chitosan coated Zero Valent Iron Nanoparticles. Sep. Sci. Technol. 2014, 49, 1613–1622. [Google Scholar] [CrossRef]
  51. Weber, W.J.; Morris, J.C. Kinetics of adsorption on carbon from solution. J. Sanit. Eng. Div. 1963, 89, 31–60. [Google Scholar]
  52. Olu-Owolabi, B.I.; Alabi, A.H.; Diagboya, P.N.; Unuabonah, E.I.; During, R.A. Adsorptive removal of 2,4,6-trichlorophenol in aqueous solution using calcined kaolinite-biomass composites. J. Environ. Manag. 2017, 192, 94–99. [Google Scholar] [CrossRef] [PubMed]
  53. Fakhri, A.; Rashidi, S.; Asif, M.; Ibrahim, A. Synthesis and characterization of MnS2/reduced graphene oxide nanohybrid: An efficient adsorbent for pharmaceutical compound removal. Desalin. Water Treat. 2017, 68, 236–244. [Google Scholar] [CrossRef]
  54. Siva Kumar, N.; Subba Reddy, A.; Boddu, V.M.; Krishnaiah, A. Development of chitosan-alginate based biosorbent for the removal of p-chlorophenol from aqueous medium. Toxicol. Environ. Chem. 2009, 91, 1035–1054. [Google Scholar] [CrossRef]
  55. Freundlich, H.; Heller, W. The Adsorption of cis- and trans-azobenzene. J. Am. Chem. Soc. 1939, 61, 2228–2230. [Google Scholar] [CrossRef]
  56. Temkin, M.J.; Pyzhev, V. Kinetics of the synthesis of ammonia on promoted iron catalysts. J. Phys. Chem. USSR 1939, 13, 851–867. [Google Scholar]
  57. Dubinin, M.M.; Radushkevich, L.V. The equation of the characteristic curve of the activated charcoal. Proc. Acad. Sci. USSR Phys. Chem. Sec. 1947, 55, 331–337. [Google Scholar]
  58. Fan, J.; Zhang, J.; Zhang, C.; Ren, L.; Shi, Q. Adsorption of 2,4,6-trichlorophenol from aqueous solution onto activated carbon derived from loosestrife. Desalination 2011, 267, 139–146. [Google Scholar] [CrossRef]
  59. Pan, J.; Luo, J.; Cao, J.; Liu, J.; Huang, W.; Zhang, W.; Yang, L. Competitive adsorption of three phenolic compounds to hydrophilic urea-formaldehyde macroporous foams derived from lignin-based Pickering HIPEs template. RSC Adv. 2016, 6, 93894–93904. [Google Scholar] [CrossRef]
  60. Mubarik, S.; Saeed, A.; Athar, M.M.; Iqbal, M. Characterization and mechanism of the adsorptive removal of 2,4,6-trichlorophenol by biochar prepared from sugarcane baggase. J. Ind. Eng. Chem. 2016, 33, 115–121. [Google Scholar] [CrossRef]
  61. Krishnaiah, D.; Anisuzzaman, S.M.; Bono, A.; Sarbatly, R. Adsorption of 2,4,6-trichlorophenol (TCP) onto activated carbon. J. King Saud Univ. Sci. 2013, 25, 251–255. [Google Scholar] [CrossRef]
Figure 1. FTIR spectrum of (a) native PCP and (b) 2,4,6-trichlorophenol (TCP) loaded PCP.
Processes 07 00757 g001
Figure 2. SEM of the PCP at (a) 500× and (b) 1000× magnification.
Processes 07 00757 g002
Figure 3. Dependence of TCP biosorption on solution pH at 30 ± 1 °C (C0 = 100 mg/L, Contact time = 2 h, Biosorbent dosage = 0.1 g, Agitation rate = 200 rpm. The error bars are SD of triplicate runs.
Processes 07 00757 g003
Figure 4. Dependence of TCP biosorption on the adsorbent dosage level at 30 ± 1 °C (C0 = 100 mg/L, Biosorbent dosage = 0.05–0.8 g, Contact time = 3 h, pH = 6.0. The error bars are SD of triplicate runs.
Processes 07 00757 g004
Figure 5. Dependence of TCP biosorpion on the contact time at 30 ± 1 °C [(■) C0 = 100 mg/L, (●) C0 = 200 mg/L, (▲) C0 = 300 mg/L, (▼) C0 = 400 mg/L; Biosorbent dosage = 0.1 g; Contact time = 2 h, Agitation rate = 200 rpm; pH = 6.0]. The error bars are SD of triplicate runs.
Processes 07 00757 g005
Figure 6. Comparison of experimental and calculated values obtained from the PFO, PSO, intraparticle diffusion and Elovich kinetic models (ad).
Processes 07 00757 g006aProcesses 07 00757 g006b
Figure 7. Comparison of experimental and theoretical adsorption parameter values obtained from the Langmuir, Freundlich, D-R and Temkin isotherm models.
Processes 07 00757 g007
Figure 8. Comparison of maximum monolayer uptake capacities of various adsorbents for TCP.
Processes 07 00757 g008
Table 1. Native pine cone powder (PCP) biosorbent characterization.
PropertyValue
ColorBrown
Carbon (%)76.58
Hydrogen (%)4.84
Nitrogen (%)6.52
OdorNone
Weight loss (%)48.8
Apparent (bulk) density (g/cm3)0.42
Moisture content (%)3.14
Pore diameter (A0)15.73
Ash content (%)4.89
BET surface area (m2/g)7.108
Table 2. Kinetic rate constants for biosorption of TCP onto PCP. The error bars represent mean ± SD of each triplicate value.
ParameterInitial Concentration of TCP (mg/L)
100200300400
Pseudo-first-order-kinetic model
q(e, exp) (mg/g)82.69 ± 0.35143.20 ± 3.71194.84 ± 1.51230.83 ± 0.16
q(e, cal) (mg/g)60.80 ± 0.89108.80 ± 5.66133.25 ± 1.84159.22 ± 0.54
k1 (1/min)0.018 ± 0.00040.017 ± 0.00040.018 ± 0.00010.019 ± 0.001
R20.98120.99270.98150.9945
Δqt (%)52.6850.8959.6457.44
χ274.21110.23270.71292.10
Pseudo-second-order-kinetic model
q(e, cal) (mg/g)83.80 ± 1.06142.28 ± 4.58191.09 ± 2.09232.64 ± 5.41
k2 (g/mg/min)0.00056 ± 2.85 × 10−50.00030 ± 3.83 × 10−50.00030 ± 4.91 × 10−60.00024 ± 9.22 × 10⁻⁶
R20.99940.99920.99980.9994
Δqt (%)0.521.020.541.14
χ20.010.020.010.05
Elovich equation
q(e, cal) (mg/g)100.01 ± 3.45170.88 ± 12.30203.64 ± 1.32244.16 ± 4.31
(1/b) ln(ab) (mg/g)18.79 ± 1.5933.84 ± 5.6526.72 ± 0.9931.09 ± 1.03
1/b (mg/g)19.83 ± 0.4533.47 ± 1.6243.21 ± 0.0952.03 ± 0.80
R20.99630.99930.99430.9999
Δqt (%)8.3810.807.556.72
χ21.072.822.142.04
Weber–Morris
q(e, cal) (mg/g)63.43 ± 0.33105.01 ± 1.09152.38 ± 0.83184.73 ± 2.26
kid7.07 ± 0.1512.01 ± 0.5815.42 ± 0.0618.65 ± 0.27
C8.56 ± 0.9211.87 ± 3.4332.80 ± 0.6340.13 ± 0.14
R20.97580.99070.97490.9885
Δqt (%)47.4949.5840.3540.23
χ286.34183.30111.66136.66
Table 3. Isotherm Parameters for biosorption of TCP onto PCP.
IsothermsConstantsR2Δqe (%)χ2
Langmuirqm (mg/g)b (L/mg)
243.900.0090.99893.840.90
FreundlichKF ((mg/g) (L/mg)1/n)n
3.2291.2450.99315.621.98
D-R modelqs (mg/g)E (kJ/mol)
8.22 × 10−38.280.99653.951.09
TemkinA (L/g)bT
0.1665.780.945132.21112.34

