Abstract
Fire prevention and extinguishing and CO2 sequestration in coal mine gob require continuous transportation of liquid CO2 in pipelines with large height difference (from ground to underground). However, the temperature and pressure variation of liquid CO2 in pipelines with large height difference is still unclear, which hinders the design of a liquid CO2 pipeline transportation system. The influence of pipe diameter and inlet parameters (temperature and pressure) on the variation of temperature and pressure of liquid CO2 along the 1000 m vertical pipeline was studied in this paper. The study found that for each pipeline diameter considered there existed a range of flowrates where safe flow conditions could be ensured, at which no phase transition occurs throughout the length of the pipeline. When the transporting flow is larger than the maximum limit flow, phase transition occurs dramatically, which will lead to a sudden drop in temperature and pressure. When the transporting flow rate is lower than the minimum limit flow rate, phase transition of CO2 occurs slowly along the pipeline. According to the requirement of underground fire prevention and extinguishing for transporting flow rate and the economic cost of the pipeline system, the optimum diameter is 32 mm, and the corresponding safe transporting flow range is 507–13,826 kg/h. In addition, when the inlet pressure is constant, if the inlet temperature is too high, phase transition of CO2 occurs dramatically at the entrance. For a 1000 m vertical pipe with diameter of 32 mm, when the inlet pressure is 14 bar, 16 bar, 18 bar, 20 bar, 22 bar, 24 bar, the corresponding maximum allowable inlet temperatures are −30 °C, −26 °C, −23 °C, −19 °C, −16 °C and −13 °C, respectively. This research has significant guidance for safety transportation scheme of liquid CO2 from coal mine surface to underground.
1. Introduction
Coal can produce heat by compound reaction with oxygen (physical adsorption, chemical adsorption and chemical reaction), and when the heat cannot be dissipated to the surrounding environment in time, the accumulation of heat will lead to the continuous increase of coal temperature and cause it to reach the ignition point. This phenomenon is called spontaneous combustion of coal [1,2,3,4]. The spontaneous combustion of coal is one of the main hazards faced by coal mines. It mainly occurs in the gob of underground mine with the generation of toxic flammable gases, which can cause gas and coal dust explosion. Thus, the spontaneous combustion of coal seriously threatens the safety of coal mining [5,6].
Liquid CO2 injection is a popular method of fire prevention and extinguishing, because a large amount of thermal energy is absorbed during gasification of liquid CO2, which can significantly reduce the temperature of the fire area, while the gaseous CO2 can also inert the area to stifle the fire source [7,8,9,10,11]. At present, two main methods are used for injection of liquid CO2 into gob. One is to transport small storage cylinder containing liquid CO2 from the ground to the vicinity of underground gob, and then to inject CO2 into the fire prevention and extinguishing area [12]; the other is to drill holes from the ground to the underground gob and directly inject liquid CO2 through drilling holes [13]. The first method is complicated in process and cannot continuously inject CO2 into the gob for a long time and large flow rate, so the effect of fire prevention and extinguishing is poor. The second method can inject CO2 with large flow rate, but it can only inject liquid CO2 directionally into the fixed position of the single gob, so this method is mainly used after ignition and when the location of the ignition source is clear, and it is not suitable for deep mines. Therefore, in order to realize real-time high-flow injection of liquid CO2 into the whole gob with different mining depths and improve the efficiency of fire prevention and extinguishing, it is necessary to construct a liquid CO2 pipeline transportation system with large height difference from ground to underground.
Moreover, the construction of a pipeline transportation system of liquid CO2 is also the prerequisite for fully utilizing the gob for storage and mineralization of CO2. Controlling the emissions of CO2 is the key to solving the problem of global warming [14,15]. The gob formed after coal mining, especially the old deep gob, has good gas tightness and CO2 adsorption capacity, which provides an important method for low-cost underground storage of CO2. There are about 7000 coal mines with a large number of gobs in China, and there is a good prospect for sequestering CO2 in the gob. At present, many scholars are developing new materials to inject into gob, which cannot only prevent and extinguish fire, but also mineralize a large amount of CO2 to realize CO2 sequestration [16,17,18,19,20,21,22]. However, the precondition to achieve a large amount of CO2 sequestration in gob is to transport CO2 to gob in large quantities. The distance from the surface to the underground gob is about 1–5 km. Previous studies have shown that the cost of transporting liquid CO2 is the lowest compared with transporting gaseous CO2 and supercritical CO2 in this distance range [23]. Therefore, in order to make full use of the large amount of CO2 storage in gob, it is also necessary to construct a liquid CO2 pipeline transportation system from ground to underground.
At present, many sets of CO2 pipeline transportation systems have been constructed worldwide to inject CO2 into underground for CO2 enhanced oil recovery (EOR) or enhanced coal bed methane production (ECBM). For example, a Bravo CO2 long-distance pipeline for carbon capture and storage (CCS)-EOR was constructed between New Mexico and Texas, with a diameter of 0.51 m (20″) and a length of 351 km [24,25]. The Weyburn CO2 monitoring and storage project in Canada has established a pipeline for transporting supercritical CO2 from Great Plains Coal Gasification Plant to Weyburn with a diameter of 305–356 mm and a length of 328 km [25,26]. The Sleipner project in Norway established a CO2 pipeline with an annual capacity of about 1 million tons and a length of 4 km to transport CO2 to saltwater reservoirs 800–1000 m below the North Sea [27,28]. However, these pipeline systems are mainly used to transport supercritical CO2 and research on liquid CO2 pipeline transportation systems, especially for a large height difference pipeline transportation system, is scarce.
When building a pipeline transportation system for CO2, it is necessary to first grasp the law of temperature and pressure variation of CO2 in the pipeline. Figure 1 is the phase diagram of CO2, and it can be seen that the phase of CO2 depends on both temperature and pressure. Only when the temperature and pressure are controlled in the area shown in the shadow of the Figure 1 can CO2 remain liquid phase. During the transportation process, the temperature and pressure are in a dynamic change, and CO2 is prone to gasification. Liquid CO2 gasification will cause severe vibration of the pipeline and absorb a large amount of heat rapidly, which will affect the mechanical properties of the pipeline and easy to form dry ice particles in the pipe to influence the normal transportation of the pipeline. At the same time, high-pressure bubbles in two-phase flow can easily damage pumps and other equipment, leading to paralysis of the transportation system. Zhang et al. [23] found that gasification occurs easily in the transportation of liquid or supercritical CO2, resulting in a large pressure drop or even blocking. Teh et al. [29] studied the effects of burial and ambient temperature on liquid and supercritical CO2 pipelines and found that in order to avoid phase transformation during transportation, pumps/compressors are needed in the transportation pipeline system. For coal mines, the mining depth is generally 200–1000 m. To build a liquid CO2 pipeline transportation system from the ground to the underground, a large height difference needs to be taken into account. Therefore, it is necessary to study the temperature and pressure changes of liquid CO2 in a larger-height differential pipeline transportation system, and the measures to prevent gasification in the process. It is difficult to adjust the temperature and pressure of CO2 in vertical roadway of coal mine by installing equipment. Only by optimizing the pipe diameter, inlet parameters (temperature and pressure of liquid CO2 at the inlet of the pipe), insulation method and other measures can the temperature and pressure of liquid CO2 in the pipeline with large height difference be always within the shaded area in Figure 1.
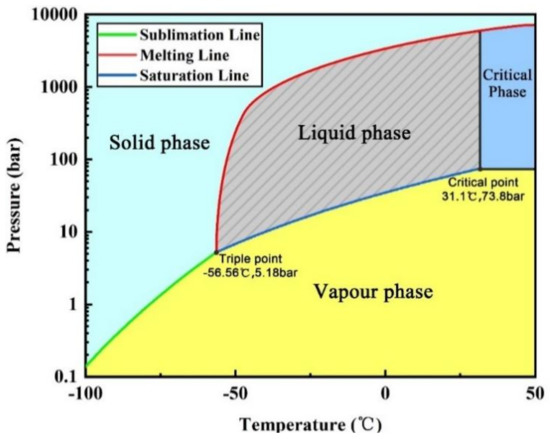
Figure 1.
CO2 phase diagram.
Many scholars have studied the method of determining the optimum diameter of a CO2 pipeline transportation system. For example, Mohitpour et al. [30] constructed the calculation model of the optimal diameter based on the energy balance equation of flowing CO2. Zhang et al. [23,31] obtained the formula for calculating the optimal pipe diameter based on Peters from the economic point of view, which involves the factors of pipeline cost, pump/compressor power, heat preservation, and maintenance, etc. For the determination of inlet parameters, some studies have been carried out to determine the optimum value by analyzing the temperature and pressure changes along the pipeline with different inlet parameters combining economic factors. For example, Zhang et al. [23] studied the pressure drop along the pipeline from the power plant to the injection point in the CO2-ECBM project at different inlet temperatures and pressures and the number of booster stations needed to be installed along the pipeline and based on these, the optimum inlet parameters were determined. Witkowsk et al. [32] studied the variation of pressure drop and density at different inlet temperatures under isothermal and adiabatic conditions, and determined the influence of inlet temperature on the maximum safe transportation distance. It can be found that these studies clarify the influence of pipe diameter and inlet parameters and the determination method of their optimum values from the perspective of economy and temperature and pressure along the pipeline, which has important guiding significance for the construction of a liquid CO2 pipeline transportation system from coal mine surface to gob. However, the data about the influence of pipe diameter and inlet parameters on the temperature and pressure change along the liquid CO2 transportation pipeline with large height difference are still scarce, which is the basic premise of constructing a liquid CO2 pipeline transportation system of coal mine.
Therefore, the main purpose of this study was to analyze the temperature and pressure variation of liquid CO2 along large-height difference pipelines with different pipe diameters and inlet parameters, so as to determine the method to ensure the CO2 is always liquid in pipeline with large height difference by controlling pipe diameter and inlet parameters. Firstly, using Aspen HYSYS V7.2® commercial simulation software (Aspen Technology, Inc., Bedford, MA, USA), based on whether phase change occurs in vertical pipelines with different diameters when transporting liquid CO2 with different flow rates, the limit flow range of each pipe diameter was studied, and the optimum diameter was determined by combining the liquid CO2 flow required for underground fire prevention and extinguishing. Then, the effect of inlet temperature and pressure on the process of transporting liquid CO2 in vertical pipeline was studied by obtaining the optimal diameter before, and determining the optimal inlet parameters. This study provides a theoretical basis for the construction of a liquid CO2 pipeline transportation system from coal mine surface to underground.
2. Methods
2.1. The Liquid CO2 Pipeline Transportation System from Coal Mine Ground to Underground
The liquid CO2 pipeline transportation system from coal mine ground to underground is shown in Figure 2, which mainly includes liquid CO2 cylinder, pipeline, valve and so on. The liquid CO2 used in coal mines is mainly transported from nearby chemical plants and power plants, etc. Therefore, liquid CO2 storage cylinders are set up on the ground of coal mines [12]. The pipeline part mainly includes three parts: ground pipeline, vertical pipeline and underground pipeline. The vertical pipes are laid through vertical air intake or return wells in coal mines. Temperature and pressure variation of liquid CO2 along the vertical pipeline is the main content of this study.
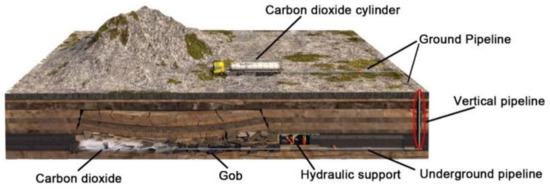
Figure 2.
Liquid CO2 pipeline transportation system from coal mine ground to underground.
2.2. Method of Studying the Variation of Temperature and Pressure along Pipeline
ASPEN HYSYS® V7.2 commercial simulation software (Aspen Technology, Inc., Bedford, MA, USA) was used to study the effect of pipe diameter and inlet temperature and pressure on the variation of liquid CO2 temperature and pressure in the pipeline with large height difference. Many scholars have used this software to do relevant research, which proves the accuracy and scientificity of the software used to study the temperature and pressure variation rules along the pipeline when CO2 is transported. For instance, Teh et al. [29] used the software to study the pipeline transporting process of CO2. Luo et al. [33] used ASPEN HYSYS® to study the gas pipeline network in Humber area, UK and the research results were compared with those of PIPE-FLO®, and they are in good agreement.
Firstly, the steady-state model was used for simulation. The molecular weight, boiling point, ideal fluid density, critical point of CO2, etc. were input. Peng–Robinson (PR) equation of state was used for physical calculation [34], as it could strictly calculate any single, two or three-phase system and is efficient, reliable and widely applicable. Li et al. [35] concluded that PR equation has high accuracy for pure CO2 or the CO2 containing impurities of hydrogen sulfide or methane. Luo and Teh et al. [29,33] also used PR equation to simulate the pipeline transportation process of CO2, which proved that the calculation results are of reliability. Mohitpour et al. compared the predicted values obtained by different equation of state with the critical temperature and pressure measured by Dusckek et al. [36,37], and found that the predicted values of PR equation of state were very close to the experimental data. All the equations for PR used in this study are the standard form in HYSYS without any modifications.
Then, the composition of the fluid (pure CO2), pipeline parameters (material, pipe diameter, length, etc.) and thermodynamic parameters (insulation layer, environmental medium, ambient temperature, etc.) and other parameters were input. Considering the cost of a pipeline, pipe installation and maintenance, the lower diameter of pipeline is more suitable for liquid CO2 transportation. According to the diameter standard of pipelines stipulated by the General Administration of Quality Supervision, Inspection and Quarantine of China, the inner diameters of the pipes were selected to be 15 mm, 20 mm, 25 mm, 32 mm, 40 mm and 50 mm, respectively [38], so as to study the influence of the pipe diameters. Pipeline material was set as mild steel with roughness of 4.572 × 10⁻⁵ m [26,29,39,40], ignoring the influence of local factors such as valves and elbows in the simulation. Because deep seam mining seldom exceeds 1000 m, the length and the height difference of the pipeline was 1000 m between the inlet and outlet of pipeline section in the simulation (i.e., 1000 m vertical pipeline).
The overall ambient temperature was set to 20 °C (the ambient temperature in the vertical mine roadway is generally about 20 °C), the environment medium was air, and there was no insulation outside the pipeline. For the calculation of heat loss, the standard method from HYSYS was used.
When studying the flow range of pipe with different diameters, the inlet pressure was set to 22 bar and the inlet temperature was −20 °C. This is due to the fact that storage cylinders are usually used to store liquid CO2 on the surface of coal mines, and the pressure in storage cylinders is generally in the range of 14–24 bar, while the storage temperature is generally −20 °C or lower [41,42,43,44]. In order to determine the influence of pipe diameter and flow rate on liquid CO2 transportation, it was analyzed whether phase transition occurred in a pipeline of different diameter when transporting CO2 with different mass flow rate. The specific process was as follows:
- (1)
- Setting the pipe diameter, and sequentially setting the predetermined flow rate (i.e., 500, 1000, 2000, 5000, 10,000, 20,000, 50,000, 100,000 kg/h) to obtain phase state data at different positions of the transporting process.
- (2)
- If there is no phase change within the flow range, expand the range of the preset flow rate (such as 150,000 kg/h) and repeat step (1); if two-phase flow does not occur during the transporting process when the flow rate is f1, but it occurs when the flow rate is f2, then the maximum limit flow rate is between f1 and f2.
- (3)
- f3 = (f1 + f2)/2, and determine whether two-phase flow occurs when the flow rate is f3; if it occurs, f4 = (f1 + f3)/2; if it does not occur, then f4 = (f2 + f3)/2. Then determine whether two-phase flow occurs when the flow rate is f4.
- (4)
- Repeat step (3) until fn is taken between two adjacent integers m1 and m2, and two-phase flow does not occur when the flow rate is m1, but occurs when the flow rate is m2, then take m1 for maximum limit flow.
For determining the minimum limit flow, the same method was used. In this way, the accurate safe transportation flow ranges of pipe with different diameters can be obtained, and the optimal pipe diameter can be obtained combining the flow demand of CO2 for fire prevention and extinguishment in general mines.
When studying the influence of inlet parameters on CO2 transport, the inlet pressure of a 1000 m vertical pipeline was set to 14 bar, 16 bar, 18 bar, 20 bar, 22 bar, 24 bar, respectively. Based on whether two-phase flow occurs during transportation, the maximum allowable inlet temperature corresponding to each inlet pressure was determined step by step by the dichotomy, which was similar to the method used to determine the limit flow. The setting of other boundary conditions during calculation was the same as when analyzing the influence of pipe diameter and flow.
3. Results and Discussion
The limit transporting flow corresponding to each diameter was determined by studying the variation of temperature and pressure of liquid CO2 along pipelines with different diameters and height difference, based on whether two-phase flow occurs or not.
3.1. Safe Flow Interval
3.1.1. Maximum Limit Transporting Flow of Pipelines with Different Diameters
During the process of determining the maximum safe transporting flow, it was found that when the flow rate is lower than the maximum limit flow rate, a small change in flow rate will not lead to a significant change in temperature and pressure, and the difference between different flow rates cannot be clearly identified on temperature and pressure diagram with distance. However, when it is larger than the maximum limit flow rate, the results are exactly opposite. In order to clearly show the temperature and pressure changes along the pipeline at different flow rates, the results of flow rates of 0.4, 0.7, 1, 1.01, 1.02 and 1.03 times the maximum limit flow rate are listed in Figure 3 and Figure 4.
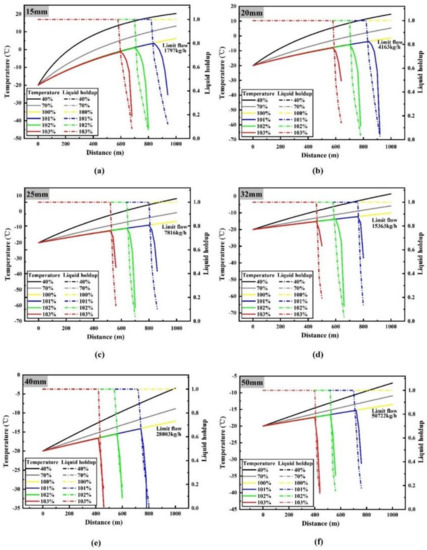
Figure 3.
Curves of CO2 temperature (solid line) and liquid holdup (dotted line) with depth at different flow rates under different pipe diameters: (a) 15 mm diameter; (b) 20 mm diameter; (c) 25 mm diameter; (d) 32 mm diameter; (e) 40 mm diameter; (f) 50 mm diameter.
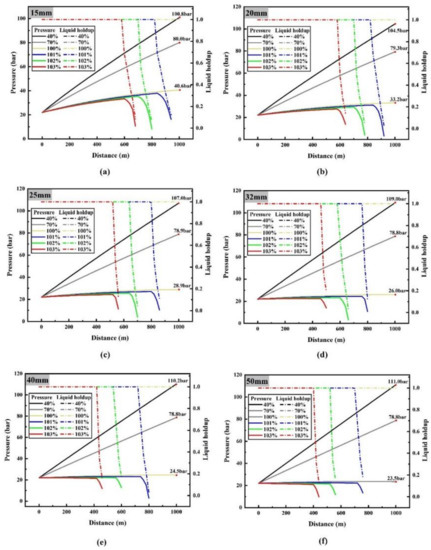
Figure 4.
Curves of CO2 pressure (solid line) and liquid holdup (dotted line) with depth at different flow rates under different pipe diameters: (a) 15 mm diameter; (b) 20 mm diameter; (c) 25 mm diameter; (d) 32 mm diameter; (e) 40 mm diameter; (f) 50 mm diameter.
Figure 3 shows the temperature and liquid holdup of liquid CO2 along the pipeline at different flow rates. Liquid holdup (H) refers to the proportion of liquid cross-section area (A1) to total cross-section area (A) in the process of liquid–gas two-phase flow in pipe, i.e., H = A1/A. According to the calculation results of liquid holdup, it can be seen that with the increase of flow rate, phase transition of liquid CO2 occurs at a certain point in the pipeline. When the pipe diameters are 15 mm, 20 mm, 25 mm, 32 mm, 40 mm and 50 mm, the maximum limit flow rates without phase transformation are 1797 kg/h, 4163 kg/h, 7816 kg/h, 15,363 kg/h, 28,003 kg/h and 50,722 kg/h, respectively.
When the flow rate is 0.4 and 0.7 times the maximum limit flow rate, no phase transition occurs along the pipeline. It can be seen that with the increase of pipeline depth, the temperature of liquid CO2 increases gradually. This is the result of heat exchange between the pipeline and its external environment [32]. Under the same pipeline parameters, the higher the flow rate, the faster the CO2 velocity of flow, the shorter the heat absorption time of the same mass flowing through the whole pipeline, which leads to the larger the flow rate and the smaller the temperature rise. For instance, when the flow rate is 0.4, 0.7 and 1 times the maximum limit flow rate with the 15 mm diameter pipeline, the liquid CO2 temperature at the end of the pipeline reaches 20.3 °C, 13.3 °C and 6.2 °C, respectively (the inlet liquid CO2 temperature of the pipeline is set to −20 °C).
When the flow rate exceeds the maximum limit flow rate, phase transition will occur in CO2 flow, and the higher the flow rate, the earlier the phase transition will occur. A 15 mm pipe diameter condition is taken as a representative example, the flow rate is 1.01, 1.02 and 1.03 times the maximum limit flow rate, respectively. At 940 m, 800 m and 680 m of the pipeline, CO2 changes from liquid to gas very quickly. This process absorbs a large amount of heat instantaneously, resulting in a sudden drop in the temperature of CO2 at initial gasification point, which shows a turning point of temperature curve close to 90 °C.
Figure 4 is the pressure curve of liquid CO2 along the pipeline at different flow rates. When the flow rate is 0.4 and 0.7 times the maximum limit flow rate, the pressure of liquid CO2 increases gradually along the pipeline, but the higher the flow rate, the smaller the pressure rise. When the diameter of the pipeline is 15 mm, the pressure at the end of the pipeline reaches 100.8 and 80.0 bar, respectively. In addition, it can be seen that the pressure rise is very small with the maximum limit flow rate.
Pressure along the pipeline is mainly determined by two factors, namely, static gradient and friction gradient. Static gradient is mainly determined by mining depth and fluid density. Friction gradient is determined by friction strength and has a direct relationship with pressure drop [32]. When the sum of friction gradient and the static gradient is positive, the higher the sum is, the faster the pressure drop rate is; when the sum is negative, the smaller it is, the faster the pressure rises.
Figure 5 shows the variation of friction gradient and static pressure gradient with pipeline depth in 15 mm diameter pipeline when the flow rate is 0.4, 0.7, 1, 1.01, 1.02 and 1.03 times the maximum limit flow rate, respectively. For the condition that there is no two-phase flow (i.e., 0.4, 0.7, 1 times the maximum limit flow rate), it can be seen that the influence of pipe depth on the friction gradient is very small, but the static gradient increases with the transportation depth. Additionally, the flow rate has a great influence on the friction gradient, the higher the flow rate, the greater the friction gradient. At the end of the pipeline, the friction gradient at the maximum limit flow rate is 8.3 times that at the 0.4 times maximum limit flow rate. The static gradient decreases with the increase of flow rate, but the decrease is small (change within 2 kPa/m). When the flow rate is large, the pressure drop caused by the large friction gradient will be larger than the increase of the static pressure gradient, and even cause the pressure at the end of the pipeline to be lower than the inlet pressure.
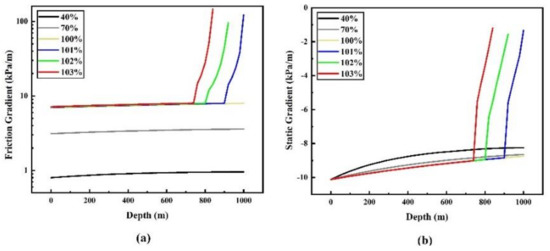
Figure 5.
Variation of friction gradient (a) and static gradient (b) with depth under different flow rates of 15 mm pipe diameter.
When the flow rate is 1.01, 1.02 and 1.03 times the maximum limit flow rate respectively, the pressure drops sharply after the phase transition occurs, which is due to the rapid increase of the volume flow rate in the pipeline caused by the appearance of the gas after the phase transition occurs (the gas volume of the same mass CO2 is hundreds of times the liquid volume of CO2), which leads to the rapid increase of friction resistance.
3.1.2. Minimum Limit Transporting Flow of Pipelines with Different Diameters
It can be seen from the results presented in Section 3.1.1 that the smaller the flow rate, the greater the heat exchange between CO2 and the surrounding environment, resulting in faster temperature rise along the pipeline. Therefore, it can be inferred that when the flow rate of liquid CO2 is very small, phase transition will also be found in the transporting process, and there is a minimum limit transporting flow to avoid the occurrence of two-phase flow. When the flow rate of liquid CO2 is small, the changes of liquid holdup, temperature and pressure along the vertical pipeline are shown in Figure 6 and Figure 7.
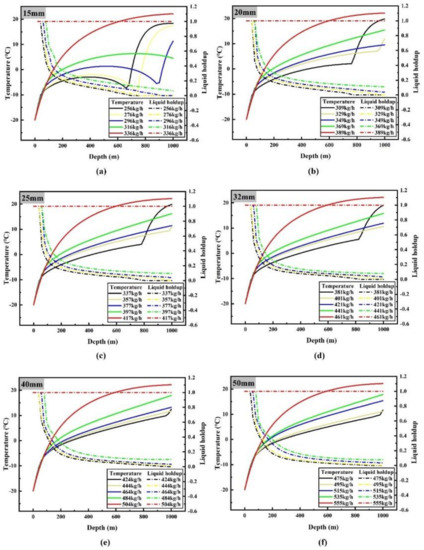
Figure 6.
Variations of temperature (solid line) and liquid holdup (dotted line) along the pipeline when the flow rate is less than or equal to the minimum limit flow rate: (a) 15 mm diameter; (b) 20 mm diameter; (c) 25 mm diameter; (d) 32 mm diameter; (e) 40 mm diameter; (f) 50 mm diameter.
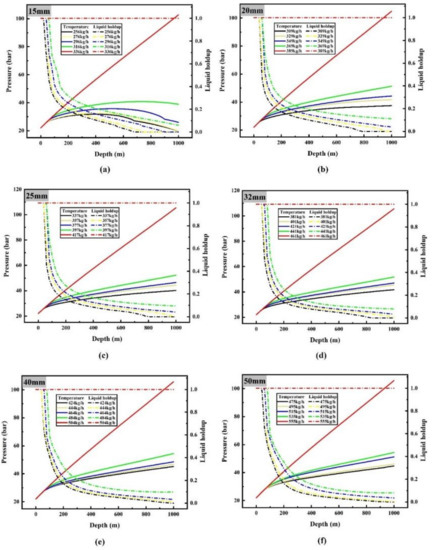
Figure 7.
Variations of pressure (solid line) and liquid holdup (dotted line) along the pipeline when the flow rate is less than or equal to the minimum limit flow rate: (a) 15 mm diameter; (b) 20 mm diameter; (c) 25 mm diameter; (d) 32 mm diameter; (e) 40 mm diameter; (f) 50 mm diameter.
Figure 6 shows that the minimum limit flow rates are 336, 389, 417, 461, 504 and 555 kg/h when the pipe diameters are 15, 20, 25, 32, 40 and 50 mm respectively. Gasification of liquid CO2 will occur during transportation as the flow rate continues to decrease. According to the variation of liquid holdup along the pipeline (Figure 6), it can be seen that there are three kinds of changes in the phase state of CO2 in the 1000 m vertical pipeline: the whole process of transporting liquid CO2; transporting liquid CO2, then transporting gas–liquid two-phase CO2 after phase transition occurs; transporting liquid CO2, gas–liquid two-phase CO2 after phase transition occurs and gas-phase CO2 after complete gasification in turn. For a pipeline with diameter of 15 mm, when the inlet flow rate is 336 kg/h, the liquid holdup of the whole pipeline is 1, which means that CO2 remains in the liquid phase; but when the inlet flow rate is reduced to 316 kg/h, the liquid holdup of the pipeline decreases continuously from the position of 40 m to the end of the pipeline (the liquid holdup at the end of the pipeline is 0.0603), indicating that liquid CO2 is gasified gradually during this period, that is to say, liquid CO2 is transported before 40 m, and then gas–liquid two-phase CO2 is transported. When the inlet flow rate continues to decrease to 296 kg/h, gasification begins at 40 m and liquid holdup drops to 0 at 900 m, indicating that liquid CO2 is transported before 40 m, gas–liquid two-phase CO2 is transported between 40 m and 900 m, and then gas–liquid CO2 is transported.
The change of liquid holdup is consistent with that of temperature and pressure. For instance, when liquid CO2 is transported by a pipeline of 15 mm diameter at 296 kg/h, it will remain liquid until 40 m. At this time, the temperature rises rapidly, because the temperature difference between CO2 and the surrounding environment is large in the initial stage, and the flow rate is small. The slow flow rate leads to the rapid heat transfer between CO2 and the surrounding environment; The pressure rises linearly at this time because the transport medium is pure liquid CO2, and the density change is less affected by its temperature and pressure change, which makes the static pressure rise rate stable, and the density change small makes the velocity of CO2 along the pipeline stable, which makes the pressure drop change stable, too; at the same time, the very low flow rate makes the pressure drop especially low, in two aspects. The two aspects make the pressure rise almost linearly.
From 40 m to 900 m, liquid CO2 continues to gasify, and the temperature rises slowly or even decreases at this time. The main reason is that the heat absorption of CO2 gasification inhibits the temperature rise caused by heat transfer with the surrounding environment. Because the specific heat capacity of gaseous CO2 is much lower than that of liquid CO2, this leads to even lower temperature when liquid holdup is low in the later stage. While the density of the pipeline decreases due to the gradual gasification of liquid CO2, which impedes partly the increase of static pressure, and the pressure drop increases due to the increase of friction between flow and the wall of the pipeline. The rate of pressure rise decreases dramatically, and even the pressure does not increase with the decrease of altitude; that is to say, the pressure decreases.
After 900 m, the temperature of CO2 rises rapidly because of the lower specific heat capacity of fully gasified CO2; convective heat transfer with the surrounding makes the temperature of CO2 rise faster, and the temperature rise slows down near ambient temperature, which is due to the smaller temperature difference between CO2 and the ambient environment. The CO2 density of complete gasification is very low, which makes the rate of static pressure rise very low, and the pressure drop caused by CO2 friction after gasification is much higher than that of liquid state, which makes the pressure drop.
Comparing Figure 3 and Figure 4, with Figure 6 and Figure 7, it can be found that phase transition occurs when liquid CO2 is transported at very high or very low flow rates, but there are obvious differences between them. At high flow rate, a sudden change in phase transition occurs, and the rate at which CO2 is converted into gases in pipes is very fast. Conversely, the phase transition of liquid CO2 is a slow process at low flow rate.
The results of Section 3.1.1 show that the pressure drop of CO2 before two-phase flow occurs at high flow rate is much larger than that at low flow rate, which is one of the reasons why the phase change rate at high flow rate is much higher than that at low flow rate. The volume flow rate of CO2 produced by gasification at high mass flow rate is much higher than that at low mass flow rate, which further increases the pressure drop of the flow in the pipeline. These two factors lead to the rapid increase of pressure drop after gasification at high flow rate, which leads to the rapid phase transition process. At low flow rate, the pressure drop is much lower than that caused by phase change at large flow rate, which is the main reason for the fast phase change process at high flow rate and the slow phase change process at low flow rate. Pressure drop is very small before two-phase flow does not occur at low flow rate. After gasification of two-phase flow, pressure drop does not rise rapidly, and under this condition the main reason for the two-phase flow is due to sufficient heat transfer with the surrounding environment. The endothermic effect of gasification can inhibit the heating process caused by heat transfer and the rate of phase transition, which makes the phase transformation process slow.
In order to further improve the safety, the minimum limit flow rate and maximum limit flow rate determined based on whether two-phase flow is generated are multiplied by 110% and 90% respectively as the limit value of actual transport flow. All the results are listed in Table 1. In order to ensure the effectiveness of fire prevention and fire extinguishing in coal mine, the liquid CO2 transporting system is required to have 1–10 t/h transporting capacity [41,42]. It can be found from Table 1 that the pipe diameters of 32, 40 and 50 mm can meet the requirements. Considering the economic cost, a 32 mm pipe diameter is determined as the optimal diameter.

Table 1.
Flow range of pipeline transportation of liquid CO2 with different diameters.
3.2. Optimum Inlet Temperature and Pressure
Temperature and pressure of liquid CO2 at the entrance of the pipeline section can affect temperature and pressure changes along the pipeline [32]. Only by obtaining the optimum inlet parameters which can avoid phase change along the pipeline can determine whether it is necessary to install a temperature controller or a booster pump before the entrance of the pipeline. According to the results of the study in Section 3.1, a pipe with an inner diameter of 32 mm and a flow rate of 5 t/h was used to study the optimum inlet temperature and pressure.
Figure 8 and Figure 9 show the change of temperature and pressure along the pipeline at different inlet temperatures and inlet pressures. When the inlet pressure is set to 14 bar and the inlet temperature is −30 °C, −32.5 °C and −35 °C, respectively, the temperature rise curve is very smooth and nearly linear, and it can be judged that there is no phase transition in the transport process. The three lines gradually approach as the depth increases, and it can be seen that the lower inlet temperature has a higher rate of rise. This is because the ambient temperature is constant and the lower inlet temperature of the fluid causes a higher temperature difference, so that the heat transfer rate of the whole depth range is faster. However, when the inlet temperature is −25 °C and −27.5 °C, respectively, CO2 is always in the gas phase from the starting position, and it can be noticed that both temperature and pressure dropped rapidly. This is because the volume flow of CO2 in the pipeline is very high, resulting in a very large pressure drop. Simultaneously, according to the basic state equation PV = nRT, where P is the pressure, V is the gas volume, n is the amount of the substance, T is absolute temperature, and R is the gas constant, when the three values (V, n, R) are fixed, if the pressure value decreases, the temperature must go down. According to the above analysis, it can be determined that when the inlet pressure is 14 bar, the maximum allowable inlet temperature is −30 °C. The maximum allowable inlet temperature is obtained by the same method under other pressure conditions.
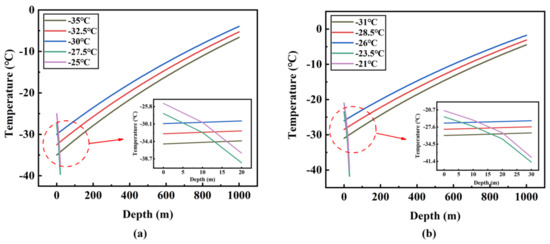
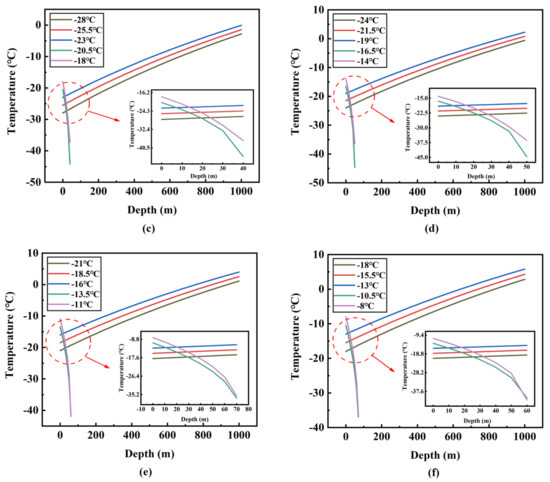
Figure 8.
Temperature variation along the pipeline at different inlet temperatures and different inlet pressures: (a) 14 bar; (b) 16 bar; (c) 18 bar; (d) 20 bar; (e) 22 bar; (f) 24 bar.
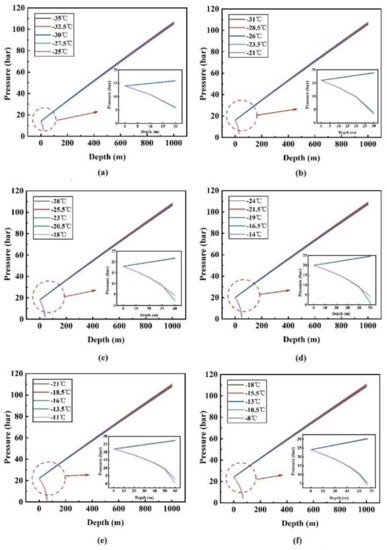
Figure 9.
Pressure variation along the pipeline at different inlet temperatures and different inlet pressures: (a) 14 bar; (b) 16 bar; (c) 18 bar; (d) 20 bar; (e) 22 bar; (f) 24 bar.
The maximum allowable inlet temperatures corresponding to the six inlet pressures (14 bar, 16 bar, 18 bar, 20 bar, 22 bar, 24 bar) are −30 °C, −26 °C, −23 °C, −19 °C, −16 °C and −13 °C, respectively (Figure 10). In Figure 8 and Figure 9, for each inlet pressure, the change of fluid temperature and pressure along the pipeline is basically the same. Under the maximum allowable inlet temperature, the endpoint temperature rises with the increase of inlet pressure. For example, when the inlet pressure and temperature are 24 bar and −13 °C (the maximum allowable inlet temperature), the endpoint temperature and pressure are 5.8 °C and 104.9 bar, respectively. However, when the inlet pressure and temperature are 14 bar and −30 °C (the maximum allowable inlet temperature), the end temperature and pressure are −4.0 °C and 108.6 bar, respectively. The end temperature and pressure difference between the two conditions is 9.8 °C and 3.7 bar, which is far below the initial pressure and temperature difference of 17 °C and 10 bar. Moreover, in Figure 10, through simple calculations, it is found that for every 2 bar increase in inlet pressure, the maximum allowable inlet temperature can be increased by about 3–4 °C, which indicates that the requirement for the inlet temperature will decrease when the inlet pressure rises.
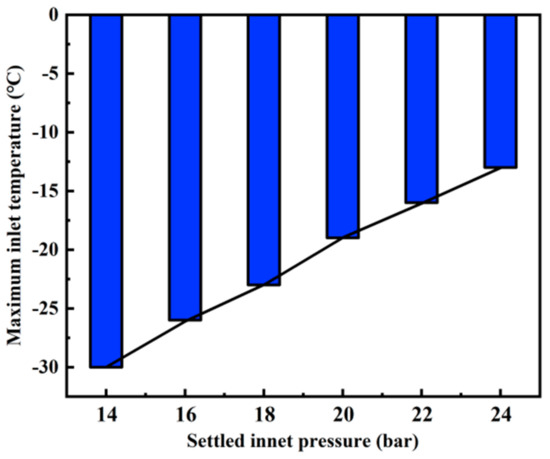
Figure 10.
Maximum allowable inlet temperature corresponding to each inlet pressure.
3.3. Discussion on Safe Pipeline Transportation of Liquid CO2
According to Section 3.1, for pipelines with different diameters, there is a flow interval that could avoid phase transition of liquid CO2. Therefore, when designing a liquid CO2 pipeline transportation system, the pipe diameter and its corresponding maximum and minimum limit flow rates should be determined according to the actual demand for liquid CO2 flow. In actual pipeline transportation, it is easy to control the flow below the maximum limit flow. However, in many cases it is not possible to guarantee that the flow is above the minimum limit, such as at the beginning and the end of the transportation. For example, after the end of the transportation, a large amount of liquid CO2 remains in the pipe, but the flow rate is zero. In these cases, the temperature of the liquid CO2 rises rapidly, and gasification occurs. In order to solve this problem, it is necessary to study the corresponding countermeasures.
In Section 3.2, it was found that the suitable setting of inlet pressure and temperature could avoid the phase transition of liquid CO2 in the pipeline with large height difference. For every 2 bar increase in inlet pressure, the maximum allowable inlet temperature can be allowed to rise by about 3–4 °C. When designing the system, it is possible to determine whether to adopt pressure regulation or temperature control from the perspective of economic cost.
In addition, only three parameters of pipe diameter, flowrate and inlet temperature and pressure were involved in this study. However, many other factors, such as ambient temperature, type and thickness of insulation layer, pipe inclination and pipe roughness, also affect the temperature and pressure changes of liquid CO2 during transportation. They are important factors in determining the safe transportation of liquid CO2. The impact of these parameters also requires further in-depth research.
4. Conclusions
The influence of pipe diameter and inlet temperature and pressure on the temperature and pressure along a 1000 m vertical pipeline for transporting liquid CO2 was studied. Based on the phase change of liquid CO2 during transportation, the transportation flow range of a 1000 m vertical pipeline with different diameters was determined. According to the requirement of underground fire prevention and extinguishing for transporting flow rate and economic cost, the optimum diameter of the pipe is 32 mm, and the transporting flow range is 507–13,826 kg/h. When the transporting flow is larger than the maximum safe transporting flow, the liquid CO2 will change dramatically, which will lead to a sudden drop in temperature and pressure, and will influence the mechanical performance of the pipeline. When the transport flow rate is lower than the minimum safe transport flow rate, the liquid CO2 will phase change slowly along the pipeline. In addition, the maximum allowable inlet temperature corresponding to different settled inlet pressures was determined. When the inlet pressure is constant, if the inlet temperature is too high, the liquid CO2 will change dramatically at the entrance of the pipeline. For every 2 bar increase in inlet pressure, the maximum allowable inlet temperature can be allowed to rise by about 3–4 °C.
Author Contributions
Conceptualization, G.Q.; Data curation, H.H. and G.Q.; Funding acquisition, W.L.; Investigation, H.H. and G.Q.; Methodology, H.H. and G.Q.; Validation, W.L. and G.Q.; Visualization, W.L. and G.Q.; Writing—Original draft, H.H. and G.Q.; Writing—Review and editing, G.Q.
Funding
This research was funded by the National Key Research and Development Program of China (2018YFC0807906), the National Natural Science Foundation of China (51804185, 51804183), the Natural Science Foundation of Shandong Province (ZR2018BEE003), the Focus on Research and Development Plan in Shandong Province (2019GSF111060, 2018GSF116012), and the Talent Introduction Research Start-up Fund Project of Shandong University of Science and Technology (2017RCJJ005).
Conflicts of Interest
The authors declare no conflict of interest.
References
- Ren, X.; Hu, X.; Xue, D.; Li, Y.; Shao, Z.; Dong, H.; Cheng, W.; Zhao, Y.; Xin, L.; Lu, W. Novel sodium silicate/polymer composite gels for the prevention of spontaneous combustion of coal. J. Hazard. Mater. 2019, 371, 643–654. [Google Scholar] [CrossRef] [PubMed]
- Cheng, W.; Hu, X.; Xie, J.; Zhao, Y. An intelligent gel designed to control the spontaneous combustion of coal: Fire prevention and extinguishing properties. Fuel 2017, 210, 826–835. [Google Scholar] [CrossRef]
- Zhang, Y.; Liu, Y.; Shi, X.; Yang, C.; Wang, W.; Li, Y. Risk evaluation of coal spontaneous combustion on the basis of auto-Ignition temperature. Fuel 2018, 233, 68–76. [Google Scholar] [CrossRef]
- Li, S.; Zhou, G.; Wang, Y.; Jing, B.; Qu, Y. Synthesis and characteristics of fire extinguishing gel with high water absorption for coal mines. Process Saf. Environ. Prot. 2019, 125, 207–218. [Google Scholar] [CrossRef]
- Wang, J.; Zhou, G.; Wei, X.; Wang, S. Experimental characterization of multi-Nozzle atomization interference for dust reduction between hydraulic supports at a fully mechanized coal mining face. Environ. Sci. Pollut. Res. 2019, 26, 10023–10036. [Google Scholar] [CrossRef] [PubMed]
- Zhang, G.C.; Wen, Z.J.; Liang, S.J.; Tan, Y.L.; Tian, L.; Zhao, Y.Q.; Zhao, D.S. Ground response of a gob-Side entry in a longwall panel extracting 17 m-Thick coal seam: A case study. Rock Mech. Rock Eng. 2019. [Google Scholar] [CrossRef]
- Gao, F.; Deng, C.B.; Wang, X.F.; Li, X.M.; Dai, F.W. Experimental study on adsorbing of flue gas and its application in preventing spontaneous combustion of coal. Adsorpt. Sci. Technol. 2018, 36, 1744–1754. [Google Scholar] [CrossRef]
- Liu, Z.; Wen, H.; Yu, Z.; Wang, C.; Ma, L. Control of spontaneous combustion of coal in goaf at high geotemperatureby injecting liquid carbon dioxide: Inertand cooling characteristics of coal. In IOP Conference Series: Earth and Environmental Science; IOP Publishing: Bristol, UK, 2018; Volume 121, p. 22013. [Google Scholar]
- Dai, J.J. Experimental Study on Prevention and Control of Coal Spontaneous Combustion by Liquid CO2. Master’s Thesis, Xi’an University of Science and Technology, Xi’an, China, June 2017. [Google Scholar]
- Jing, J.D. Research on Fire Prevention and Extinguishing Technology of Liquid Carbon Dioxide in Yangchangwan Coal Mine. Master’s Thesis, China University of Mining and Technology, Xuzhou, China, May 2019. [Google Scholar]
- Yang, C. Research and Application of Inhibiting Coal Spontaneous Combustion Technology by Liquid CO2. Master’s Thesis, Xi’an University of Science and Technology, Xi’an, China, June 2018. [Google Scholar]
- Shu, Y.; Li, W.; Li, Z. The technology of liquid CO2 used for fire prevention and the related device. Adv. Mater. Res. 2012, 347–353, 1642–1646. [Google Scholar]
- Gang, W. Application and analysis of liquid CO2 infusion technology in mine fire prevention and control, coal science and technology. Coal Sci. Technol. 2017, 45, 89–93. [Google Scholar]
- Anwar, M.N.; Fayyaz, A.; Sohail, N.F.; Khokhar, M.F.; Baqar, M.; Khan, W.D.; Rasool, K.; Rehan, M.; Nizami, A.S. CO2 capture and storage: A way forward for sustainable environment. J. Environ. Manag. 2018, 226, 131–144. [Google Scholar] [CrossRef]
- Koornneef, J.; Van Breevoort, P.; Hamelinck, C.; Hendriks, C.; Hoogwijk, M.; Koop, K.; Koper, M.; Dixon, T.; Camps, A. Global potential for biomass and carbon dioxide capture, transport and storage up to 2050. Int. J. Greenh. Gas Control 2012, 11, 117–132. [Google Scholar] [CrossRef]
- Masoudian, M.S. Multiphysics of carbon dioxide sequestration in coalbeds: A review with a focus on geomechanical characteristics of coal. J. Rock Mech. Geotech. Eng. 2016, 8, 93–112. [Google Scholar] [CrossRef]
- Montes-Hernandez, G.; Pérez-López, R.; Renard, F.; Nieto, J.M.; Charlet, L. Mineral sequestration of CO2 by aqueous carbonation of coal combustion fly-Ash. J. Hazard. Mater. 2008, 161, 1347–1354. [Google Scholar] [CrossRef] [PubMed]
- Yang, D.; Koukouzas, N.; Green, M.; Sheng, Y. Recent development on underground coal gasification and subsequent CO2 storage. J. Energy Inst. 2015, 89, 469–484. [Google Scholar] [CrossRef]
- Cheng, P.; Bestehorn, M.; Firoozabadi, A. Effect of permeability anisotropy on buoyancy-driven flow for CO2 sequestration in saline aquifers. Water Resour. Res. 2012, 48, 1–16. [Google Scholar] [CrossRef]
- Firoozabadi, A.; Cheng, P. Prospects for subsurface CO2 sequestration. AIChE J. 2010, 56, 1398–1405. [Google Scholar] [CrossRef]
- Dejam, M.; Hassanzadeh, H. The role of natural fractures of finite double-Porosity aquifers on diffusive leakage of brine during geological storage of CO2. Int. J. Greenh. Gas Control 2018, 78, 177–197. [Google Scholar] [CrossRef]
- Dejam, M.; Hassanzadeh, H. Diffusive leakage of brine from aquifers during CO2 geological storage. Adv. Water Resour. 2018, 111, 36–57. [Google Scholar] [CrossRef]
- Zhang, Z.X.; Wang, G.X.; Massarotto, P.; Rudolph, V. Optimization of pipeline transport for CO2 sequestration. Energy Convers. Manag. 2006, 47, 702–715. [Google Scholar] [CrossRef]
- Chandel, M.K.; Pratson, L.F.; Williams, E. Potential economies of scale in CO2 transport through use of a trunk pipeline. Energy Convers. Manag. 2010, 51, 2825–2834. [Google Scholar] [CrossRef]
- Torp, T.A.; Brown, K.R. CO2 Underground storage costs as experienced at sleipner and weyburn. In Greenhouse Gas Control Technologies; Elsevier Science Ltd.: Manchester, UK, 2005; pp. 531–538. [Google Scholar]
- Vandeginste, V.; Piessens, K. Pipeline design for a least-cost router application for CO2 transport in the CO2 sequestration cycle. Int. J. Greenh. Gas Control 2008, 2, 571–581. [Google Scholar] [CrossRef]
- Wildenborg, T.; Gale, J.; Hendriks, C.; Holloway, S.; Brandsma, R.; Kref, E.; Lokhorst, A. Cost curves for CO2 storage: European sector. In Greenhouse Gas Control Technologies 7; Elsevier Science Ltd.: Manchester, UK, 2005; pp. 603–610. [Google Scholar]
- Torp, T.A.; Gale, J. Demonstrating storage of CO2 in geological reservoirs: The sleipner and SACS projects. Energy 2004, 29, 1361–1369. [Google Scholar] [CrossRef]
- Teh, C.J.; Barifcani, A.; Pack, D.; Tade, M.O. The importance of ground temperature to a liquid carbon dioxide pipeline. Int. J. Greenh. Gas Control 2015, 39, 463–469. [Google Scholar] [CrossRef]
- McCoy, S.T.; Rubin, E.S. An engineering-economic model of pipeline transport of CO2 with application to carbon capture and storage. Int. J. Greenh. Gas Control 2008, 2, 219–229. [Google Scholar] [CrossRef]
- Peters, M.S.; Timmerhaus, K.D.; West, R.E. Plant Design and Economics for Chemical Engineers, 5th ed.; McGraw-Hill, Inc.: New York, NY, USA, 2002. [Google Scholar]
- Witkowski, A.; Mirosław, M. Analysis of transportation systems for CO2 sequestration. Arch. Thermodyn. 2015, 35, 117–140. [Google Scholar] [CrossRef]
- Luo, X.; Wang, M.; Oko, E.; Okezue, C. Simulation-Based techno-Economic evaluation for optimal design of CO2 transport pipeline network. Appl. Energy 2014, 132, 610–620. [Google Scholar] [CrossRef]
- Peng, D.Y.; Robinson, D.B. A new two-Constant equation of state. Ind. Eng. Chem. Fundam. 1976, 15, 59–64. [Google Scholar] [CrossRef]
- Li, H.; Yan, J. Evaluating cubic equations of state for calculation of vapor-Liquid equilibrium of CO2 and CO2-mixtures for CO2 capture and storage processes. Appl. Energy 2009, 86, 826–836. [Google Scholar] [CrossRef]
- Mohitpour, M.; Seevam, P.; Botros, K.K.; Rothwell, B.; Ennis, C. Pipeline Transportation of Carbon Dioxide Containing Impurities; ASME Press: New York, NY, USA, 2012. [Google Scholar]
- Duschek, W.; Kleinrahm, R.; Wagner, W. Measurement and correlation of the pressure, density, temperature relation of carbon dioxide I. The homogeneous gas and liquid regions in the temperature range from 217 K to 340 K at pressures up to 9 MPa. J. Chem. Thermodyn. 1990, 22, 827–840. [Google Scholar] [CrossRef]
- Zhao, D.Y.; Zhang, J.; Li, Z.M.; Li, Q.F.; Liu, H.L.; Lu, S.J. An engineering–Economic model for CO2 pipeline transportation in China. Int. J. Comput. Appl. Technol. 2014, 49, 60–68. [Google Scholar] [CrossRef]
- Perry, R.H.; Green, D.W. Perry’s Chemical Engineers’ Handbook, 8th ed.; McGraw-Hill, Inc.: New York, NY, USA, 2008; ISBN 9788578110796. [Google Scholar]
- Zhang, D.; Wang, Z.; Sun, J.; Zhang, L.; Li, Z. Economic evaluation of CO2 pipeline transport in China. Energy Convers. Manag. 2012, 55, 127–135. [Google Scholar]
- Wang, M.; Xu, J. Application of liquid CO2 fire-Extinguishing technique in Gongquan coal mine. Saf. Coal Mines 2017, 48, 125–131. [Google Scholar]
- Guan, X.J. Research of the Liquid CO2 Injection for Fire Prevention and Extinguishing in the Open Goaf. Master’s Thesis, Xi’an University of Science and Technology, Xi’an, China, June 2016. [Google Scholar]
- Li, X.Y.; Shen, G.H.; Xu, C.L.; Liu, G.J. Inhibition of violent oxidation of floating coal by carbon dioxide in intake side of goaf. Saf. Coal Mines 2018, 49, 72–75. [Google Scholar]
- Li, Q.Q. Research on Some Questions of Cold Stretching Technology in Austenitic Stainless Steel Pressure Vessels. Master’s Thesis, Zhejiang University, Hangzhou, China, June 2016. [Google Scholar]
© 2019 by the authors. Licensee MDPI, Basel, Switzerland. This article is an open access article distributed under the terms and conditions of the Creative Commons Attribution (CC BY) license (http://creativecommons.org/licenses/by/4.0/).