Article

Experimental Investigation of Grout Nonlinear Flow Behavior through Rough Fractures

1
School of Mechanics and Civil Engineering, China University of Mining and Technology, Xuzhou 221116, China
2
State Key Laboratory for Geomechanics and Deep Underground Engineering, China University of Mining and Technology, Xuzhou 221116, China
3
GeoEnergy Research Centre (GERC), University of Nottingham, Nottingham NG7 2RD, UK
4
The Fifth Project Co., Ltd. of China Railway Bureau 14 Group, Yanzhou 272117, China
5
Jiangsu Vocational Institute of Architectural Technology, Xuzhou 221116, China
*
Author to whom correspondence should be addressed.
Processes 2019, 7(10), 736; https://doi.org/10.3390/pr7100736
Submission received: 10 September 2019 / Revised: 5 October 2019 / Accepted: 8 October 2019 / Published: 14 October 2019

Abstract

:
This research experimentally analyzed the impacts of various water cement (W/C) ratios of ultrafine cement grout material and normal loads FN applied to fractures on grout nonlinear flow behavior through a rough plexiglass fractured sample. An effective self-made apparatus was designed and manufactured to conduct the stress-dependent grout flow tests on the plexiglass sample containing rough fractures. At each W/C ratio, the grout pressure P increased from 0 to 0.9 MPa, and the normal loads FN ranged from 666.3 to 1467.8 N. The results of the experiments indicate that (1) the Forchheimer’s law can be used to express the results of grout nonlinear flow through rough fractures. Moreover, both nonlinear coefficient a and linear coefficient b in Forchheimer’s law decreased with the increase of the W/C ratio, but increased with the increase of the FN value. (2) For normalized transmissivity, with the increase of Re, the decline of the T/T0Re curves means that the grout flow behavior through the fracture mainly went through three stages: the viscosity effect, then the weak inertia effect, and finally the strong inertia effect. The three stages showed that with the increase of Re, the grout flow state changed from linear to nonlinear. Moreover, with the increase of the W/C ratio, the Forchheimer coefficient β decreased. (3) At a given FN, the critical grout hydraulic gradient Jc decreased, but the critical Reynolds number Rec increased as the W/C ratio increased; at a given W/C ratio, Jc increased, but Rec decreased as FN increased.

1. Introduction

Fractured rocks are widely distributed in underground engineering due to geological processes or excavation disturbance, which brings great safety hazard to engineering stability [1,2,3,4]. Grouting is an effective method for controlling groundwater inrush and improving the mechanical properties of fractured rocks in underground mining and engineering [5,6,7,8,9]. In order to acquire a better understanding of the grouting mechanism of fractured rock, many experimental studies have been performed in recent decades. For example, Sui, Liu [10] experimentally studied the sealing effect of permeation grouting into a sample fracture and the patterns of grout propagation under water flow conditions. They analyzed the effect of different parameters on the sealing effect, including the initial water flow speed, fracture aperture, grout take and gel time. Lee, Bang [11] investigated the reinforcement effect of jointed rock masses after grouting. The results show that after grouting, the stiffnesses of the filled joints were increased up to six times over those of the un-grouted joints, which means that the mechanical properties of the jointed rock masses after grouting were significantly improved compared to before. Funehag, Fransson [12] conducted extensive experimental studies and field measurements on the penetration grouting into fractured natural rocks, and obtained the diffusion radius of grout, taking the grout pressure and fracture aperture into account. Except for experimental studies, Kim, Lee [13] carried out many numerical analyses based on the UDEC to simulate the grout diffuse through smooth rock fractures. The results showed that the time-dependent evolution of the grout properties had important impacts on grout flow characteristics: if not considering the time-dependent hardening of grout material, the penetration length of grout would be overestimated, and meanwhile, the fracture opening caused by grout pressure also has an obvious effect on the penetration length of the grout and injected grout volume. Hässler, Håkansson [14] built a model to simulate grout propagation in fractured rock considering the time-dependent properties of the grout.
However, the research on grouting mechanisms has mainly focused on the grouting reinforcement and seepage prevention effect for the fractured rocks after grouting (e.g., permeability, mechanical properties, and sealing effect of grouted fractured rocks, as well as the penetration length and diffusion radius of the grout). There was less research on the flow behavior of cement grout through the rock fractures during the grout flow process before grout hardening. For the flow behavior through fractures, the studies are mostly concentrated in the water flow through fractures [15,16,17,18,19,20,21,22]. Many studies assumed that fluid flow through the fracture followed the cubic law, meaning a linear relationship between fluid pressure gradient and flow rate [23,24]. This cubic law is only applicable to laminar flow through the smooth fracture. For a higher fluid pressure gradient or more complex fractures in nature, fluid flow may show the nonlinear characteristics. Many experimental studies have been carried out for explaining the issue. Yin, Ma [25] studied the effects of shear processes on nonlinear flow behavior through 3D rough-walled rock fractures, which showed that the relationship between the volumetric flow rate and hydraulic gradient can be well analyzed by using Forchheimer’s law, with the hydraulic pressure ranging from 0 to 0.6 MPa, and the normal load varying from 7 to 35 kN. Rong, Hou [26] experimentally studied the nonlinear flow characteristics in non-mated rock fractures under normal stresses ranging from 1.0 to 5.0 MPa, which obtained the nonlinear flow characteristics parameters such as the critical Reynolds number, Forchheimer’s linear coefficient, and nonlinear coefficient. Zhang, Nemcik [27] studied the fluid flow regimes and nonlinear flow characteristics through both mated and non-mated sandstone fractures in triaxial cell under with confining stress from 1.0 to 3.5 MPa. The regression analyses of experimental data showed that both Forchheimer’s equation and Izbash’s law provided nice descriptions for the nonlinear fracture flow process. Dippenaar, Rooy [28] conducted the research on the cubic law and variably saturated flow through discrete open rough-walled discontinuities. They found that the roughness and aperture of open fractures have important effects on the fluid flow behavior, and that the fluid flow may deviate from the cubic law, which resulted in the nonlinear fluid behavior. From these studies, it can be seen that the stress and fracture morphology have important effects on the water flow behavior through fractures. However, in regard to grout flow through fractures, the stress-dependent nonlinear flow mechanisms through the rough fracture are still not fully understood. This flow mechanism of grout through the fracture directly affected the final grout diffusion, and thus the reinforcement and anti-seepage effects of fractured rock mass. Therefore, the flow characteristics of grout in rock mass fractures with different grout pressures and normal loads should be concerned.
In this paper, the stress-dependent nonlinear flow behaviors through the rough fracture were investigated. In order to carry out the grout flow experiments on the plate samples with fractures made of high transparency plexiglass, an effective self-made apparatus was designed and manufactured. The plexiglass sample (490 × 120 × 20 mm in size) which contains a rough fracture for D = 1.5 (the fractal dimension D was used to characterize the fracture rough morphology) was prepared. The fracture rough morphology was cut by using a high-precision laser-cutting machine. A series of tests of cement grout flow through the rough fracture were performed with different grout pressures varying from 0 to 0.9 MPa, different normal loads ranging from 666.3 to 1467.8 N, and different W/C ratios (0.8, 1.0, 1.2, 1.5, and 2.0) of the ultrafine cement grout. From the test results, the cement grout nonlinear flow behavior through rough rock fractures were studied. The nonlinear flow behavior (J-Q), the nonlinear flow regime, nonlinear and linear coefficients (a and b), normalized transmissivity (T/T0-Re), Forchheimer coefficient ( β ), critical hydraulic gradient (Jc), and critical Reynolds number (Rec) of grout flow through fractures were obtained.

2. Theoretical Background

2.1. The Cube and Forchheimer’s Law

For Newtonian fluid (e.g., water), the flow behavior through rock fracture is governed by the Navier–Stokes (NS) equations and the mass conservation equation, which is shown as follows [29]:
ρ ( u ) u = P + μ 2 u
u = 0
In which u represents the flow velocity vector; ρ represents the fluid density; μ represents the dynamic viscosity, and P represents the total hydraulic pressure. Nevertheless, the theory of flow through rough rock fractures has not been widely used because of the fracture roughness and nonlinear flow characteristics [30]. The existence of the complex nonlinear partial differential equations and irregular rock fracture geometry makes it very difficult to solve the NS equation through real rough fractures [31,32]. In order to simplify the calculation, some flow equations with assumed conditions were proposed, among which the best-known equation is the cube law, which neglects the inertial terms of fluid flow behavior [33].
The characteristic of the natural rough fractures under stress conditions makes the actual flow rate seriously inconsistent with the result obtained by using the cubic law mentioned above, and may cause the nonlinear flow behavior of fluid. Forchheimer’s law was accepted by most researchers for studying the fluid nonlinear flow behavior [34,35,36]:
P = A Q 2 + B Q
In which A and B represent the pressure drop components that are caused by nonlinear and linear effects, respectively. These two coefficients are related to the fracture geometry and hydraulic gradient. In this paper, it is worth noting that although the grout is also a liquid before hardening, the flow behavior of grout through the rock fracture is more complex than the water: because of the existence of the cement in grout, the physical properties of grout (e.g., viscosity and density) are obviously different from those of water. From the theory of hydraulics, Equation (3) can be converted to:
J = a Q 2 + b Q
where J is the hydraulic gradient; a = A ρ g and b = B ρ g .

2.2. Normalized Transmissivity

The transmissivity T was used to assess the nonlinear flow regimes of fractured rock samples [37,38]. T is a constant in Darcy’s law. However, in this study, for grout nonlinear flow through rough fractures with different W/C ratios and normal loads FN, T was variable:
P = μ T Q
For evaluating the flow behavior through the rock fractures, using the Reynolds number (Re) (ratio of inertial forces to viscous forces) to quantify the onset of nonlinear flow:
R e = ρ Q / μ w
In order to analyze nonlinear flow behavior through the fracture, T0 and T were introduced in the research [37], in which the Forchheimer formula (Equation (3)) was rewritten:
T T 0 = 1 1 + β R e
where T0 (the flow rate was so low that the inertial force was negligibly small) refers to the intrinsic transmissivity, and T refers to the apparent transmissivity. β is the Forchheimer coefficient, which is expressed as β = a w μ / ( b ρ ) .

2.3. Critical Grout Hydraulic Gradient and Reynolds Number

As is known to all, the flow regime does not conform to the linear Darcy’s law under higher fluid flow velocity (higher pressure gradient p ) [39,40,41]. In order to further illustrate the non-Darcy flow mechanism of fluid flow through rough fractures and quantify the degree of the nonlinear flow effect, a factor E was proposed by Zeng and Grigg [42]:
E = a Q 2 / ( a Q 2 + b Q )
where a Q 2 and b Q were the energy losses caused by the inertial and viscous dissipation in the fractures, respectively. The factor E expressed the percentage of the grout hydraulic gradient drop related to the nonlinear term aQ2 to the total grout hydraulic gradient. For grout flow through rock fractures, nonlinear flow effects may become more obvious when the grout flow velocity increased at the grout inlet. Previous studies have shown that in practical engineering, when the critical factor E was larger than 10%, the nonlinear term aQ2 can’t be ignored [43,44]. Therefore, E = 0.1 was selected to assess the flow regime through fractures, and the corresponding J and Re are called the critical hydraulic gradient Jc and critical Reynolds number Rec, respectively.

3. Testing Program

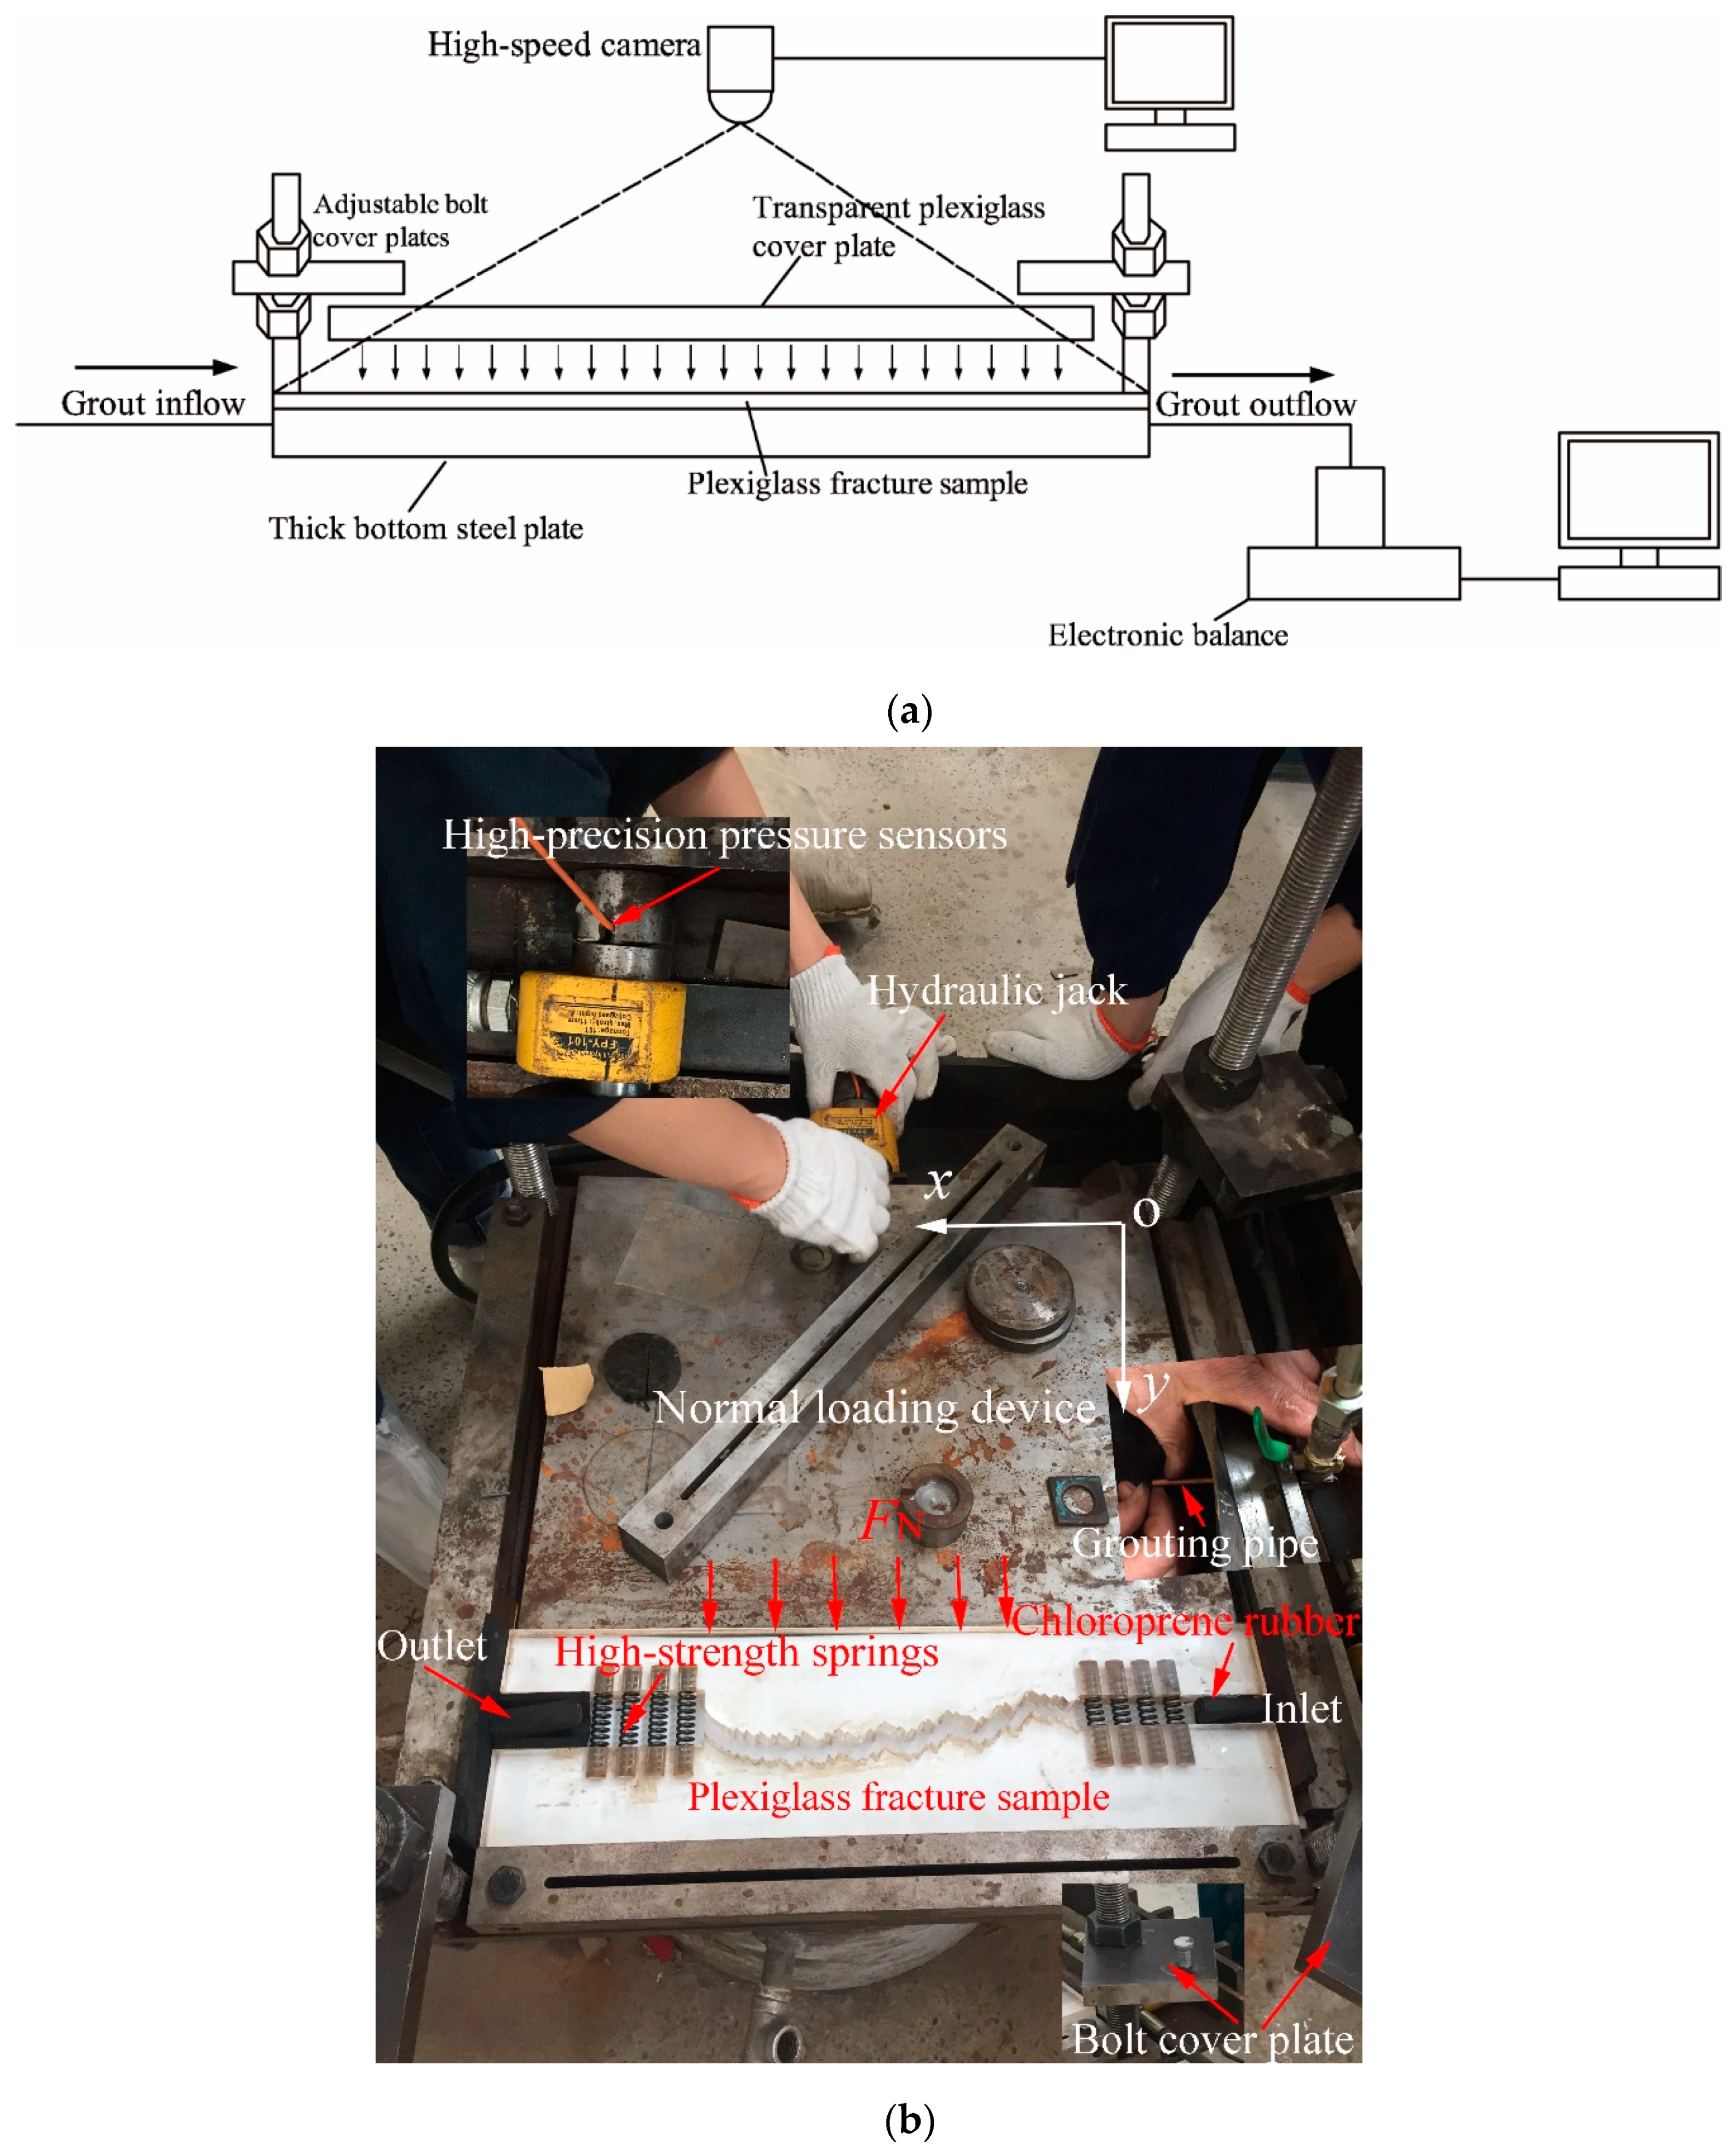
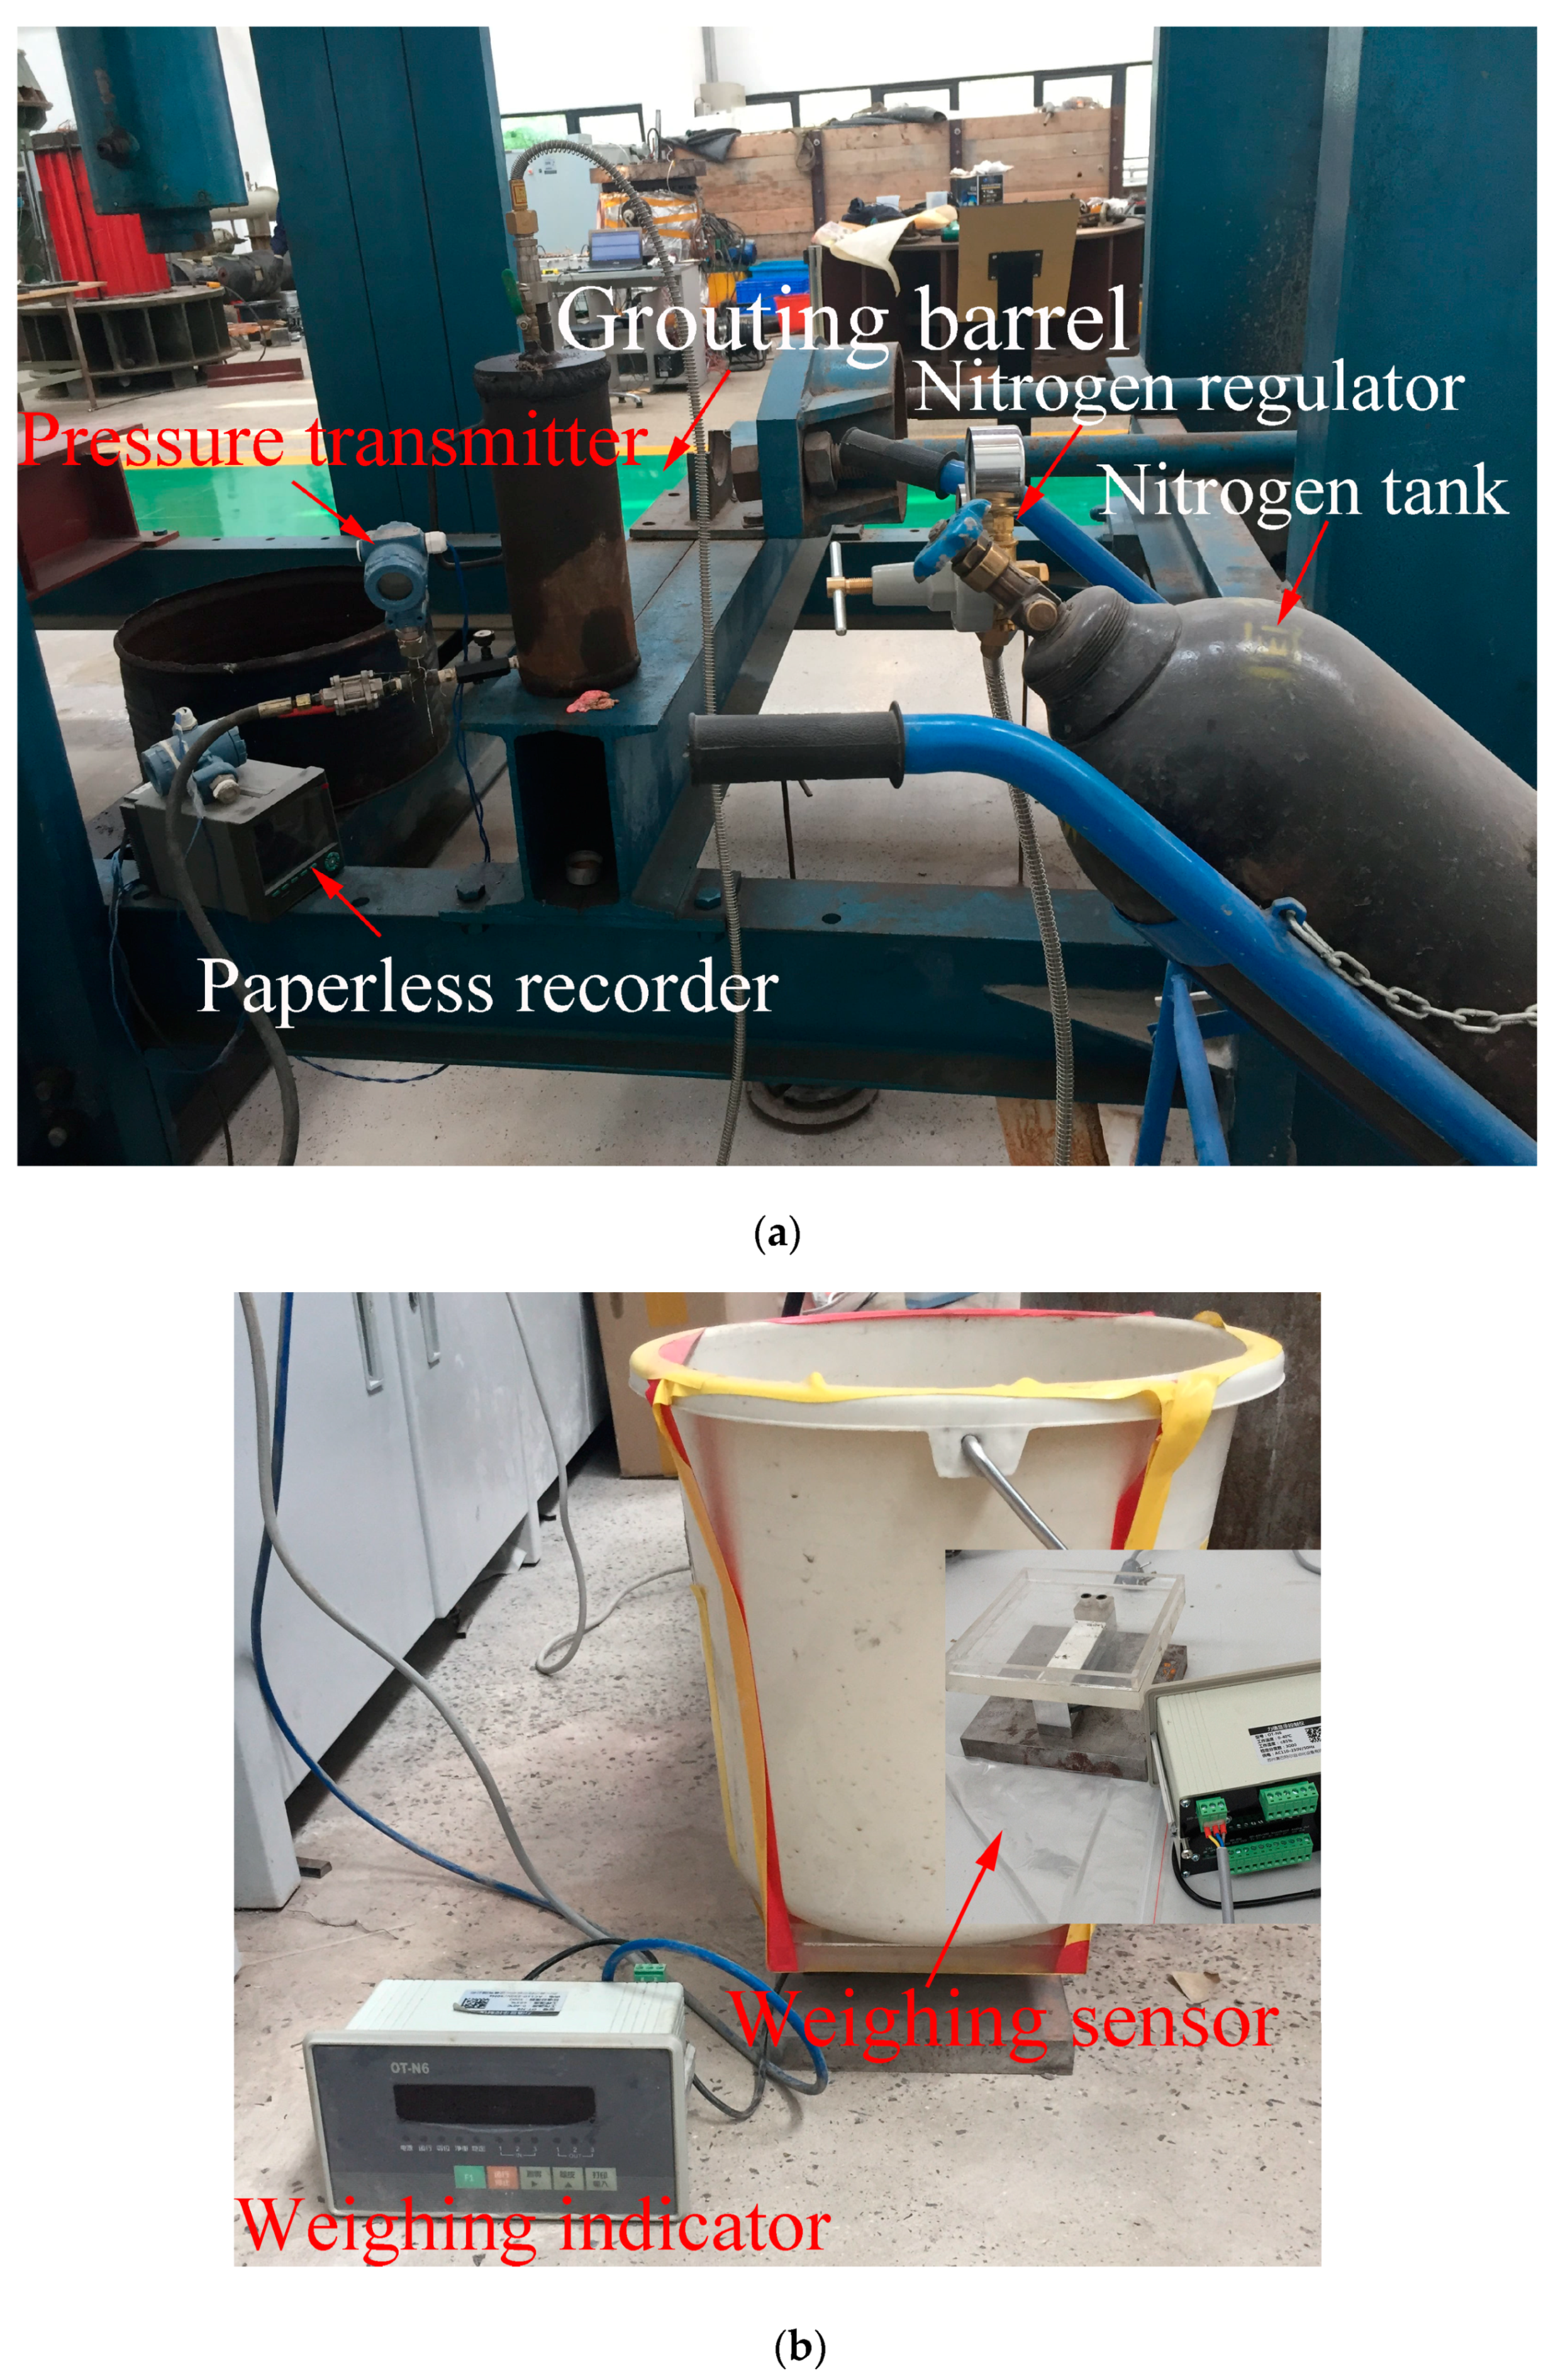
3.1. Grout Flow Testing System

A high-precision and effective sealing self-made apparatus was used to study the stress-dependent grout flow through fractured rocks (Figure 1 and Figure 2). The experimental apparatus mainly contains three parts:
(1) A platform for grout flow through fractured rocks
From Figure 1a,b, the thick bottom steel plate (500 × 500 mm × 40 mm) can be used for the placement of the fractured rock sample. The normal loading device (480 × 480 × 20 mm) connected to the hydraulic jack provided the normal load FN to the fracture containing high-strength springs. Due to the existence of springs, various fracture apertures were produced by different normal loads FN. Meanwhile, the grouting pipes (5 mm in internal diameter and 9 mm in length) passing through the rectangular holes belonging to another loading device providing tangential force were inserted into the fracture and tightly sealed by using CR4305 chloroprene rubber [45,46,47], which ensured the sealing effect of the fracture and prevented the grout overflowing from the entrance of the fracture (Figure 1b). A plexiglass cover plate with high intensity and transparency (pressed under two adjustable bolt cover plates, as shown in Figure 1a,b) placed on the sample was used to balance the vertical grout pressure in the fracture, as well as the role in the seal of the fracture and the visual monitoring of the grout flow through the fracture. Before the test, the plexiglass fractured sample (490 × 120 × 20 mm in size) containing a rough fracture for which D = 1.5 was placed on the platform, and then the horizontal and vertical loads were applied to the fractured sample boundaries.
(2) Grout supply and real-time data and image acquisition system
In order to obtain the stable grout pressure, the high-precision nitrogen regulator was installed on the nitrogen tank to achieve stable nitrogen source pressure (Figure 2a). Then, the stable nitrogen drove the grout to flow at a steady pressure in a certain amount of time. The grout pressure P ranged from 0–0.9 MPa, which provided a different grout pressure gradient P required for the tests of grout flow through fractures. The real-time data acquisition equipment consists of the high-precision pressure transmitter, paperless recorder (Figure 2a), and high precision self-made electronic balance (see Figure 2b), which were used to collect the real-time grout pressure P and volumetric flow rate Q, respectively.
(3) Load supply system
The horizontal (x- and y-directions) loads on the fractured rock sample were produced by using adjustable hydraulic jacks. The horizontal load device connected to the load jacks (pressure head) can apply normal uniform loads to the boundaries of the fractured rock sample. Moreover, the high-precision pressure sensors installed between the pressure head and the counterforce frames were used to feedback the values of the horizontal loads, thus guiding the adjustable hydraulic jacks to provide the fractured rock sample with accurate normal boundary loads. Vertical loads applied on the specimen surface created by the thicker transparent plexiglass cover plate were for balancing the vertical grouting pressure in the fracture, and then further sealing the fractured sample.

3.2. Grout Material

Based on the cement properties in the experiments, the grain size distribution curves of three kinds of cement, including fly ash cement (P.F 32.5), ordinary Portland cement (P.O 52.5), and ultrafine cement were shown in Figure 3. The results show that the average grain size of fly ash cement was the largest, and its grain mass percentage for grain sizes below 30 µm was only 18.2%, compared to 65.1% and 88.4% for the ordinary Portland cement and the ultrafine cement, respectively. These figures indicate that the grouts made of ultrafine cement can penetrate into smaller fractures more easily than the other two kinds of cement grouts, because the former contained substantial amounts of tiny cement grains. The ultrafine cement grouts have been widely used in the reinforcement for underground engineering in the past few decades due to its more stable physical and mechanical properties, greater range of strength adjustability, and better permeability, as well as non-polluting nature [48]. Therefore, the ultrafine cement grouts with W/C ratios of 0.8, 1.0, 1.2, 1.5, and 2.0 were selected in the experiment. The grout properties parameters including density and viscosity based on the grout properties tests were given in Table 1.

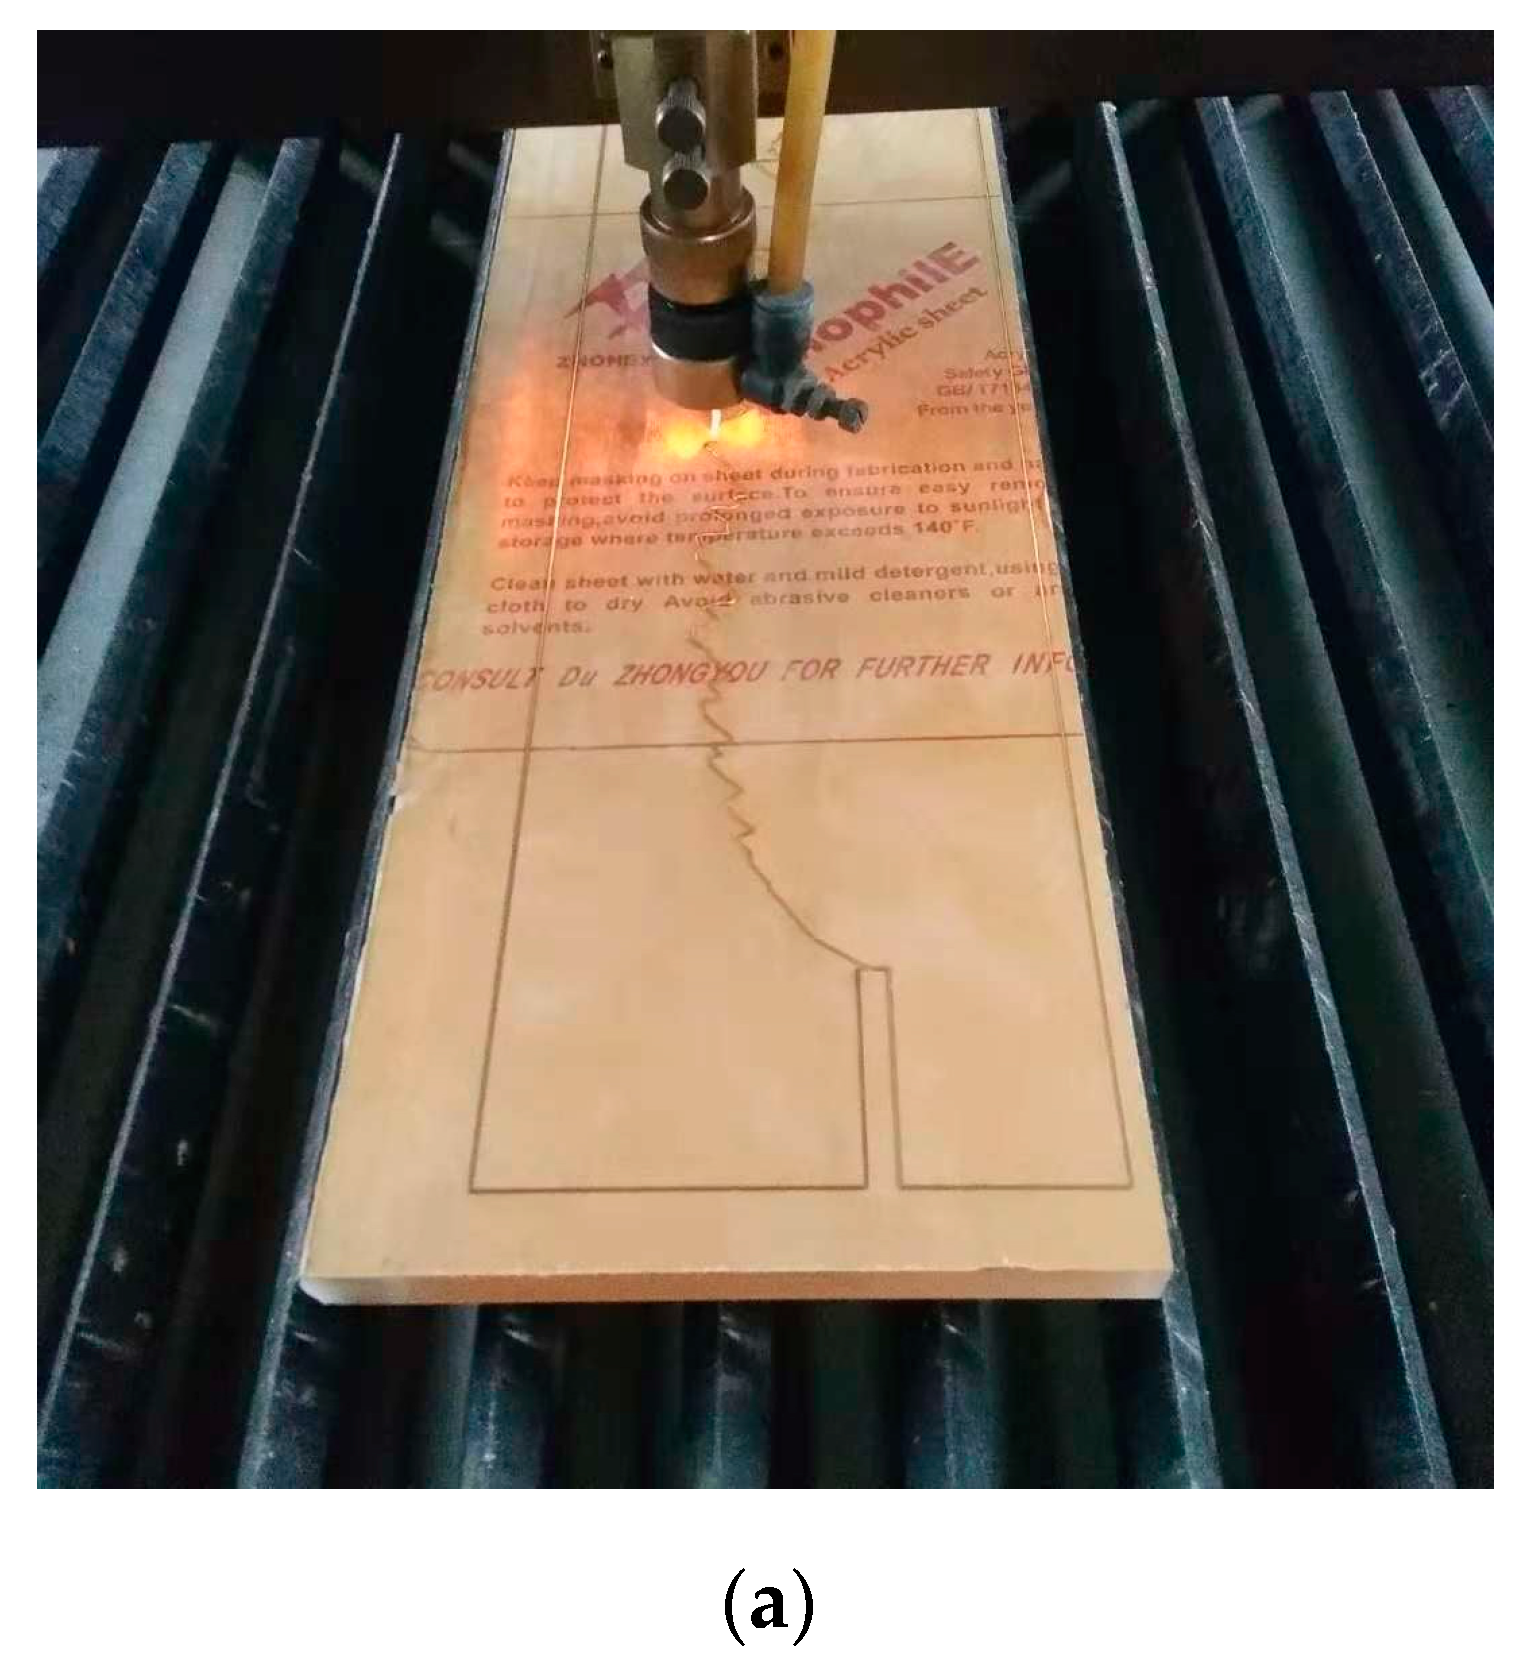
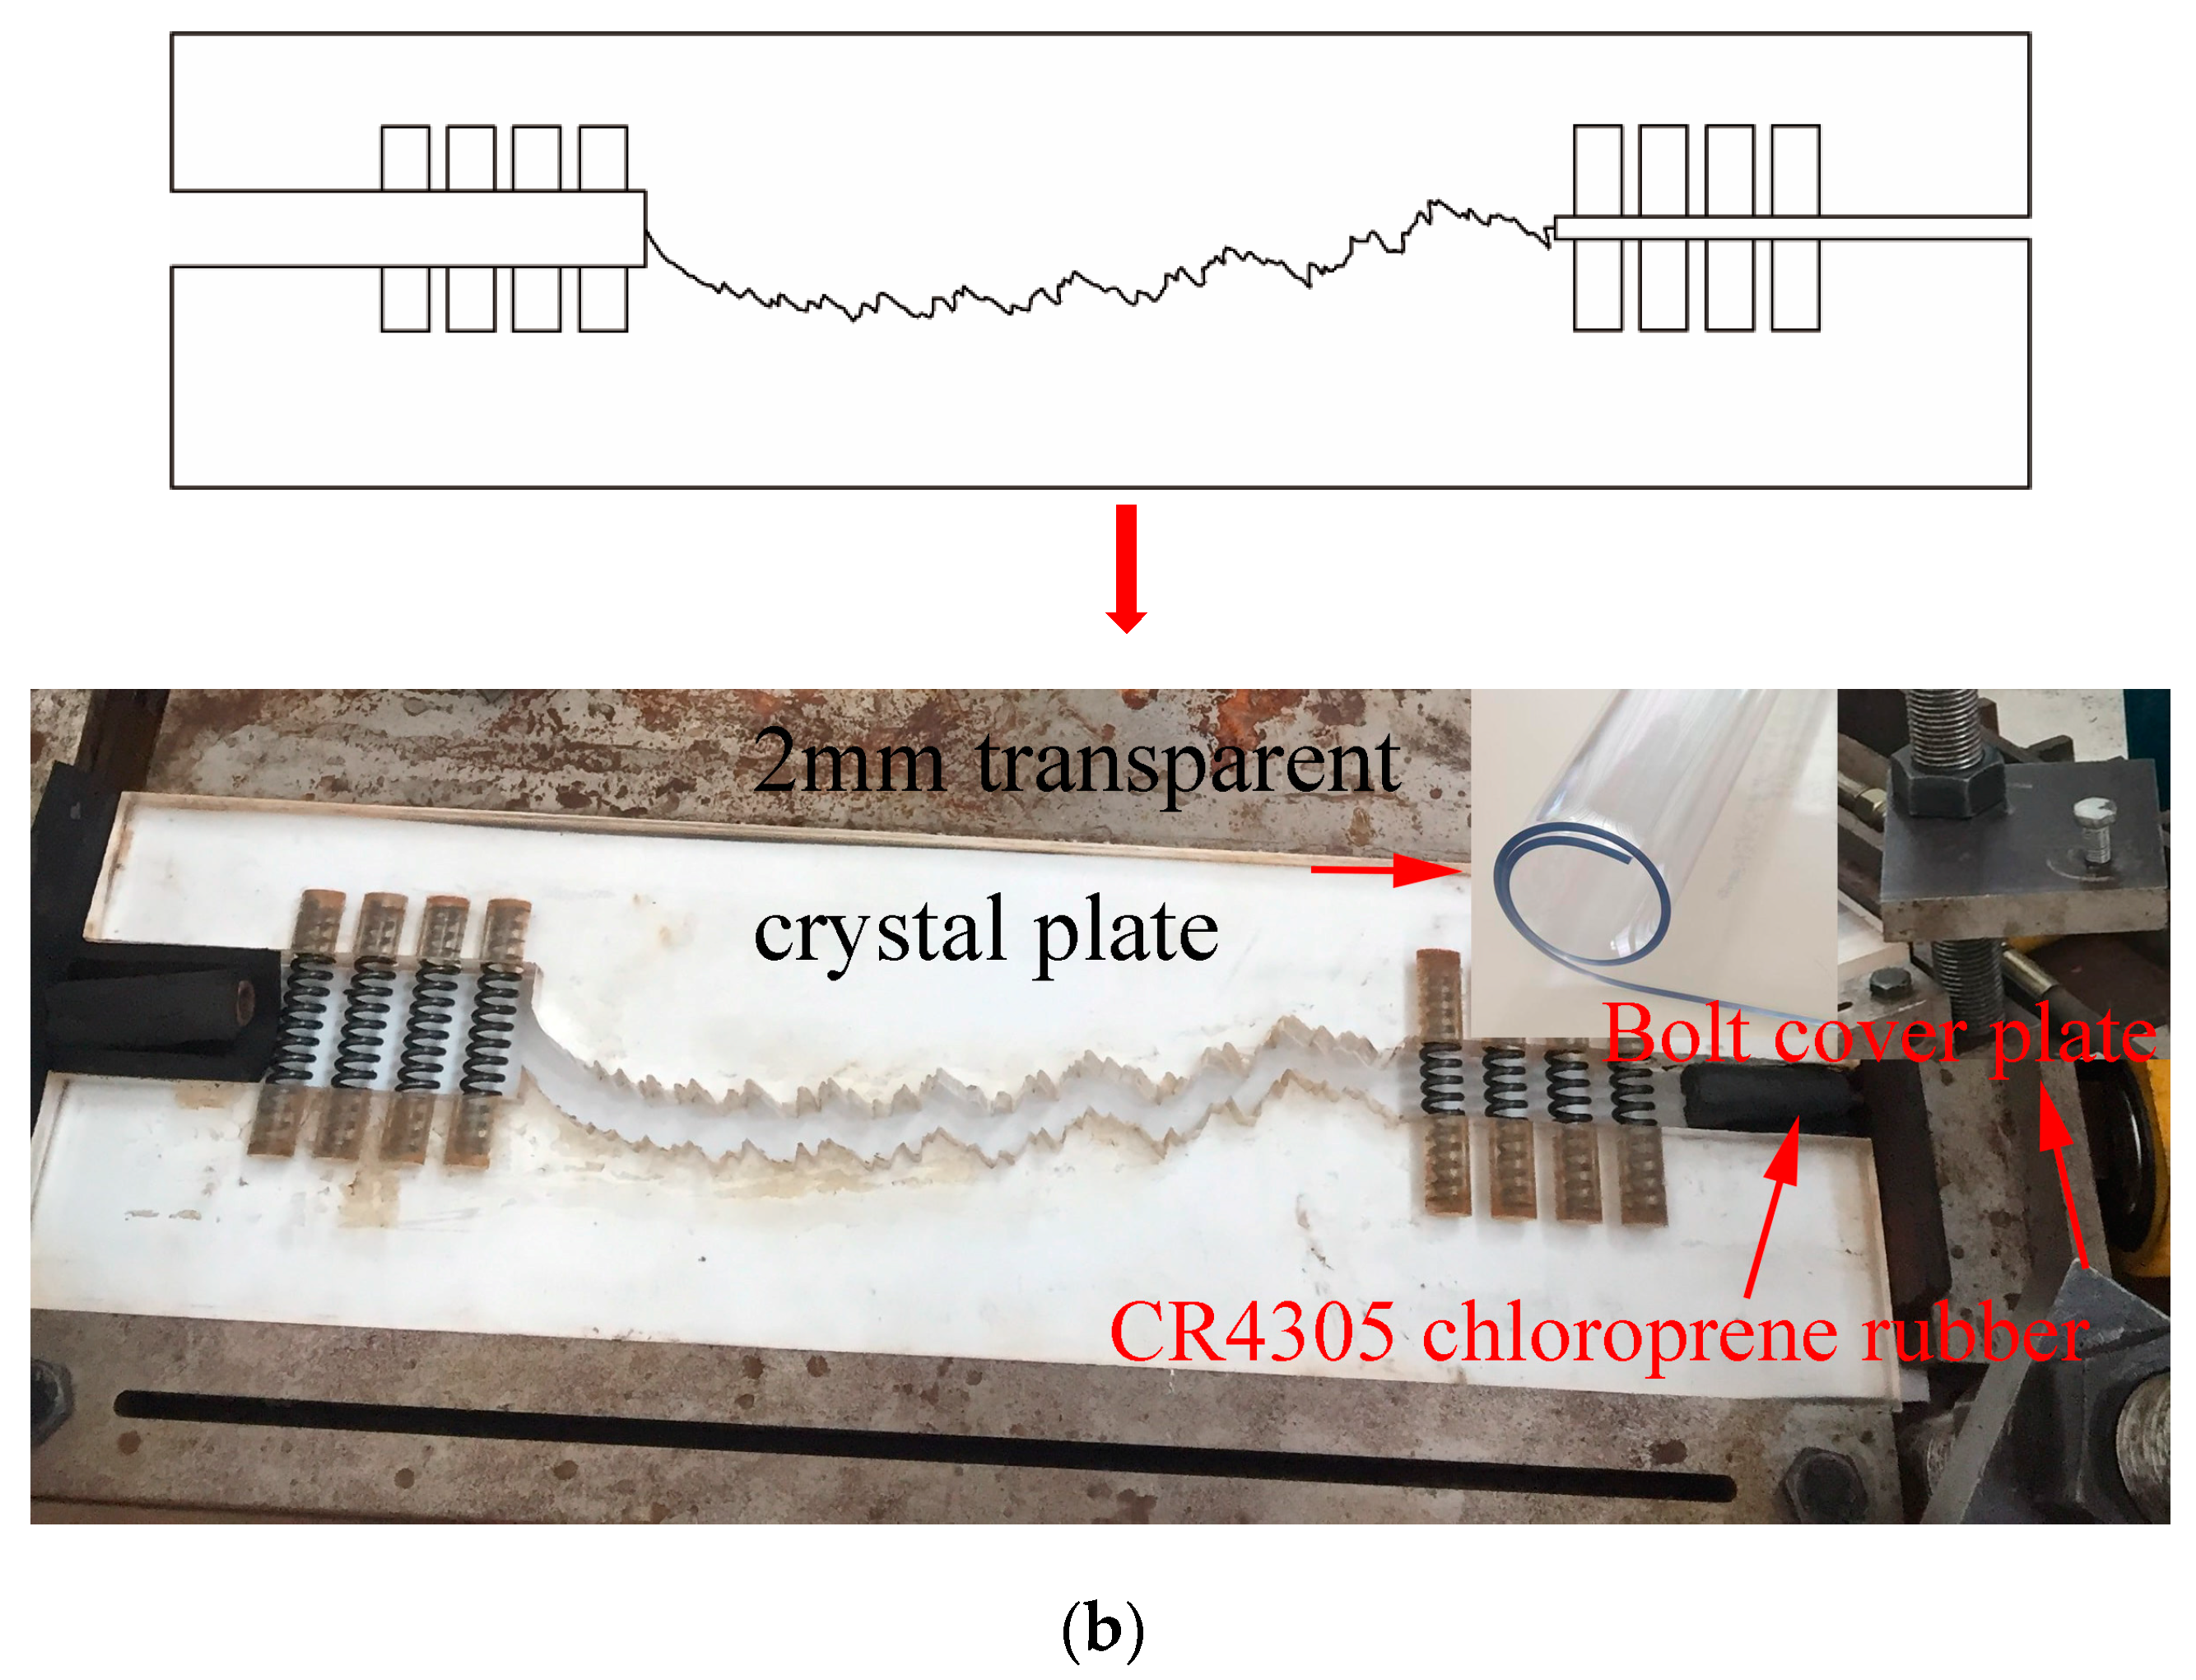
3.3. Fracture Design

In order to better carry out a visualization study of the grout flow process through fractures and preset the roughness of plexiglass fractures similar to that of natural fractures, the plate fractured rock samples (490 × 120 × 20 mm in size) made of high-transparency plexiglass were prepared. As is known to all, fracture morphologies are mostly irregular in practical engineering [49,50,51,52]. For simulating the irregular characteristics of fractures in nature, the fractal model for a single rough fracture based on the methodology was presented. The single fracture rough morphology was characterized by using the fractal dimension D, which was based on the Weierstrass–Mandelbrot fractal function [53]:
W ( t ) = n = ( 1 e i b n t ) e i φ n / b ( 2 D ) n
where the parameter b is a real number larger than 1, which reflects the degree of deviation of the curve from the straight line. φ n is an arbitrary phase angle, and the fractal dimension D ranges from 1 to 2. Taking the real part of the function W(t) as the fractal control function C(t):
C ( t ) = R e W ( t ) = n = ( 1 cos b n t ) / b ( 2 D ) n
where the function C(t) is a fractal curve which is continuous, non-differentiable, and D-dimensional. The fractal dimension satisfies:
D H B ( B b ) D D H B
where B denotes a constant. D H B denotes the Hausdorff–Besicovitch dimension. The fractal curve C i ( t ) with different fractal dimensions D i were generated by using MATLAB, and then the fractal fractures (rough morphologies) were cut according to the function C i ( t ) on the plexiglass mold by using the high-precision laser-cutting machine (Figure 4a). Fractal dimensions D = 1.0, D = 1.1, D = 1.2, D = 1.3, D = 1.4, and D = 1.5 represent different roughness of the fracture, in which D = 1.0 represents a flat and smooth fracture, and the higher the D, the higher the fracture roughness. In this paper, the fractal dimension D = 1.5 was chosen to represent the higher roughness of fractures (such as the plexiglass-fractured sample in Figure 4b). On the plexiglass sample, a reasonable setting of the sizes of inlet (outlet) and springs ensured the uniform distribution of normal loads on the sample boundary (see Figure 4b).

3.4. Sealing of the Fractured Sample

In order to ensure that no air or grout leakage occurred under grout pressure conditions, sealing of the fracture in the sample was the key to the success of the grouting test. After many attempts, the “CR4305 chloroprene rubber” was selected in this experiment, as shown in Figure 4b. The CR4305 chloroprene rubber is a compressible and waterproof material, which is compressed under normal loads, thus further sealing the entrance and exit of the fracture. A piece of transparent crystal plate with a designed size and 2-mm thickness was attached on the fractured sample, and then the fractured sample with the transparent crystal plate was covered with a high-strength and transparent plexiglass cover plate of a designed size and 30-mm thickness. When the fracture was preliminarily pressed tight by the transparent cover plate, the sealed fractured rock sample was placed on the platform, next to which the horizontal loading device was used to apply horizontal loads to the sample. In the grout flow testing apparatus, the transparent plexiglass cover plate provided uniform and powerful vertical loads generated by two strong bolt cover plates to further seal the fracture and balance the vertical grout pressure in the fracture.

3.5. Testing Procedure

The grout was stored in the grouting barrel connected to the nitrogen cylinder. Nitrogen adjusted by the high-precision nitrogen regulator can provide a stable propelling force for the grout, and thus the stable grout pressure was obtained for a certain period of time. The fracture inlet grout pressure P was increased from 0 to 0.9 MPa at small intervals. The fracture outlet volumetric flow rate Q was derived when the quality change rates of grout flowing out of the fracture was roughly the same. The real-time grout quality was obtained by the high-precision electronic balance.

4. Results and Analysis

4.1. Stress-Dependent Grout Flow Behavior through Rough Fracture

From the results of the experiments, there were obvious nonlinear characteristics in the relationship between J and Q. Therefore, the linear Darcy’s law is no longer adequate to characterize the grout nonlinear flow behavior through the rock fracture. The relationship between the grout hydraulic gradient J and the volumetric flow rate Q of grout flow through rough fractures with different grout W/C ratios subjected to various FN values ranging from 666.3 to 1467.8 N are displayed in Figure 5. Based on Equation (4), the experimental data were well fitted and analyzed by the Forchheimer law, as shown in Figure 5 and Table 2. The correlation coefficient values R2 for all cases were larger than 0.99, as given in Table 2, indicating that the experimental values agreed well with the fitting curves of the zero-intercept quadratic equation (taking Figure 5a as an example). Similarly, the second-order coefficients (the nonlinear coefficients) and first-order coefficients (linear coefficients) of all zero-intercept quadratic equations from Figure 5a to Figure 5e are shown in Table 2. From Figure 5, at a given FN, as the W/C ratio increased, all of the maximum volumetric flow rate Qmax values showed increasing trends, which means the W/C ratio of grout has an obvious impact on the grout flow through rough fractures. For example, Qmax was increased from 8.534 × 10⁻⁷ (W/C ratio of 1.0) to 2.529 × 10⁻⁶ (W/C ratio of 2.0), increasing by 1.96 times (FN = 1467.8 N); 1.085 × 10⁻⁶ to 2.344 × 10−5 by 20.60 times (FN = 1353.3 N); 4.306 × 10⁻⁶ to 8.237 × 10−5 by 18.13 times (FN = 1238.8 N); 1.410 × 10⁻⁵ to 3.310 × 10−4 by 22.48 times (FN = 1124.3 N); and 5.355 × 10⁻⁵ (W/C ratio of 0.8) to 2.81 × 10−3 by 51.47 times (FN = 666.3 N), respectively. Note that the grout with a W/C ratio of 0.8 has a large concentration, so its fluidity was not very good. In the experiment, only as the normal load was small (FN = 666.3 N) can the grout flow smoothly through the fracture; when the normal load increased, the grout with a W/C ratio of 0.8 cannot flow smoothly in the fracture, so this part of the data was not available. Meanwhile, at a given W/C ratio, as the FN increased, all of the maximum volumetric flow rate Qmax values showed decreasing trends, which means that the FN also has an obvious effect on the grout flow through rough fractures. For example, as FN ranged from 666.3 to 1467.8 N, the maximum volumetric flow rate Qmax decreased from 9.648 × 10⁻⁵ to 8.534 × 10⁻⁷, decreasing by 99.12% (W/C ratio of 1); 1.995 × 10⁻⁴ to 1.022 × 10⁻⁶, decreasing by 99.49% (W/C ratio of 1.2); 7.466 × 10⁻⁴ to 1.499 × 10⁻⁶, decreasing by 99.80% (W/C ratio of 1.5); and 2.81 × 10⁻³ to 2.529 × 10⁻⁶, decreasing by 99.91% (W/C ratio of 2.0).
From Figure 6, both nonlinear and linear coefficients a and b of all FN decreased as the W/C ratio increased. Moreover, the reduction extents for a and b within the W/C ratio ranging from 1 (0.8) to 1.5 were more obvious than those ranging from 1.5 to 2. However, both coefficients a and b showed increasing trends with the increase of FN, and the larger the FN value was, the larger the amplitude was, the trend of which was consistent with the existing experimental results of the flow behavior through the rough fracture by the reference [25]. Taking coefficients a and b for a W/C ratio of 1.0 under varying FN values as an example, a for FN = 1124.3, 1238.8, 1353.3, and 1467.8 N was 2.056 × 10¹¹, 2.016 × 10¹², 3.15 × 10¹³, and 4.739 × 10¹³, respectively, increasing by 30.27, 305.62, 4789.87, and 7206.60 times over the value of 6.575 × 10⁹ for FN = 666.3 N. Meanwhile, coefficient b for FN = 1124.3, 1238.8, 1353.3, and 1467.8 N was 1.616 × 10⁷, 5.393 × 10⁷, 2.201 × 10⁸, and 2.783 × 10⁸, respectively, increasing by 6.56, 24.22, 101.94, and 129.17 times over the value of 2.138 × 10⁶ for FN = 666.3 N.

4.2. Normalized Transmissivity Varying with Reynolds Numbers

Based on Equation (7), the relations between T/T0 and Re were fitted and analyzed with different W/C ratios and FN values, which were as shown in Figure 7. From Figure 7, for all cases, when Re was small, the viscous effect was dominant in the grout flow behavior, and T/T0 presented a horizontal straight line (close to 1.0), the stage of which was called the viscous stage (taking Figure 7a as example, red number 1). Therefore, at low Reynolds numbers, the grout flow behavior may follow the Darcy’s law. As the Re values increased, the inertial effect gradually increased, and T/T0 started to bend downward. However, during this stage, the overall grout flow behavior was still dominated by the viscous effect, and the inertial effect can be ignored, the stage of which was called the weak inertial effect stage (Figure 7a, red number 2). When Re increased to a certain value, T/T0 started to decline linearly due to the strong inertial effect. At this time, the inertial effect can’t be ignored, the stage of which was called the strong inertial effect stage (Figure 7a, red number 3). The variations in the T/T0Re curves showed that when the Reynolds number was small, the grout flow followed the linear flow law, while with the Reynolds number increasing gradually, the grout flow entered the nonlinear flow state. Meanwhile, for a certain W/C ratio, with the increase of normal load FN, the T/T0Re curves generally moved downward. Although there were two different fluids, the T/T0Re curves’ variation trends were in nice agreement with those in the study performed by Zimmerman [37].
From Figure 8, as the W/C ratio increased, β decreased. Using FN = 1353.3 N as an example, with the W/C ratio increasing from 1.0 to 2.0, β decreased from 0.01153 to 2.40908 × 10⁻⁴, or by 97.91%. However, within larger FN values (such as FN from 1467.8 to 1353.3 N), when the W/C ratios were smaller (ranging from 1.0 (0.8) to 1.5), as the W/C ratio increased, β decreased, and the rate of the decrease was larger. When the W/C ratios were larger (from 1.5 to 2.0), β decreased gradually and approached constant values. Within smaller FN values (such as 1238.8, 1124.3, and 666.3 N), β decreased gradually with the increasing W/C ratio and eventually approached constant values.

4.3. Critical Grout Hydraulic Gradient and Reynolds Number Analysis

The nonlinear flow effects may become more obvious when the grout flow velocity increased at the grout inlet. The nonlinear term aQ2 can’t be ignored if the critical factor E was larger than 10%. Based on Equation (8), E = 0.1 was selected to assess the flow regime through fractures, and the corresponding J and Re are called the critical hydraulic gradient Jc and critical Reynolds number Rec, respectively, the variations in which for all cases with different W/C ratios and FN values were as shown in Figure 9 and Table 2. From Figure 9a, at a given FN, as the W/C ratio increased, the Jc for all cases showed decreasing trends, meaning that the W/C ratio of grout has a significant impact on the flow regime through fractures. The reason for these variations may be as follows: with the increase of the W/C ratio, μ decreased (see Table 1). For fluid flow in a single fracture, from the cube law, the flow rate Q was inversely proportional to the dynamic viscosity μ , and then with the increase of the W/C ratio ( μ decreased), Q increased, which may lead to the flow regime through the fracture easily entering the nonlinear flow regime. Therefore, the increase of the W/C ratio caused the decrease of Jc. Taking FN = 1353.3 N as an example, Jc was 182.179 (W/C ratio of 1.2), 160.361 (1.5), and 107.439 (2.0), respectively, decreasing by 10.78%, 21.47%, and 47.38% over the Jc of 204.194 for a W/C ratio of 1.0. Moreover, at a given W/C ratio, Jc showed increasing trends with the increase in FN. Meanwhile, from Figure 9b, at a given FN, when the W/C ratio increased, the critical Reynolds number Rec for all cases showed increasing trends. Using FN = 1353.3 N as an example, Rec was 22.773 (W/C ratio of 1.2), 88.925 (1.5), and 533.548 (2.0), respectively, increasing by 1.21, 7.64, and 50.84 times over the Rec of 10.292 for W/C ratio of 1.0. Moreover, at a given W/C ratio, Rec showed increasing trends with the decrease in FN. It’s remarkable that the larger the W/C ratio was, the larger the amplitude was. For example, when the W/C ratio ranged from 1.0 (0.8) to 1.2, Rec increased slowly, but increased dramatically when ranged from 1.2 to 2.0 (especially FN = 1124.3 N and 666.3 N). Note that although it varied in the fluid materials, for a certain W/C ratio, Jc increased while Rec decreased with the increase of FN, the tendency of which was similar to that in the paper published by Yin [25]. However, the magnitude of Jc and Rec in this study were not the same as those in the reference [25], and the difference was about an order of magnitude (Jc and Rec in our research were larger), the possible reason of which may be: the fluid material was water in their study, while the fluid material was cement grout in our study. Due to cement grout having a higher viscosity than water, grout flow through the fracture starting to enter the nonlinear flow regime needs a larger grout flow rate (or higher grout hydraulic gradient J) than that of water, which means the Jc of grout would become larger.

5. Conclusions

The effects of various grout W/C ratios of ultrafine cement grout and normal loads FN on grout nonlinear flow behavior through rough plexiglass fractures were studied. An effective self-made apparatus was used for stress-dependent grout flow tests. The real-time data acquisition equipment, including the high-precision pressure transmitter, paperless recorder, and high-precision self-made electronic balance was developed to collect the real-time grout pressure P and volumetric flow rate Q, respectively. Several tests of grout flow through fractures were performed with different grout pressures (0–0.9 MPa) and normal loads FN (666.3–1467.8 N). Then, the nonlinear flow behavior (J-Q), the nonlinear flow regime, nonlinear and linear coefficients (a and b), normalized transmissivity (T/T0Re), Forchheimer coefficient ( β ), critical hydraulic gradient (Jc), and critical Reynolds number (Rec) of grout flow through fractures were obtained. The main results of this research were as follows:
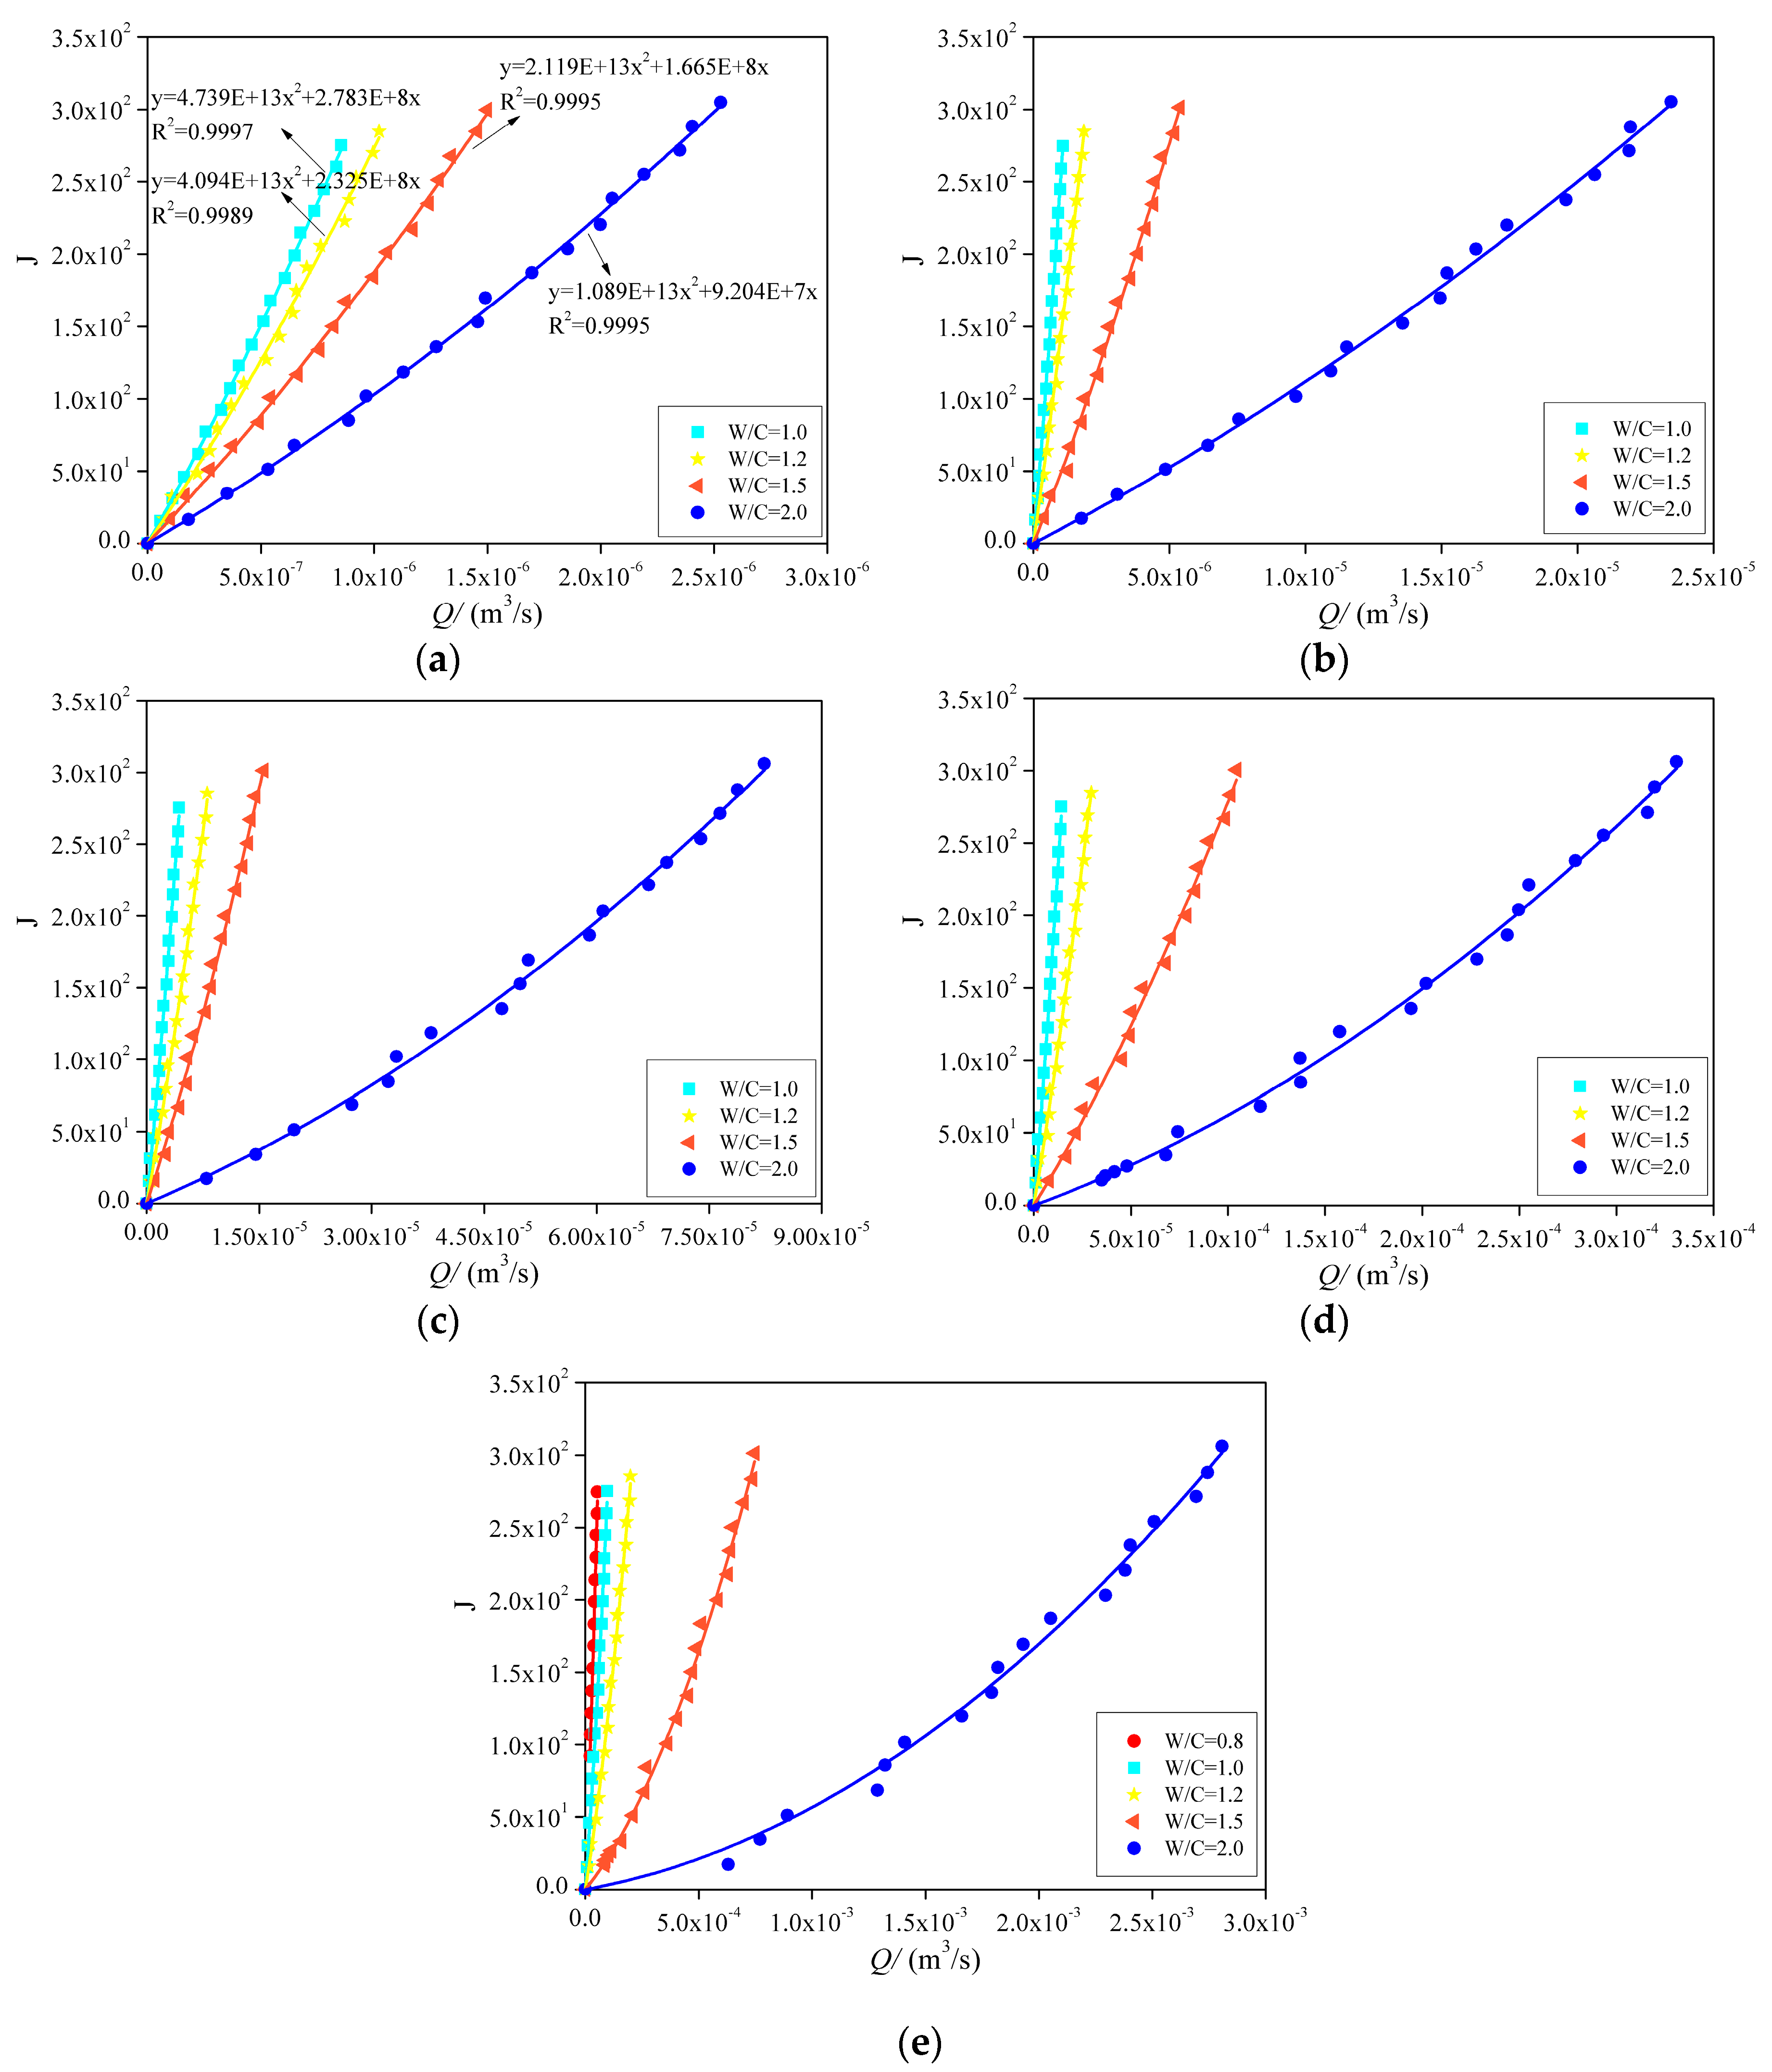
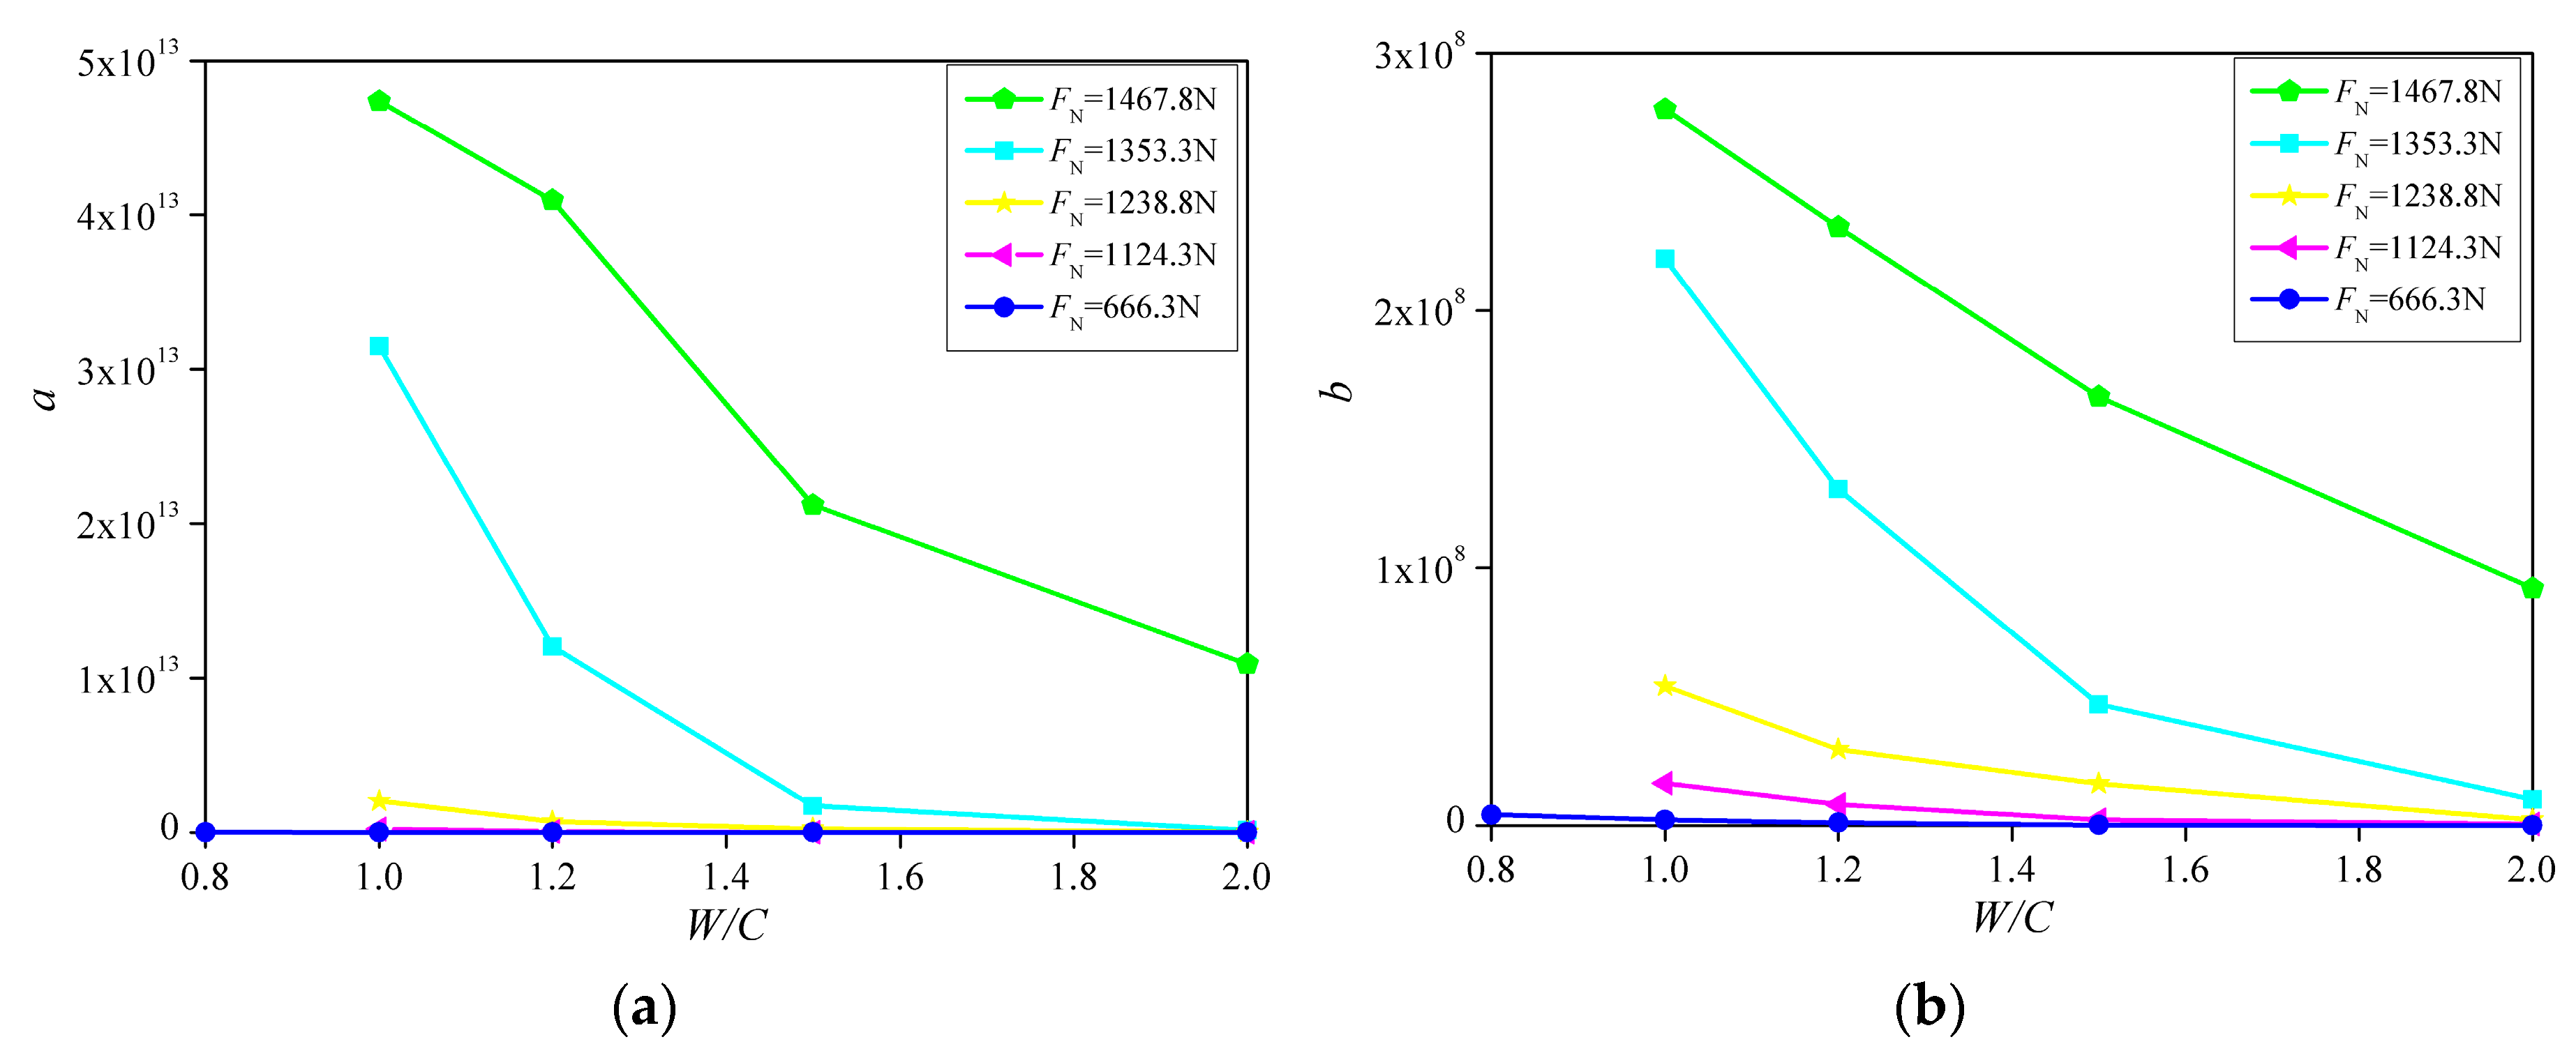
  • The grout hydraulic gradient J was nonlinear and dependent on the volume flow rate Q based on the grout flow tests, which was fitted by the Forchheimer’s law. With the increase of the W/C ratio, all of the maximum volumetric flow rates, Qmax, showed increasing trends, meaning that the W/C ratio of grout has an important impact on the grout flow through rough fractures. For example, Qmax was increased from 8.534 × 10⁻⁷ (W/C ratio = 1.0) to 2.529 × 10⁻⁶ (W/C ratio = 2.0), increasing by 1.96 times (FN = 1467.8 N); 1.085 × 10⁻⁶ to 2.344 × 10−5 by 20.60 times (FN = 1353.3 N); 4.306 × 10⁻⁶ to 8.237 × 10−5 by 18.13 times (FN = 1238.8 N); 1.410 × 10⁻⁵ to 3.310 × 10−4 by 22.48 times (FN = 1124.3 N); and 5.355 × 10⁻⁵ (W/C ratio = 0.8) to 2.81 × 10−3 by 51.47 times (FN = 666.3 N), respectively. Moreover, both the nonlinear coefficient (a) and linear coefficient (b) with all FN values decreased with the increasing W/C ratio, but increased with the increasing FN values, and the larger the FN was, the larger the amplitude.
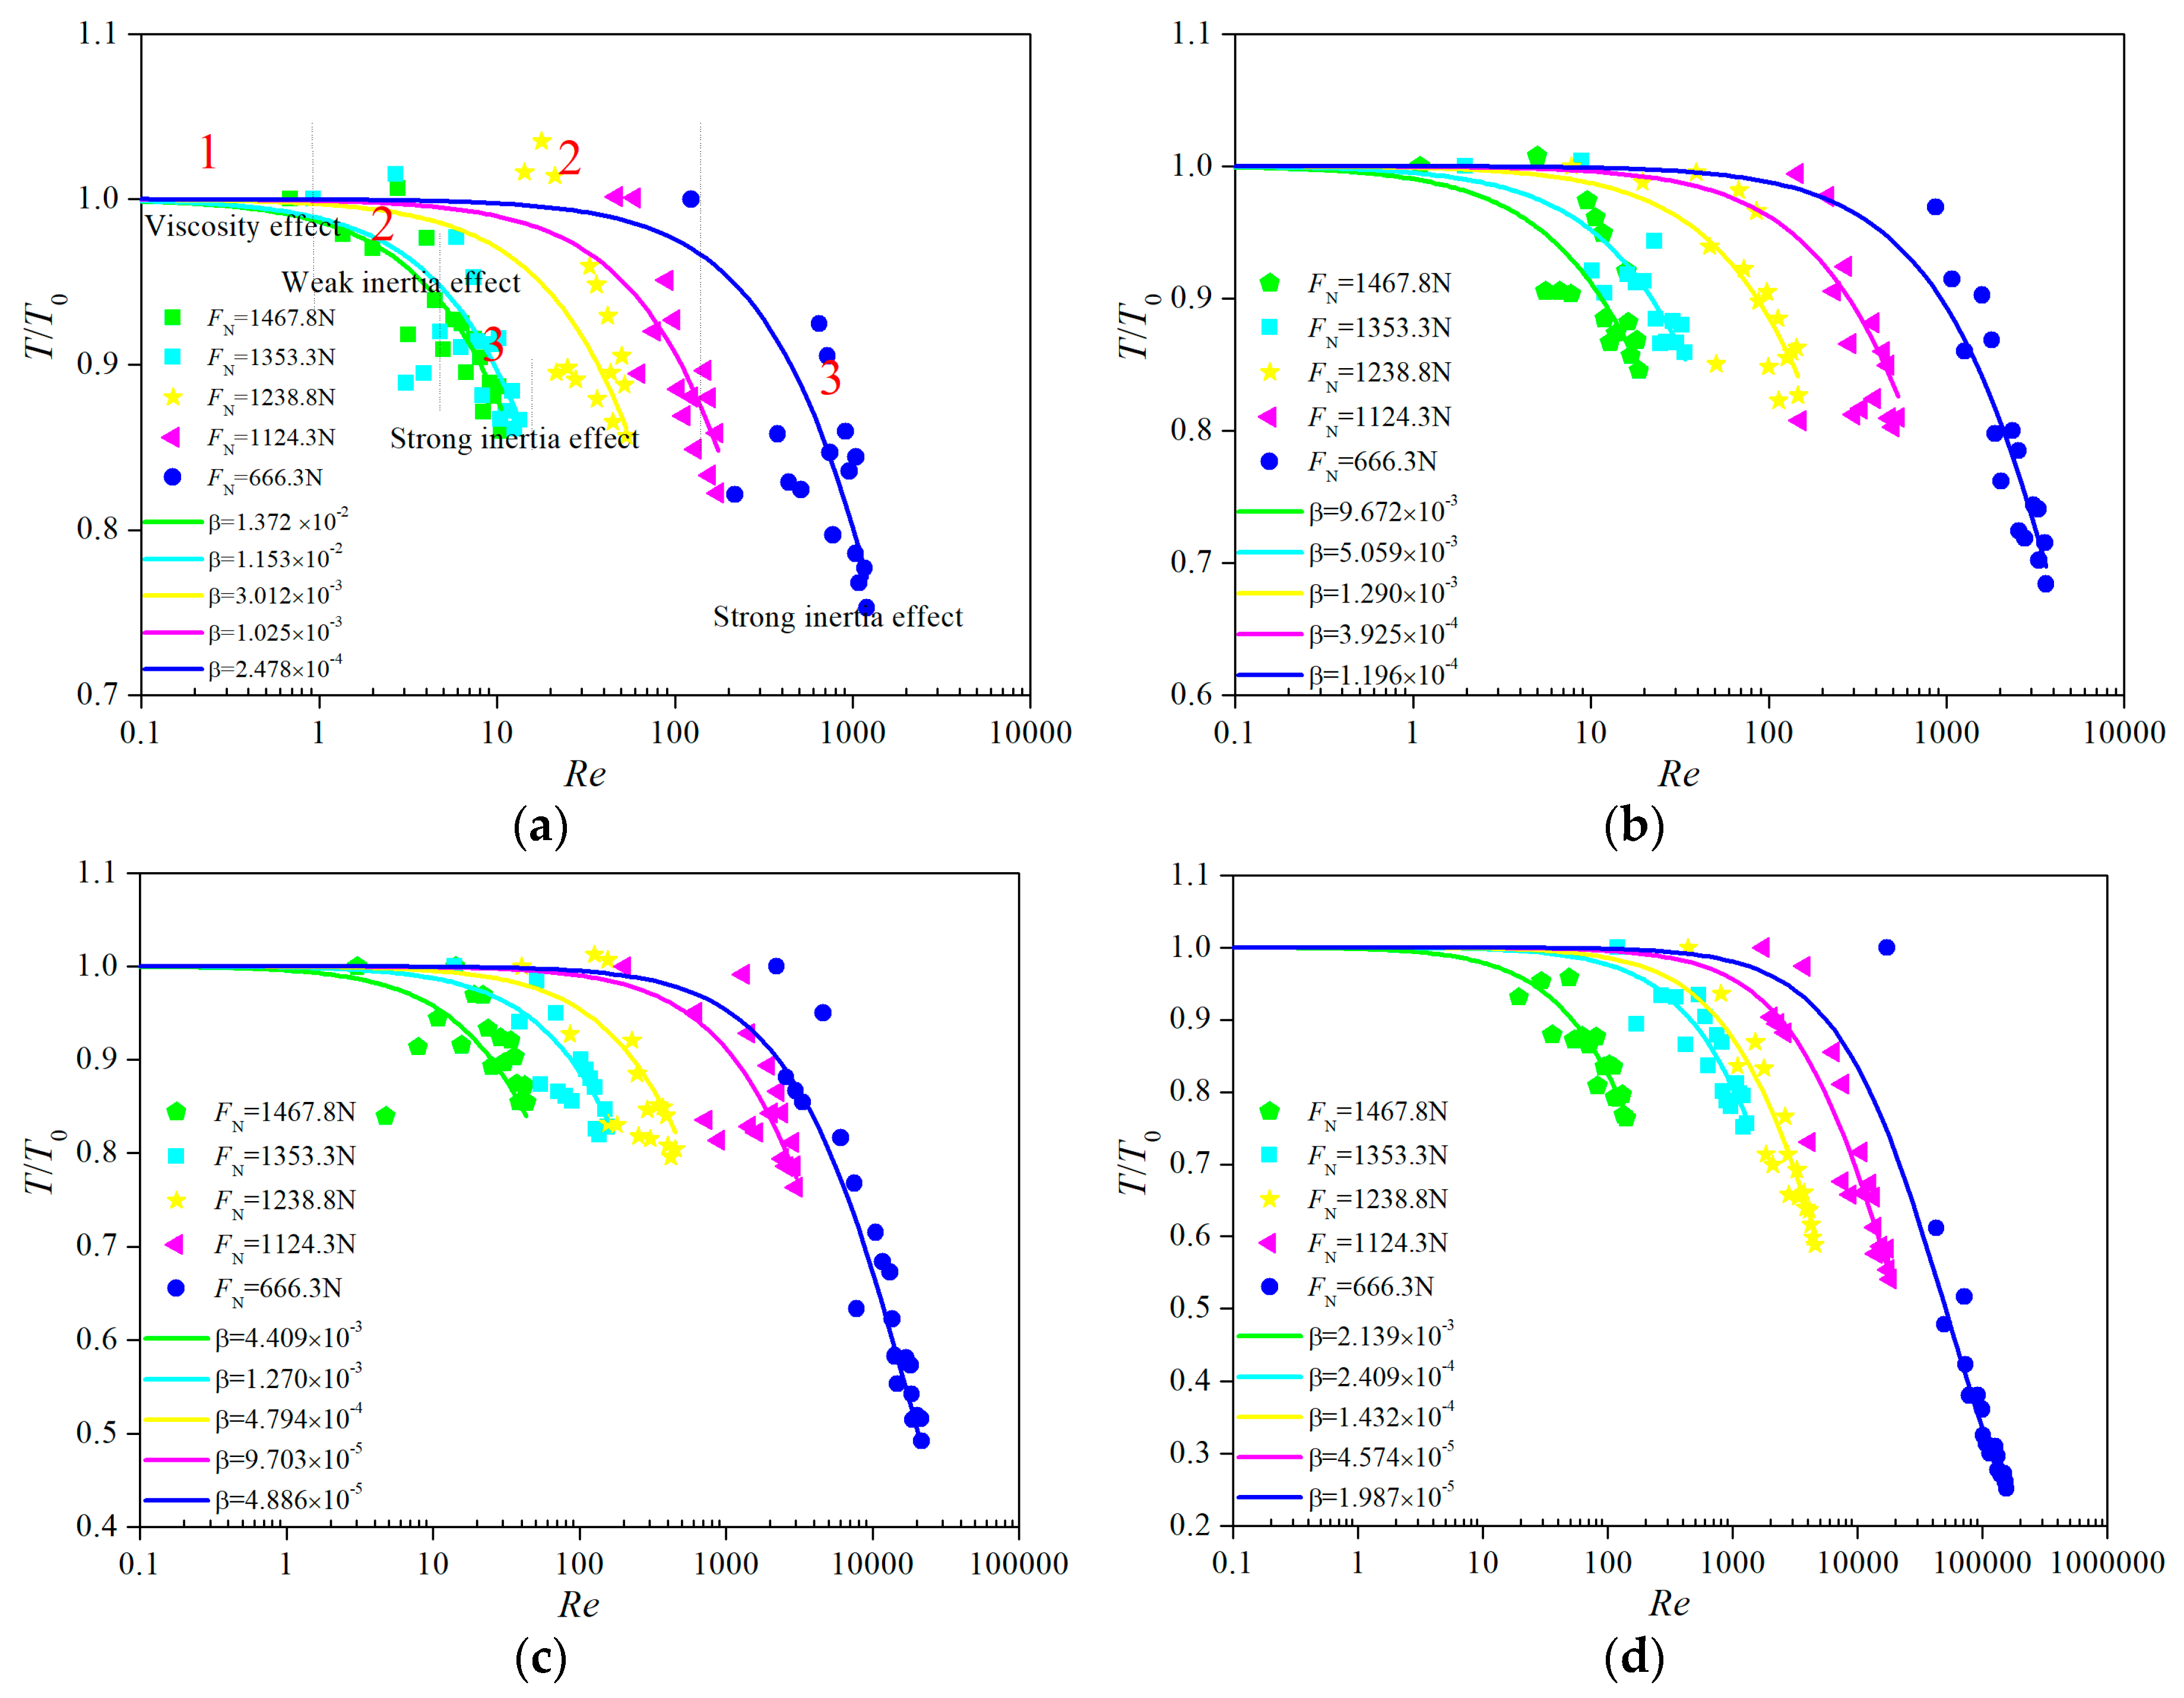
  • For normalized transmissivity, when the Re value was small, with the increase of Re, the T/T0Re curves presented a horizontal straight line (close to 1.0), the reason of which was that the viscous effect was dominant in the grout flow behavior through fractures; as the Re continued to increase, the T/T0Re curves started to bend downward. During this stage, the grout flow behavior was still dominated by the viscous effect, and the inertial effect can be ignored. When Re increased to a certain value, the T/T0Re curves started to decline linearly. During this stage, the inertial effect can’t be ignored, which became dominant in the grout flow behavior through fractures. The variations in the T/T0Re curves indicated that when the Reynolds number was small, the grout flow may follow the linear flow law, while as the Reynolds number increased gradually, the grout flow entered the nonlinear flow state. Moreover, for a certain W/C ratio, with an increasing normal load FN, the T/T0Re curves generally moved downward. The T/T0Re curve variation trends were in nice agreement with those in the flow behavior study performed by Zimmerman. Moreover, as the W/C ratio increased, the Forchheimer coefficient β decreased. However, within larger FN, when the W/C ratios were smaller, as the W/C ratio increased, β decreased, and the rate of the decrease was larger. When the W/C ratios were larger, β decreased gradually and approached constant values. Within smaller FN values, β decreased gradually with increasing W/C ratios and eventually approached constant values.
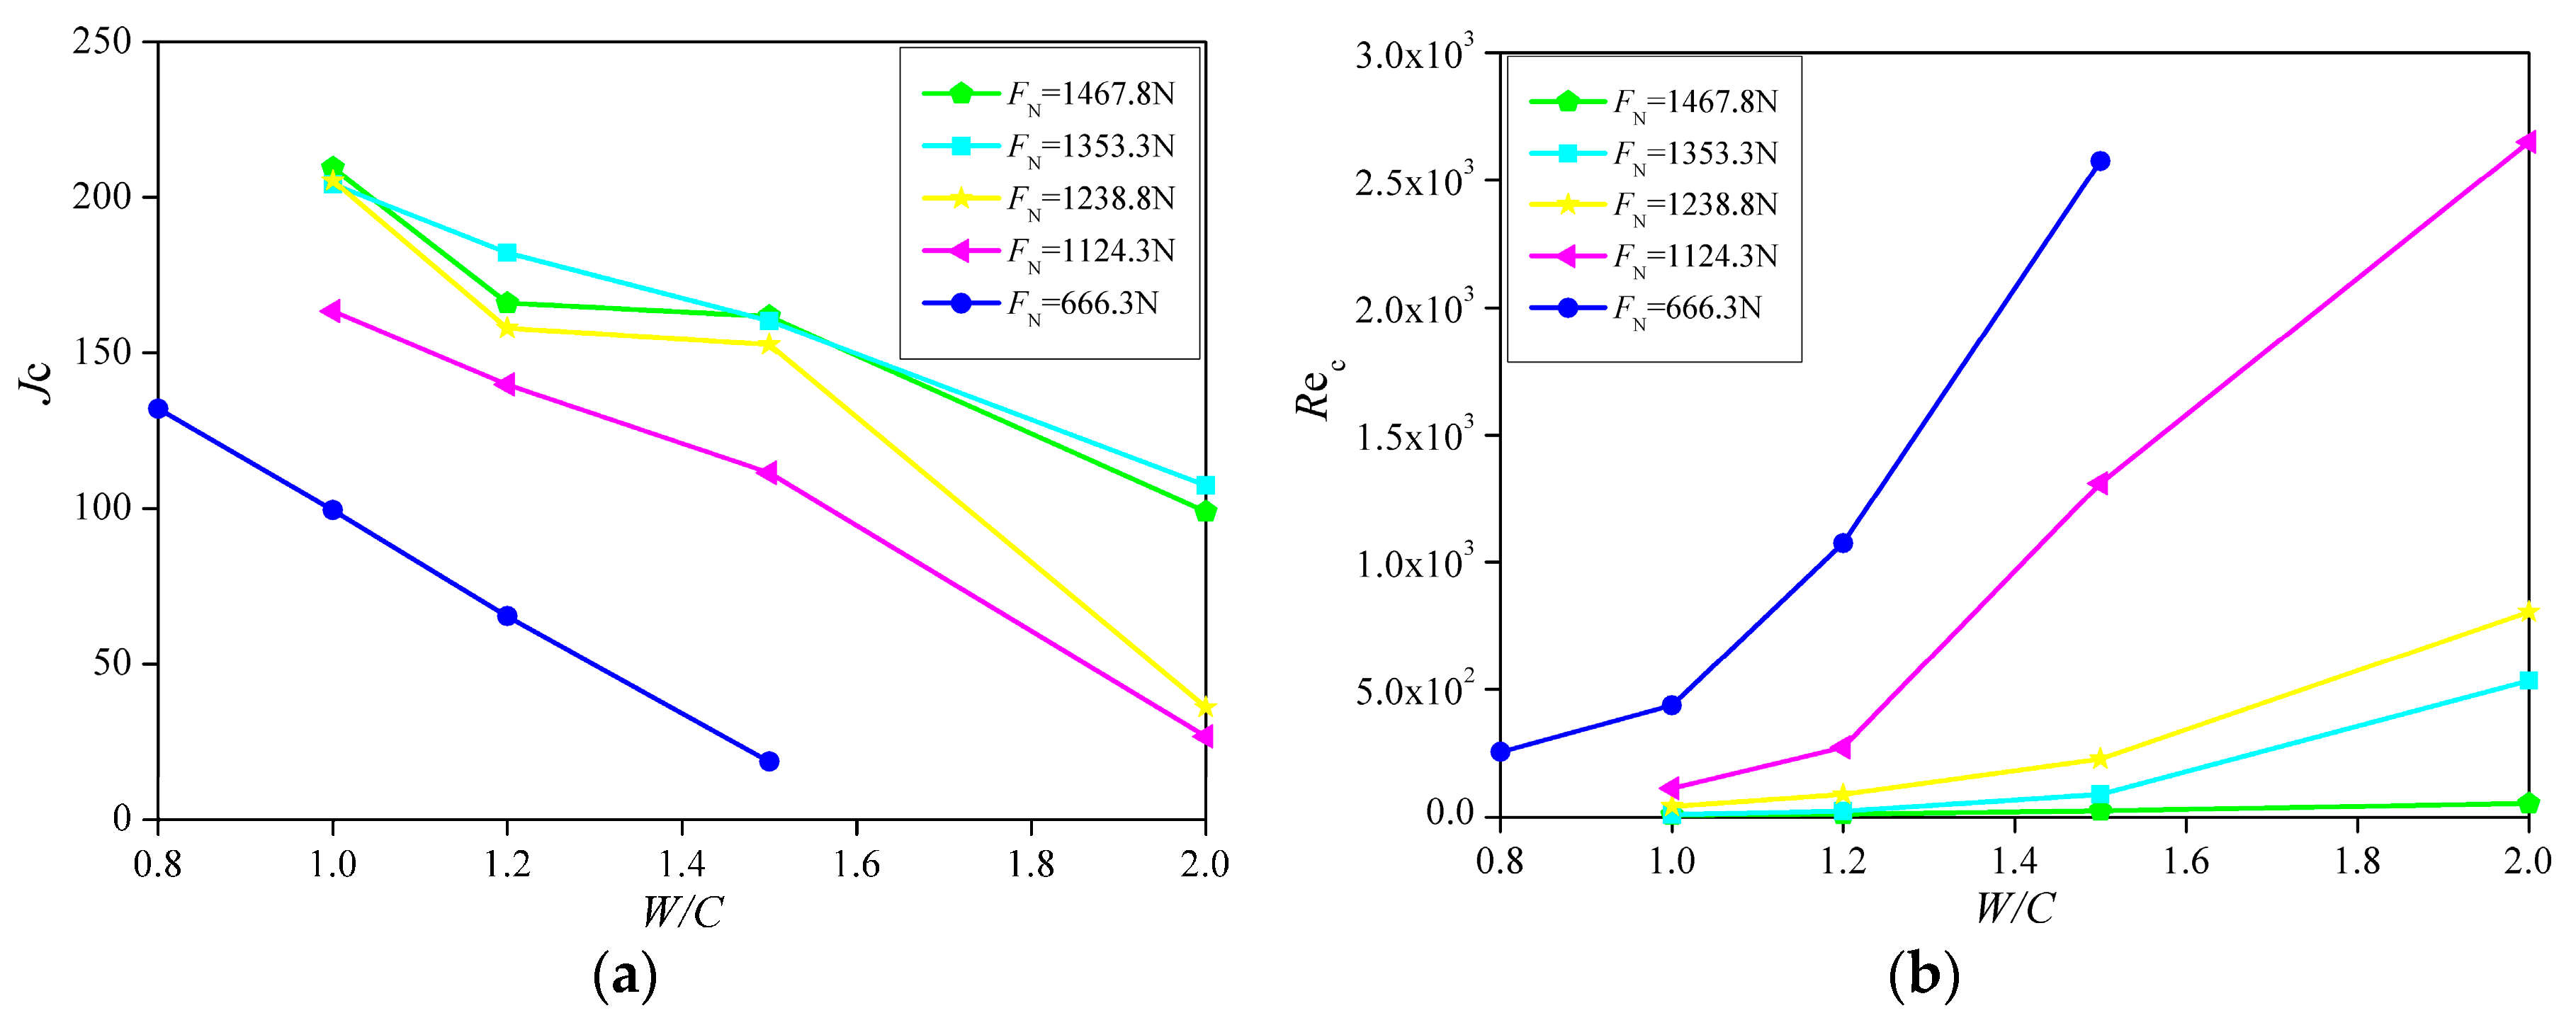
  • The increase of the W/C ratio resulted in the decrease of Jc. Taking FN = 1353.3 N as an example, Jc was 182.179 (W/C ratio = 1.2), 160.361 (1.5), and 107.439 (2.0), respectively, decreasing by 10.78%, 21.47%, and 47.38% over the Jc of 204.194 for W/C ratio of 1.0. Besides, when the W/C ratio was constant, Jc showed increasing trends as the increase of FN. Meanwhile, when FN was constant, as the W/C ratio increased, the critical Reynolds number Rec for all cases showed increasing trends. Taking FN = 1353.3 N as an example, Rec was 22.773 (W/C ratio = 1.2), 88.925 (1.5), and 533.548 (2.0), respectively, increasing by 1.21, 7.64, and 50.84 times over the Rec of 10.292 for W/C ratio of 1.0. Moreover, at a given W/C ratio, Rec showed increasing trends as the FN value decreased.
This paper was a preliminary research of grout flow behavior through rough fractures. It should be noted that the rationality of experimental results on grout flow through fractures was not only affected by W/C ratios and normal loads FN, but also by the experimental apparatus, fractured sample size, and other factors. Moreover, the flow in a single fracture cannot represent the contacts in reality, so the study of grout flow behavior through natural fractured materials with contacts should be the focus of further research. Consequently, based on the above issues, more appropriate experimental apparatus and experimental samples are needed to be used so that more reasonable and accurate results on grout flow behavior through fractures will be available.

Author Contributions

Y.J., L.H., C.X. conceived and designed the experiments; Y.J., C.X., Q.M., Z.L. and Y.Z. performed the experiments; Y.J. analyzed the data; Y.J. and L.H. wrote the paper.

Funding

This work was supported by Outstanding Innovation Scholarship for Doctoral Candidate of CUMT (2019YCBS009).

Conflicts of Interest

The authors declare no conflict of interest.

References

  1. Chen, M.; Yang, S.; Pathegama-Gamage, R.; Yang, W.; Yin, P.; Zhang, Y.; Zhang, Q. Fracture Processes of Rock-Like Specimens Containing Nonpersistent Fissures under Uniaxial Compression. Energies 2019, 12, 79. [Google Scholar] [CrossRef]
  2. Yang, S.; Chen, M.; Jing, H.; Chen, K.; Meng, B. A case study on large deformation failure mechanism of deep soft rock roadway in Xin’An coal mine, China. Eng. Geol. 2017, 217, 89–101. [Google Scholar] [CrossRef]
  3. Lei, Q.; Latham, J.; Tsang, C. The use of discrete fracture networks for modelling coupled geomechanical and hydrological behaviour of fractured rocks. Comput. Geotech. 2017, 85, 151–176. [Google Scholar] [CrossRef]
  4. Jin, Y.; Han, L.; Meng, Q.; Sanda, S.; Zang, H.; Feng, B. Mechanical properties of grouted crushed coal with different grain size mixtures under triaxial compression. Adv. Civ. Eng. 2018, 2018, 9473947. [Google Scholar] [CrossRef]
  5. Park, D.; Oh, J. Permeation grouting for remediation of dam cores. Eng. Geol. 2018, 233, 63–75. [Google Scholar] [CrossRef]
  6. Jin, Y.; Han, L.; Meng, Q.; Ma, D.; Han, G.; Gao, F.; Wang, S. Experimental investigation of the mechanical behaviors of grouted sand with UF-OA grouts. Processes 2018, 6, 37. [Google Scholar] [CrossRef]
  7. Wang, Q.; Wang, S.; Sloan, S.; Sheng, D.; Pakzad, R. Experimental investigation of pressure grouting in sand. Soils Found. 2016, 56, 161–173. [Google Scholar] [CrossRef]
  8. Wu, K.; Ma, M.; Hao, D. Study on grouting pressure of splitting grouting based on cylindrical expansion considering large strain. Adv. Mater. Res. 2012, 378–379, 288–291. [Google Scholar] [CrossRef]
  9. Zheng, G.; Zhang, X.; Diao, Y.; Lei, H. Experimental study on grouting in underconsolidated soil to control excessive settlement. Nat. Hazards 2016, 83, 1683–1701. [Google Scholar] [CrossRef]
  10. Sui, W.; Liu, J.; Hu, W.; Qi, J.; Zhan, K. Experimental investigation on sealing efficiency of chemical grouting in rock fracture with flowing water. Tunn. Undergr. Space Technol. 2015, 50, 239–249. [Google Scholar] [CrossRef]
  11. Lee, J.; Bang, C.; Mok, Y.; Joh, S. Numerical and experimental analysis of penetration grouting in jointed rock masses. Int. J. Rock Mech. Min. Sci. 2000, 37, 1027–1037. [Google Scholar] [CrossRef]
  12. Funehag, J.; Fransson, A. Sealing narrow fractures with a Newtonian fluid: Model prediction for grouting verified by field study. Tunn. Undergr. Space Technol. 2006, 21, 492–498. [Google Scholar] [CrossRef]
  13. Kim, H.; Lee, J.; Yazdani, M.; Tohidi, E.; Nejati, H.; Park, E. Coupled Viscous Fluid Flow and Joint Deformation Analysis for Grout Injection in a Rock Joint. Rock Mech. Rock Eng. 2017, 51, 627–638. [Google Scholar] [CrossRef]
  14. Hässler, L.; Håkansson, U.; Stille, H. Computer-simulated flow of grouts in jointed rock. Tunn. Undergr. Space Technol. 1992, 7, 441–446. [Google Scholar] [CrossRef]
  15. Mashayekhizadeh, V.; Kharrat, R.; Ghazanfari, M.; Dejam, M. An experimental investigation of fracture tilt angle effects on frequency and stability of liquid bridges in fractured porous media. Pet. Sci. Technol. 2012, 30, 807–816. [Google Scholar] [CrossRef]
  16. Zendehboudi, S.; Chatzis, I.; Mohsenipour, A.; Elkamel, A. Dimensional analysis and scale-up of immiscible two-phase flow displacement in fractured porous media under controlled gravity drainage. Energ. Fuel. 2011, 25, 1731–1750. [Google Scholar] [CrossRef]
  17. Zendehboudi, S.; Chatzis, I.; Shafiei, A.; Dusseault, M. Empirical modeling of gravity drainage in fractured porous media. Energ. Fuel. 2011, 25, 1229–1241. [Google Scholar] [CrossRef]
  18. Dejam, M.; Hassanzadeh, H. Formation of liquid bridges between porous matrix blocks. AIChE J. 2011, 57, 286–298. [Google Scholar] [CrossRef]
  19. Mashayekhizadeh, V.; Ghazanfari, M.; Kharrat, R.; Dejam, M. Pore-level observation of free gravity drainage of oil in fractured porous media. Transp. Porous Media 2011, 87, 561–584. [Google Scholar] [CrossRef]
  20. Dejam, M.; Hassanzadeh, H.; Chen, Z. Reinfiltration through liquid bridges formed between two matrix blocks in fractured rocks. J. Hydrol. 2014, 519, 3520–3530. [Google Scholar] [CrossRef]
  21. Dejam, M. The role of fracture capillary pressure on the block-to-block interaction process. J. Porous Media 2018, 21, 1121–1136. [Google Scholar] [CrossRef]
  22. Dejam, M.; Hassanzadeh, H.; Chen, Z. Shear dispersion in a rough-walled fracture. Soc. Pet. Eng. J. 2018, 23, 1669–1688. [Google Scholar] [CrossRef]
  23. Bear, J. Dynamics of Fluids in Porous Media; American Elsevier Publishing Company: New York, NY, USA, 1972. [Google Scholar]
  24. Brush, D.; Thomson, N. Fluid flow in synthetic rough-walled fractures: Navier–Stokes, Stokes, and local cubic law simulations. Water Resour. Res. 2003, 39, 1037–1041. [Google Scholar] [CrossRef]
  25. Yin, Q.; Ma, G.; Jing, H.; Wang, H.; Su, H.; Wang, Y.; Liu, R. Hydraulic properties of 3D rough-walled fractures during shearing: An experimental study. J. Hydrol. 2017, 555, 169–184. [Google Scholar] [CrossRef]
  26. Rong, G.; Hou, D.; Yang, J.; Cheng, L.; Zhou, C. Experimental study of flow characteristics in non-mated rock fractures considering 3D definition of fracture surfaces. Eng. Geol. 2017, 220, 152–163. [Google Scholar] [CrossRef]
  27. Zhang, Z.; Nemcik, J. Fluid flow regimes and nonlinear flow characteristics in deformable rock fractures. J. Hydrol. 2013, 477, 139–151. [Google Scholar] [CrossRef]
  28. Dippenaar, M.; Rooy, J.L.V. On the cubic law and variably saturated flow through discrete open roughwalled discontinuities. Int. J. Rock Mech. Min. Sci. 2016, 89, 200–211. [Google Scholar] [CrossRef]
  29. Zimmerman, R.; Bodvarsson, G. Hydraulic Conductivity of Rock Fractures. Transp. Porous Media 1996, 23, 1–30. [Google Scholar] [CrossRef]
  30. Zambrano, M.; Pitts, A.; Salama, A.; Volatili, T.; Giorgioni, M.; Tondi, E. Analysis of Fracture Roughness Control on Permeability Using SfM and Fluid Flow Simulations: Implications for Carbonate Reservoir Characterization. Geofluids 2019, 2019, 4132386. [Google Scholar] [CrossRef]
  31. Ko, N.; Ji, S.; Koh, Y.; Baik, M. Hydraulic conceptualization of a single fracture using hydraulic interference tests at a deep underground condition. Geosci. J. 2018, 22, 581–588. [Google Scholar] [CrossRef]
  32. Ma, D.; Duan, H.; Liu, J.; Li, X.; Zhou, Z. The role of gangue on the mitigation of mining-induced hazards and environmental pollution: An experimental investigation. Sci. Total Environ. 2019, 664, 436–448. [Google Scholar] [CrossRef] [PubMed]
  33. Snow, D. Anisotropic permeability of fractured media. Water Resour. Res. 1969, 5, 1273–1289. [Google Scholar] [CrossRef]
  34. Ji, S.; Lee, H.; Yeo, I.; Lee, K. Effect of nonlinear flow on DNAPL migration in a rough-walled fracture. Water Resour. Res. 2008, 44, W11431. [Google Scholar] [CrossRef]
  35. Xia, C.; Qian, X.; Lin, P.; Xiao, W.; Gui, Y. Experimental Investigation of Nonlinear Flow Characteristics of Real Rock Joints under Different Contact Conditions. J. Hydraul. Eng. 2017, 143, 04016090. [Google Scholar] [CrossRef]
  36. Forchheimer, P. Wasserbewegung durch boden. Z. Ver. Deutsch Ing. 1901, 45, 1782–1788. [Google Scholar]
  37. Zimmerman, R.; Al-Yaarubi, A.; Pain, C.; Grattoni, C. Non-Linear regimes of fluid flow in rock fractures. Int. J. Rock Mech. Min. Sci. 2004, 41, 163–169. [Google Scholar] [CrossRef]
  38. Wang, M.; Chen, Y.; Ma, G.; Zhou, J.; Zhou, C. Influence of surface roughness on nonlinear flow behaviors in 3D self-affine rough fractures: Lattice Boltzmann simulations. Adv. Water Resour. 2016, 96, 373–388. [Google Scholar] [CrossRef]
  39. Zhang, W.; Dai, B.; Liu, Z.; Zhou, C. A pore-scale numerical model for non-Darcy fluid flow through roughwalled fractures. Comput. Geotech. 2017, 87, 139–148. [Google Scholar] [CrossRef]
  40. Chen, Y.; Lian, H.; Liang, W.; Yang, J.; Nguyen, V.P.; Bordas, S. The influence of fracture geometry variation on non-Darcy flow in fractures under confining stresses. Int. J. Rock Mech. Min. Sci. 2019, 113, 59–71. [Google Scholar] [CrossRef]
  41. Ma, D.; Duan, H.; Li, X.; Li, Z.; Zhou, Z.; Li, T. Effects of seepage-induced erosion on nonlinear hydraulic properties of broken red sandstones. Tunn. Undergr. Space Technol. 2019, 91, 102993. [Google Scholar] [CrossRef]
  42. Zeng, Z.; Grigg, R. A Criterion for Non-Darcy Flow in Porous Media. Transp. Porous Media 2006, 63, 57–69. [Google Scholar] [CrossRef]
  43. Ma, D.; Wang, J.; Li, Z. Effect of particle erosion on mining-induced water inrush hazard of karst collapse pillar. Environ. Sci. Pollut R. 2019, 26, 19719–19728. [Google Scholar] [CrossRef] [PubMed]
  44. Rong, G.; Yang, J.; Cheng, L.; Zhou, C. Laboratory investigation of nonlinear flow characteristics in rough fractures during shear process. J. Hydrol. 2016, 541, 1385–1394. [Google Scholar] [CrossRef]
  45. Yang, C.; Shen, S.; Hou, D.; Liao, S.; Yuan, D. Material properties of the seal gasket for shield tunnels: A review. Constr. Build. Mater. 2018, 191, 877–890. [Google Scholar] [CrossRef]
  46. Farfan-Cabrera, L.; Gallardo-Hernández, E.; Pérez-González, J. Compatibility study of common sealing elastomers with a biolubricant (Jatropha oil). Tribol. Int. 2017, 116, 1–8. [Google Scholar] [CrossRef]
  47. Gillen, K.; Bernstein, R.; Derzon, D. Evidence of non-Arrhenius behaviour from laboratory aging and 24-year field aging of polychloroprene rubber materials. Polym. Degrad. Stab. 2005, 87, 57–67. [Google Scholar] [CrossRef]
  48. Jin, Y.; Han, L.; Meng, Q.; Ma, D.; Wen, S.; Wang, S. Experimental investigation of the mechanical behaviors of grouted crushed coal rocks under uniaxial compression. Geomech. Eng. 2018, 16. [Google Scholar]
  49. Xie, H.; Sun, H.; Ju, Y.; Feng, Z. Study on generation of rock fracture surfaces by using fractal interpolation. Int. J. Solids Struct. 2001, 38, 5765–5787. [Google Scholar] [CrossRef]
  50. Fityus, S.; Giacomini, A.; Buzzi, O. The significance of geology for the morphology of potentially unstable rocks. Eng. Geol. 2013, 162, 43–52. [Google Scholar] [CrossRef]
  51. Gale, J.; Laubach, S.; Marrett, R.; Olson, J.; Holder, J.; Reed, R. Predicting and characterizing fractures in dolostone reservoirs: Using the link between diagenesis and fracturing. Geol. Soc. Lond. Spec. Publ. 2004, 235, 177–192. [Google Scholar] [CrossRef]
  52. Wu, J.; Feng, M.; Yu, B.; Han, G. The length of pre-existing fissures effects on the mechanical properties of cracked red sandstone and strength design in engineering. Ultrasonics 2018, 82, 188–199. [Google Scholar] [CrossRef] [PubMed]
  53. Mandelbrot, B. The Fractal Geometry of Nature; WH Freeman: New York, NY, USA, 1983. [Google Scholar]
Figure 1. (a) Schematic view of the grout flow testing system, (b) Actual platform for grout flow through fractured rock.
Processes 07 00736 g001
Figure 2. (a) Grout supply system, (b) Real-time data acquisition equipment.
Processes 07 00736 g002
Figure 3. Grain size distribution curves of three kinds of cements.
Processes 07 00736 g003
Figure 4. (a) High-precision laser-cutting machine, (b) High-transparency plexiglass plate fractured rock sample containing high strength springs.
Processes 07 00736 g004aProcesses 07 00736 g004b
Figure 5. Relationships between the grout hydraulic gradient J and volumetric flow rate Q under different normal loads: (a) 1467.8 N, (b) 1353.3 N, (c) 1238.8 N, (d) 1124.3 N, and (e) 666.3 N.
Processes 07 00736 g005
Figure 6. (a) Variations in the nonlinear coefficients a, (b) linear coefficients b.
Processes 07 00736 g006
Figure 7. Relationships between the Reynolds number (Re) and the normalized transmissivity (T/T0): (a) W/C ratio of 1.0, (b) W/C ratio of 1.2, (c) W/C ratio of 1.5, (d) W/C ratio of 2.0.
Processes 07 00736 g007
Figure 8. Relationships between the Forchheimer coefficient β and water/cement (W/C) ratio.
Processes 07 00736 g008
Figure 9. Relationships between (a) Jc and (b) Rec with different W/C ratios under different normal loads.
Processes 07 00736 g009
Table 1. Ultrafine cement grout properties parameters.
W/C Ratios0.81.01.21.52.0
ρ (kg/m3)1.660 × 1031.390 × 1031.340 × 1031.270 × 1031.250 × 103
μ (Pa∙s)9.379 × 10−35.600 × 10−33.680 × 10−32.200 × 10−31.130 × 10⁻³
Table 2. Experimental results of a, b, R2 Jc, and Rec for rough rock fracture with different W/C ratios and FN values.
W/C RatioFN (kN)abR2JcRec
0.8666.31.660 × 10104.125 × 1060.9988132.084254.023
1.01467.84.739 × 10132.783 × 1080.9997209.4988.379
1353.33.150 × 10132.201 × 1080.9994204.19410.292
1238.82.016 × 10125.393 × 1070.9987205.33741.952
1124.32.056 × 10111.616 × 1070.9989163.438112.536
666.36.575 × 1092.138 × 1060.997999.423512.139
1.21467.84.094 × 10132.325 × 1080.9989166.04211.682
1353.31.203 × 10131.306 × 1080.9992182.17922.773
1238.86.884 × 10112.932 × 1070.9987157.99488.099
1124.35.709 × 10107.989 × 1060.9981139.855286.505
666.32.135 × 1099.807 × 1050.998765.2631073.741
1.51467.82.119 × 10131.665 × 1080.9995161.74625.232
1353.31.714 × 10124.677 × 1070.9989160.36188.925
1238.82.210 × 10111.597 × 1070.9987152.714246.806
1124.36.094 × 1092.176 × 1060.9984111.4191311.130
666.32.719 × 1081.928 × 1050.998318.5222473.841
2.01467.81.089 × 10139.204 × 1070.999598.94753.368
1353.31.315 × 10119.869 × 1060.9990107.439533.548
1238.81.756 × 10102.217 × 1060.999036.006805.396
1124.31.254 × 1094.957 × 1050.998326.6532652.174
666.32.899 × 1072.638 × 1040.9982

