Article

Applications of TQM Processes to Increase the Management Performance of Enterprises in the Romanian Renewable Energy Sector

Faculty of Business Administration in Foreign Languages, Bucharest University of Economic Studies, 6 Piata Romana, 1st district, 010374 Bucharest, Romania
Processes 2019, 7(10), 685; https://doi.org/10.3390/pr7100685
Submission received: 2 September 2019 / Revised: 16 September 2019 / Accepted: 18 September 2019 / Published: 2 October 2019
(This article belongs to the Special Issue Neural Computation and Applications for Sustainable Energy Systems)

Abstract

:
This paper focuses on total quality management (TQM) processes and their applications to increase the management performance of enterprises in the renewable energy sector (RES). TQM is a modern tool used by enterprises to increase their management performance. We start with a description of Edwards Deming’s conceptualized model, highlighting different phases of its development as described in the literature. The TQM process is then used for an application to the RES in Romania. The quantitative model analyzes the influence of TQM process implementation in achieving competitive advantage and the management performance of the undertakings in the RES. Data was collected through a survey based on a questionnaire addressed to employees and managers in the RES. Structural equation modeling (SEM) was used and the research hypotheses were tested with the partial least squares path method (PLS). Data analysis was performed with the statistical software SmartPLS 3.2.8. The main contribution of this article is to evaluate the relationship between the management performance of enterprises in the RES sector in Romania and TQM process indicators. The results underline the fact that the most important attributes of a TQM process to increase the management performance are: integrated operational processes, policies and trading strategies, integrated operational management, company social responsibility, motivated workforce, knowledge, and competencies. The conclusions of the research are in line with the latest findings in the area, underlining that management performance is the direct result of the association between a group of factors and processes, such as the integrated operational processes, trade strategies and policies, integrated operational management, corporate social responsibility (CSR), motivated workforce, knowledge, and competencies.

Graphical Abstract

1. Introduction

The founders of total quality management (TQM) theory were Walter Shewhart and Edwards Deming. In the first part of the previous century, Shewhart [1] introduced a probabilistic model for managerial processes to statistically control production. The model was further developed by Deming [2] who introduced the concept of “quality of cycles” which could help management to identify real solutions to work-related problems. This “Deming method” was firstly used in 1950 in Japan in factory production, where quality control programs were used by the managers to better intervene in operational processes [3]. Kaori Ishikawa, one of Deming’s disciples, applied the TQM concept in the economy of Japan, which involved all the company’s employees, independent of the position held. The author [4] designed one of the TQM tools, known as the “Ishikawa diagram”, which is a concept of “quality control cycles”, formed by employees who voluntarily identified and found real solutions to the problems faced by the company.
In 1951, Armand Feigenbaum further developed Deming’s TQM model by generating a link between the supplier and the customer, which emphasized the implication of the employees in obtaining high-performance results to satisfy the needs of the final customers [5]. Another researcher, Joseph M. Juran, published the Quality Control Handbook volume in 1951. The paper [6] represents the ‘ABC’ of quality control and it is considered a landmark for the definition of the three basic pillars of the TQM, also known as the “Quality Trilogy”. In that handbook [7], the three basic directions refer to procedure, control, and quality improvement. Procedure is the identification of the objectives and the framework of the activity in order to refine the quality. Control is to apply the TQM techniques. Quality improvement focuses on the correction and removal of defects. As opposed to Deming, who emphasized the importance of the role of employees in achieving quality, Juran points out the role of management’s influence on staff and conducted his research by evaluating the tools used, focusing on how to present the products or services offered, their compliance with quality standards, availability in stock, comfort offered, and safety in use. Thus, the concept of total quality in the Juran approach embodies the vision of the final consumer. Its management methods are concentrated on evaluation, compliance, and remediation.
The conceptualization of TQM models is nowadays being carried out by scientific organizations in the field of standardization, innovation, and research, such as the European Foundation for Quality Management (EFQM) in Europe, the Japanese Union of Scientists and Engineers (JUSE) in Japan, or the National Institute for Standardization and Technology (NIST) in the USA, a list which is not exhaustive. Conceptual modeling needs to be based on empirical data in order to produce the expected results.
At the beginning of this century, the view was that the main objective of the workforce was to increase the performance of the company and its profitability for the benefit of the shareholders or the management personnel. It was observed that these desires did indeed bring short-term benefits, but over a longer time horizon, the objectives pursued would have negative effects if they are not followed by secondary actions in correlation with the customer preferences [8,9,10]. In order to increase the quality of products and services of a company, some authors [11,12] used methods of statistical control to analyze the processes of production. Other authors used Ishikawa and Pareto diagrams to identify errors in the industrial sector [13,14,15]. Currently, the methods of statistical control have been replaced by those of quality assurance. Therefore, statistical charts are currently used with a preventive scope to increase the quality, rather than using these charts to diagnose and correct the deficiencies in the quality through control process [16].
Currently, the managerial vision is focused on the consumer and aims at continuously improving, in the long run, the quality of the services and products offered [17,18]. The positive externalities thus generated are beneficial for the profitability and prosperity of the company over a long time horizon. Customer loyalty enhanced through the company’s reputation on the market as well as the loyalty programs are important aspects in estimating its strengths and managerial performance [19,20].
The long-term instruction of the staff members in order to obtain quality and the creation of a friendly working place through the motivation of the employed personnel are particularly important aspects in consolidating a strategy for managers for the expansion of the enterprise on the market and, ultimately, for sustainable economic growth.
To analyze the interaction between the TQM model and achieving high managerial performance in a certain industry, statistical data is required for a minimum period of 5 years. An example [21,22] is that of the Mercadona business management model. The TQM concept was introduced by Mercadona in 1993, who opened a renowned supermarket, with loyal customers, by offering them high quality products at minimum prices. The TQM model was applied and, hence, Mercadona avoided negative financial results and eventually bankruptcy during the economic crises in 2008 [23]. Also of relevance is the study of Khanam et al. [24], which shows the importance of applying TQM and IT resources for the satisfaction of consumers in the information technology and renewable energy industries. Of particular interest is the work examining how the undertakings could influence the loyalty of its customers through the engagement of its customers by using two quality constructions of services: the assurance and reliability of services [25]. Another example of the application of the TQM model in the footwear manufacturing sector is presented by Abrunhosa et al. [26]. This vision was the foundation of the common standards of company performance as described by the International Organization for Standardization (ISO) [27,28,29].
The concept of TQM has attracted many researchers from a variety of disciplines. Akgun et al. [30], based on a sample of 193 firms in Turkey, demonstrated that there is an interconnected relationship among TQM, organizational learning capability (OLC), business innovativeness, and a firm’s financial performance and proposed that OLC and business innovativeness mediate the relationship between TQM and a firm’s financial performance. Other authors [31] reviewed the critical success factors of TQM, and ranked these in the Indian manufacturing industry using a technique for order preference by similarity to an ideal solution. Using a sample of TQM companies operating in mainland China, Hong Kong, and Taiwan, Noronha [32] found that adaptiveness, harmony with people, harmony with the universe, interdependence, and respect for authority have important influences on four quality dimensions, namely climate, processes, methods, and results. Other researchers [33] examining the discourse produced by an elite group of corporate executives to legitimate TQM at the national level in Turkey demonstrated that the legitimating agencies largely used ethos justifications exploiting the macrocultural discourse prevalent in the Turkish context. Based on a combination of quantitative and qualitative research approaches, Psychogios [34] argues for the adoption of a region-specific view of TQM that is applicable to particular regional business systems. While some authors [35] argue that managers’ familiarity with the “hard” side of TQM seems to both positively and negatively influence career development and job security, while being influenced by employment sector and educational background, other researchers [36] underline that there are two antithetical business-cultural ‘forces’—conservatism and reformism—that seem to substantially affect the awareness and application of total quality concepts. Some economists [37] provide conceptual clarity and new empirical findings for the question of whether or not TQM is universal in its applicability. The authors used Multivariate analysis of variance (MANOVA) and regression analysis to derive relevant empirical results—empirical results that have implications not only for the question of whether or not TQM is universal in its applicability, but also for the theoretical tension between the convergence hypothesis argument and the national specificity argument. Nevertheless, Shafiq et al. [38] indicate that TQM has a highly positive effect on organizational performance based on a study on 210 textile companies in a developing country in South Asia.
Most often, the Deming principles at the basis of the TQM are revealed in the ISO quality standards, introduced by the ISO and the International Electrotechnical Commission (IEC), respectively. In Romania, based on the ISO accreditation, domestic enterprises are perceived on the market by the quality of the products and services offered, which associates them with the top companies in European Union (EU).
In Romania, the TQM model has been analyzed in many specialized works, including Stanciu [39], Ilies [40], and Busu and Busu [41,42]. Capizzi et al. [43] introduced a neural network-based model to improve the production workflow of organic solar cells (OSCs). The authors proved that the use of a neural model could be an important key for improving the OSC manufacturing process.
The present paper aims to validate the causal relationship between the managerial performance and the TQM model by performing an analysis of the data collected in the renewable energy sector (RES) of Romania. The relationships between the determinant characteristics of the TQM model and the managerial performance of the enterprises in this sector have been evaluated using structural equation modeling (SEM) and tested by the partial least squares (PLS) method.
The main contribution of this paper is to analyze the TQM processes to increase the management performance of the enterprises in the RES in Romania and to discuss the main managerial attributes which could lead to an increase of those performance. The novelty of this paper is the TQM processes analysis for increasing the management performance of the companies in the RES in Romania. A second result is given by the examination of the differences in the managerial performance of the undertakings in the sector.
This paper is structured as follows. In the first section, an overview of the Romanian RES is presented. In the second section, the research question and hypotheses are presented and tested. Quantitative computations based on a survey questionnaire analyzed by the PLS and SEM equations are described in the third section. Finally, further research and the limitations of the study are presented in the last section of the article.

2. Materials and Methods

2.1. Short Description of the RES in Romania

Increasing renewable energy consumption is one of the main important factors in all EU countries. In the EU, the available energy comes from the energy produced in the EU member states and from the energy imported from other non-EU countries. In 2017, the EU imported around 55%, mostly from the Russian Federation, while only 45% was produced in the EU. The energy mix was manly made up of five different sources: natural gas, nuclear energy, petroleum products, solid fossil fuels, and renewable sources. In Figure 1 presents the share of each type of energy at the EU level.
In Figure 1, we can see that the renewable energy produced in EU accounted for only 14% of the total energy production. Figure 2 presents the proportion of renewable energy in the final energy consumption of EU countries in 2017.
From Figure 2, we can see that the renewable energy production share in Romania was 24.5% in 2017, which was above the EU average. At the same time, the EU member states with the largest share of RES consumption were Sweden (54.5%), Finland (41.0%), and Latvia (39%). The EU countries with the lowest level of RES were Malta (7.2%), Netherlands (6.6%), and Luxembourg (6.4%).
For the past decades, Romania’s most important renewable source was large hydro power plants [44]. At the outset of 2000, other sources of green energy accounted for a small proportion of energy supplied in Romania. In 2011, the picture changed in favor of RES (other than large hydropower plants), especially in terms of aeolian energy.
Figure 3 presents the evolution of the RES in the final energy consumption in Romania, from 2008 to 2017.
As shown Figure 3, in 2017, 24.5% of Romania’s total energy consumption came from green energy. Compared to 2008, this is a 19.5% increase, but a 2% decrease from the previous year. Alternative energy includes: aeolian energy (the major contributor), hydro energy, biomass, and photovoltaic energy.
At the end of 2016, the electricity produced in Romania was 61.32 TWh (terawatt hour), which is split into: hydro, nuclear power, natural gas, aeolian power, coal energy, photovoltaic, biomass, and naphtha.
Figure 4 shows the proportion of each energy source in the total energy produced in Romania.
In Figure 4, we see that the hydro resources (29.06%) represent the greenest energy produced in Romania, followed by aeolian power (10.70%), photovoltaic energy (1.31%), and biomass (0.09%). The good ranking for Romania within the EU countries in Figure 4 is explained by the high level of hydro energy produced.

2.2. Research Methodology

To analyze the impact of the TQM model to increase the managerial performance of the enterprises in the RES, a quantitative analysis questionnaire-based survey was performed, and the hypotheses were tested using the partial least squares (PLS) method. Data was analyzed using SmartPLS 3.8.2 software (SmartPLS GmbH, Bönningstedt, Germany).
The main objective of the research paper is to analyze the causal relationship between the managerial performance and the TQM model by performing an analysis of the data collected from the RES in Romania. We also examine the impact that the motivation of the employees, the quality of the management, the strategies and the commercial policies, the operational processes, and the satisfaction of the employees have on the performance of the organization.
Data collection was done with the support of an opinion poll for RES employees and management. The number of respondents was chosen in proportion to the market shares of the four players on the market and the sample was random. The volume of the sample was calculated as the number of indicators multiplied by 5–10 [45]. Thus, the sample must have a minimum of 22 indicators × 5 = 110 respondents. The author collected data from 140 respondents, of which 130 were valid.
The questionnaire has open questions with binary answers (“YES = 1” and “NO = 0”), or using a seven-point Likert scale, from “very little = 1” to “very much = 7”. To ensure that it has the right format and the order of questions is appropriate, the questionnaire was pretested several times.
The aim of this study is to analyze the effects of TQM on the performance of RES organizations in Romania. Starting with the model conceptualized by Edwards Deming, as described in Section 2.1, we considered six proxy variables, which are success factors in terms of TQM implementation: Integrated operational processes, Policies and Trading Strategies, Integrated Operational Management, Company Social Responsibility, Motivated Workforce, and Knowledge and Competencies. They were the independent variables in the study, while the dependent variable was Management Performance. Table 1 and Table 2 present the definitions of these variables.
The six formative variables, together with the reflective variables described above, lead to the formation of the structural model to be tested and validated within this work.
In Figure 5 we could see the conceptual structural model with the TQM effects on management performance.
The management performance factors used in our model have been previously analyzed by many researcers. Juran [46] argues that an important part of management performance is the integrated operational management for achieving an organization’s mission, vision, and goals. This process includes the formulation of a strategic plan that integrates operational management as a core component. In his opinion, although an organization may consist of many different functional specialties, the process of integrating the operations should be the focus of TQM. Another important aspect of management performance is a motivated workforce. According to Ishikawa [47], motivation of the workforce is a key success factor for a challenging and innovative workforce environment. He also argues that a motivated workforce ultimately determines the level of management performance. Knowledge and competencies are also important drives for a managerial performance. Feigenbaum [5] underlines that the knlowledge and competencies are critical components in the successful management and should be the center point of any TQM model. Last but not least, implementing CSR is a key factor for increasing the management performance of the undertakings [48,49].
Thus, we can set up the statistical assumptions, which come to fill in the gaps in the articles mentioned before and will be tested using the SMART-PLS 3.2.8. software. These are:
  • H1: Integrated Operational Processes have a significant influence on the management performance of the organization
  • H2: Trade Strategies and Policies is positively correlated with the management performance of the organization
  • H3: Integrated Operational Management has a significant impact on the management performance
  • H4: Company Social Responsibility is positively correlated with the management performance
  • H5: Motivated Workforce is positively correlated with the management performance
  • H6: Knowledge and Competencies has a significant impact on management performance.

3. Results and Discussions

At the end of 2017, there were 490 companies active in the RES in Romania [36]. The distribution of these enterprises by type is presented in Table 3.
The questionnaires were sent to both management and employees at the executive level, in June 2019, and the replies were completed and conveyed by the end of July. The distribution of the respondents, grouped by type of RES, can be observed in Table 4. The selection was made proportionally with the data provided in Table 3.
The sample size was 130, representing managers and executives from the RES in Romania. The method used was random sampling, stratified by age, gender, income, and the educational level. The respondents were interviewed directly and the questionnaire contained 30 items.
The questionnaire was designed using the funnel method. The collection of the data took place from May 1st to June 30th, 2019, using a questionnaire with closed questions. The main aims of the study were to: identify the motivation level of the respondents, based on their age, gender, income, and level of education; determine the motivation of implementing integrated operational processes; evaluate the quality of the managerial activities; observe the trade strategies and policies in the renewable sector in Romania; and assess the degree of employees’ satisfaction in order to increase managerial performance.
Before passing to the model evaluation, we have to check the significance level of each formative variable. This will be done using Cronbach’s alpha and Dillon–Golsteins’ ρ [50]. Table 5 reveals the output of these indicators.
From this table, we can see that the values related to the six independent indicators are greater than 0.7, which means that all six independent variables are viable for the model. Also, the collinearity between the independent was tested. According to Hair et al. [51], if the variance inflection factor (VIF) values are greater than 5, then collinearity between the independent variables is present. In this case, since all VIF values in Table 5 are smaller than 5, it can be concluded that there is no collinearity between the explanatory variables in the model.
Statistical analysis was performed using the PLS–SEM method. The method consists of two models, the formative (quantification) model and the inner (structural) model. PLS–SEM method was used because it is more robust than other methods and less sensitive to small samples and asymmetric distributions [52].

3.1. Formative Model

The formative (independent) model was evaluated through the convergent and discriminant validity. Statistically, the relationships between independent and dependent variables are determined by the following systems of equations:
{y = Φy δ + uy
{x = Φx σ + ux
where,
  • δ is the endogenous latent variable, while σ is latent independent variable
  • x and y are the measurement variables
  • Φx and Φy are the linear equation system matrices related to the latent variables
  • ux and uy are the residuals.

3.1.1. Convergent Validity

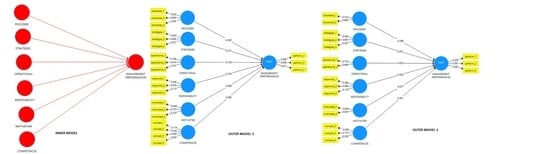
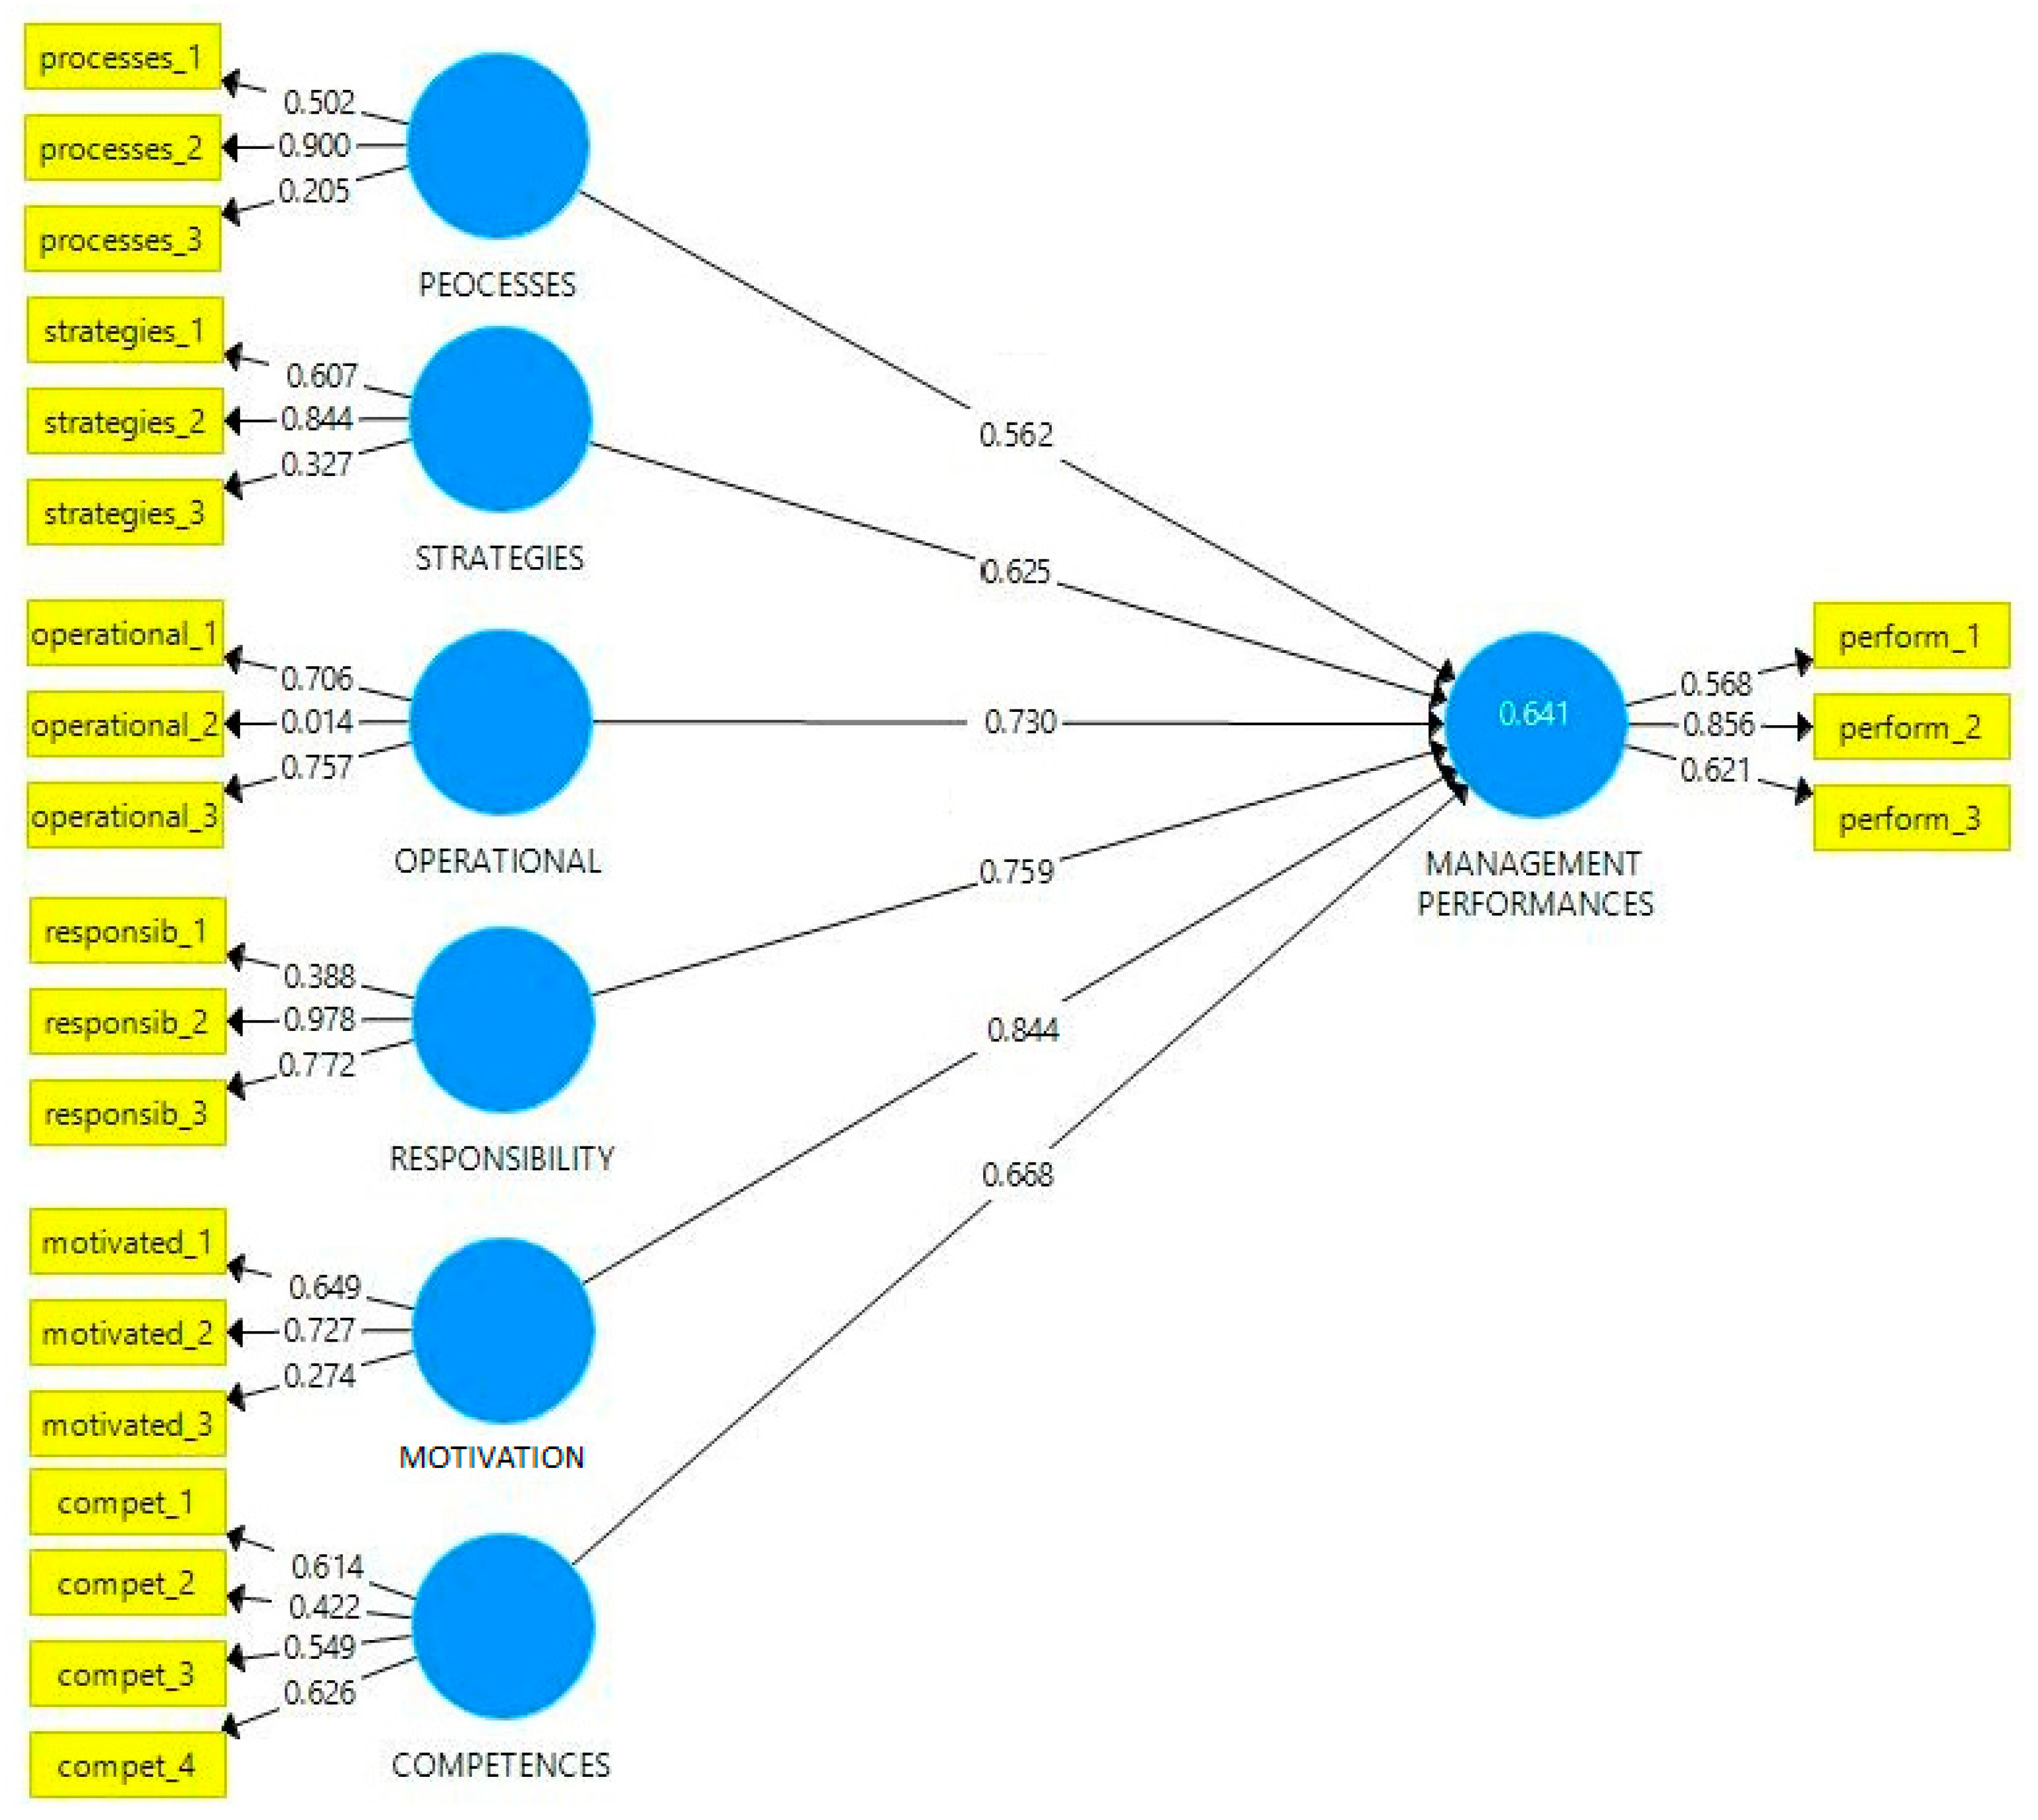
The first formative model with the path coefficients could be seen in Figure 6.
Chin [53] asserts that those variables for which the coefficients are less than 0.5 should be removed from the model. Thus, we will exclude the following variables from the model: processes_3, operational_2, motivated_3, and compet_1. All these have coefficient values lower than 0.5.
Model 2 is obtained from the first model, excluding the variables listed above. The remaining variables underpin a new analysis. In Figure 7, we could see the second formative model with the path coefficients, after the mentioned variables were excluded.
We can observe, from this model, that all the indicators are valid and significant, the value of the coefficients is greater than 0.5 in each case, and, thus, the convergent validity of the model is confirmed.

3.1.2. Discriminant Validity

Discriminant validity could be performed by calculating the average variance extracted (AVE) indicator [54]. The discriminant validity is confirmed when the value of AVE is greater than the values of the correlation coefficients between the square of the latent variables. These values are presented in Table 6.
According to the values from Table 6, the discriminant validity is confirmed because, for each independent variable, the value of AVE is greater than the square of the correlation coefficients.

3.2. Structural Model

The structural model is described in Figure 5. This indicates the relationships between the independent variables in the model, described by the path coefficients, and the dependent variable. In statistical terms [40], the structural model is described as follows:
δ = Δη + Φξ + ε
where,
  • η is the dependent latent variable
  • ξ is latent variable vector
  • ε is the residual variable
  • Δ and Φ are matrices of the path coefficients
The structural model is evaluated in terms of the value of R-squared and the estimated path coefficients. As seen in Figure 7, the R-squared value is 0.762, which means that about 76.2% of the variation of the dependent variable is explained by the model.
Also, the values of the path coefficients in the structural model are positive, which implies that the higher the indicators of the independent variables, the higher the performance level of the organizations in the sector. Out of the six independent indicators from our model, the greatest impact on the organizational performance is from knowledge and competencies (factor 0.781), followed by integrated operational processes (factor 0.770) and motivated workforce (0.677). The strategies and policies (factor 0.557) and the integrated operational management (factor 0.553) factors have smaller impacts.
All three reflective variables of the dependent indicator “management performance” have positive coefficients that are greater than 0.5. This means that all three variables in the reflective model (perform_1, perform_2, and perform_3) are statistically significant for the model.
Also, to test the statistical assumptions introduced at the beginning of the chapter, a bootstrap test (sample of 300 sample respondents) was performed to generate the t-values and standard deviations for the estimated parameters. The results can be seen in Table 7.
The p-values corresponding to the statistical assumptions smaller than 0.05 indicate that the hypothesis was accepted, otherwise it was rejected. Thus, we conclude that all research hypotheses were accepted.
In conclusion, we can affirm that the motivation of the employees, the existence of integrated operational processes, and the quality of the management have significant impact in terms of the performance of the organizations in the RES.

4. Conclusions and Recommendations

By using a PLS–SEM methodology in the field of TQM research, the present study identifies and analyzes the relationships between the determinant characteristics of the TQM model and the management performance of the enterprises in the RES sector. The analysis of the results demonstrates that the model of evaluation is robust since a significant proportion of variation of the dependent variable is explained by the model.
In this regard, the results underlined that the TQM model starts with staff motivation, given the significant result between the staff motivation and the organization’s performance. As competition pressure increases, organizations are forced to retain their outstanding employees, and this is accomplished by the way the enterprises are managing to inspire them. Giving competitive salaries and a performance-oriented framework are necessary attributes to motivate the employees of an organization. By emphasizing the incentives of the employees, the organizations will succeed in increasing their performance.
Moreover, the results of the analysis reveal that the quality of management also has a direct and strong impact on the performance of enterprises in the RES. Top management is indirectly and directly influencing the performance of the undertakings in the sector by mediating the outcomes of the management processes. In conclusion, the success of the TQM model is dependent on the quality of the management. The continuous and qualitative involvement of the management in the activity of the organization leads to the increase of the performance. The management of a RES organization is directly responsible for determining the organizational vision, the culture, and the policies of the organization. Managers should also establish precise, measurable targets that meet consumer expectations and increase the organization’s performance.
The results of the survey emphasize that the existence of integrated operational processes within an enterprise has a significant impact on the managerial performance of the companies in the RES. Thus, the existence of the quality technical equipment, the changes in the operating procedure of the companies in order to adapt to the continuous needs of the market and the regularly reporting of the errors identified by the management for the purpose of remedies are important elements in the analyzed organizations that converge towards increased performance. Given these observations, improvement of managerial processes (including through inspections and supervision) leads to an increase in the overall quality of the enterprises. This could be an explanation of the high value of the coefficient of management processes in the analyzed model.
Another important conclusion is that RES organizations should focus on reducing the variation of the production processes in order to improve their performance. In order to increase performance, there must be a close link between the motivation of the workforce, the quality of the management, and the integration of the operational processes. For companies in the Romanian RES, targeting both their employees and customers is the most important practice that can lead to the increase of the organization’s performance.
Validation of the six research hypotheses leads to the conclusion that the most important factors for increasing management performance are, from most to least important: knowledge and competencies, integrated operational processes, motivated workforce, company social responsibility, policies and trading strategies, and integrated operational management.
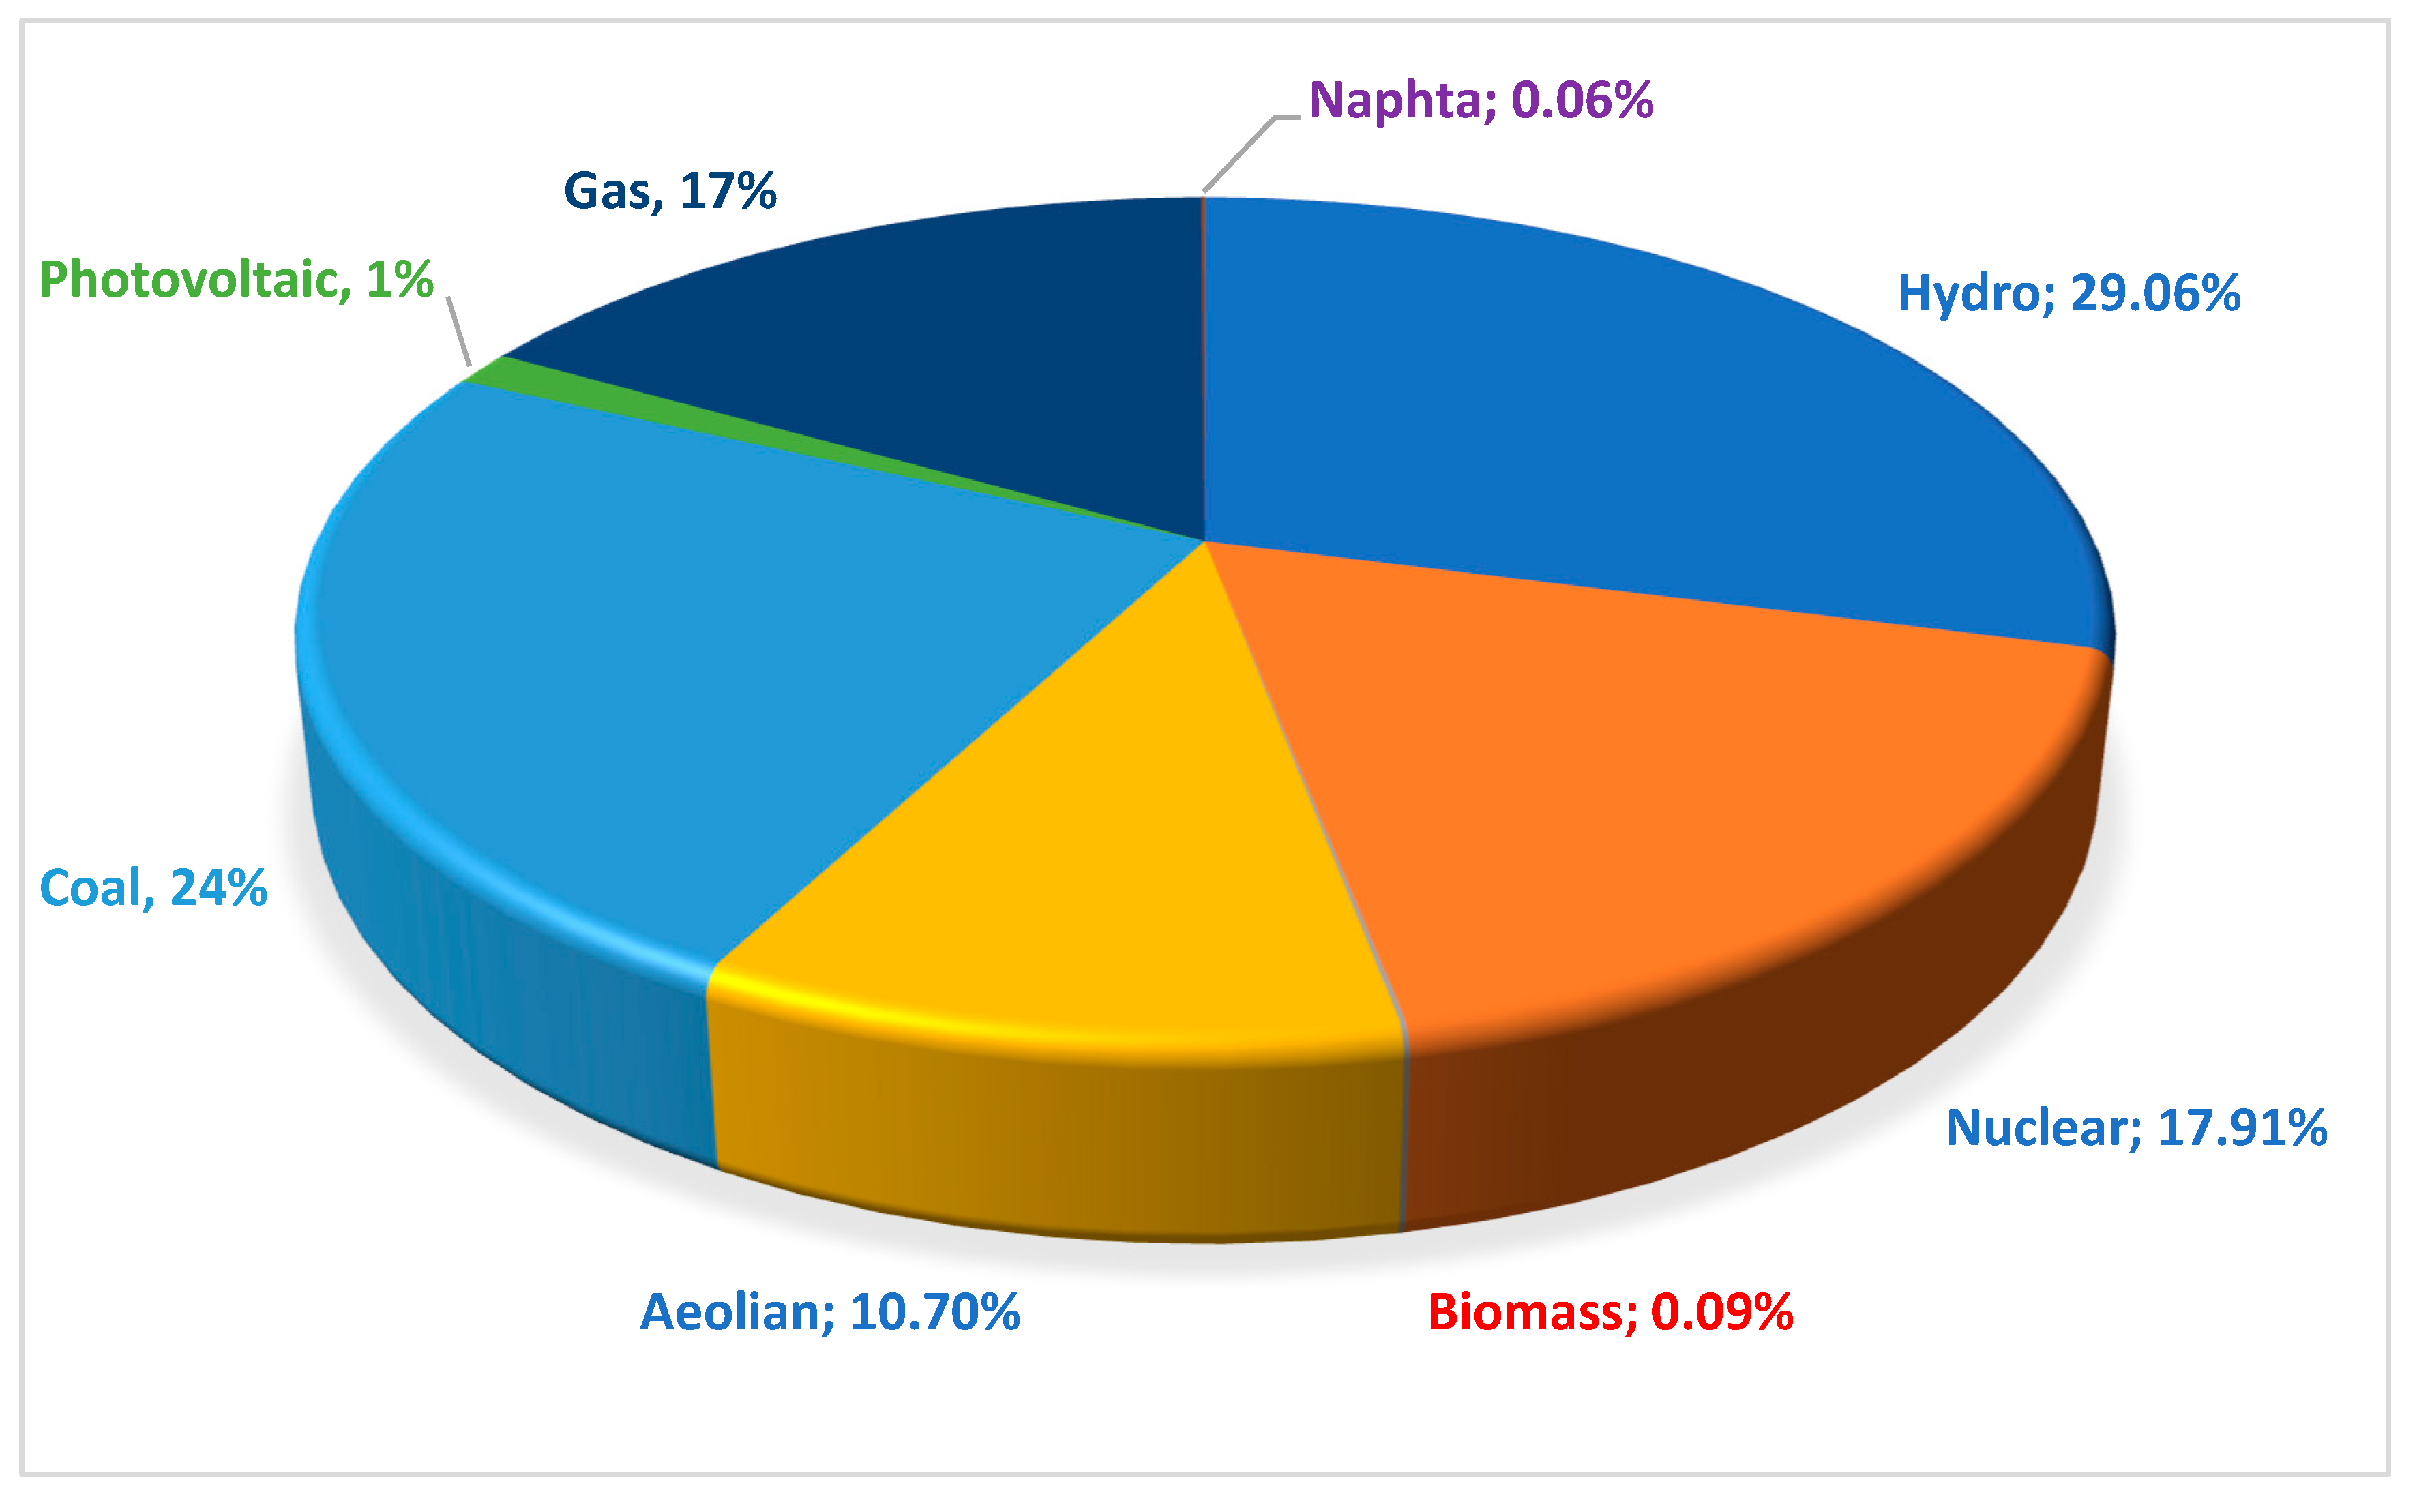
Although producing nongreen energy is still cheaper than producing energy from renewable energy sources, it is worth paying the price to invest in renewable energy. At the European level, the driver of the switch to renewable energy was the Agenda 2020, which includes energy among its priorities. As we have seen in the description of the RES at the EU and the national level, Romania is one of the main performers with respect to renewable energy. According to the graphs presented above, Romania has a big share of renewable energy consumption (24.5% in 2017), and is one of the very few countries who reached the target stated in the 2020 Agenda.
The novelty of this paper is the TQM process analysis for increasing the management performance of the companies in the RES in Romania. The originality of the research also resides in the three dependent variables of the reflective model: “managerial activities are of high quality”, “Managers are using control actions”, and “Managers are evaluated periodically through managerial performance programs”. Also, the independent formative variables: integrated operational processes, policies and trading strategies, integrated operational management, company social responsibility, motivated workforce, and knowledge and competencies have not been used before in the same TQM model.
A limitation of this study could be the number of respondents, while another limitation is related to the fact that there was only one sector analyzed. A third possible limitation of the research, could come from the subjectivity of the respondents’ answers when completing the questionnaire.
Further research on the impact of the TQM model on the performance of the enterprises should be extended to other industry sectors, and the research should also include possible macroeconomic effects. Moreover, future analyses to study the impact of the managerial performance of enterprises through the implementation of the TQM techniques would be very useful.

Acknowledgments

This work was cofinanced from the European Social Fund through Operational Programme Human Capital 2014–2020, project number POCU/380/6/13/125015 ” Development of entrepreneurial skills for doctoral students and postdoctoral researchers in the field of economic sciences”.

Conflicts of Interest

The author declares no conflicts of interest.

Abbreviations

EUEuropean Union
RESRenewable Energy Sector
PLSPartial Least Square
TQMTotal Quality Management
SEMStructural Equation Modelling
AVEAverage Variance Extracted
CSRCorporate Social Responsibility
OLCOrganizational Learning Capability
ISOInternational Organization for Standardization
IECInternational Electrotechnical Commission
NISTNational Institute of Standards and Technology
JUSEJapanese Union of Scientists and Engineers
EFQMThe European Foundation of Quality Management
ANRERomanian Energy Regulatory Authority
EUROSTATStatistical Office of the European Union
MANOVAMultivariate analysis of variance

References

  1. Shewart, W.A. Economic Control of Quality of Manufactured Product ASQC (Milwaukee); D. Van Nostrand Company, Inc.: New York, NY, USA, 1980. [Google Scholar]
  2. Deming, W.E. Out of the Crisis; Massachusetts Institute of Technology: Cambridge, MA, USA, 1986. [Google Scholar]
  3. Koiesar, P.J. What Deming Told the Japanese in 1950. Qual. Manag. J. 1994, 2, 9–24. [Google Scholar] [CrossRef]
  4. Ishikawa, Y.; Arai, M. Magnetic Phase Diagram of MnSi near Critical Temperature Studied by Neutron Small Angle Scattering. J. Phys. Soc. Jpn. 1984, 53, 2726–2733. [Google Scholar] [CrossRef]
  5. Feigenbaum, A.V. Quality Control: Principles, Practice and Administration: An Industrial Management Tool for Improving Product Quality and Design and for Reducing Operating Costs and Losses; McGraw-Hill: New York, NY, USA, 1951. [Google Scholar]
  6. Juran, J.; Godfrey, A.B. Quality Handbook; Republished McGraw-Hill: New York, NY, USA, 1999; pp. 173–178. [Google Scholar]
  7. Juran, J. Juran on Leadership for Quality. An Executive Handbook. Wilson: Juran Institute. 1989. Available online: https://www.ncbi.nlm.nih.gov/pubmed/2798839 (accessed on 24 July 2019).
  8. Berman, S.L.; Wicks, A.C.; Kotha, S.; Jones, T.M. Does Stakeholder Orientation Matter? The Relationship Between Stakeholder Management Models and Firm Financial Performance. Acad. Manag. J. 1999, 42, 488–506. [Google Scholar]
  9. Appelbaum, E.; Bailey, T.; Berg, P.B.; Kalleberg, A.L.; Bailey, T.A. Manufacturing Advantage: Why High-Performance Work Systems Pay off; Cornell University Press: Ithaca, NY, USA, 2000. [Google Scholar]
  10. Lazonick, W.; O’Sullivan, M. Maximizing shareholder value: A new ideology for corporate governance. Econ. Soc. 2000, 29, 13–35. [Google Scholar] [CrossRef]
  11. Mason, B.; Antony, J. Statistical process control: An essential ingredient for improving service and manufacuring quality. Manag. Serv. Qual. Int. J. 2000, 10, 233–238. [Google Scholar] [CrossRef]
  12. Roman, A.-G.; Mocanu, M.; Hoinaru, R. Disclosure Style and Its Determinants in Integrated Reports. Sustainability 2019, 11, 1960. [Google Scholar] [CrossRef]
  13. Gao, C.; Qu, D.; Yang, Y. Optimal Design of Bioenergy Supply Chains Considering Social Benefits: A Case Study in Northeast China. Processes 2019, 7, 437. [Google Scholar] [CrossRef]
  14. Li, Y.; Li, Y. Two-Step Many-Objective Optimal Power Flow Based on Knee Point-Driven Evolutionary Algorithm. Processes 2018, 6, 250. [Google Scholar] [CrossRef]
  15. Busu, C.; Busu, M. Modeling the Circular Economy Processes at the EU Level Using an Evaluation Algorithm Based on Shannon Entropy. Processes 2018, 6, 225. [Google Scholar] [CrossRef]
  16. Kaynak, H. The relationship between total quality management practices and their effects on firm performance. J. Oper. Manag. 2003, 21, 405–435. [Google Scholar] [CrossRef]
  17. Drucker, P.E. The Emerging Theory of Manufacturing. Harv. Bus. Rev. 1990, 68, 94–102. [Google Scholar]
  18. Easton, G.S.; Jarrell, S.L. The effects of total quality management on corporate performance: An empirical investigation. J. Bus. 1998, 71, 253–307. [Google Scholar] [CrossRef]
  19. Blanco, M.; Gutierrez, S. Application of the Total Quality Management Approach in a Spanish Retailer: The Case of Mercadona. Total Qual. Manag. Bus. Excell. 2010, 21, 1365–1381. [Google Scholar]
  20. Garcia-Muiña, F.E.; González-Sánchez, R.; Ferrari, A.M.; Volpi, L.; Pini, M.; Siligardi, C.; Settembre-Blundo, D. Identifying the Equilibrium Point between Sustainability Goals and Circular Economy Practices in an Industry 4.0 Manufacturing Context Using Eco-Design. Soc. Sci. 2019, 8, 241. [Google Scholar] [CrossRef]
  21. Busu, M. Assessment of the Impact of Bioenergy on Sustainable Economic Development. Energies 2019, 12, 578. [Google Scholar] [CrossRef]
  22. Ton, Z.; Harrow, S. Mercadona; Harvard Business School Cases: Cambridge, MA, USA, 2010. [Google Scholar]
  23. Callejo, M.B. Using Total Quality Management Model to Face the Economic Crisis: The Case of Mercadona; Intech Open Access Publisher: London, UK, 2012. [Google Scholar]
  24. Khanam, S.; Siddiqui, J.; Talib, F. A Theoretical Model on Total Quality Management Enablers and Information Technology Resources for the Information and Communication Technology Industry. Res. Sustain. Bus. 2014, 831, 851–863. [Google Scholar]
  25. Izogo, E.E. Customer loyalty in telecom service sector: The role of service quality and customer commitment. TQM J. 2017, 29, 19–36. [Google Scholar] [CrossRef]
  26. Abrunhosa, A.; Sá, P.M.E. Are TQM principles supporting innovation in the Portuguese footwear industry? Technovation 2008, 28, 208–221. [Google Scholar] [CrossRef] [Green Version]
  27. Ab Wahid, R.; Corner, J.; Tan, P.-L.; Tan, P. ISO 9000 maintenance in service organisations: Tales from two companies. Int. J. Qual. Reliab. Manag. 2011, 28, 735–757. [Google Scholar] [CrossRef]
  28. Başaran, B. The effect of ISO quality management system standards on industrial property rights in Turkey. World Pat. Inf. 2016, 45, 33–46. [Google Scholar] [CrossRef]
  29. Ilkay, M.S.; Aslan, E.; Ilkay, M.S. The effect of the ISO 9001 quality management system on the performance of SMEs. Int. J. Qual. Reliab. Manag. 2012, 29, 753–778. [Google Scholar] [CrossRef]
  30. Akgün, A.E.; Ince, H.; Imamoglu, S.Z.; Keskin, H.; Kocoglu, İ. The mediator role of learning capability and business innovativeness between total quality management and financial performance. Int. J. Prod. Res. 2014, 52, 888–901. [Google Scholar] [CrossRef]
  31. Khanna, H.K.; Sharma, D.D.; Laroiya, S.C. Identifying and ranking critical success factors for implementation of total quality management in the Indian manufacturing industry using TOPSIS. Asian J. Qual. 2014, 12, 124–138. [Google Scholar] [CrossRef]
  32. Noronha, C. National culture and total quality management: Empirical assessment of a theoretical model. TQM Mag. 2003, 15, 351–356. [Google Scholar] [CrossRef]
  33. Ozen, S.; Berkman, Ü. Cross-national Reconstruction of Managerial Practices: TQM in Turkey. Organ. Stud. 2007, 28, 825–851. [Google Scholar] [CrossRef]
  34. Psychogios, A.G. A four-fold regional-specific approach to TQM: The case of South Eastern Europe. Int. J. Qual. Reliab. Manag. 2010, 27, 1036–1053. [Google Scholar] [CrossRef]
  35. Psychogios, A.G. Restructuring the employment relationship in South Eastern Europe? Empl. Relat. 2010, 32, 310–327. [Google Scholar] [CrossRef]
  36. Psychogios, A.G.; Wilkinson, A. Exploring TQM awareness in the Greek national business context: Between conservatism and reformism cultural determinants of TQM. Int. J. Hum. Resour. Manag. 2007, 18, 1042–1062. [Google Scholar] [CrossRef]
  37. Rungtusanatham, M.; Forza, C.; Koka, B.R.; Salvador, F.; Nie, W. TQM across multiple countries: Convergence hypothesis versus national specificity arguments. J. Oper. Manag. 2005, 23, 43–63. [Google Scholar] [CrossRef]
  38. Shafiq, M.; Lasrado, F.; Hafeez, K. The effect of TQM on organisational performance: Empirical evidence from the textile sector of a developing country using SEM. Total Qual. Manag. Bus. Excell. 2019, 30, 31–52. [Google Scholar] [CrossRef]
  39. Stanciu, I. Managementul Calitatii Totale; Cartea Universitara Publishing House: Bucharest, Romania, 2012. [Google Scholar]
  40. Ilies, L. Resursele Umane in Managementul Calitatii Totale. Manag. Mark. J. 2004, 2, 21–24. [Google Scholar]
  41. Busu, C.; Busu, M. The impact of applying the total quality management model on the performance of the telecom organizations in Romania. Amfiteatru Econ. 2017, 19, 1035–1049. [Google Scholar]
  42. Busu, C.; Busu, M. Economic modeling in the management of transition to bioeconomy. Amfiteatru Econ. 2019, 21, 24–40. [Google Scholar]
  43. Capizzi, G.; Sciuto, G.L.; Napoli, C.; Shikler, R.; Woźniak, M. Optimizing the Organic Solar Cell Manufacturing Process by Means of AFM Measurements and Neural Networks. Energies 2018, 11, 1221. [Google Scholar] [CrossRef]
  44. Colesca, S.E.; Ciocoiu, C.N. An overview of the Romanian renewable energy sector. Renew. Sustain. Energy Rev. 2013, 24, 149–158. [Google Scholar] [CrossRef]
  45. Kristensen, K.; Eskildsen, J. Design of PLS-based satisfaction studies. In Handbook of Partial Least Squares; Springer: Berlin, Germany, 2010; pp. 247–277. Available online: http://dlib.bpums.ac.ir/multiMediaFile/20774323-4-1.pdf#page=262 (accessed on 20 August 2019).
  46. Juran, J.M. Juran on Leadership for Quality; Simon and Schuster: New York, NY, USA, 2003. [Google Scholar]
  47. Ishikawa, K. What is Total Quality Control? In The Japanese Way; Prentice Hall: Upper Saddle River, NJ, USA, 1985. [Google Scholar]
  48. Zbuchea, A.; Pînzaru, F.; Busu, M.; Stan, S.-O.; Bârgăoanu, A. Sustainable Knowledge Management and Its Impact on the Performances of Biotechnology Organizations. Sustainability 2019, 11, 359. [Google Scholar] [CrossRef]
  49. Lin, C.-H.; Yang, H.-L.; Liou, D.-Y. The impact of corporate social responsibility on financial performance: Evidence from business in Taiwan. Technol. Soc. 2009, 31, 56–63. [Google Scholar] [CrossRef]
  50. Emir, F.; Bekun, F.V. Energy intensity, carbon emissions, renewable energy, and economic growth nexus: New insights from Romania. Energy Environ. 2019, 30, 427–443. [Google Scholar] [CrossRef]
  51. Tenenhaus, M.; Vinzi, V.E.; Chatelin, Y.M.; Lauro, C. PLS path modeling. Comput. Stat. Data Anal. 2005, 48, 159–205. [Google Scholar] [CrossRef]
  52. Hair, J.F.; Ringle, C.M.; Sarstedt, M. Editorial-partial least squares structural equation modeling: Rigorous applications, better results and higher acceptance. Long Range Plan. 2013, 46, 1–12. [Google Scholar] [CrossRef]
  53. Chin, W.W. How to write up and report PLS analyses. In Handbook of Partial Least Squares; Springer: Berlin, Germany, 2010; pp. 655–690. [Google Scholar]
  54. Fornell, C.; Larcker, D.F. Structural Equation Models with Unobservable Variables and Measurement Error: Algebra and Statistics. J. Mark. Res. 1981, 18, 382. [Google Scholar] [CrossRef]
Figure 1. Energy mix produced in the European Union (EU) in 2017. Source: Statistical Office of the European Union (EUROSTAT) [30].
Processes 07 00685 g001
Figure 2. Share (%) of renewable energy in gross final energy consumption in EU Member States, in 2017. Source: EUROSTAT.
Processes 07 00685 g002
Figure 3. Share (%) of renewable energy in the gross final energy consumption in Romania between 2007 and 2017. Source: Romanian Energy Regulatory Authority (ANRE).
Processes 07 00685 g003
Figure 4. Proportion of energy sources in Romania, in 2017. Source: ANRE.
Processes 07 00685 g004
Figure 5. Conceptual structural model with the total quality management (TQM) effects on management performance.
Processes 07 00685 g005
Figure 6. Partial least squares-structural equation modelling (PLS–SEM) Model 1.
Processes 07 00685 g006
Figure 7. PLS–SEM Model 2.
Processes 07 00685 g007
Table 1. Description of the independent (formative) variables.
Integrated Operational Processes (PROCESSES)
processes_1Existence of technical facilities for functioning/operationalization
processes_2The functioning/operating processes have a resilience capacity
processes_3Errors are identified in the operational processes
Trade Strategies and Policies (STRATEGIES)
strategies_1Managers are adapting their strategies based on a competitive market model
strategies_2Managers are planning their activities according to the evolution of the market
strategies_3Managers are adapting their strategies oriented to consumers
Integrated Operational Management (OPERATIONAL)
operational_1Existence of a procurement and strategy department to respond adequately to external requests (business partners, public authorities etc.)
operational_2The existence of an integrated data flow of data, available to the structures within the organization
operational_3Existence of assessment programs to improve quality
Company Social Responsibility (RESPONSIBILITY)
responsib_1Campaigns of social involvement are carried out by presenting the benefits of using renewable energy
responsib_2Ethics and corporate social responsibility programs at the organization level
responsib_3Incentives given to employees for compliance
Motivated Workforce (MOTIVATION)
motivated_1Existence of professional training programs for employees
motivated_2Existence of assessment programs to improve quality
motivated_3The employees are encouraged to take part in the process of decision-making
Knowledge and Competencies (COMPETENCIES)
compet_1Participation in exchanges of information and discussion forums with profile organizations, in order to transfer expertise and knowledge of developments in the RES
compet_2Training courses for training specialists in the field of environmental policy and RES
compet_3Knowledge of specific and/or functional criteria in the field renewable energy that ensures compliance with the legislation in the field
compet_4Research in the field of innovative technologies to extend product life, reduce energy consumption, and/or reuse resources
Table 2. Construction of reflective variables (dependent variable).
Performance of Managerial Activities (MANAGEMENT PERFORMANCE)
perform_1Managerial activities are of high quality
perform_2Managers are using control actions
perform_3Managers are evaluated periodically through managerial performance programs
Table 3. Distribution of the RES enterprises by type in 2017.
EnterprisesHydro PowerWind PowerSolar EnergyBiomass EnergyTotal
SMEs 1571239377450
Big companies15108740
Total17212910184490
Source: ANRE.
Table 4. Distribution of the respondents.
LevelHydroAeolianPhotovoltaicBiomassTotal
Executive41292820118
Management433212
Total45323122130
Source: Author’s own computations.
Table 5. Validity and reliability of the independent variables.
ConstructDillon Golsteins’ RhoCronbach’s AlphaComposite ReliabilityAVEVIF
Processes0.9070.9480.9450.9282.245
Strategies0.9850.9180.9280.9431.896
Operational0.8860.8030.8850.7862.467
Responsibility0.7850.7680.7420.7033.348
Motivation0.7680.7560.6900.7212.874
Competencies0.7920.7650.7040.8043.238
Source: Author’s own computations.
Table 6. Correlation coefficients among the latent variables.
Latent VariablesAVEThe Square of the Correlation Coefficients
MotivatedStrategiesQualityProcessesSatisfaction
Processes0.9371
Strategies0.9780.7411
Operational0.7360.7020.6451
Responsibility0.7060.6890.5490.4831
Motivated0.6960.6120.5480.5280.5911
Competencies0.7830.6350.5860.5690.5790.6021
Source: Author’s own computations.
Table 7. Research hypothesis results, after performing bootstrapping.
Research HypothesisPath Coeff.Std. Errort-Value 1p-Value
H1: Processes → Management Performance0.7700.2203.2860.017
H2: Strategies → Management Performance0.5570.1972.9860.038
H3: Operational → Management Performance0.5530.1842.5690.029
H4: Responsibility → Management Performance0.6300.2172.6790.007
H5: Motivation → Management Performance0.6770.2252.7020.005
H6: Competencies → Management Performance0.7810.3673.1390.003
1 t-value 2.58 (sig. level = 5%).

