Article

A Feasibility Study of Cellulosic Isobutanol Production—Process Simulation and Economic Analysis

by
Avraam Roussos
1,*,
Nikiforos Misailidis
1,
Alexandros Koulouris
2,
Francesco Zimbardi
3 and
Demetri Petrides
4
1
Intelligen Europe, 57001 Thessaloniki, Greece
2
Alexander Technological Education Institute of Thessaloniki, 57400 Thessaloniki, Greece
3
Trisaia Research Centre, ENEA, 75026 Rotondella, Italy
4
Intelligen Inc., Scotch Plains, NJ 07076, USA
*
Author to whom correspondence should be addressed.
Processes 2019, 7(10), 667; https://doi.org/10.3390/pr7100667
Submission received: 21 June 2019 / Revised: 17 September 2019 / Accepted: 25 September 2019 / Published: 27 September 2019
(This article belongs to the Special Issue Sustainable Biorefinery Processes)

Abstract

:
Renewable liquid biofuels for transportation have recently attracted enormous global attention due to their potential to provide a sustainable alternative to fossil fuels. In recent years, the attention has shifted from first-generation bioethanol to the production of higher molecular weight alcohols, such as biobutanol, from cellulosic feedstocks. The economic feasibility of such processes depends on several parameters such as the cost of raw materials, the fermentation performance and the energy demand for the pretreatment of biomass and downstream processing. In this work, two conceptual process scenarios for isobutanol production, one with and one without integrated product removal from the fermentor by vacuum stripping, were developed and evaluated using SuperPro Designer®. In agreement with previous publications, it was concluded that the fermentation titer is a crucial parameter for the economic competitiveness of the process as it is closely related to the energy requirements for product purification. In the first scenario where the product titer was 22 g/L, the energy demand for downstream processing was 15.8 MJ/L isobutanol and the unit production cost of isobutanol was $2.24/L. The integrated product removal by vacuum stripping implemented in the second scenario was assumed to improve the isobutanol titer to 50 g/L. In this case, the energy demand for the product removal (electricity) and downstream processing were 1.8 MJ/L isobutanol and 10 MJ/L isobutanol, respectively, and the unit production cost was reduced to $1.42/L. The uncertainty associated with the choice of modeling and economic parameters was investigated by Monte Carlo simulation sensitivity analysis.

1. Introduction

The high worldwide demand for energy, the uncertainty about crude oil availability and cost as well as increasing concern about global climate change have led to a revival of interest in developing alternative energy sources that can displace fossil transportation fuels [1]. This interest is further intensified by national and international policies, such as the European Union (EU) Renewable Energy Directive of 2009 that identifies future targets for the use of renewable energy and the US Renewable Fuel Standard that requires transportation fuel sold in the US to contain a minimum volume of renewable fuels. In addition, during the 2015 ‘United Nations Framework Convention on Climate Change’ in Paris, 195 countries recognized the ‘need for an effective and progressive response to the urgent threat of climate change on the basis of the best available scientific knowledge [2]. Among the many candidate substitutes to fossil fuels (e.g., hydrogen, natural gas, syngas, etc.), biofuels have been identified as the most promising alternative, due to their renewability and potential for social, economic and environmental sustainability [3].
Biofuels produced from crop biomass have attracted immense global attention in the past two decades. The most well-known first-generation biofuels are bioethanol produced from sugar or starch-based feedstocks (e.g., sugarcane, molasses and corn) and biodiesel produced from vegetable oils (e.g., soybean and palm oil) by transesterification processes or cracking. In particular, bioethanol is a well-established biofuel for blending with gasoline with the US currently producing about 60.5 million cubic meters per year, mainly from corn grain [4]. However, there are several drawbacks associated with ethanol use. Specifically, ethanol has a lower energy content compared to gasoline, it is not amenable to pipeline distribution, and the amount that can be blended into gasoline for use in conventional vehicles is limited by environmental regulations and engine compatibility restrictions. The production of biodiesel, on the other hand, has lately received a lot of criticism due to the problems introduced by the occurring change in land use. In order to create space for the cultivation of biodiesel crops, existing forest and agricultural land is diverted to the production of biomass. This has a negative effect, not only on the levels of CO2 released to the atmosphere but also on food availability and prices. As a response to the above concerns, the EU has recently resolved to phase out first-generation biofuels by 2030 [5].
To overcome these issues and limitations, research and development initiatives have been focused on the production of higher molecular weight alcohols such as butanol. Butanol is an alcohol with four carbons and four isomers namely, n-butanol, sec-butanol, isobutanol and tert-butanol. Among these isomers, n-butanol and isobutanol are those mostly employed in the chemical industry and can be used as gasoline replacements or additives. A comparison of the different liquid fuels’ properties is presented in Table 1. Butanol exhibits similar advantages as ethanol while possessing several superior characteristics [6]. Compared with ethanol, butanol has a higher energy content, closer to that of gasoline. It has a low vapor pressure so it can be easily added to conventional gasoline. Butanol can also be used in higher blend concentrations than ethanol without requiring specially adapted vehicles that would impose compromises on performance in order to meet environmental regulations. Fuel specifications in the US for example, allow biobutanol to be blended to up to 16% by volume (equivalent to 10% by volume ethanol in terms of oxygen content) without compromising performance, durability, fuel economy or emissions. Because butanol-gasoline blends are less susceptible to separation in the presence of water and less corrosive than ethanol-gasoline blends, butanol can use the industry’s existing distribution infrastructure without requiring modifications to blending facilities, storage tanks or retail station pumps [7]. Finally, butanol can be produced using existing ethanol production facilities with relatively minor modifications.
Compared to n-butanol, isobutanol has a similar energy content but a higher octane number which is an advantage for blending into gasoline. Furthermore, isobutanol is less toxic than n-butanol and requires significantly less energy for its downstream processing, mainly due to the need to purify the acetone and ethanol that are produced as by-products of n-butanol [8]. Several global companies are pioneering the production of biobutanol including Gevo (USA), Butamax (USA) and Green Biologics (USA and UK).
n-Butanol is produced through acetone-butanol-ethanol (ABE) fermentation by solvent-producing bacteria of the Clostridium species, with acetone and ethanol as major by-products with a butanol-acetone-ethanol mass ratio of 6:3:1 [9]. On the other hand, isobutanol can be produced by engineered E. Coli and S. Cerevisiae strains [10]. The technical challenges that must be overcome in order to render the production of biobutanol economically competitive have been extensively reviewed in the literature [11,12,13] Research initiatives are focused on two main objectives: the reduction of the cost of raw materials by the utilization of alternative feedstocks and the improvement of the fermentation yield, titer and productivity by genetic engineering and application of new process technologies.
The production cost of biobutanol is considerably affected by the feedstock price which accounts for as much as 60–65% of the total cost [14]. At present, biobutanol production mainly relies on sugar and starch-based feedstocks such as sugarcane, corn or wheat. While such feedstocks are globally available, they are also used as food supplies or main food ingredients for animals and humans. Therefore, alternative feedstocks with similar availability that are not food-related need to be utilized. A promising approach is the use of renewable lignocellulosic biomass from agricultural residues (corn stover, sugarcane, bagasse, wheat straw and rice bran), forest residues (sawdust, forest thinning waste) and energy crops (switchgrass and miscanthus). These raw materials are available in greater abundance and at a lower cost than the traditional edible feedstocks.
However, lignocellulosic biomass cannot be directly converted into fuel. Cellulose and hemicellulose chains must be converted into fermentable monosaccharides before they can be utilized by microorganisms. The breakdown of cellulose by water molecules needs to be catalyzed either by chemical (acidic or alkaline) or biochemical (enzymatic) agents. Among the two, enzymatic hydrolysis is considered a more environmentally-friendly option but requires large amounts of cellulases which substantially increase the overall production cost [15]. The hydrolysis of cellulose generates glucose which can be used by a variety of microorganisms to produce biobutanol. On the other hand, the hydrolysis of hemicellulose results in different sugars, mainly pentoses, which can be used by certain microorganisms, although with potentially lower conversion percentages. To increase the efficiency of enzymatic hydrolysis, the lignocellulosic biomass must be first subjected to a pretreatment method. The pretreatment of biomass facilitates the separation and bioconversion of cellulose, hemicellulose and lignin by increasing the surface area so that enzymes can penetrate more effectively. Common pretreatment methods include wet oxidation, liquid hot water, steam explosion, ammonia fiber explosion and supercritical CO2 explosion [16].
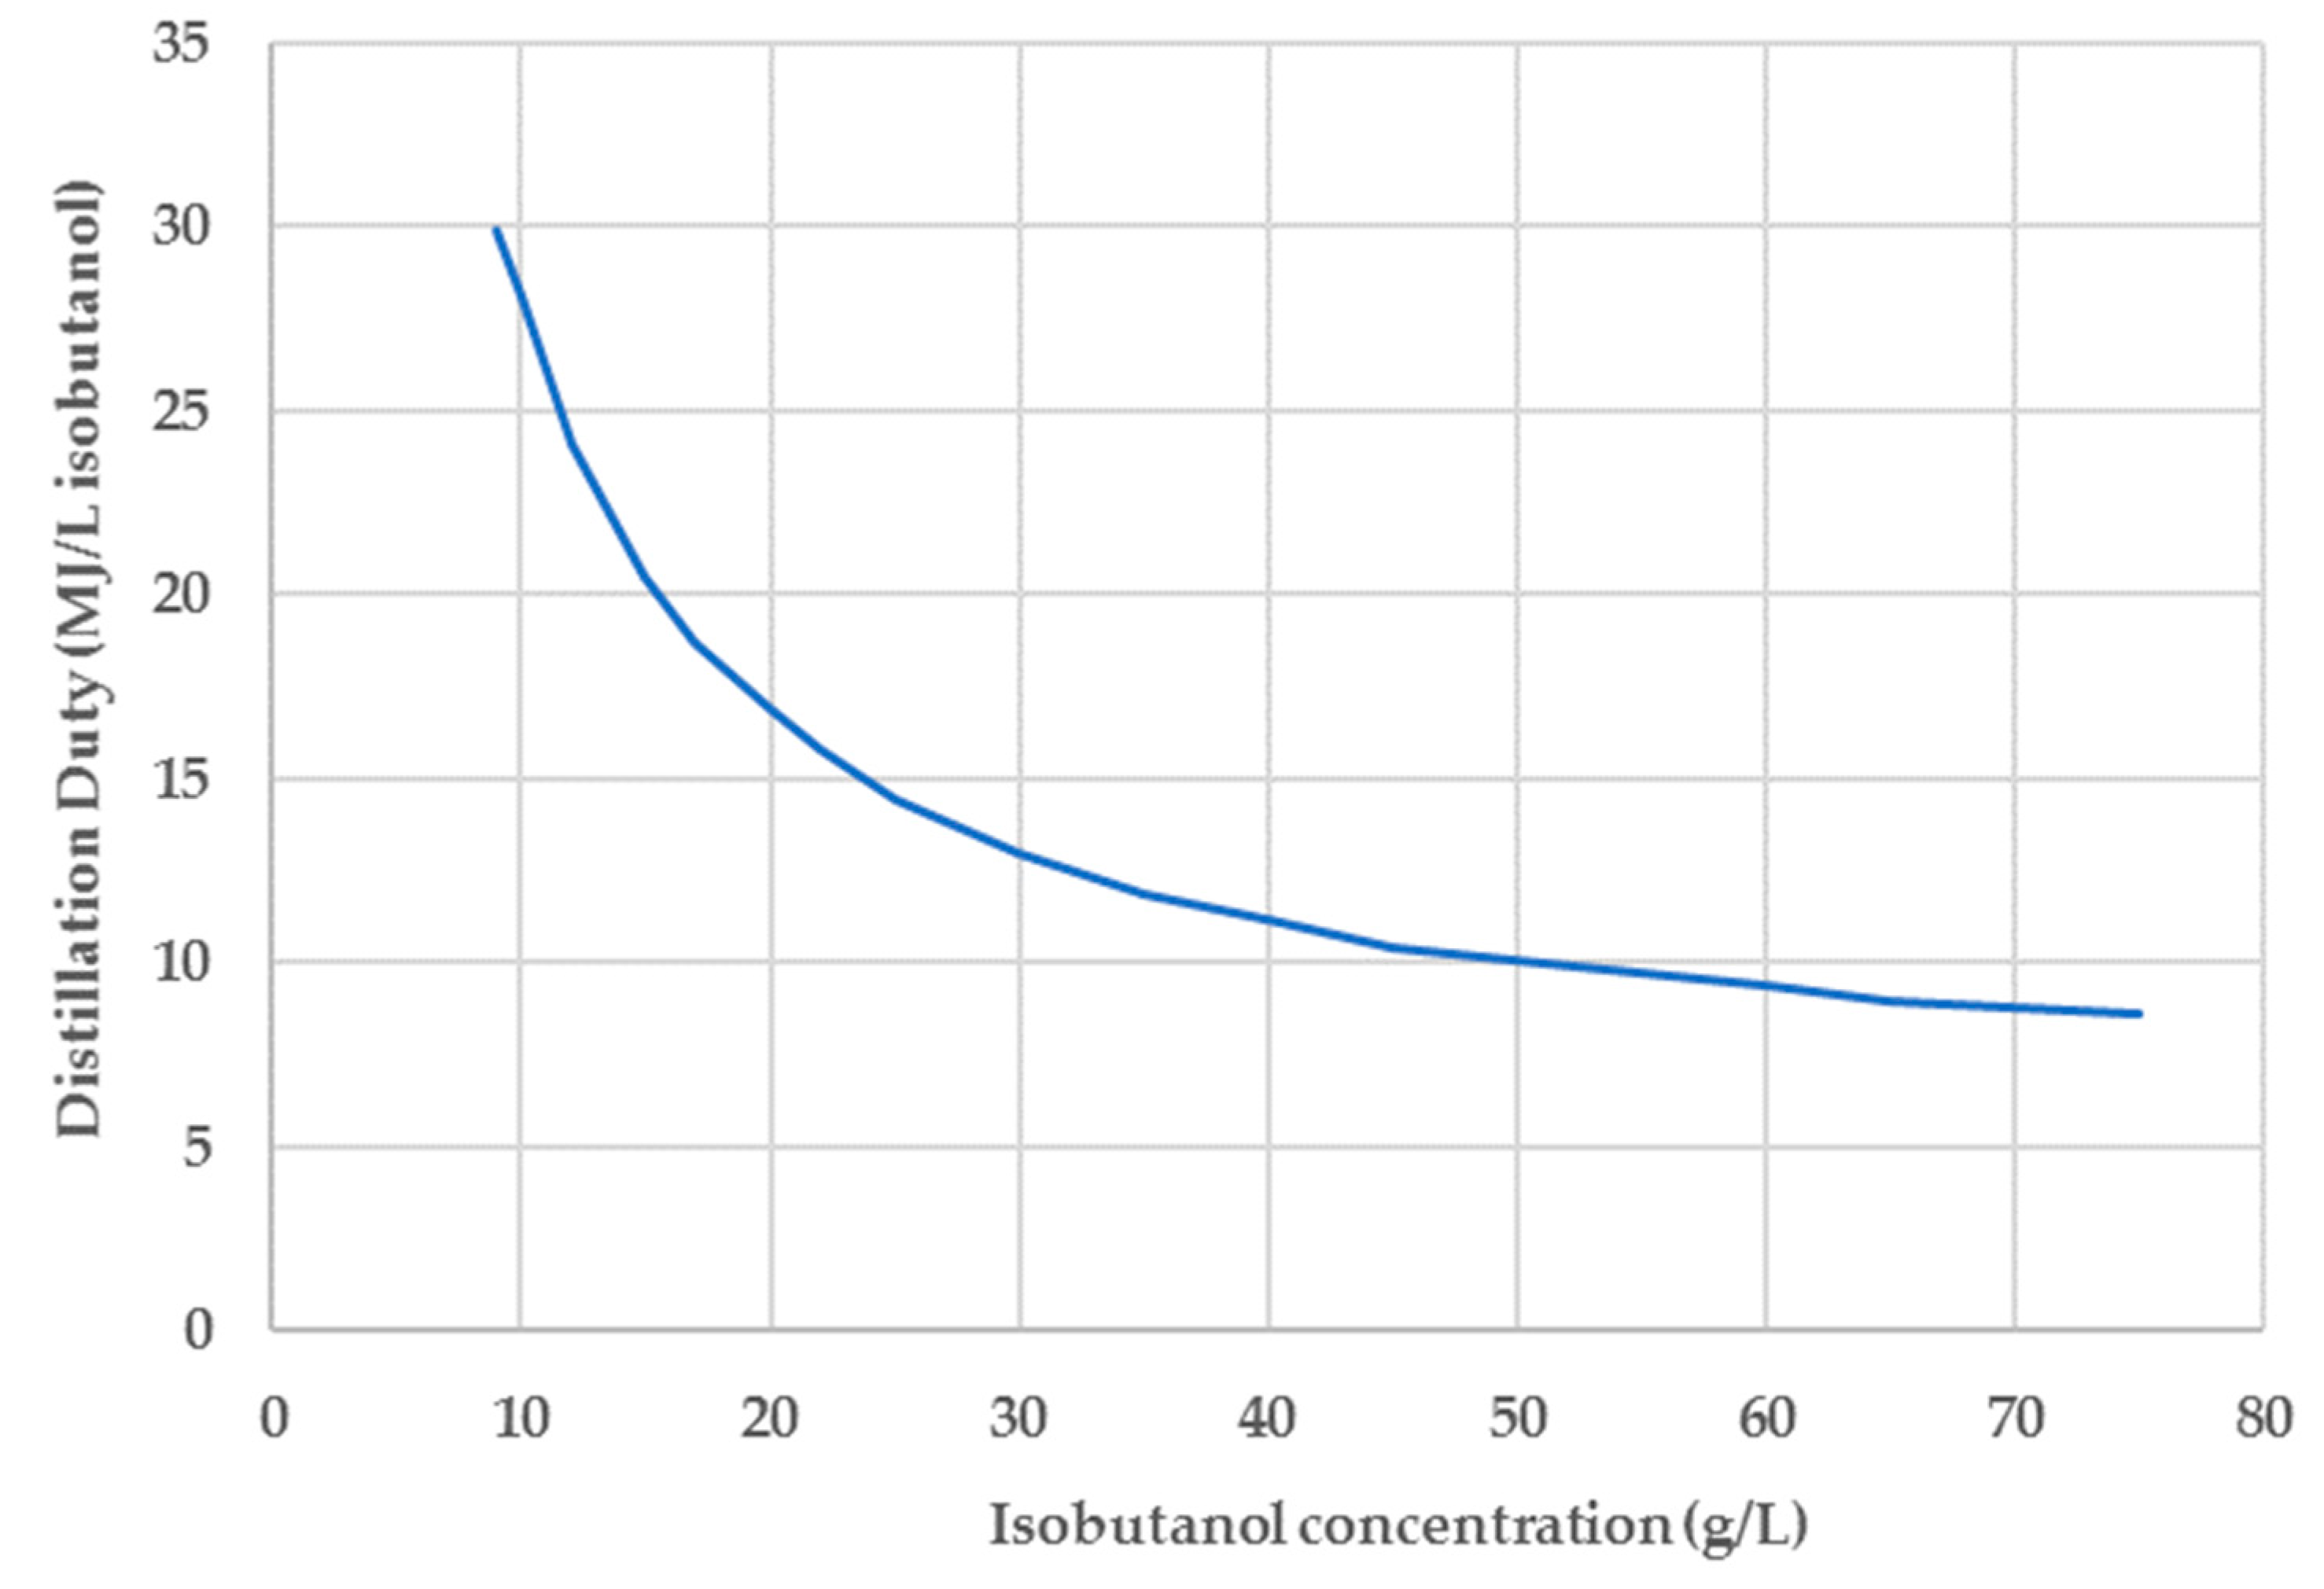
The fermentative production of biobutanol is typically characterized by low yields, limited biomass growth and product inhibition. Butanol is toxic to microorganisms even at concentrations as low as 13 g/L for n-butanol and 8 g/L for isobutanol [17,18]. This dictates that the concentration of the substrate must be sufficiently low so that its utilization is maximized. Substrate concentrations in the fermentation broth are typically limited to less than 60 g/L [11,19], which results in increased water consumption and low butanol titers after fermentation. This has a negative effect both on the energy requirements and the amount of wastewater generated in downstream processing by distillation. In other words, the feasibility of the process depends, to a large extent, on the fermentation product titer [20].
The development of robust strains with improved butanol yield and tolerance is a key point towards the economic competitiveness of biobutanol production. Atsumi et al. [21], achieved an isobutanol titer of 22 g/L in 112 h of fermentation with a yield of 0.35 g/g, using an engineered Escherichia coli strain. Smith and Liao achieved a final titer of 21.2 g/L in 99 h with a yield of 0.31 g/g by implementing an evolutionary strategy for isolating high-isobutanol-producing Escherichia coli strains [22]. Shen et al. [23], were able to achieve a n-butanol titer of 15 g/L in 3 days with a yield of 0.36 g/g by constructing a modified clostridial 1-butanol pathway in Escherichia coli. Jang et al. [24], reported a n-butanol yield of 15.4 g/L in 60 h with a yield of 0.2 g/g by engineering a hyper-ABE-producing Clostridium acetobutylicum strain to convert acetone into isopropanol. Some notable reports on biobutanol production enhancement by metabolic engineering are summarized in Table 2.
In addition to the genetic engineering, improvement of the fermentation performance can be achieved by the implementation of integrated (in situ) product recovery during fermentation. The objective of this approach is to maintain butanol concentration in the fermentor below toxic levels, thereby enabling the use of denser substrate solutions and increased product titers, yields and productivities. Such integrated butanol recovery technologies include adsorption, liquid–liquid extraction, pervaporation, reverse osmosis, vacuum fermentation, vacuum stripping (flash fermentation) and gas stripping. The different alternatives have been extensively reviewed in several publications [17,27,28,29,30,31]. A summary of results obtained either from laboratory scale experiments or computational modeling is presented in Table 3. By using a stoichiometric fermentation model and rigorous vapor liquid equilibrium (VLE) calculations, Mariano et al. concluded that continuous flash fermentation could reduce the energy requirements of the process by up to 39% compared to conventional fermentation without product removal [32]. Qureshi et al. achieved a final n-butanol titer of 105.3 g/L with a yield of 0.23 g/g in a fed-batch fermentation system with butanol removal by pervaporation [33]. Finally, Baez et al. reported an isobutanol titer of 50 g/L in 72 h with a yield of 0.29 g/g using gas stripping and an Escherichia coli strain engineered for high isobutanol production [34].
The development of sustainable biofuel processes is a key factor for the replacement of fossil fuels. The assessment of such processes at an economic and life cycle aspect requires information which is usually not available at the early stage of development. To this end, process simulation tools can offer a valuable alternative. Such tools have been used for many decades in the chemical industry to facilitate process development and optimization. Similar benefits can be obtained in the biotechnology arena where simulation tools can be used for the design, economic feasibility evaluation and environmental impact assessment of biorefinery plants. Despite a large number of publications on the improvement of fermentation characteristics by metabolic engineering and integrated product recovery methods, only a few publications exist on the economic assessment of industrial-scale biobutanol production plants (see Table 4). Most of these publications refer to large-scale n-butanol production plants with capital investments of the order of $300–400M. To the best of the authors’ knowledge, there is only one techno-economic study that focuses on isobutanol production [8]. An evident issue from what is presented in Table 4 is the ambiguity introduced by the economic and modeling assumptions. This is reflected by the large discrepancy in feedstock costs, specific TCI (i.e., the total capital investment per annual throughput), the overall reported yields per amount of dry feed, etc. As a result, the unit production cost and other related output parameters (e.g., minimum product selling price, net present value, return on investment) which provide an insight into the economic feasibility of a project may vary substantially. This kind of uncertainty is usually not considered at all or is, at best, partially addressed by single-point sensitivity analysis where specific key parameters are varied independently.
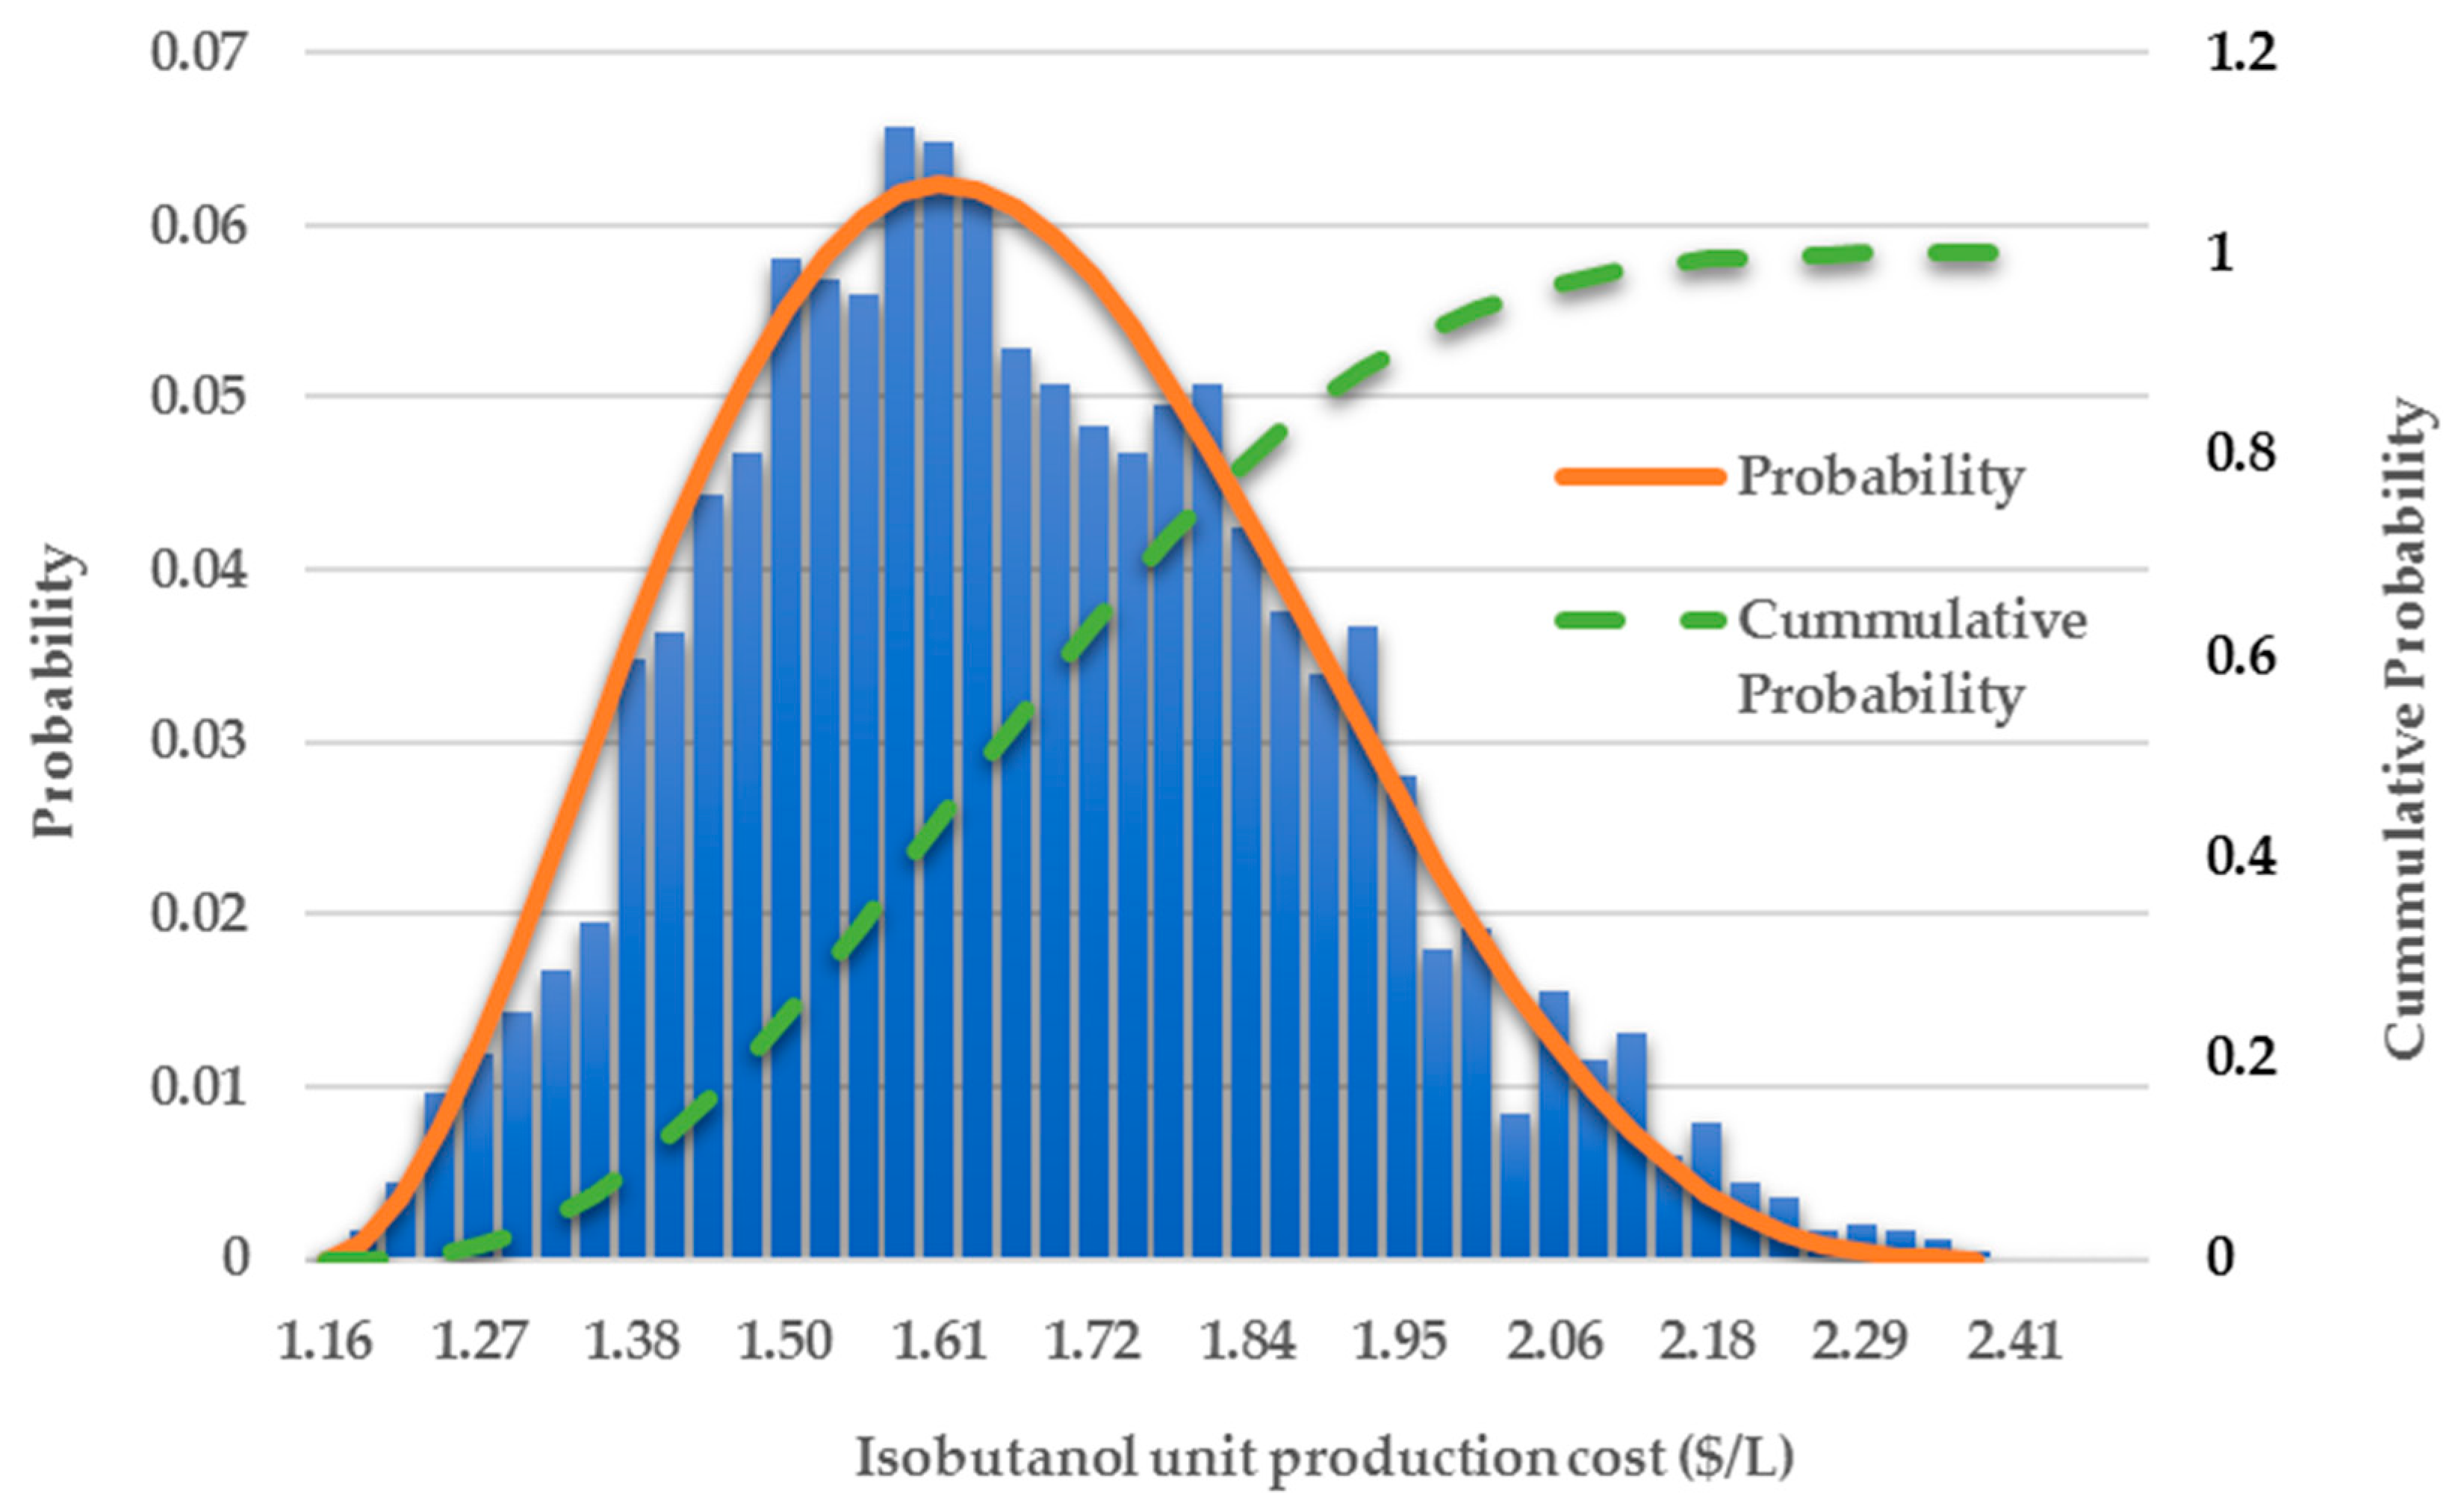
This work presents a techno-economic analysis of two alternative process scenarios for a small-scale biorefinery that produces isobutanol from corn stover. The uncertainty in the estimation of the unit production cost associated with the choice of certain key parameters (e.g., sugars conversion, corn stover cost, enzyme price and loading ratio) is addressed by a Monte Carlo simulation. This is a much better approach than the single-point sensitivity analysis because the parameters are varied simultaneously within specified ranges, so a probability distribution of the unit production cost is generated. It is then possible to estimate the probability that the unit production cost will be below a certain value that is considered to make the project economically viable.

2. Materials and Methods

The two conceptual biorefinery models for the production of isobutanol from corn stover were developed and evaluated with SuperPro Designer, a process simulator marketed by Intelligen, Inc. (Scotch Plains, NJ, USA). The first scenario (SCA) simulates a conventional batch fermentation plant without integrated product removal. In the second scenario (SCB), an integrated isobutanol removal system by vacuum stripping is considered, in order to maintain the isobutanol concentration in the fermentor below the toxic threshold. The two scenarios were compared based on equal fermentation volume and specifically, by considering eight fermentors with 500 m3 of working volume capacity each. The main modeling and economic assumptions made in the analysis are presented in Table 5. Those values were selected based on previous relevant publications [8,31,36,37,38] as well as on the authors’ engineering judgement. In the case of SCA, the initial concentration of sugars in the fermentor is limited to 60 g/L and the conversion of sugars was assumed to be 85% (assuming equal conversion of pentoses and hexoses) with the remaining percentage converted to biomass cells. The integrated product removal in SCB allows for the utilization of a concentrated sugars feed with an effective concentration of 158 g/L and a slightly improved sugars conversion of 90%. Notice that experimental evidence has revealed that certain strains (e.g., C. beijerinckii BA101 and C. acetobutylicum) can be fermented without substrate inhibitory effects at substrate concentrations of 180 g/L and even 200 g/L in the presence of integrated product removal [29,35,39]. Alternatively, a fed-batch strategy can be adopted without changing the model results, where the substrate concentration in the fermentor at any given time does not exceed 90 g/L, as described in Ezeji et al. [40]. Based on the above assumptions, the plant in the case of SCA has the capacity to process 6.8 MT/h of corn stover and produce 900 L/h of isobutanol while the plant in the case of SCB processes 18 MT/h of corn stover and produces 2514 L/h of isobutanol.
A simplified flowchart of the process illustrating its main sections, namely, the pretreatment and enzymatic hydrolysis section, the fermentation section, the purification section and the utilities section, is shown in Figure 1. The vacuum flash chamber and condenser downstream the fermentation reactor, comprise the integrated product removal system implemented in SCB. The detailed SuperPro Designer models for the two scenarios analyzed in this study are available upon request.

2.1. Pretreatment and Enzymatic Hydrolysis Section

Corn stover is initially mixed with water and sulfuric acid (at a proportion of 0.3 wt%) and the slurry is preheated before entering the thermal pretreatment stage. During the thermal pretreatment by steam explosion, it is assumed that 10% of cellulose is converted to hexoses and 80% of hemicellulose is converted to pentoses. Subsequently, the slurry is neutralized with calcium hydroxide (at a proportion of 1 wt%) and is fed to the saccharification reactor where the enzymatic hydrolysis takes place. According to the literature, the enzyme amount required for saccharification varies from 5 to 35 mg/g cellulose [41]. In this study, a baseline value of 20 mg/g cellulose was selected. The enzymatic hydrolysis is assumed to convert 90% of the remaining cellulose and hemicellulose to hexoses and pentoses, respectively. The hydrolyzed stream which contains 15.3 wt% hexoses, 8.9 wt% pentoses and 71.7 wt% water is filtered and directed to the fermentation section. The filtration residues are directed to the utilities section for the generation of steam and electricity.

2.2. Fermentation Section

In the case of SCA, it was assumed that the final isobutanol titer is 22 g/L with a yield of 0.37 g/g. In the case of SCB, the fermentors are equipped with a vacuum stripping system that processes ~47 m3/h of fermentation broth, in order to maintain the isobutanol concentration in the fermentor below 22 g/L. The use of vacuum was originally proposed for the reduction of ethanol toxicity to yeast in ethanol production processes [42,43] and has been shown to be effective for butanol, despite the fact that the latter is less volatile than water [
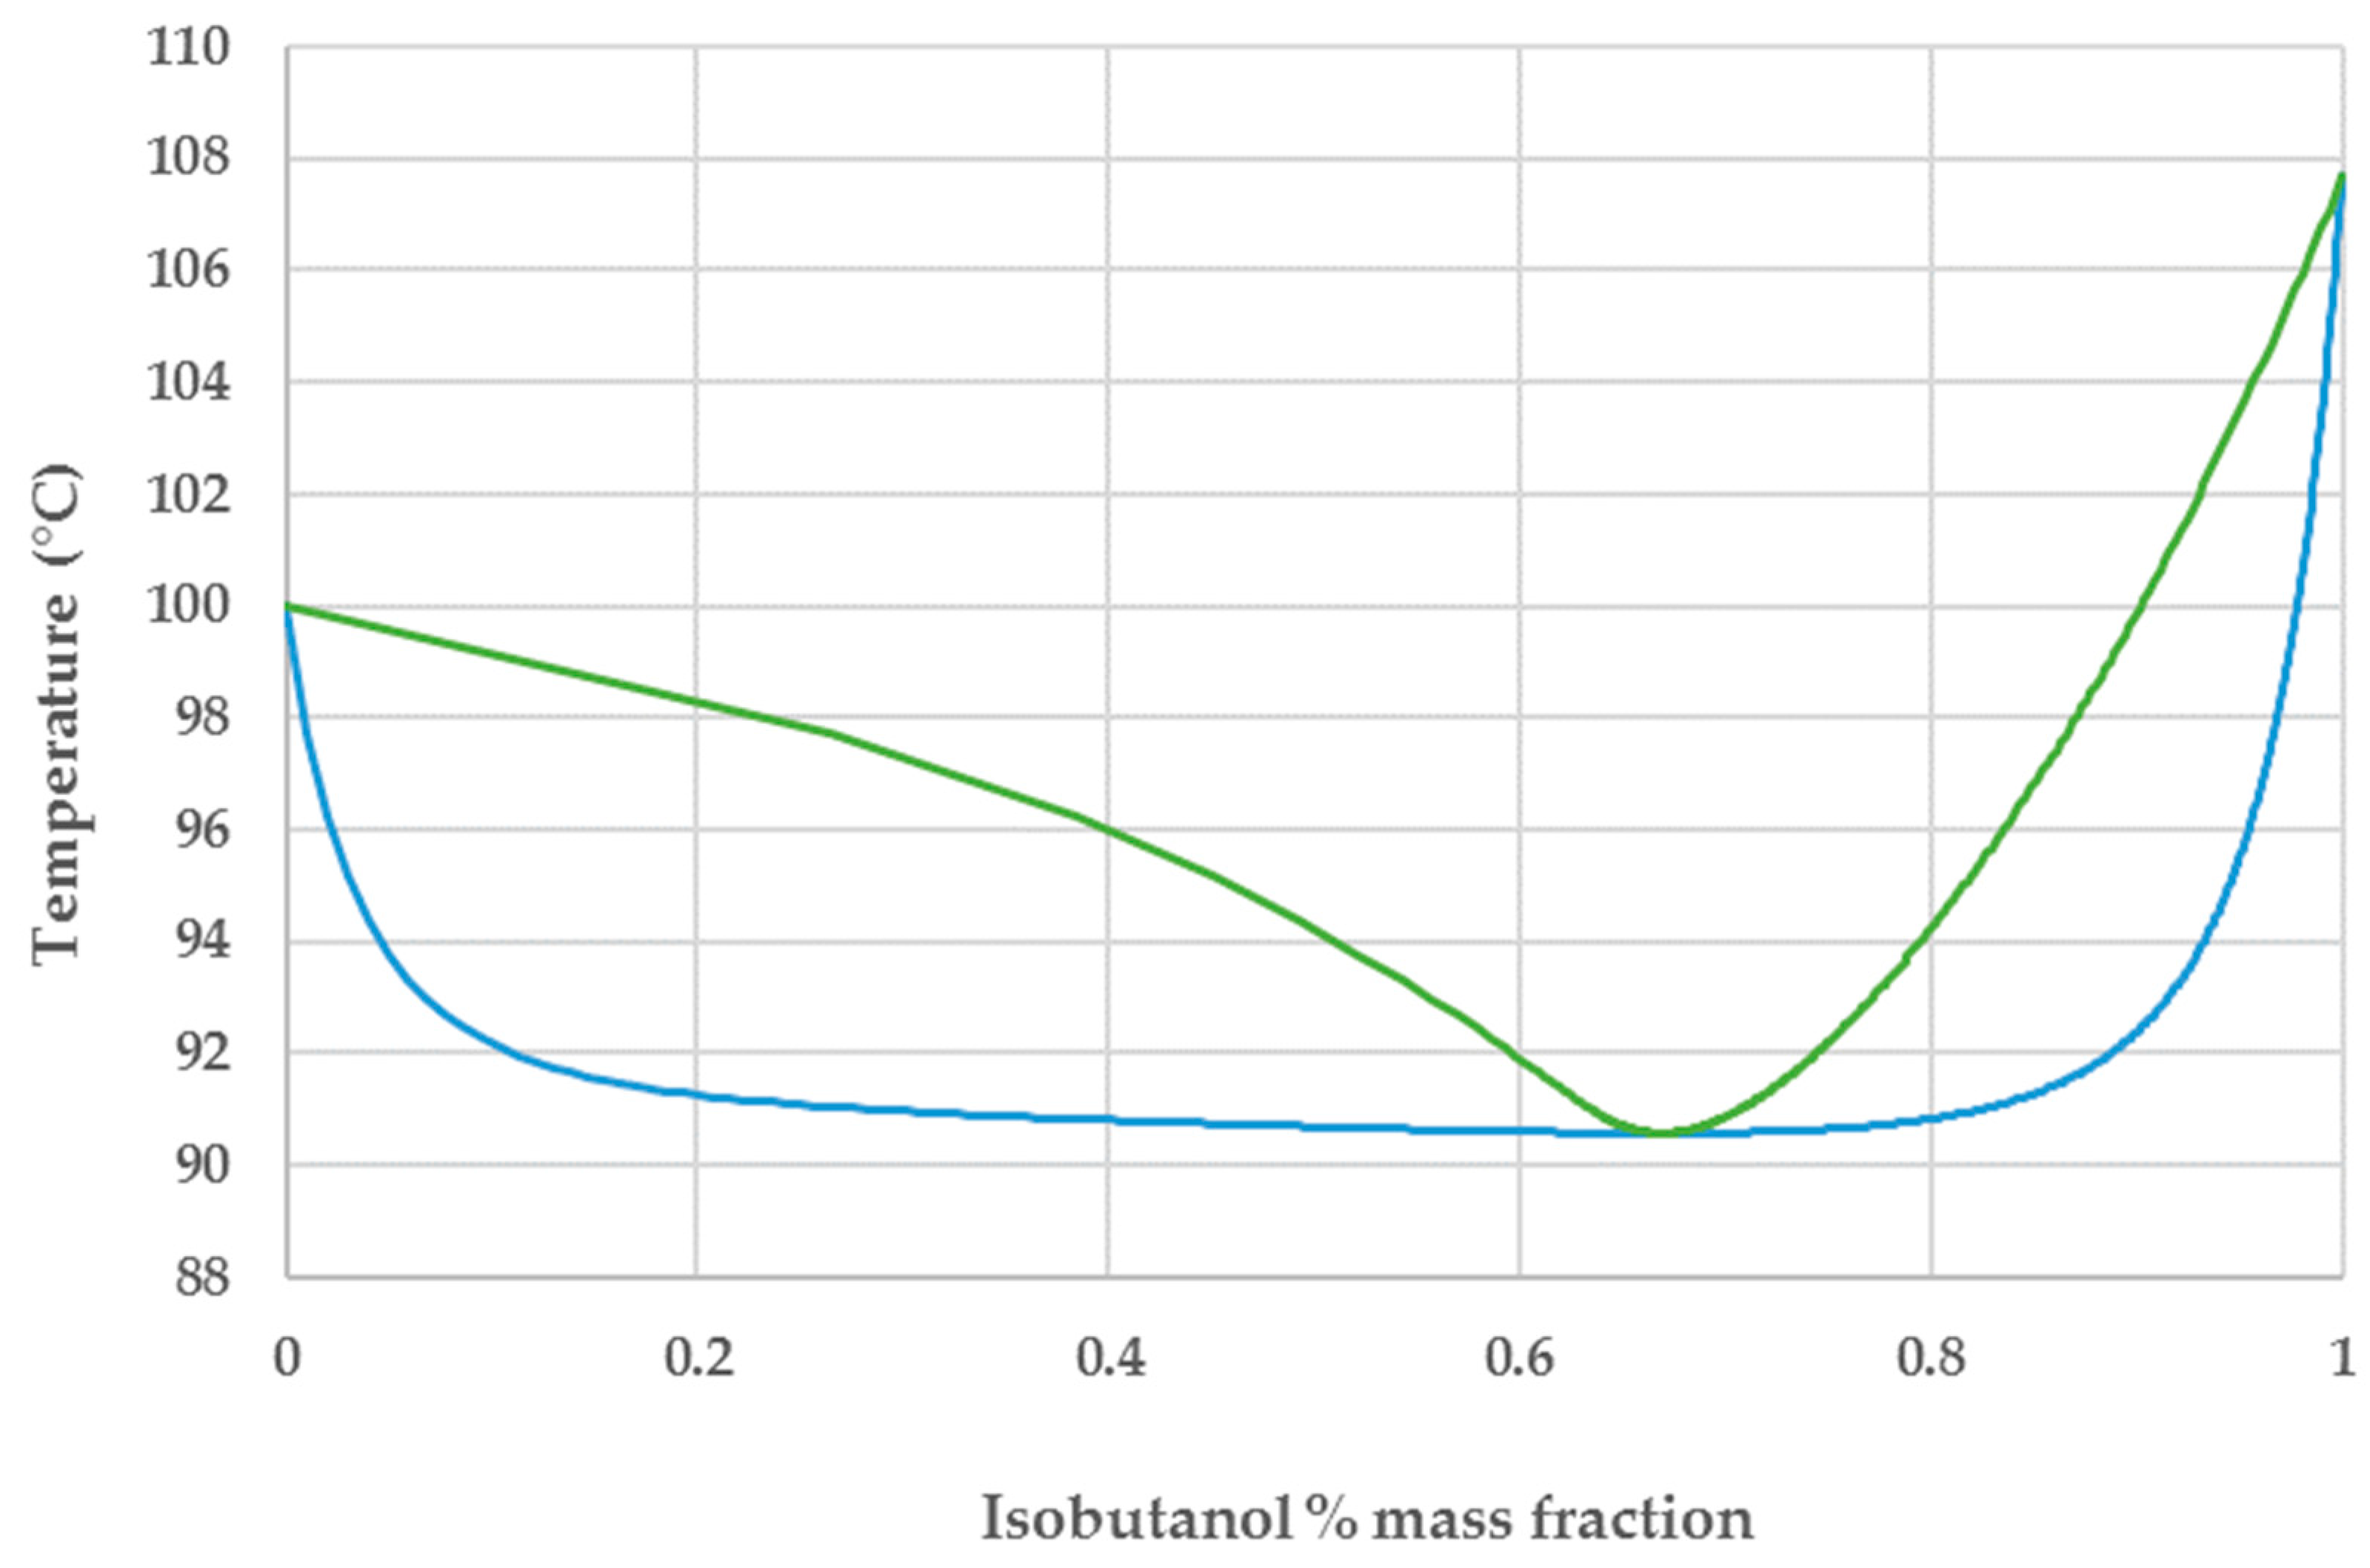
44]. The feasibility of vacuum stripping is evident from the water-isobutanol VLE chart depicted in Figure 2. When a water–isobutanol mixture with sub-azeotropic composition is heated at a temperature above its bubble point, it forms a vapor phase where the isobutanol content is substantially increased. The fermentation broth is circulated through a vacuum flash tank operating at very low pressure (i.e., ≈7 kPa) where an isobutanol-rich vapor phase and an isobutanol-depleted liquid phase are generated. The vapor phase, after condensation, is sent to the purification section while the liquid phase is recycled back to the fermentor. The isobutanol titer in the combined stream from the final fermentation broth and condensed vapor phase is around 50 g/L, the same as the value reported by Baez et al. for gas-stripping integrated product removal [34]. In this case, the fermentation yield is equal to 0.39 g/g.

2.3. Purification Section

As depicted in Figure 2, the isobutanol-water mixture is characterized by an azeotrope at 66.9 wt% isobutanol [46]. The azeotropic behavior was captured by using a modified Raoult’s law with activity coefficients calculated by the Wilson model. Isobutanol can be purified to a very high degree using a system of two distillation columns in combination with a decanter that exploits its low solubility in water to break the azeotrope [30]. In the first column the product is concentrated by removing almost 90% of the water content. When the concentrated top stream (with sub-azeotropic composition) is allowed to settle in the decanter it forms two liquid phases, an aqueous phase with 8.7 wt% and an organic phase with 80 wt% isobutanol (i.e., above the azeotropic composition) [8]. The aqueous phase is recycled back to the first distillation column and the organic phase is directed to the second distillation column where isobutanol can be separated to a purity of 99.9 wt%. Notice that, due to the higher amount of isobutanol in the feed of the downstream processing section in the case of SCB (i.e., three times more), the second distillation column processes almost twice the amount of material compared to SCA. Also notice that, to minimize the distillation energy requirements, the fermentation beer is preheated by the wastewater stream that comes out of the first distillation column.

2.4. Utilities Section

The utilities section uses the residual biomass from the pretreatment and enzymatic hydrolysis section to produce high-pressure and low-pressure steam as well as a modest amount of electricity. The quantity of high- and low-pressure steam produced is adequate to match the requirements of the entire process. In the case of SCA, 0.5 MT/h of corn stover needs to be diverted directly to the boiler, additionally to the residual biomass, to satisfy the above assumption. The electricity that is produced is used to cover a portion of the power requirements of the process and reduce the annual operating cost.

3. Results and Discussion

3.1. Capital Investment Cost

The objective of the analysis presented in this section is the estimation of the total capital investment cost (TCI), the annual operating cost (AOC) and the unit production cost of isobutanol. The project is assumed to have a lifetime of 30 years and an annual operating time of 343 days (49 weeks). The depreciation of the capital investment was calculated by the straight-line method for a period of 10 years and a salvage value equal to 5% of the initial cost.
The TCI of the plant was estimated based on the equipment purchase cost (EPC) following a well-established engineering methodology described in detail in the literature [47]. The equipment sizes were calculated by the simulation tool, based on the mass and energy balances. The EPC was estimated based on information from vendors, literature sources and the SuperPro Designer equipment cost database. The total investment is $54.3M and $80.3M for SCA and SCB, respectively. A breakdown of the TCI along with the various factors employed for its estimation is presented in Table 6.

3.2. Annual Operating Cost

The AOC breakdown for the two scenarios is summarized in Table 7. In the case of SCA, the facility dependent cost (i.e. equipment depreciation, plant maintenance, insurance and local) was the most significant expense with 32.2% of the total, while the cost of raw materials came second with 28.2%. The cost of raw material was the most significant item in the case of SCB, accounting for 39.5% of the AOC. In both cases, the cost of stover accounted for almost 50% of the total cost of raw materials. Despite the same fermentor working volume, the plant in the case of SCB is able to process more than twice as much corn stover compared to SCA (see Table 5). Consequently, the pretreatment and utilities sections have a much higher capacity which explains the increased raw materials, facility dependent and utilities costs.

3.3. Isobutanol Unit Production Cost

The unit production cost of isobutanol for SCA was $2.24/L. The integrated product removal employed in SCB reduced that cost by 63% to $1.42/L, due to the reduction of the energy requirements for product purification which is analyzed in the next section. A cash flow analysis indicated that the minimum isobutanol selling price for an assumed 10% internal rate of return would be $2.78/L for SCA and $1.70/L for SCB. Based on the current market prices for automotive fuels, SCA is far from being economically feasible while SCB could be considered feasible depending on the country of operation. Notice that economic feasibility is also affected by the level of subsidies supported by local governments as mandated by the recognized worldwide need to prevent further climate change by reducing CO2 emissions.
A classification of the various elements contributing to the above estimates is shown in Figure 3. The facility-dependent cost has the leading contribution in the case of SCA with $0.72/L, followed by the cost of raw materials which adds $0.63/L., the labor-dependent cost with $0.40/L and the cost of utilities with $0.33/L. For SCB, the cost of raw material is the most significant at $0.56/L followed by the facility-dependent cost which contributes $0.38/L and the cost of utilities adding an extra $0.27/L.

3.4. Energy Demand for Downstream Processing

Figure 4 presents the effect of the isobutanol fermentation titer on the energy demand for the downstream processing, based on simulation data. The energy consumption is greatly affected in titers between 10–25 g/L which is exactly the range of titers that can be attained without product removal during the fermentation. The slope of the curve becomes smoother at higher isobutanol titers and the distillation energy demand approaches asymptotically the value of ≈7 MJ/L.
In the case of SCA, the isobutanol titer was 22 g/L which corresponds to an energy demand for downstream processing of 15.8 MJ/L. In SCB where the titer is 50 g/L, this energy demand is 10 MJ/L which represents a 35% decrease. In this case however, one must also account for an additional 1.8 MJ/L for the electricity consumed by the vacuum stripping system. As a point of reference, since the proposed use of isobutanol is for transportation fuel, the heat of combustion of isobutanol is 26.6 MJ/L (see Table 1). Given that the energy demand for purification should be 2.5–3 times lower than the above energy content [30,48], it is clear that the fermentation titer should be greater than 45 g/L in order to render the process economically feasible from an energy point of view.

3.5. Sensitivity Analysis on the Unit Production Cost of Isobutanol

To address the uncertainty associated with model assumptions, a sensitivity analysis was performed by Monte Carlo simulation. Crystal ball, a Microsoft Excel add-on was used to generate 6000 possible cases by varying selected economic and process parameters based on uniform probability distributions. The set of parameter values was passed to SuperPro Designer using appropriate Visual Basic for Applications (VBA )functions that communicate with the Component Object Module (COM) interface of the software, and the mass and energy balances were solved to determine the unit production cost of isobutanol in each case. The sensitivity parameters considered in the analysis and their respective probability distribution functions are shown in Table 8. Clearly, the results of the Monte Carlo simulation will depend upon the choice of the distribution and variation range of the sensitivity parameters considered. In the absence of more detailed information, a uniform distribution was assumed for all parameters (i.e., all the values within a variation range have equal probability).
Figure 5 presents the results of the Monte Carlo simulation for the case of SCB. The results are fitted by a beta distribution with parameters α = 3.15 and β = 4.73. As illustrated, the unit production cost of isobutanol varies from $1.16/L to $2.38/L. From the cumulative probability distribution function, it is possible to determine the probability that the unit production cost of isobutanol will fall below a certain threshold value. For example, based on the results obtained, there is a 94.2% certainty that the unit production cost will be below 2$/L and 24% that it will be below $1.5/L.
As can be seen from Figure 6, the conversion of hexoses and the corn stover cost were found to have the most significant effect on the unit production cost of isobutanol with 34.1% and 25.9% contribution to the variance, respectively. The enzyme cost was the third most important parameter with a 16% contribution to the variance while the enzyme loading ratio and pentose conversion were slightly less significant.

4. Conclusions

Isobutanol is a particularly promising liquid transportation fuel, with advantages over n-butanol and ethanol as part of a broad selection of alternative energy solutions. Unfortunately, its production is typically characterized by low fermentation titers and yields which lead to high water consumption and downstream processing energy demand. These limitations can be overcome by utilizing genetically engineered isobutanol-tolerant strains supplemented by integrated product recovery during fermentation. This work presents a techno-economic assessment of two alternative process scenarios with equal fermentation volume for the production of isobutanol from corn stover. The first scenario is a conventional batch fermentation plant without integrated product removal from the fermentor while the second scenario utilizes a vacuum-stripping integrated system. In situ product recovery results in substantially increased effective fermentation titer and yield and reduced product purification cost. Therefore, the product removal during fermentation is an essential element for the economic feasibility of the isobutanol production process.
Process simulation tools play an important role throughout the life cycle of product development and commercialization. In process development, such tools are becoming increasingly useful as a means to analyze, improve, communicate, and document processes. During the transition from development to manufacturing, they facilitate technology transfer and process fitting. Process simulation combined with Monte Carlo analysis can be used to quantify the impact of uncertainty and variability.

Author Contributions

Conceptualization, A.R. and N.M.; methodology, A., N.M. and F.Z.; writing—original draft preparation, A.R.; writing—review and editing, A.K., F.Z. and D.P.; supervision, D.P.

Funding

This research received no external funding.

Conflicts of Interest

The authors A.R., A.K. and D.P. are employed by Intelligen, Inc. (Scotch Plains, NJ, USA), which develops and markets the SuperPro Designer software.

References

  1. Conijn, S.; Corré, W.; Langeveld, H.; Davies, J. Evaluation of the Effect of Agricultural Management on Energy Yield and Greenhouse Gas Emission Reduction of Bioenergy Production Chains. Nat. Resour. 2014, 5, 322–335. [Google Scholar] [CrossRef] [Green Version]
  2. UNFCCC. Conference of the Parties (COP). Adoption of the Paris Agreement-Conference of the Parties COP 21; UNFCCC: Paris, France, 2015. [Google Scholar]
  3. Singh, A.; Olsen, I.; Singh, P. A Viable Technology to Generate Third-Generation Biofuel. J. Chem. Technol. Biotechnol. 2011, 86, 1349–1353. [Google Scholar] [CrossRef]
  4. Climate Ethanol Alliance Promotes Biofuels at COP23|UNFCCC. Available online: http://unfccc.int/news/climate-ethanol-alliance-promotes-biofuels-at-cop23 (accessed on 1 March 2019).
  5. European Commission. Supplementing Directive (EU) 2018/2001 as Regards the Determination of High Indirect Land-Use Change-Risk Feedstock for Which a Significant Expansion of the Production Area into Land with High Carbon Stock Is Observed and the Certification of Low Indirect Land-Use Change-Risk Biofuels, Bioliquids and Biomass Fuels; European Commission: Brussels, Belgium, 2018. [Google Scholar]
  6. Gevo White Paper Transportation Fuels. Isobutanol—A Renewable Solution for the Transportation Fuels Value Chain. Available online: http://www.etipbioenergy.eu/images/wp-isob-gevo.pdf (accessed on 1 March 2019).
  7. Butamax Advanced Biofuels. Available online: http://www.butamax.com/The-Bio-Isobutanol-Advantage/Higher-Value-Biofuel.aspx (accessed on 1 March 2019).
  8. Tao, L.; Tan, E.C.D.; McCormick, R.; Zhang, M.; Aden, A.; He, X.; Zigler, B.T. Techno-Economic Analysis and Life-Cycle Assessment of Cellulosic Isobutanol and Comparison with Cellulosic Ethanol and n-Butanol. Biofuels, Bioprod. Biorefining 2014, 8, 30–48. [Google Scholar] [CrossRef]
  9. Jones, D.T.; Woods, D.R. Acetone-Butanol Fermentation Revisited. Microbiol. Rev. 1986, 50, 484–524. [Google Scholar] [PubMed]
  10. Ezeji, T.C.; Qureshi, N.; Ujor, V. Isobutanol Production from Bioenergy Crops; Elsevier: Amsterdam, The Netherlands, 2014. [Google Scholar] [CrossRef]
  11. Green, E.M. Fermentative Production of Butanol—The Industrial Perspective. Curr. Opin. Biotechnol. 2011, 22, 337–343. [Google Scholar] [CrossRef]
  12. Cao, G.; Sheng, Y. Biobutanol Production from Lignocellulosic Biomass: Prospective and Challenges. J. Bioremed. Biodegrad. 2016, 7. [Google Scholar] [CrossRef]
  13. Haigh, K.F.; Petersen, A.M.; Gottumukkala, L.; Mandegari, M.; Naleli, K.; Görgens, J.F. Simulation and Comparison of Processes for Biobutanol Production from Lignocellulose via ABE Fermentation. Biofuels, Bioprod. Biorefining 2018, 12, 1023–1036. [Google Scholar] [CrossRef]
  14. Mansur, M.C.; Rehmann, M.S.; Zohaib, M. ABE Fermentation of Sugar in Brazil, University of Pennsylvania. Available online: Repository.upenn.edu/cbe_sdr/17/ (accessed on 18 March 2019).
  15. Kolesinska, B.; Fraczyk, J.; Binczarski, M.; Modelska, M.; Berlowska, J.; Dziugan, P.; Antolak, H.; Kaminski, Z.; Witonska, I.; Kregiel, D. Butanol Synthesis Routes for Biofuel Production: Trends and Perspectives. Materials 2019, 12, 350. [Google Scholar] [CrossRef] [PubMed]
  16. Shirkavand, E.; Baroutian, S.; Gapes, D.J.; Young, B.R. Combination of Fungal and Physicochemical Processes for Lignocellulosic Biomass Pretreatment—A Review. Renew. Sustain. Energy Rev. 2016, 54, 217–234. [Google Scholar] [CrossRef]
  17. Mariano, A.P.; Qureshi, N.; Filho, R.M.; Ezeji, T.C. Bioproduction of Butanol in Bioreactors: New Insights from Simultaneous in Situ Butanol Recovery to Eliminate Product Toxicity. Biotechnol. Bioeng. 2011, 108, 1757–1765. [Google Scholar] [CrossRef]
  18. Brynildsen, M.P.; Liao, J.C. An Integrated Network Approach Identifies the Isobutanol Response Network of Escherichia coli. Mol. Syst. Biol. 2009, 5, 1–13. [Google Scholar] [CrossRef] [PubMed]
  19. Al-Shorgani, N.K.N.; Shukor, H.; Abdeshahian, P.; Kalil, M.S.; Yusoff, W.M.W.; Hamid, A.A. Enhanced Butanol Production by Optimization of Medium Parameters Using Clostridium Acetobutylicum YM1. Saudi J. Biol. Sci. 2018, 25, 1308–1321. [Google Scholar] [CrossRef]
  20. Stephanopoulos, G. Challenges in Engineering Microbes for Biofuels Production. Science 2007, 315, 801–804. [Google Scholar] [CrossRef] [PubMed] [Green Version]
  21. Atsumi, S.; Hanai, T.; Liao, J.C. Non-Fermentative Pathways for Synthesis of Branched-Chain Higher Alcohols as Biofuels. Nature 2008, 451, 86–89. [Google Scholar] [CrossRef]
  22. Smith, K.M.; Liao, J.C. An Evolutionary Strategy for Isobutanol Production Strain Development in Escherichia coli. Metab. Eng. 2011, 13, 674–681. [Google Scholar] [CrossRef] [PubMed]
  23. Shen, C.R.; Lan, E.I.; Dekishima, Y.; Baez, A.; Cho, K.M.; Liao, J.C. Driving Forces Enable High-Titer Anaerobic 1-Butanol Synthesis in Escherichia coli. Appl. Environ. Microbiol. 2011, 77, 2905–2915. [Google Scholar] [CrossRef] [PubMed]
  24. Jang, Y.S.; Malaviya, A.; Lee, J.; Im, J.A.; Lee, S.Y.; Lee, J.; Eom, M.H.; Cho, J.H.; Seung, D.Y. Metabolic Engineering of Clostridium Acetobutylicum for the Enhanced Production of Isopropanol-Butanol-Ethanol Fuel Mixture. Biotechnol. Prog. 2013, 29, 1083–1088. [Google Scholar] [CrossRef] [PubMed]
  25. Jang, Y.-S.; Lee, J.Y.; Lee, J.; Park, J.H.; Im, J.A.; Eom, M.-H.; Lee, J.; Lee, S.-H.; Song, H.; Cho, J.-H.; et al. Enhanced Butanol Production Obtained by Reinforcing the Direct Butanol-Forming Route in Clostridium Acetobutylicum. MBio 2012, 3, e00314-12. [Google Scholar] [CrossRef]
  26. Formanek, J.; Mackie, R.; Blaschek, H.P. Enhanced Butanol Production by Clostridium Beijerinckii BA101 Grown in Semidefined P2 Medium Containing 6 Percent Maltodextrin or Glucose. Appl. Environ. Microbiol. 1997, 63, 2306–2310. [Google Scholar]
  27. Naleli, K. Process Modelling in Production of Biobutanol from Lignocellulosic Biomass via ABE Fermentation. Master’s Thesis, Stellenbosch University, Stellenbosch, South Africa, 2016. [Google Scholar]
  28. Outram, V.; Lalander, C.A.; Lee, J.G.M.; Davies, E.T.; Harvey, A.P. Applied in Situ Product Recovery in ABE Fermentation. Biotechnol. Prog. 2017, 33, 563–579. [Google Scholar] [CrossRef]
  29. Ezeji, T.C.; Qureshi, N.; Blaschek, H.P. Bioproduction of Butanol from Biomass: From Genes to Bioreactors. Curr. Opin. Biotechnol. 2007, 18, 220–227. [Google Scholar] [CrossRef] [PubMed]
  30. Vane, L.M. Separation Technologies for the Recovery and Dehydration of Alcohols from Fermentation Broths. Biofuels Bioprod. Biorefin. 2008, 553–588. [Google Scholar] [CrossRef]
  31. Tao, L.; He, X.; Tan, E.C.D.; Zhang, M.; Aden, A. Comparative Techno-Economic Analysis and Reviews of n-Butanol Production from Corn Grain and Corn Stover. Biofuels Bioprod. Biorefin. 2014, 8, 342–361. [Google Scholar] [CrossRef]
  32. Mariano, A.P.; Keshtkar, M.J.; Atala, D.I.P.; Filho, F.M.; Regina, M.; Maciel, W.; Filho, R.M.; Stuart, P. Energy Requirements for Butanol Recovery Using the Flash Fermentation Technology. Energy Fuels 2016, 25, 2347–2355. [Google Scholar] [CrossRef]
  33. Qureshi, N.; Meagher, M.M.; Huang, J.; Hutkins, R.W. Acetone Butanol Ethanol (ABE) Recovery by Pervaporation Using Silicalite-Silicone Composite Membrane from Fed-Batch Reactor of Clostridium Acetobutylicum. J. Memb. Sci. 2001, 187, 93–102. [Google Scholar] [CrossRef]
  34. Baez, A.; Cho, K.M.; Liao, J.C. High-Flux Isobutanol Production Using Engineered Escherichia coli: A Bioreactor Study with In Situ Product Removal. Appl. Microbiol. Biotechnol. 2011, 90, 1681–1690. [Google Scholar] [CrossRef]
  35. Maddox, I.S.; Qureshi, N.; Roberts-Thomson, K. Production of Acetone-Butanol-Ethanol from Concentrated Substrate Using Clostridium Acetobutylicum in an Integrated Fermentation-Product Removal Process. Process Biochem. 1995, 30, 209–215. [Google Scholar] [CrossRef]
  36. Baral, N.R.; Shah, A. Techno-Economic Analysis of Cellulosic Butanol Production from Corn Stover through ABE Fermentation. Energy Fuels 2016, 30. [Google Scholar] [CrossRef]
  37. Kumar, M.; Goyal, Y.; Sarkar, A.; Gayen, K. Comparative Economic Assessment of ABE Fermentation Based on Cellulosic and Non-Cellulosic Feedstocks. Appl. Energy 2012, 93, 193–204. [Google Scholar] [CrossRef]
  38. Abdi, H.K.; Alanazi, K.F.; Rohani, A.S.; Mehrani, P.; Thibault, J. Economic Comparison of a Continuous ABE Fermentation with and without the Integration of an in Situ Vacuum Separation Unit. Can. J. Chem. Eng. 2016, 94, 833–843. [Google Scholar] [CrossRef]
  39. Ezeji, T.C.; Qureshi, N.; Blaschek, H.P. Production of Acetone, Butanol and Ethanol by Clostridium beijerinckii BA101 and In Situ Recovery by Gas Stripping. World J. Microbol. Biotechnol. 2003, 19, 595–603. [Google Scholar] [CrossRef]
  40. Ezeji, T.C.; Qureshi, N.; Blaschek, H.P. Acetone Butanol Ethanol (ABE) Production from Concentrated Substrate: Reduction in Substrate Inhibition by Fed-batch Technique and Product Inhibition by Gas Stripping. Appl. Microbiol. Biotechnol. 2004, 63, 653–658. [Google Scholar] [CrossRef] [PubMed]
  41. Liu, G.; Zhang, J.; Bao, J. Cost Evaluation of Cellulase Enzyme for Industrial-Scale Cellulosic Ethanol Production Based on Rigorous Aspen Plus Modeling. Bioprocess Biosyst. Eng. 2016, 39, 133–140. [Google Scholar] [CrossRef] [PubMed]
  42. Ramalingham, A.; Finn, R. The Vacuferm Process: A New Approach. Biotechnol. Bioenergy 1977, 19, 583–589. [Google Scholar] [CrossRef]
  43. Maiorela, B.; Wilke, C.R. Energy Requirements for the Vacuferm Process. Biotechnol. Bioenergy 1980, 22, 1749–1751. [Google Scholar] [CrossRef]
  44. Mariano, A.P.; De Angelis, D.D.F.; Maugeri Filho, F.; Atala, D.I.P.; Wolf MacIel, M.R.; Maciel Filho, R. An Alternative Process for Butanol Production: Continuous Flash Fermentation. Chem. Prod. Process Model. 2008, 3. [Google Scholar] [CrossRef]
  45. Zong, Z.L.; Yang, X.H.; Zheng, X.Y. Determination and Correlation of Vapor-Liquid Equilibria of Alcohol Solutions. J. Chem. Eng. Jpn. 1983, 16, 1–6. [Google Scholar] [CrossRef]
  46. Stockhardt, J.S.; Hull, C.M. Vapor-Liquid Equilibria and Boiling-Point Composition Relations for Systems n-Butanol-Water and Isobutanol-Water. Ind. Eng. Chem. 1931, 23, 1438–1440. [Google Scholar] [CrossRef]
  47. Peters, M.; Timmerhaus, K. Plant Design and Economics for Chemical Engineers, 4th ed.; McGraw-Hill: New York, NY, USA, 1991. [Google Scholar]
  48. Mariano, A.P.; Filho, R.M. Improvements in Biobutanol Fermentation and Their Impacts on Distillation Energy Consumption and Wastewater Generation. Bioenergy Res. 2012, 5, 504–514. [Google Scholar] [CrossRef]
Figure 1. Simplified flowsheet of the process.
Processes 07 00667 g001
Figure 2. VLE chart for the isobutanol water-system at 1 atm. Data produced using the modified Raoult’s law with Wilson activity coefficients. Binary parameters obtained from Zong et al. [45].
Processes 07 00667 g002
Figure 3. Annual operating cost breakdown.
Processes 07 00667 g003
Figure 4. Effect of isobutanol titer on the distillation energy demand for 99.9 wt% purification.
Processes 07 00667 g004
Figure 5. Probability and cumulative probability distribution (dashed line) of the unit production cost of isobutanol for SCB. Results obtained by Monte Carlo simulation with 6000 runs.
Processes 07 00667 g005
Figure 6. Contribution percentage of various parameters to the variance of isobutanol unit production cost. Results obtained by Monte Carlo simulation with 6000 runs.
Processes 07 00667 g006
Table 1. Comparison of different automotive fuel characteristics [6,8].
Ethanoln-ButanolIsobutanolGasoline
Energy density (MJ/L)21.426.926.630–33
Energy content (% of gasoline)64.881.580.6100
Posted octane number100909888–93
Boiling point (°C)78.4117.8107.927–225
Reid vapor pressure (kPa)162.23.354–103
Water solubility (% at 20 °C)1007.78.5-
Oxygen content (% wt)352222-
Table 2. Biobutanol production from engineered strains.
MicroorganismProductFermentorTiter (g/L)Yield (g/g Substrate)Reference
E. coliisobutanolFlask220.35[21]
E. coliisobutanolFlask21.20.31[22]
E. colin-butanolFlask150.36[23]
C. acetobutylicumn-butanolBatch bioreactor170.36[19]
C. acetobutylicumn-butanolBatch bioreactor15.40.2[24]
C. acetobutylicumn-butanolFed-batch bioreactor18.90.31[25]
C. beijerinckiin-butanolBatch bioreactor18.60.32[26]
Table 3. Biobutanol production with integrated product removal.
MicroorganismProductFermentorTiter (g/L)Yield (g/g Substrate)Reference
E. coliisobutanolFed-batch with gas stripping500.29[34]
E. colin-butanolFed-batch with gas stripping300.29[23]
C. beijerinckiin-butanolContinuous with vacuum stripping37.10.22[32]
C. acetobutylicumn-butanolFed-batch with pervaporation105.30.23[33]
C. acetobutylicumn-butanolBatch with gas stripping43.40.21[35]
Table 4. Comparison of different publications on the economics of biobutanol production.
Main ProductFeedstock Cost ($/MT)Yield (L/MT Dry Feed)Capacity (ML/y)Specific TCI ($/L/y)Unit Cost ($/L)Reference
isobutanol60206.811.25.52.24This study
isobutanol60218.231.512.541.42This study
isobutanol58.52421702.510.53[8]
n-butanol58.5135954.660.41[31]
n-butanol110.5156113.53.611.76[36]
n-butanol33487.512.50.820.88[37]
n-butanol153-63.70.51.60[38]
Table 5. Main modeling and economic assumptions.
First Scenario (SCA)Second Scenario (SCB)
Corn stover cost ($/MT)6060
Corn stover moisture content (%)2020
Corn stover loading (MT/h)8.218
Enzyme cost ($/kg protein)1010
Enzyme loading ratio (mg/g cellulose)2020
Electricity cost ($/kWh)0.070.07
Cooling water ($/MT)0.050.05
Chilled water ($/MT)-0.4
Number of fermentors 88
Working fermentor volume (m3)500500
Effective sugar concentration (g/L)60158
Fermentation time (h)7272
Isobutanol titer (g/L)2250
Hexose conversion (%)8590
Pentose conversion (%)8590
Table 6. Total capital investment breakdown for the scenarios examined ($M).
SCASCB
Total Direct Cost (TDC) 29.543.7
 Equipment purchase cost (EPC) 14.020.8
 InstallationEquipment-specific4.66.6
 Process Piping0.2·EPC2.84.1
 Instrumentation0.1·EPC1.42.1
 Insulation0.03·EPC0.40.6
 Electrical0.1·EPC1.42.1
 Buildings0.05·EPC0.71.2
 Yard improvement0.1·EPC1.42.1
 Auxiliary facilities0.2·EPC2.84.1
Total Indirect Cost (TIC) 17.726.2
 Engineering0.25·TDC7.310.9
 Construction0.35·TDC10.315.3
Contractor’s Fee and Contingency (CFC) 7.010.4
 Contractor’s Fee0.05·(TDC+TIC)2.33.5
 Contingency0.1·(TDC+TIC)4.76.9
Total Capital Investment
(TCI = TDC + TIC + CFC)
54.380.3
Table 7. Annual operating cost breakdown ($M).
SCASCB
$M%$M%
 Raw materials7.228.217.939.5
 Labor dependent4.417.54.610.3
 Facility dependent8.432.212.126.8
 Laboratory0.62.60.71.5
 Waste treatment1.14.61.22.8
 Utilities3.714.78.619.0
AOC25.610045.3100
Savings (Electricity prod.)0.2 0.5
Net AOC25.4 44.8
Table 8. Sensitivity parameters, baseline values and ranges for the Monte Carlo simulation.
ParameterBase-case valueDistributionVariation Range
Feedstock cost$60/MTUniform[30–90]
Enzyme cost$10/kg proteinUniform[5–15]
Enzyme loading ratio20 mg/g celluloseUniform[10–30]
Hexose conversion90%Uniform[60–95]
Pentose conversion85%Uniform[60–90]

