1. Introduction
Healthcare is a need that is as old as human history. With the changes observed in humanity, healthcare systems have also changed in technological, quality, and structural terms [
1]. In hospitals, the waiting time, the length of stay, the number of patients treated, and the utilization of resources are the parameters influencing the quality of healthcare systems [
2,
3,
4]. In the present study, a sample simulation model was created for Turkey by considering these four important parameters.
A great number of patients, who may be treated as outpatients, but who are referred to emergency services (ESs) increase the intensity of these services [
5,
6,
7,
8]. McGee and Kaplan claimed that 12.9% of the 12 million patients admitted to the emergency department were urgent [
9]. According to an article released in the Turkey Emergency Medicine Journal in 2005, 50% of the 32,800 patients who were recorded in an ES were classified as patients who were not urgent. Only about 9.9% of these patients were treated as urgent patients. The rest of these patients who had mild injuries were examined by physicians, and 1.4% were referred to polyclinics. It was determined that 88.7% of the patients were treated as outpatients, and were then discharged [
10]. These very high rates of patients being referred to ESs as urgent patients hamper the operations of ESs [
11]. Currently, patients spend a certain time period in ESs, even if they not urgent. These periods affect the number of patients treated, the utilization of resources, the length of stay, and the waiting times of patients at the ESs in a negative way [
12].
In the healthcare system of Turkey, the ESs work as follows: the patient arrives at the ES and is registered. After triage, the patient is classified according to the urgency as green zone (slight injury), yellow zone (patients who need a physician’s care to prevent permanent damage but can nonetheless wait), or red zone (heavy, life-threatening injury requiring immediate examination). Then, the patient is referred to the relevant unit (depending on the injury type) for the doctor’s examination. After examination, if it is necessary, a prescription is written, and the patient either checks out for departure, or is referred to the polyclinics. In such ESs, doctors work in a more intense way. The duties that are defined for nurses remain limited to the instructions that are given by doctors. When it is considered within the context of the chain, patients have to wait for nurses for triage, and for doctors for all other processes. This study recommends that the waiting times of the patients are reduced, and the authority of nurses is increased to reduce the number of patients that are treated in ESs.
The competencies of nurses vary according to their specific area of expertise in the healthcare systems of the United States. When the education and experience of nurses are considered, nurses are divided into four groups. The nurse group providing basic patient care like nutrition and hygiene is called nurses’ assistants and aides. Such nurses become nursing assistants after receiving short-term training in hospitals or in public training centers. A nurse who completes a program that is approved by the state and who passes the related exams applied by the state or by a private center, receives the licensed practical nurse title. Such nurses are also known as licensed vocational nurses. The highest ranks of nurses in the US healthcare system are in the registered nurses’ group. The highest level, which is needed for patient care, is provided by a registered nurse. Such nurses, who are in direct contact with patients, observe, evaluate, and record the reactions, symptoms, and progress of patients. In brief, such nurses develop a nursing program for patients and manage it. Furthermore, practitioner nurses provide patients with the highest level of patient care. For the purpose of becoming an advanced practice nurse, registered nurses must have a postgraduate degree in a field of clinical specialty. Doctors have the authority to write prescriptions to patients in an independent manner without any cooperation or supervision. However, their authority for writing prescriptions is restricted by the laws of the states they work in, and the drugs they may prescribe are controlled by these laws [
13].
In previous studies, only two parameters, the patient waiting time and length of stay, were taken into consideration in examining the effect on quality of healthcare that is determined according to the treatment cost and the patient’s satisfaction [
14,
15]. In this study, four different parameters—waiting time, the length of stay, the number of patients treated, and the utilization of resources in ESs—were examined by a different method. These parameters are in direct interaction with each other. A study of Canadian emergency departments made observations of patients who were examined by practice nurses. The number of patients examined by these nurses instead of by physicians increased by 12%, and the average waiting time decreased by 7 min [
6]. In another study, it was observed that in an ES with three categories (Categories 3, 4, and 5) with the implementation of the practice nurses model (i.e., increasing the knowledge and skills of ESs by providing extra education and training to normal nurses), the patients’ waiting time was reduced by 1 min (Category 3: 28 to 27 min, Category 4: 35 to 34 min, Category 5: 27 to 26 min) [
16]. In another study, in an emergency department for analgesia processes, 130 of 258 patients were consulted by practice nurses, and the remaining patients were consulted by physicians. According to the results, the time required for patients to be administered drugs by practice nurses was shortened by 8 min, compared to the administration by physicians [
17]. Some studies suppose that the efficiency of doctors with practice nurses is high in ESs. A study showed that the satisfaction rates of patients treated by a doctor and a practice nurse working together was increased in an ES in Austria. Out of 320 patients, the satisfaction rates were measured as 84% according to the survey form. However, patient waiting and stay times were not taken into consideration [
18]. In a small emergency department in Australia, 61 patients were examined by physicians with the help of emergency nurses, and the waiting time and length of stay were calculated as 13.2 min and 116 min, respectively. Nevertheless, no evidence is provided in terms of comparisons with other situations related to these parameters in the research [
19].
The purpose of this study is to ensure that nurses recommended for ESs in Turkey are employed as advanced nurses (ANs) after receiving 2+ years of training, after they complete a normal nursing education. ANs must have the authority to write prescriptions for routine diseases (colds, headaches, influenzas, diarrhea, fever, weakness, etc.). The drugs that they may prescribe to patients may be limited by the state, and thus taken under control. Since such patients may be treated as outpatients; they are under the authority of ANs.
Using simulation techniques in the healthcare field dates as back as the 1970s [
20]. Whether simulations are discrete or continuous depends on the data type that is used for the simulation. The type of simulation that is used in the healthcare field is mostly the discrete event simulation technique [
21]. The reason for this is that such simulations differ according to working durations, which are determined as daily, weekly, monthly, or yearly. In general, it is observed that the discrete simulation technique has been used in the healthcare sector for three purposes: planning the resources of hospitals (doctors, nurses, beds, civil servants, etc.), planning the shifts of the staff in hospitals, and planning patient-flow diagrams. The studies in which patient simulation modeling was performed were also covered in this scope [
22].
The use of discrete simulation models is common in ESs [
23,
24,
25]. In the simulation models that were developed, the purpose was to reduce the waiting durations of patients [
26,
27]. In one study, a total of 517 patients were observed in pediatric emergency services, in order to develop a new patient flow to reduce the waiting times of patients by applying simulations, and by adding to the number of employees [
28,
29]. Simulations were applied in studies that aimed to improve the capacity of ESs.
The most important factor that distinguishes this study from other studies is the method used, which is a discrete event computer simulation for ESs. Despite most studies being based on surveys and observations, more tangible and accurate results were obtained by using numerical data in this study. The findings contribute positively to physician recruitment, patients’ and employees’ satisfaction, the quality of healthcare service, and healthcare costs, by the employment of ANs (a new profession between physicians and normal nurses).
In this study, comparisons were made by creating a simulation model with and without ANs. The simulation method was used to obtain the results of the study in an accurate and quick manner, without costs. Simulation models are expressed by decisional analytical modeling [
30]. It is a required situation that the simulation models are flexible and understandable for the user and for the decision problems created for healthcare systems. The reason for why simulation models developed in the field of healthcare are complex is that they contain successive combinations. The uncertainty is minimal in the work flow that is defined in any production or transport simulation. For example, the fact that there is a robot/machine factor instead of a human factor in the automotive manufacturing sector minimizes the variability rates in production. However, this situation is not valid for the healthcare field. The presence of changes in patient flow-charts and uncertainties for the next process increases the variation in the developed simulation models. As the treatment type that will be applied to the patient arriving at the ES cannot be predicted, it is required that simulation models are applied, and that more than one strategy is developed and compared.
The present study consists of four main sections. In the first section, information is provided on the functioning of ESs, and the types of nurses and simulation methods that are applied. In the second section, information is provided on the method applied in the present study. The determination of the patient flow-charts and of the data that are needed for the creation of the simulation model is carried out in this section. In the third section, a comparison of data is made for the simulation models. In the final section, the conclusion of the study is given.
2. Materials and Methods
In this study, the purpose was to reduce the waiting times and length of stays in ESs in Turkey, to make the resources of the ESs more efficient, and to increase the number of patients who are treated. It is emphasized that great changes are being made in the working and branching rules of the nurses in Turkey, and an AN class is created to treat patients who are not really urgent, and who are outpatients. It was ensured that concrete results were obtained with numerical data, by applying a discrete event simulation sample. This section comprises four headings, which are detailed below.
2.1. Specifications, Authorities, and Rights of ANs
It was emphasized in this study that each nurse should be given additional training and internship in the fields in which s/he desires to become specialized. Article 4 of the Nursing Law 6283—“the duties, authorities and responsibilities of nurses are regulated by the Ministry of Health according to the working areas, positions and educational status in the services that were listed in the first paragraph of the law”—supports this study [
31]. In this study, it is mandatory for nurses identified as ANs to have the following specifications:
2.2. ES Patient Flow Diagrams
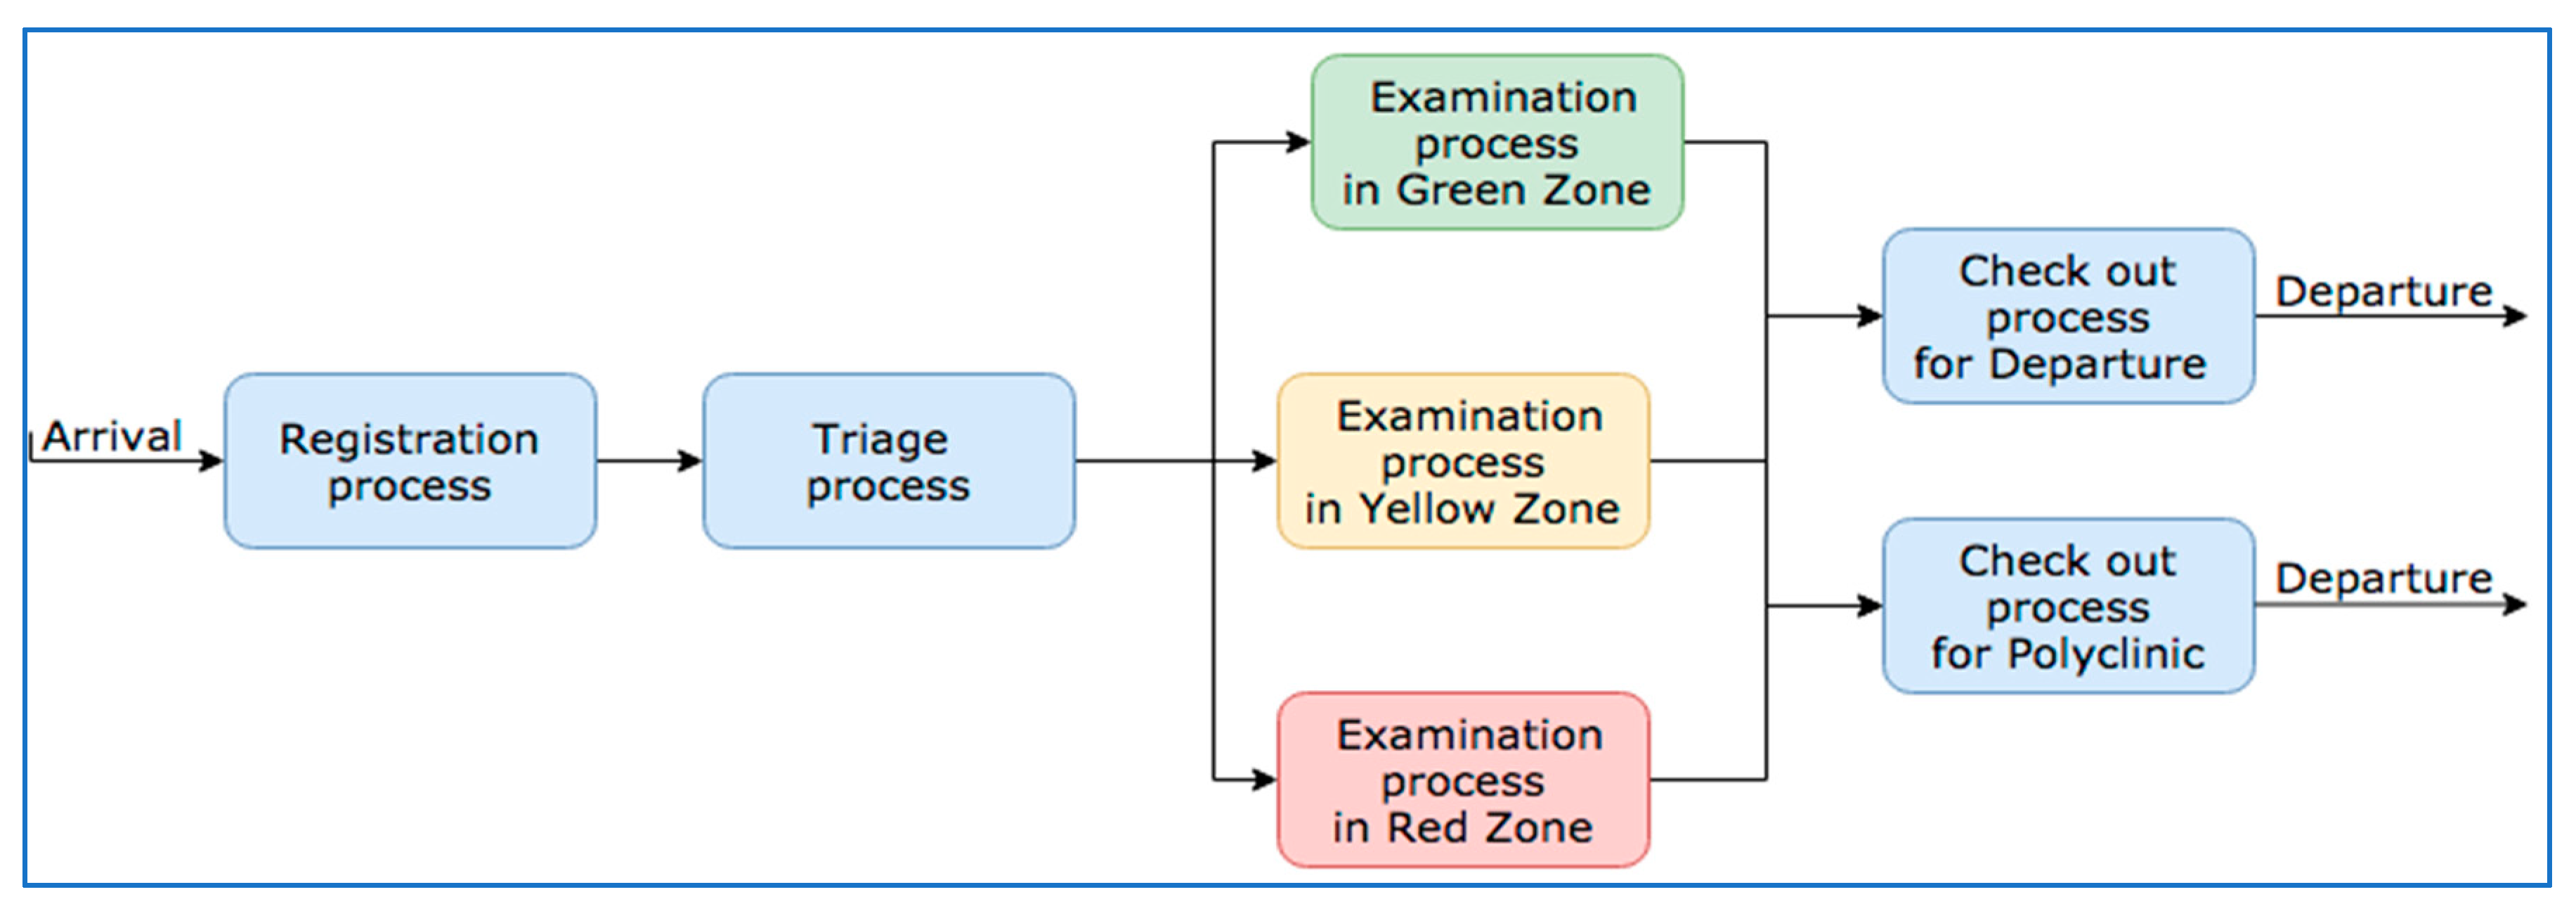
In this section, the working principles of the ESs in the healthcare system of Turkey are dealt with. In general terms, the patient flow in ESs is given in
Figure 1.
According to
Figure 1, the patient is referred to green, yellow, and red areas in ESs, according to the type of the disease after triage. The patients wait for the doctor to treat them after they are referred to relevant units, and they are either kept waiting at short-stay units after they are treated, are referred to polyclinics, or receive written prescriptions to be discharged. In the present study, comparisons were made to measure the effect of the AN factor by creating two different models based on the single simulation design. The patient flow given in
Figure 1 was used in the first simulation model. To facilitate the understanding of the simulation model and the outcomes, the yellow, green, and red zones were taken as single fields.
According to the second simulation model, the difference in this patient flow-chart is that if a patient has a disease type which may be treated by an AN after normal triage is completed, s/he is examined in the triage field, and then, s/he is either discharged or referred to a polyclinic. It is not the case that a patient who is examined by a AN is examined again by the doctor. The patient is referred to the doctor according to his/her urgency, and according to the type of his/her disease; after s/he is examined by the doctor, s/he is either referred to the polyclinic, or is discharged. In this situation, each patient will not have to wait for the doctor.
2.3. The Data Used in the Simulation
In the present study, the 3D Flexsim-Healthcare (HC) Program (FlexSim Software Products, Inc., Orem, UT, USA) was used with the discrete simulation technique. This program is a computer-based model of activities that pays attention to the physical structure of a real healthcare department. The Flexsim-Healthcare simulation program is a graphical model with an animated background and a hierarchical configuration. It is an object-oriented method that permits the professional user to categorize the resources of the system for the end-user. This program was preferred because it is easy to follow-up with the icons, and the program allows the user to manage the movements of patients and staff. The distributions needed for the processes in the patient flow were obtained from an institution that provides healthcare in Turkey, according to a 24/7/365 working schedule. The data were collected by healthcare professionals as computer data, based on observations (Electronic Medical Record (EMR) Software, Electronic Data Interchange, Nextgen Healthcare, Irvine, CA, USA, 2017).
The data that were employed in the present study were followed up for two years. The reason for the long-term data collection are to determine the behavioral movements of humans, who are the main actors in the healthcare sector. To obtain absolute and accurate results, the data must be considered as seasonal (summer–winter–spring). In this way, the dimension of the correlation between the data that are collected in the first year and those collected in the following year may be measured. In the present study, the distributions of the data were determined with the Flexsim-HC ExpertFit tool (FlexSim Software Products, Inc., Orem, UT, USA). The data that were used in the first simulation model are given in
Table 1. The following notations related to resources of ESs were defined in the methodology of the study as MD: medical doctors; N: nurses; C: clerks; ER: exam rooms; TR: triage units.
In the second simulation model, a percentage rate (p) must be used, because the AN factor was considered. The parameter that determines this rate is the number of patients who arrive at ESs and who are not urgent (the patients examined by ANs), and the urgent patients (the patients examined by doctors).
The resources that were used in the simulation models (doctors, nurses, beds, triage units, registration, and the attendants performing discharge procedures) belong to a small-scale ES. The number of ES resources that were employed in both simulations was fixed: three doctors, three nurses, six beds, three triage rooms or units, and finally, two attendants who performed the arrival–discharge proceedings. Only in the simulation model that had the AN factor, one nurse (2 normal nurses + 1 AN) was distinct from among the three nurses. In the model, external resources were not added.
2.4. Creating the Simulation Model
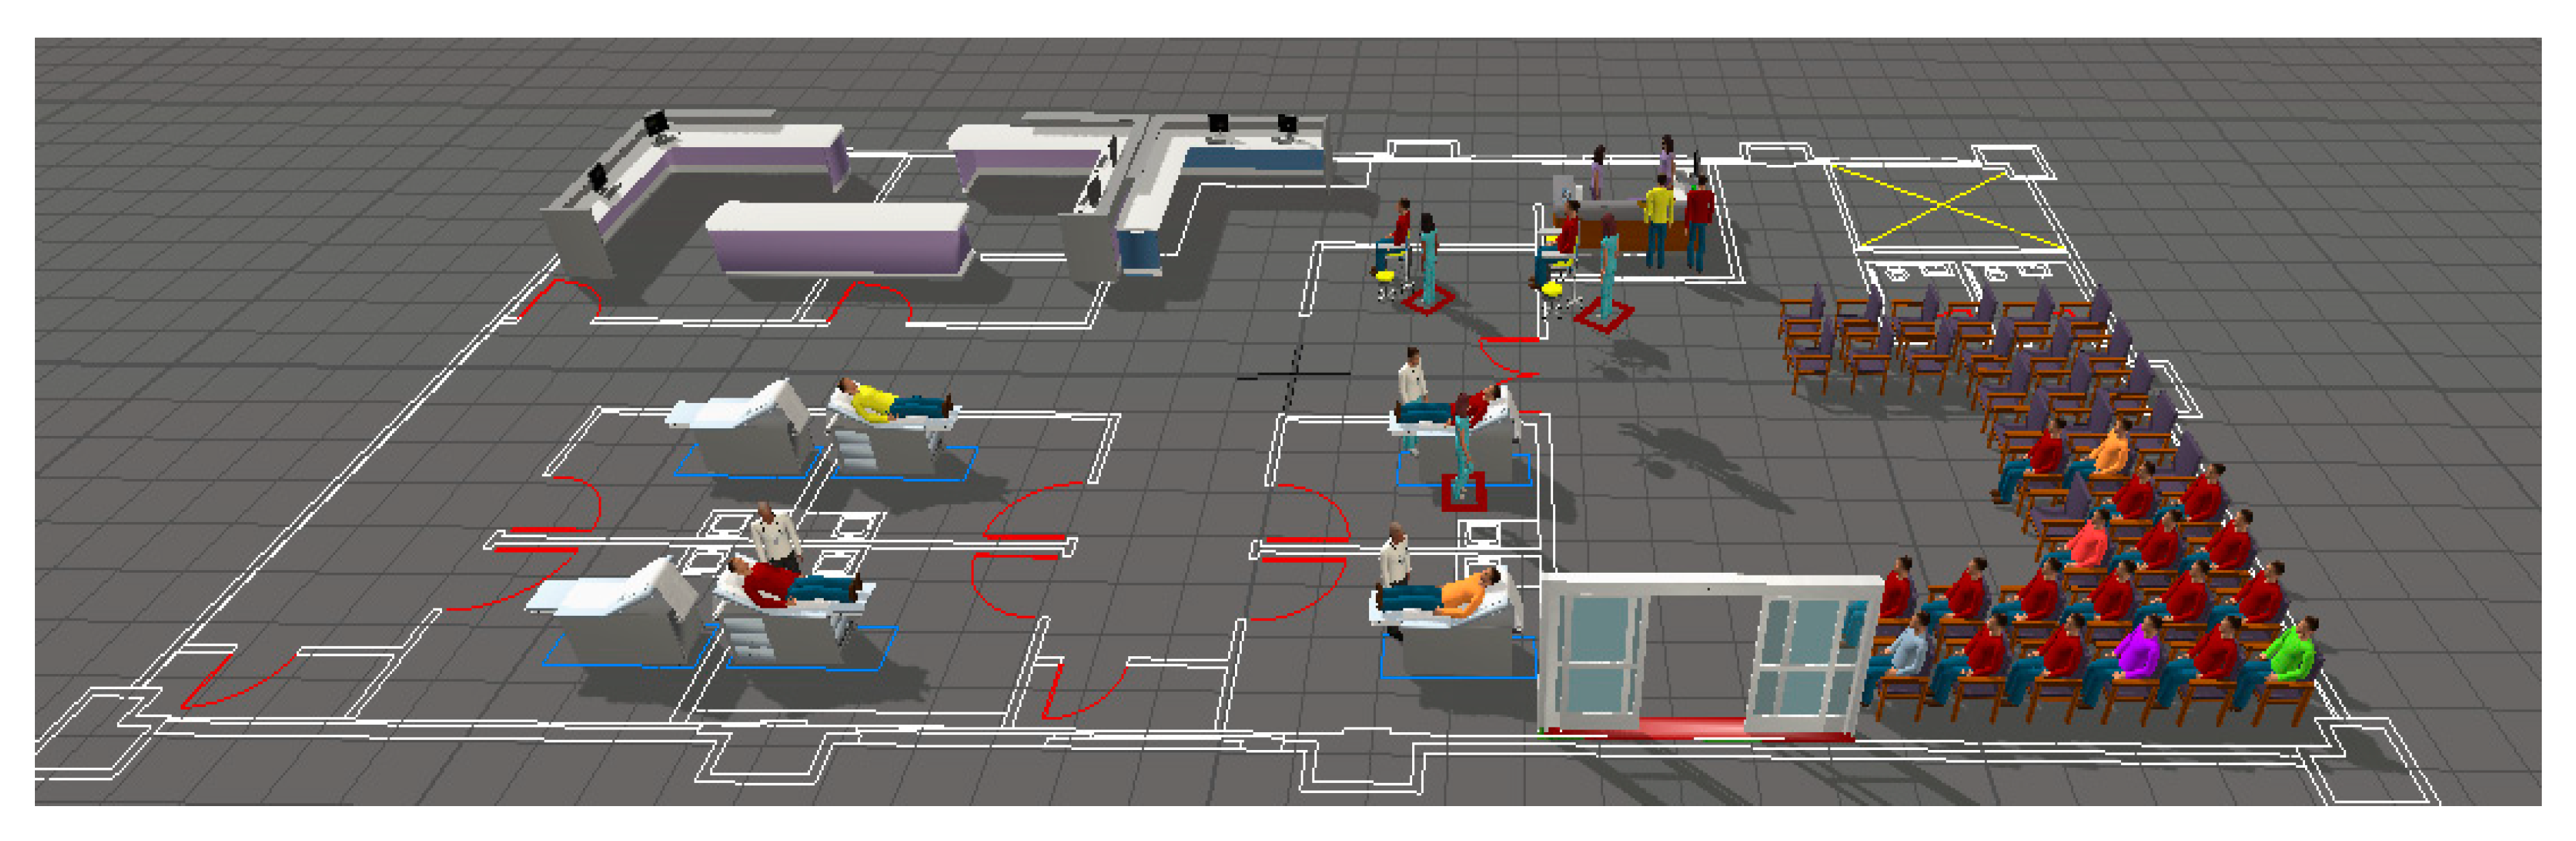
The two different situations that were considered in the application stage of the study are shown in the single simulation model. The purpose was to compare the simulation model with and without the AN factor. For both cases, the simulation models were repeated three times for a total of 58 times (19 scenarios with the AN factor, and one1 scenario without the AN factor were considered). Since the simulation parameters were not updated before each application (the scenarios were run one by one) in the Flexsim-HC program, change during the warm-up stage was prevented, to avoid data loss and biased results with instant warm-up periods. In the finite horizon simulation models, certain starting and ending conditions were considered; for this reason, in the present study, we did not enter the warm-up period data (warm-up periods are employed in infinite models). The observations are independent in such simulation models. When different outcomes were obtained, random simulation numbers were run with the same initiation conditions. The simulation model was operated on a daily basis, and on a 1-week basis with 1/24 and 7/24 working principles. A screenshot of the simulation model is given in
Figure 2.
As the simulation program that was employed was 3D, it ran more slowly compared to the other simulation programs. The C++ computer programming language was used to develop this simulation model for the healthcare field.
The patients were treated according to the patient flow-chart for the normal and AN scenarios of the simulation model, to perform the activities given in
Table 2 and
Table 3.
2.5. Objective Result Definitions in the Simulation
The discrete event simulation program was applied to obtain the results without/with ANs, which are given in
Table 4 and
Table 5, respectively, for the parameters of the study. Increasing the number of patients treated and the utilization of resources, and decreasing the patient’s waiting time and length of stay in the ES were defined as the objectives of this study. The explanations of how to gain the objective results of the parameters are included in the following subsections.
2.5.1. Number of Patients Treated
According to the model, the number of the patients was computed for 1/24 and 7/24. In the simulation models, the number of the patients that were treated was computed as the final stage of the patient flow. The number of patients that were computed for the ES in the second simulation model was related to the patient percentage (1 − p) treated by the AN staff. The average number of the patients that were treated by the AN staff was 146 (1/24) and 1059 (7/24), which means that the number of the patients treated by the ANs was different in terms of percentages.
2.5.2. Patient Waiting Times
The patient waiting times for the two models of the application were compared. The patient waiting times were not only related to the time passed in the waiting rooms. Seven different waiting times were determined, and are explained as follows:
wr, waiting time for the attendant to be registered
wn, waiting time for the nurse for triage
wt, waiting time for the triage unit to be suitable
wb, waiting time for the beds used in examination to be suitable
wd, waiting time for the doctor for examination
wan, waiting time for the AN for examination
we, waiting time for the attendant for discharge.
Since the rate of the number of the patients examined by doctors and nurses was expressed with
p, the waiting times were given as
wdn:
If the average waiting time (
wa) that was obtained by considering these times is formulated in mathematical terms, the following is obtained:
The waiting times are directly related to the processes given in the patient flow-charts. However, hidden waiting times are not considered in studies that are conducted with discrete simulation models; for example, if a patient whose triage process is completed is immediately sent to an empty bed and is examined by a doctor immediately if there is a suitable doctor, or if the patient has to wait in the patient bed until a doctor is available. These waiting times are described as hidden waiting times. In the present study, the computations were made by considering these times. The average waiting time of a patient was 39.07 min in the simulation that was operated without AN staff. The waiting times in the simulation that were operated with AN staff are given in
Table 5.
2.5.3. The Length of Stay in ESs
In ESs, there are waiting times for patients to be examined, both for the treatment, and to initiate the processes of treatment. By adding these periods, the time that a patient has to spend in ESs is computed. In this study, the times of the processes that patients have in the patient flow-chart were entered in the model as a statistical distribution. The times of the processes given in the patient flow-charts that were created for the initiation of the first situation of the simulation model are given below:
tr, the time needed for the registration process
tt, the time needed for the triage process
tp, the time needed for the examination process
te, the time needed for the discharge process.
By considering the total time
ts taken by these processes, it is formulated in mathematical terms as follows:
A new waiting time must be identified by adding the second situation of the simulation model, which is with the AN factor. The time needed for AN and doctors were expressed as
tan and
td, respectively. However, this time must not be considered as an additional time, because it is related to the rate of the total amount of time that constitutes the time for being examined for the patients by doctors. The new examination time
tp2 is formulated in mathematical terms as follows:
The total time of a patient that is spent in ES is given in Equations (5) and (6):
The stay of a patient in the ES was calculated as 74.29 min in the first case of the simulation model. It was determined that this time was more than the maximum time that was computed for the first situation. When the number of the patients arriving at the ES and examined by ANs in the second situation is considered as a percentage, the average stay of a patient varies in the ES.
2.5.4. Working Performances of the Resources of the ES
In the present study, the analysis and comparisons of the two different situations were made without changing the resources that were used for ES simulations. Only one of the three nurses who were included in the first scenario of the simulation model was evaluated in the AN staff, and it was used for the second model. No change was made in the total quantity of the resources.
The efficiencies of the resources that were present in the hospital units were measured in percentiles. The method that was employed in the computations for productivity was computed with the time spent with patients, or with the number of patients. The efficiencies of five different health resources were examined for numerical analyses in this study. Comparisons were made for both simulation model situations, by computing the efficiencies of the attendants for doctor, nurse, bed, triage, and registration–discharge processes.
3. Results and Discussion of Numerical Data from the Simulation
Two results were obtained with the data that were employed in the simulation model. The results that were obtained when the simulation was run for one day and for one week were compared. The results that were obtained for the first situation of the simulation model are shown in
Table 4.
Based on the data that are given in
Table 4, the average waiting times of patients varied between 33.24 min and 44.89 min. The average duration of hospital stay of a patient varies between 75.95 min and 88.99 min. When the AN factor was not considered, the average rate of the work of doctors was over 90%. However, low nurse and triage area efficiency was an expected situation. High rates of working of a resource leads to a decrease in the intensity of other resources, because it is necessary that the patient-flow processes follow each other in a successive way, and that the processes act according to a certain plan.
In
Table 4, there is a similarity in the results that were obtained at the end of a one-day and one-week run of the simulation model. The average number of patients who were treated was 146 in one day, and the difference between the number of patients who were treated in one week was very close. There was approximately 12.01 min difference between running the one-day simulation model and the one-week run in terms of waiting periods of patients. Similarly, the difference between the stay of patients, including the waiting time for examination, was computed as 13.04 min. It was determined that the efficiency rates of the hospital resources were close to each other. A total of 19 scenarios were examined for the second situation of the simulation model. Comparisons were made between the data that were received from the simulation model and the initial data in the scenarios produced within the model. Figures of the study were created by Numbers software, to organize and summarize
Table 5 statistically.
3.1. Results from Running the 1/24 Simulation Model
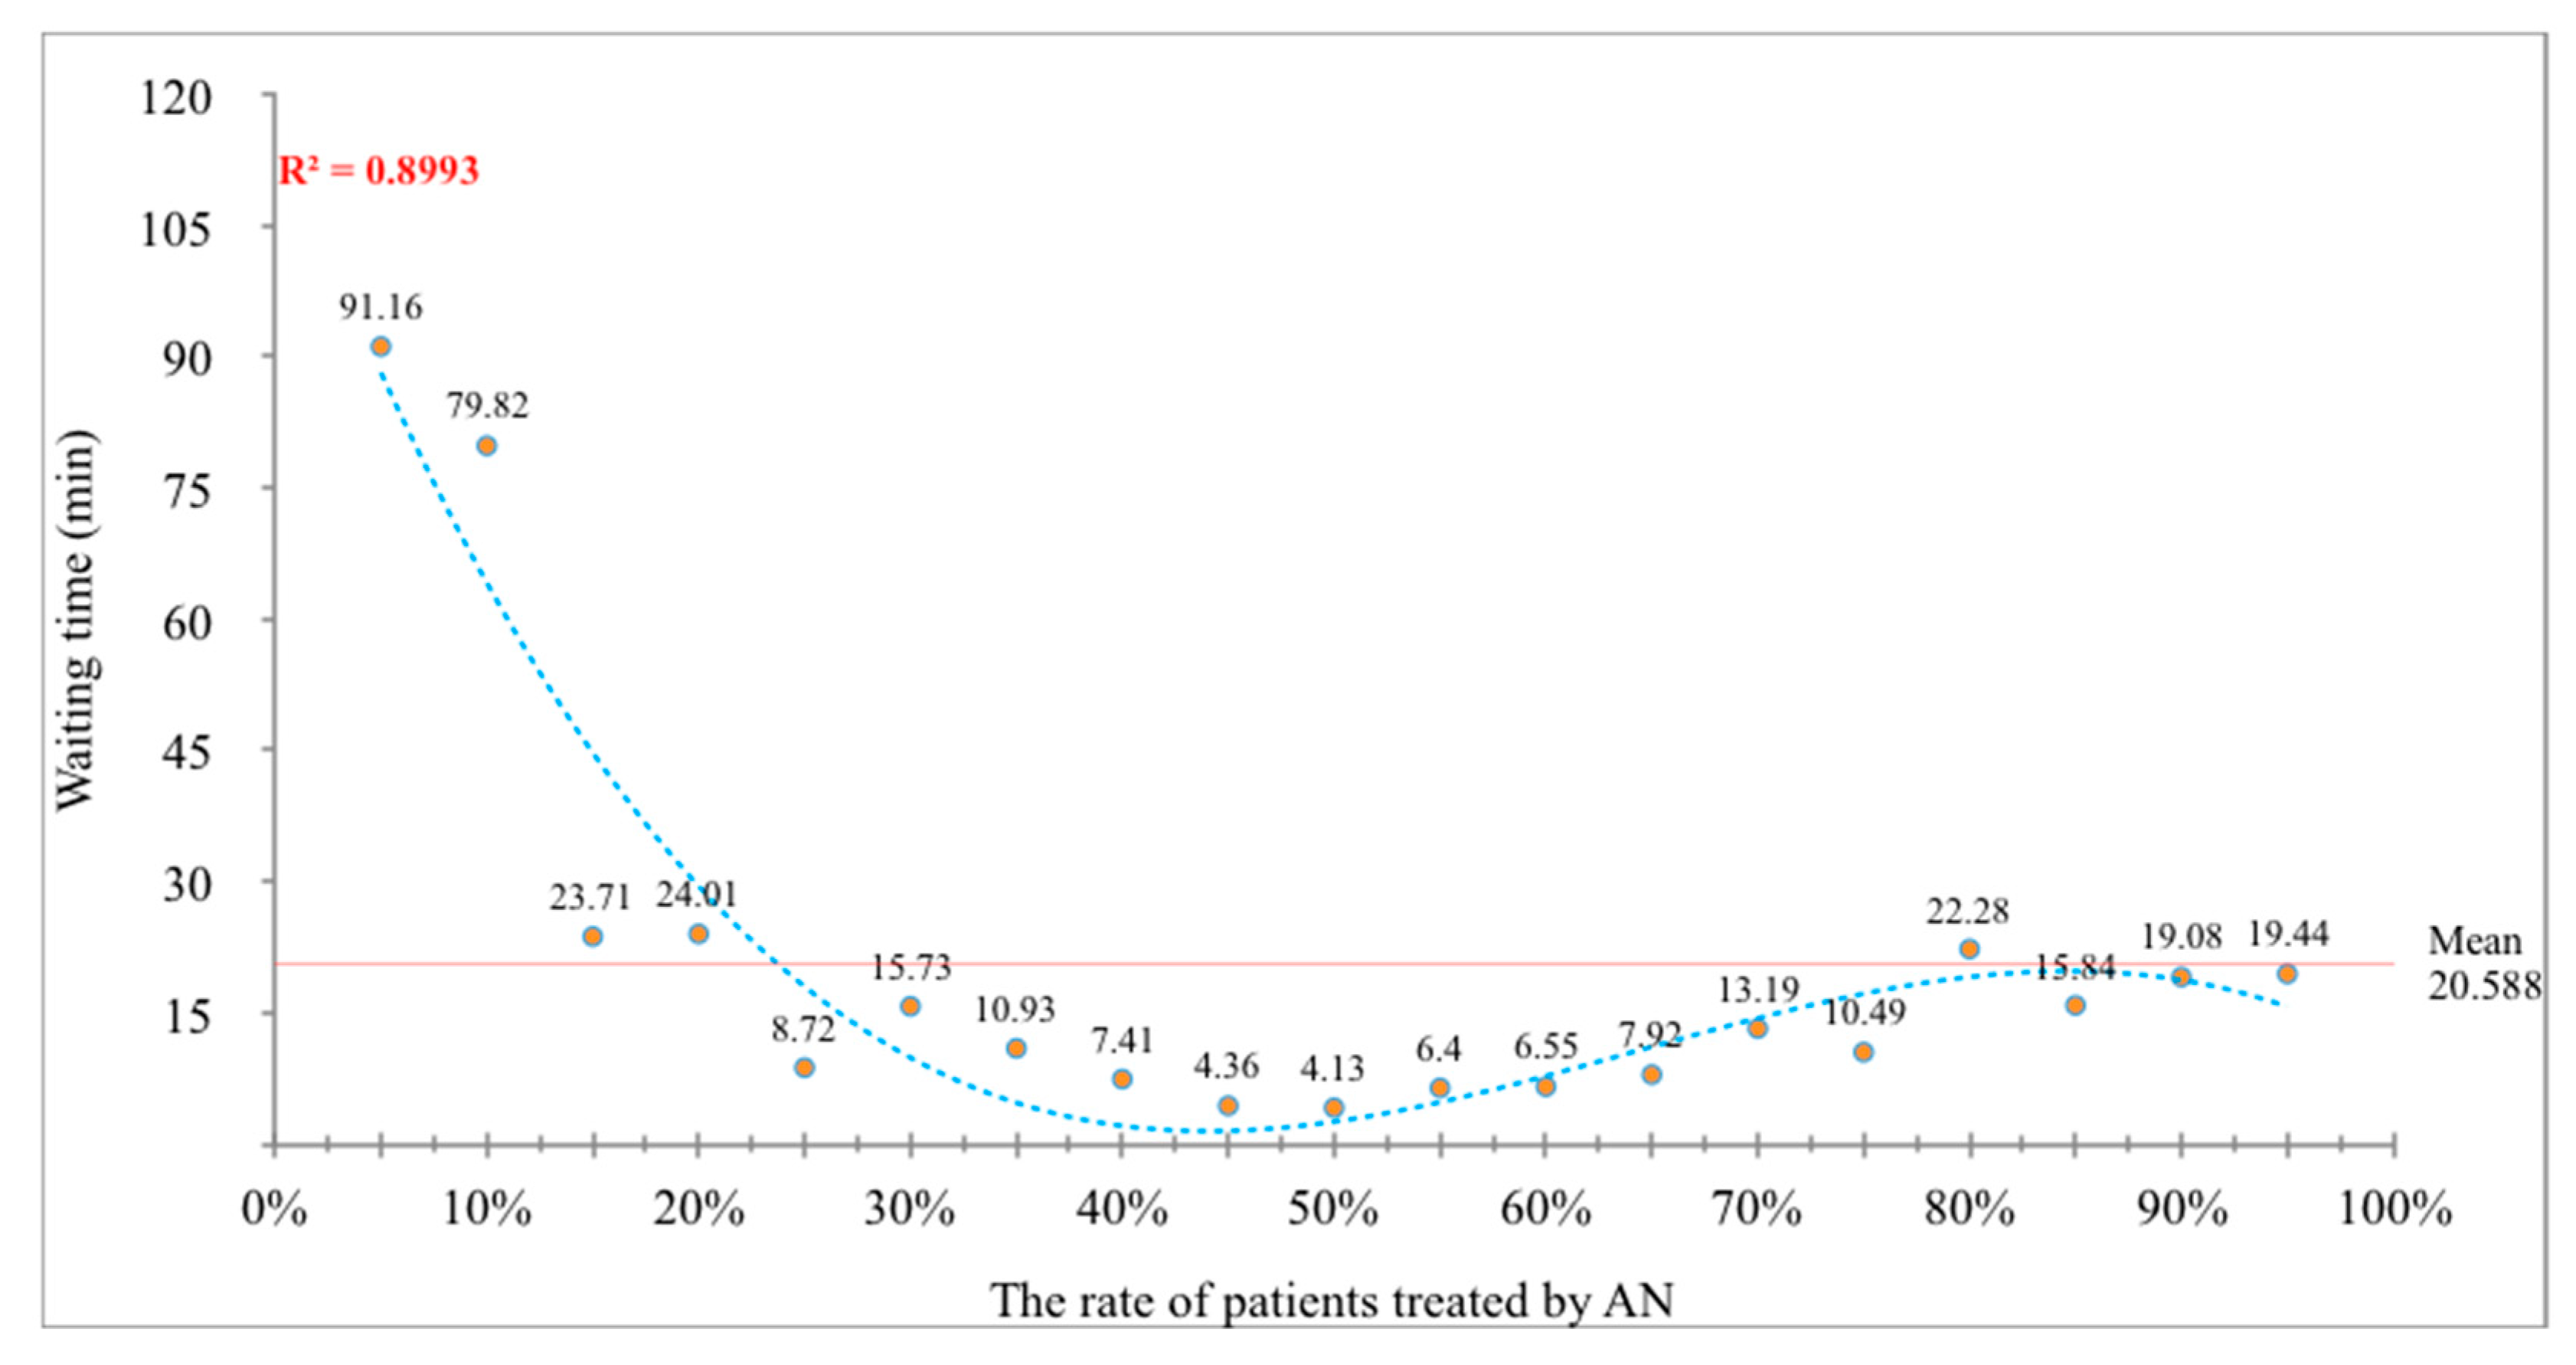
In
Figure 3, the effect of AN employment on waiting times with a change in the rate of patients that were treated by AN staff is given. For the purpose of keeping the R
2 value high in the figure, the curve shows a polynomial distribution with a fifth-degree equation. The equation that shows the waiting times of patients is formulated as below:
According to the equation, the response variable ywt1/24 (average waiting time on basis of 1/24) is only connected with the rate of patients treated (x) by AN. According to the figure, when 50.00% of the patients arriving at ESs were examined by AN, the waiting times of patients decreased to the minimum level. The average waiting time of the 19 scenarios was 20.59 min.
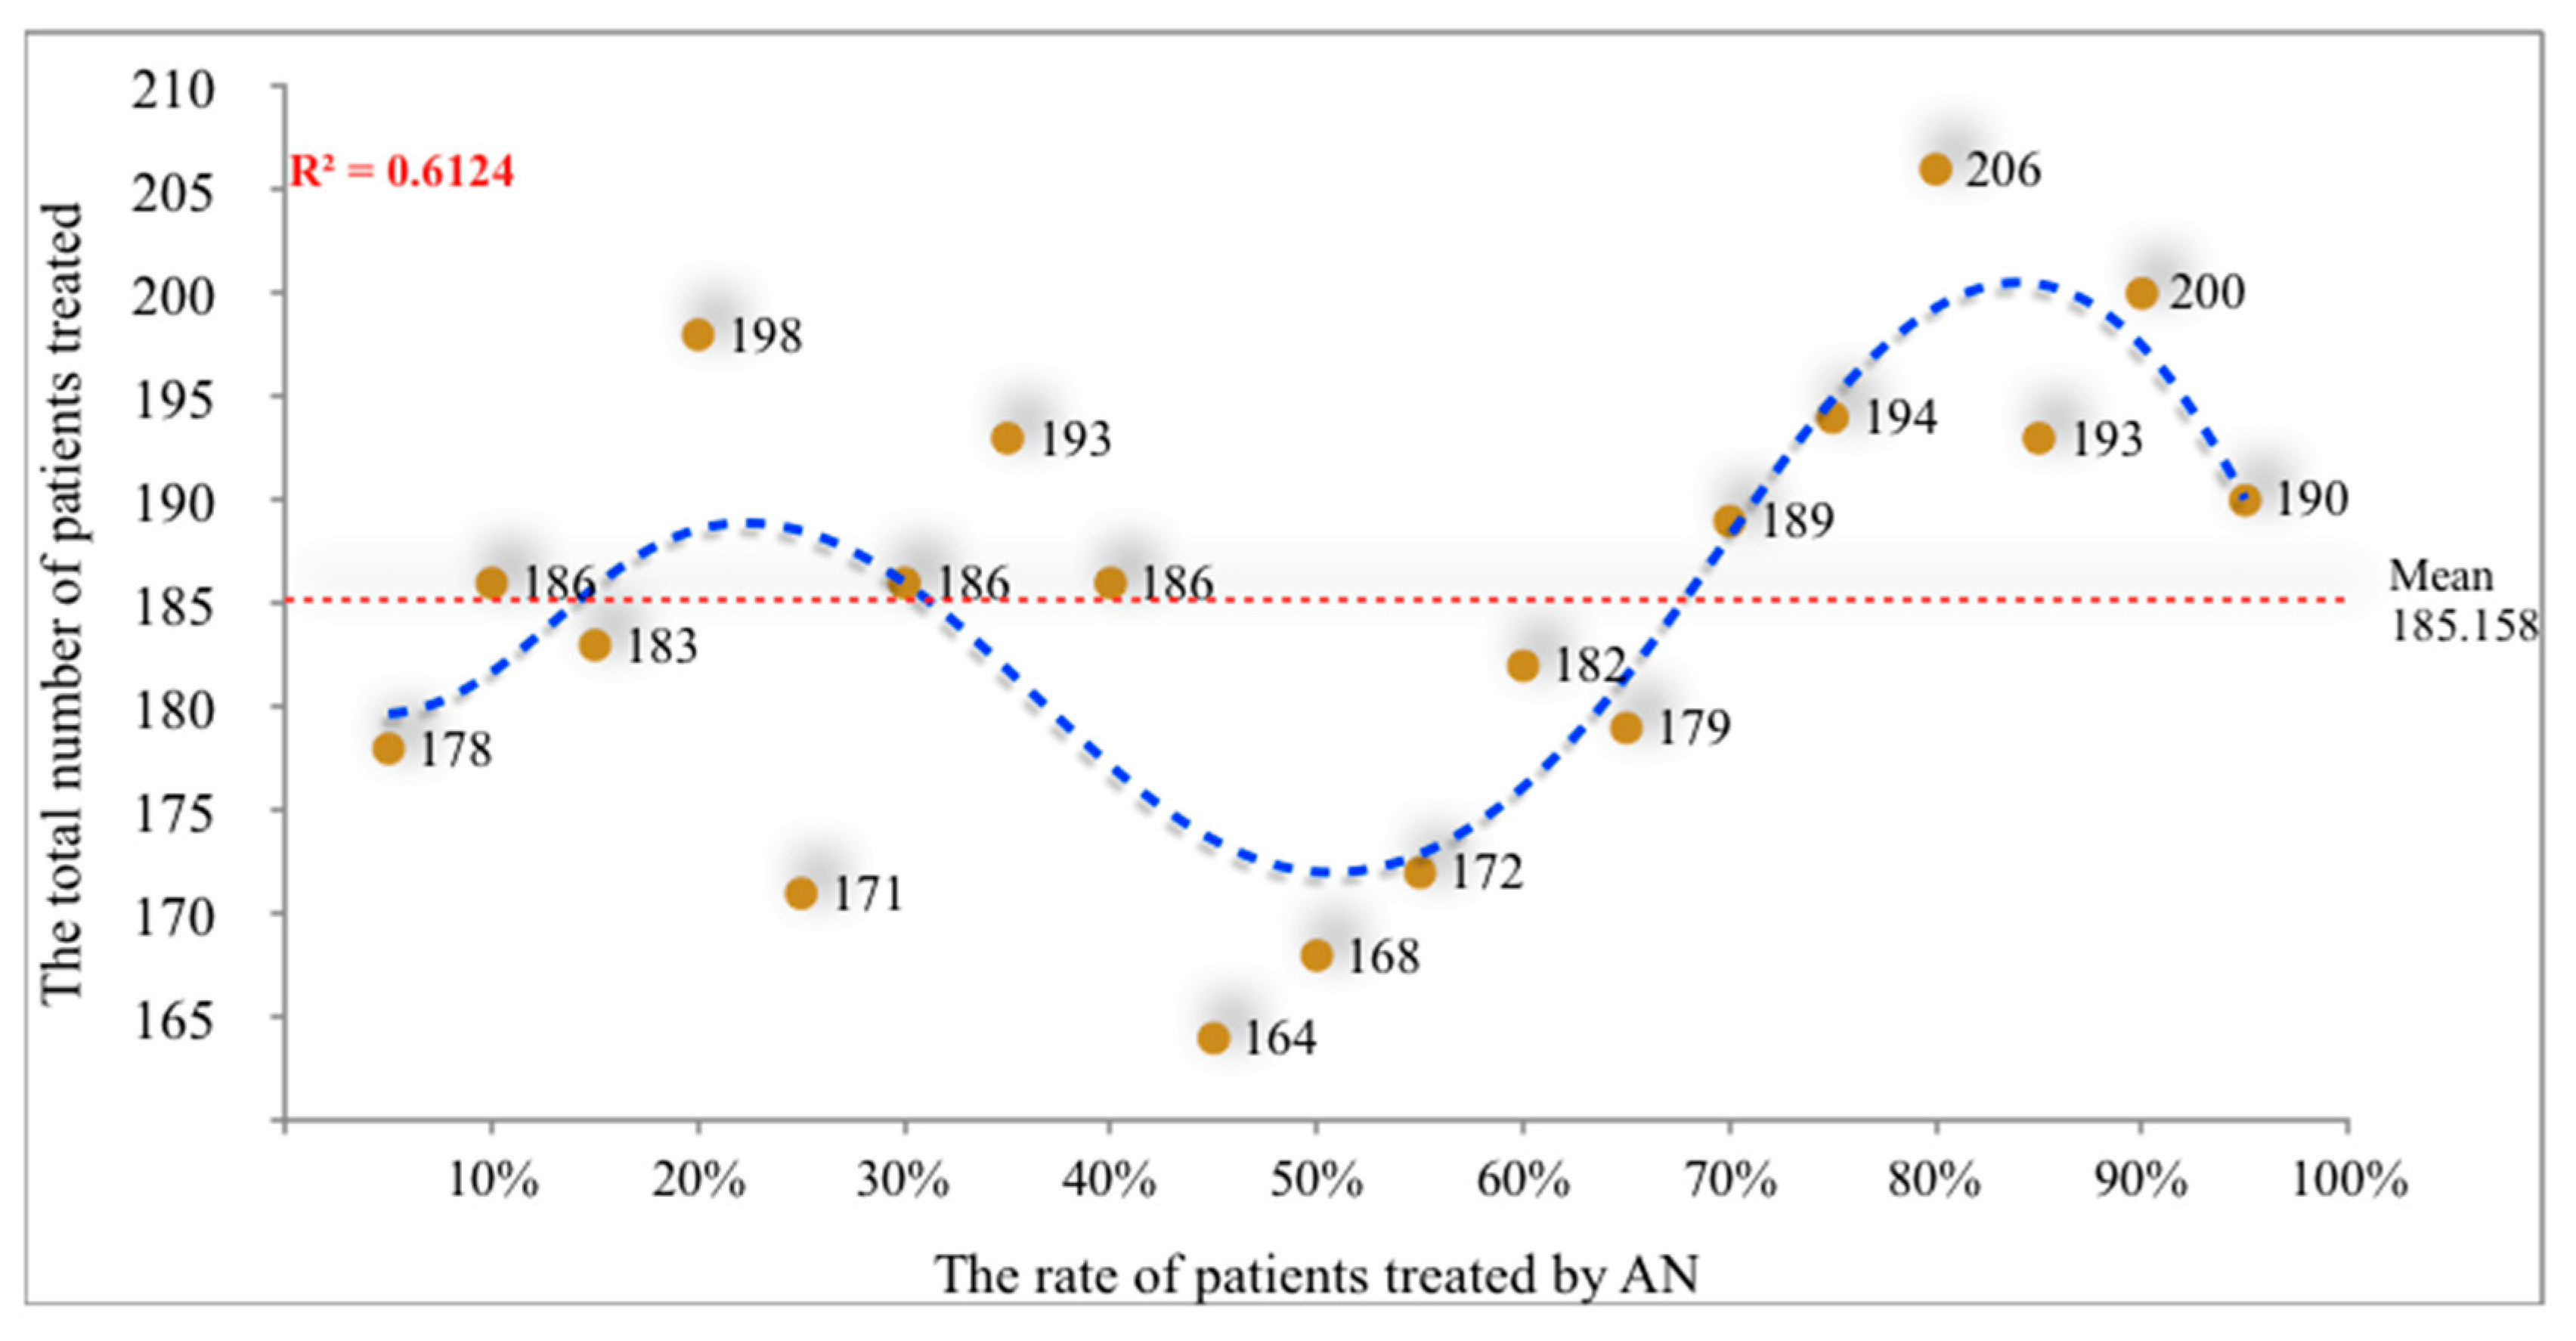
The total number of the patients treated for each scenario of the second situation of the simulation model is given in
Figure 4. The R
2 value of the data is lower, as compared to the other parameters’ results. The reason for this is that the number of patients in the simulation model is not associated with the number of the patients being referred to ESs, but with the number of patients who are discharged,
ypo1/24. The line that was drawn for the data seems to be a polynomial sixth-degree curve. The equational explanation of this curve is given below:
After running the simulation model, the average number of patients that were examined for all scenarios was computed to be 185. This result is higher than the result of simulation model without AN, in which 26.71% more patients were treated with AN.
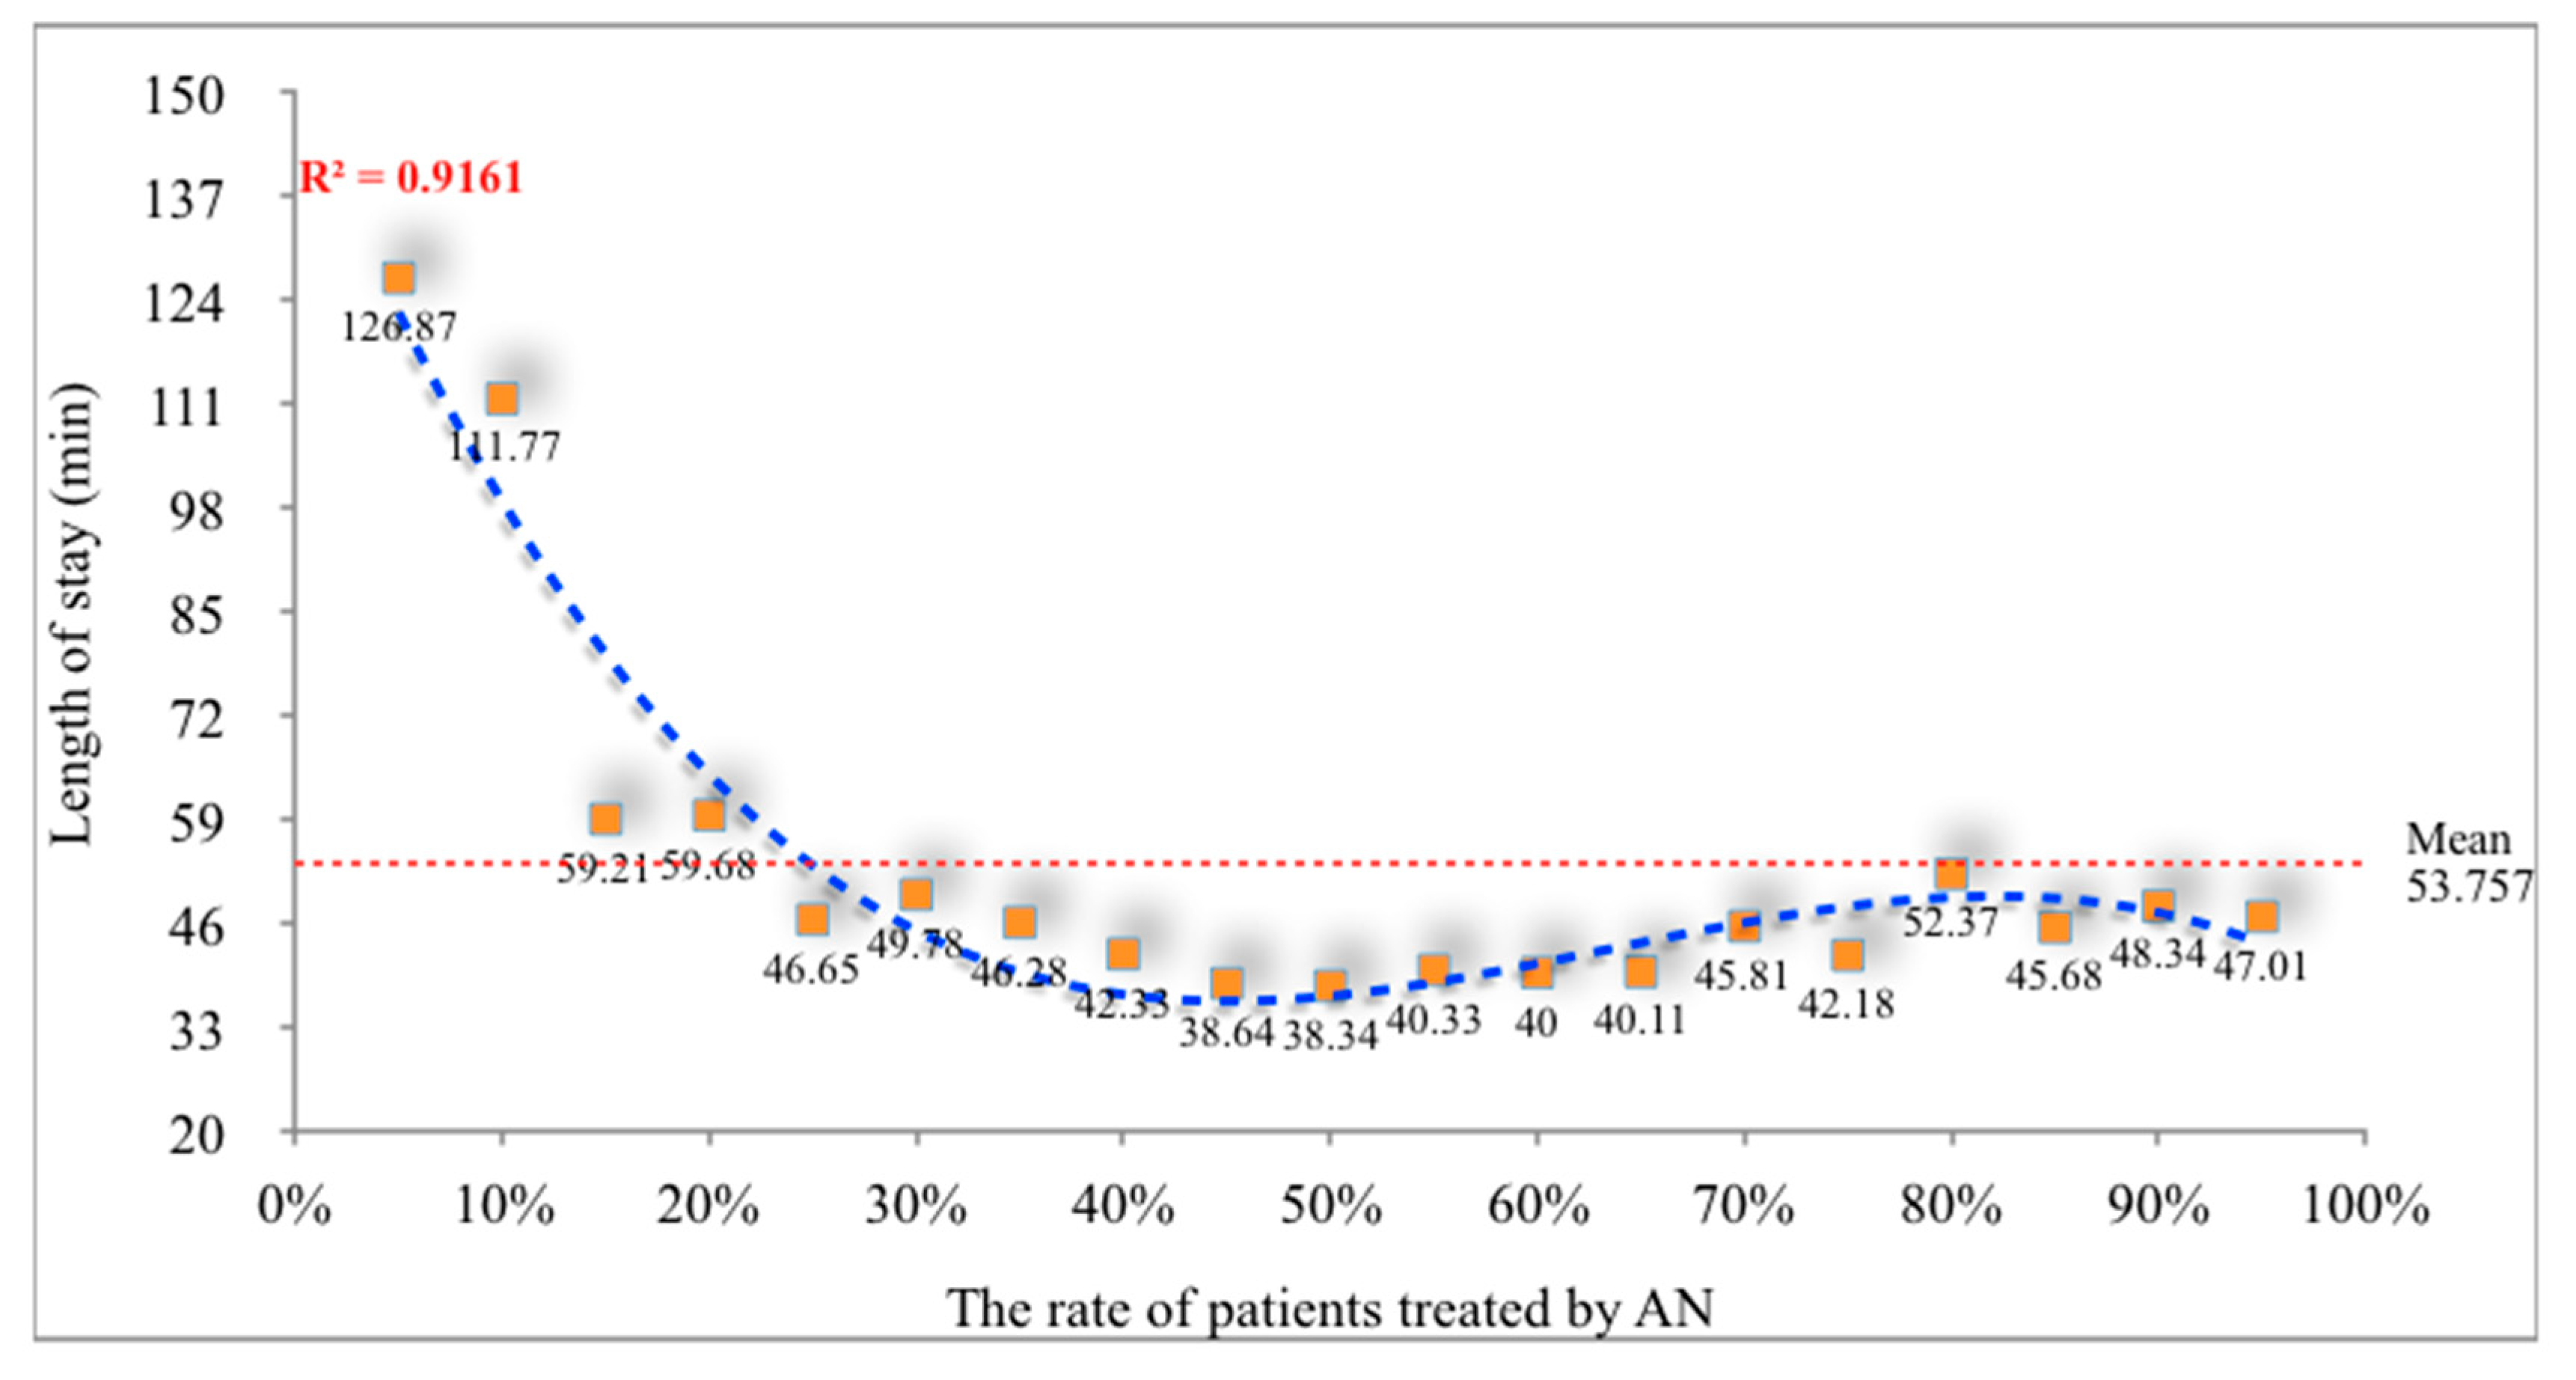
The minimum level of the length of stay was observed when the rate of the patients that were treated by AN was approximately 50.00% in
Figure 5. The average length of stay was determined as 53.75 min. This time was far below the value of the 1/24 basis in the simulation model, and a 41.85% reduction was achieved in comparison to that without AN.
The data on the length of stay,
ylos1/24, had a non-linear fourth-degree polynomial equation, to achieve a high value of R
2. The equation for the length of stay is given below:
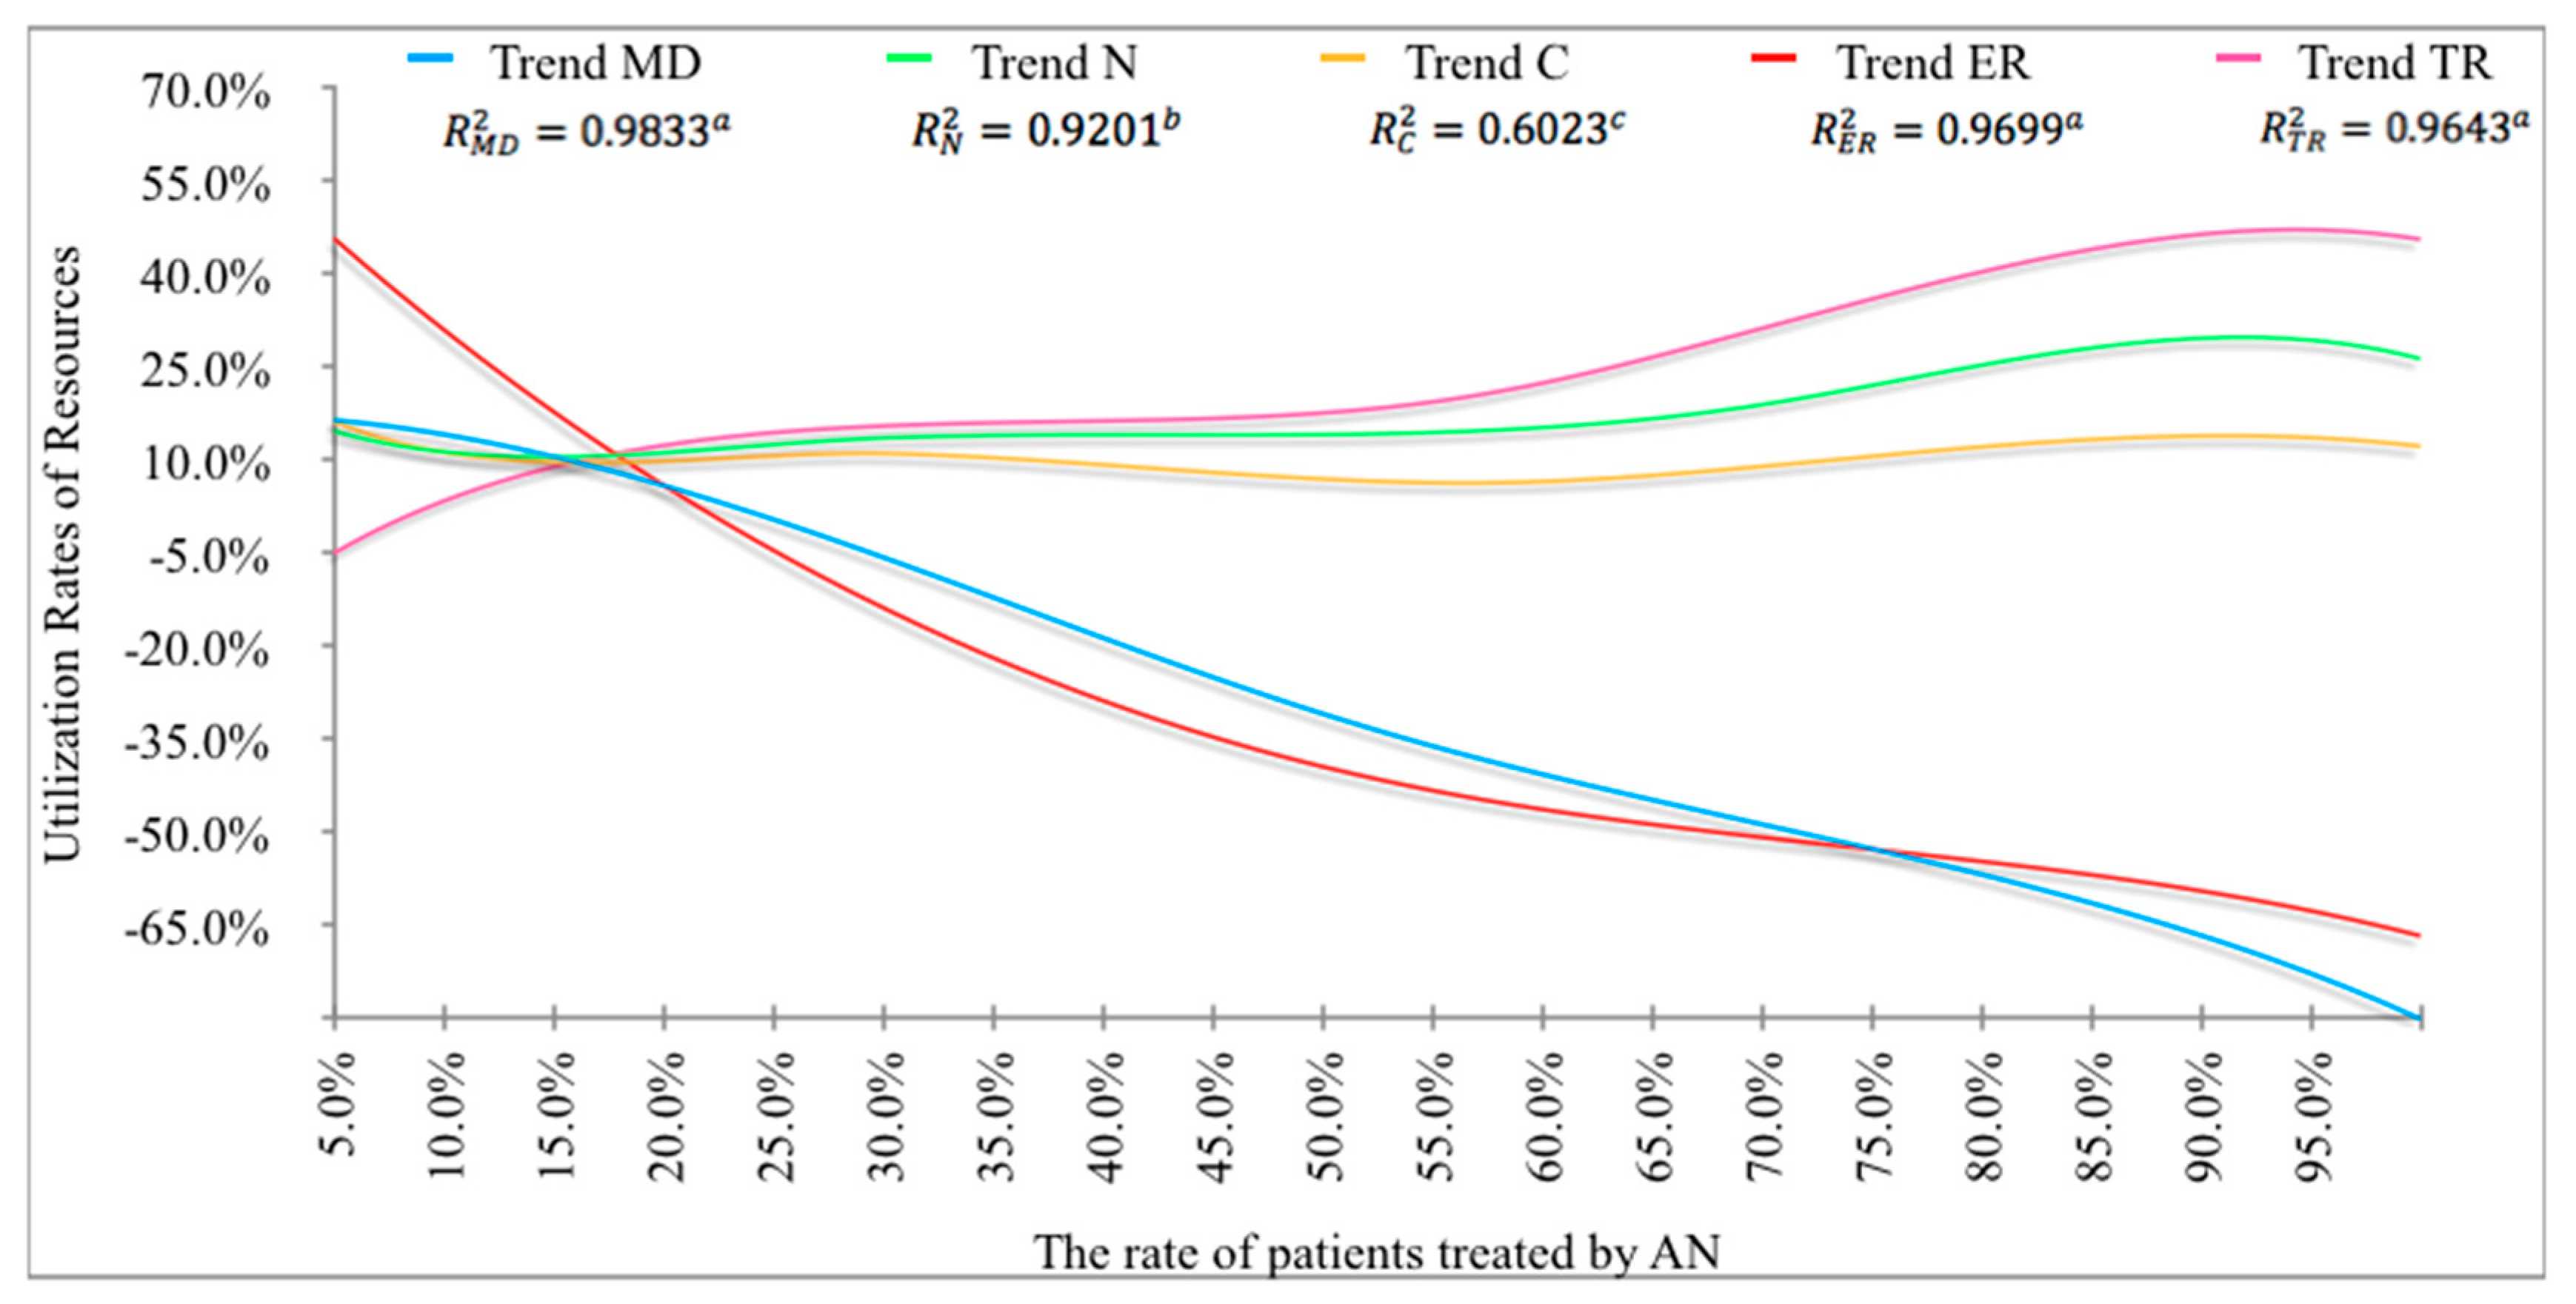
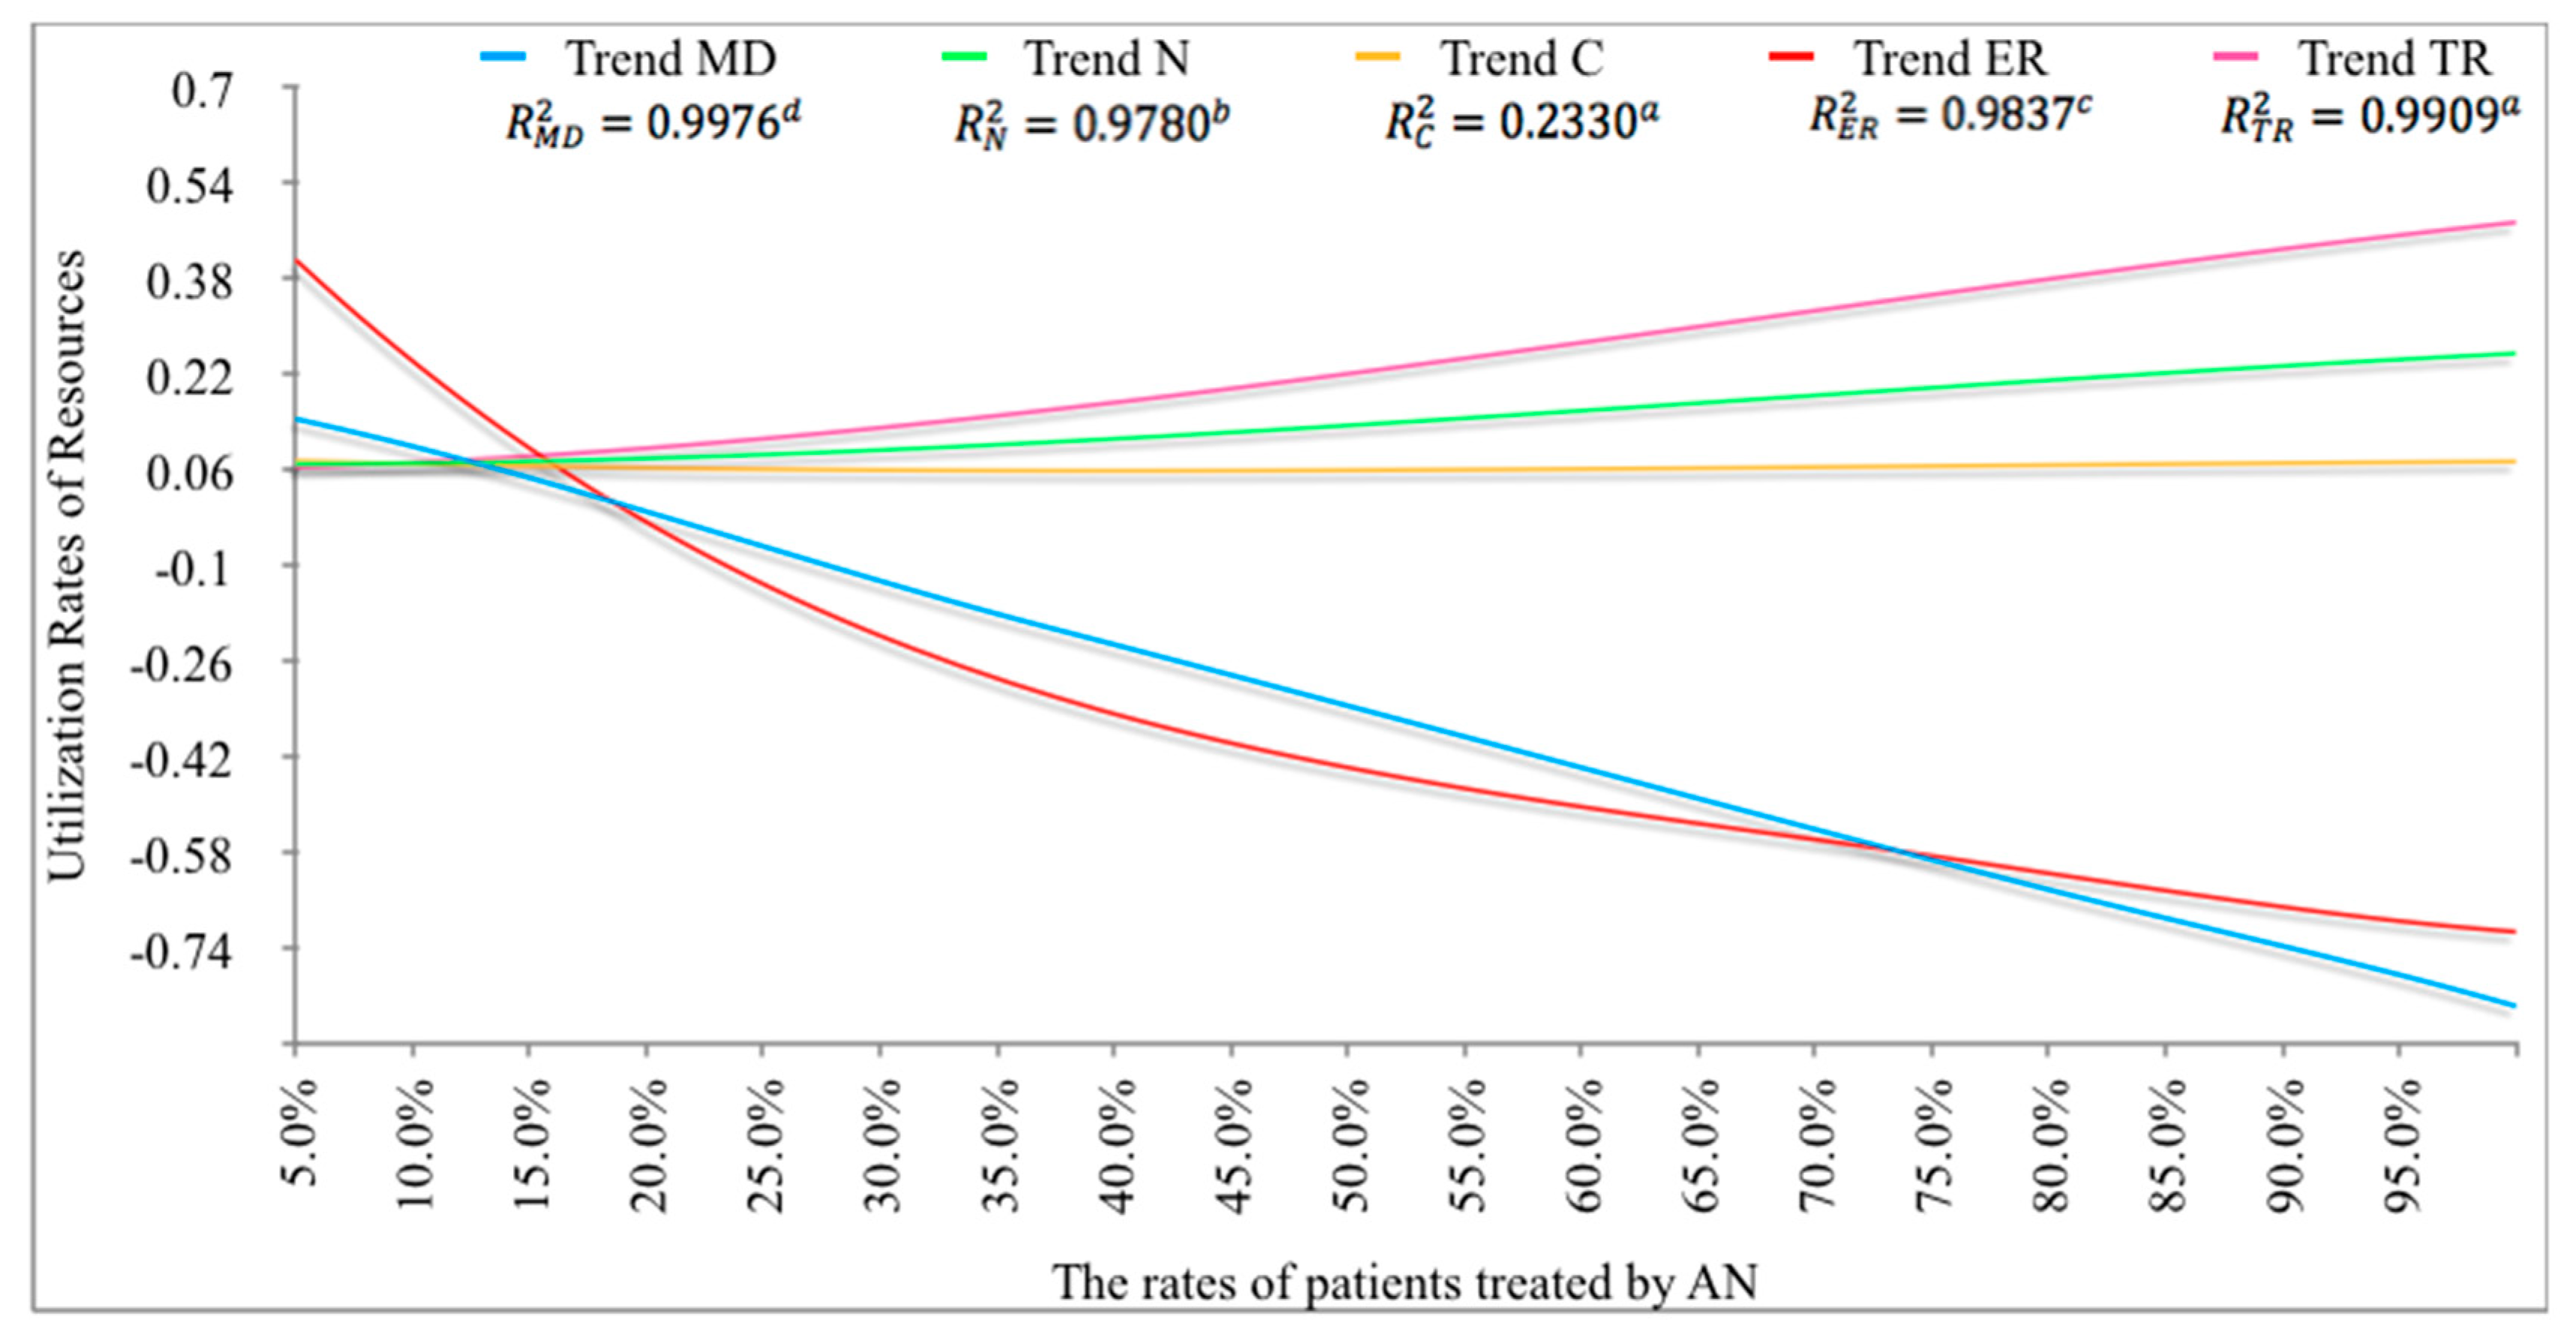
The changes in the efficiency rates of the resources (except the equipment) of ES that were employed in the face of the AN factor, are given in
Figure 6. Since the efficiency rates that are shown for five resources (medical doctors, MD; nurses, N; clerks, C; exam rooms, ER; and triage units, TR) are close to each other, it may be stated that there was a strong correlation between them.
With the increase in the rate of patients treated by AN, the decrease in the intensity of doctors and exam rooms is a desired result. In particular, it was determined that the intensity rate of doctors may be reduced by employing AN. The utilization rates of the rest of the resources showed a horizontal trend.
3.2. Results Obtained for the 7/24 Simulation Model
This part of the study considered the simulation model that was run on the 7/24 basis, the purpose of which was to obtain the best curve and equation to have a high R2 ratio.
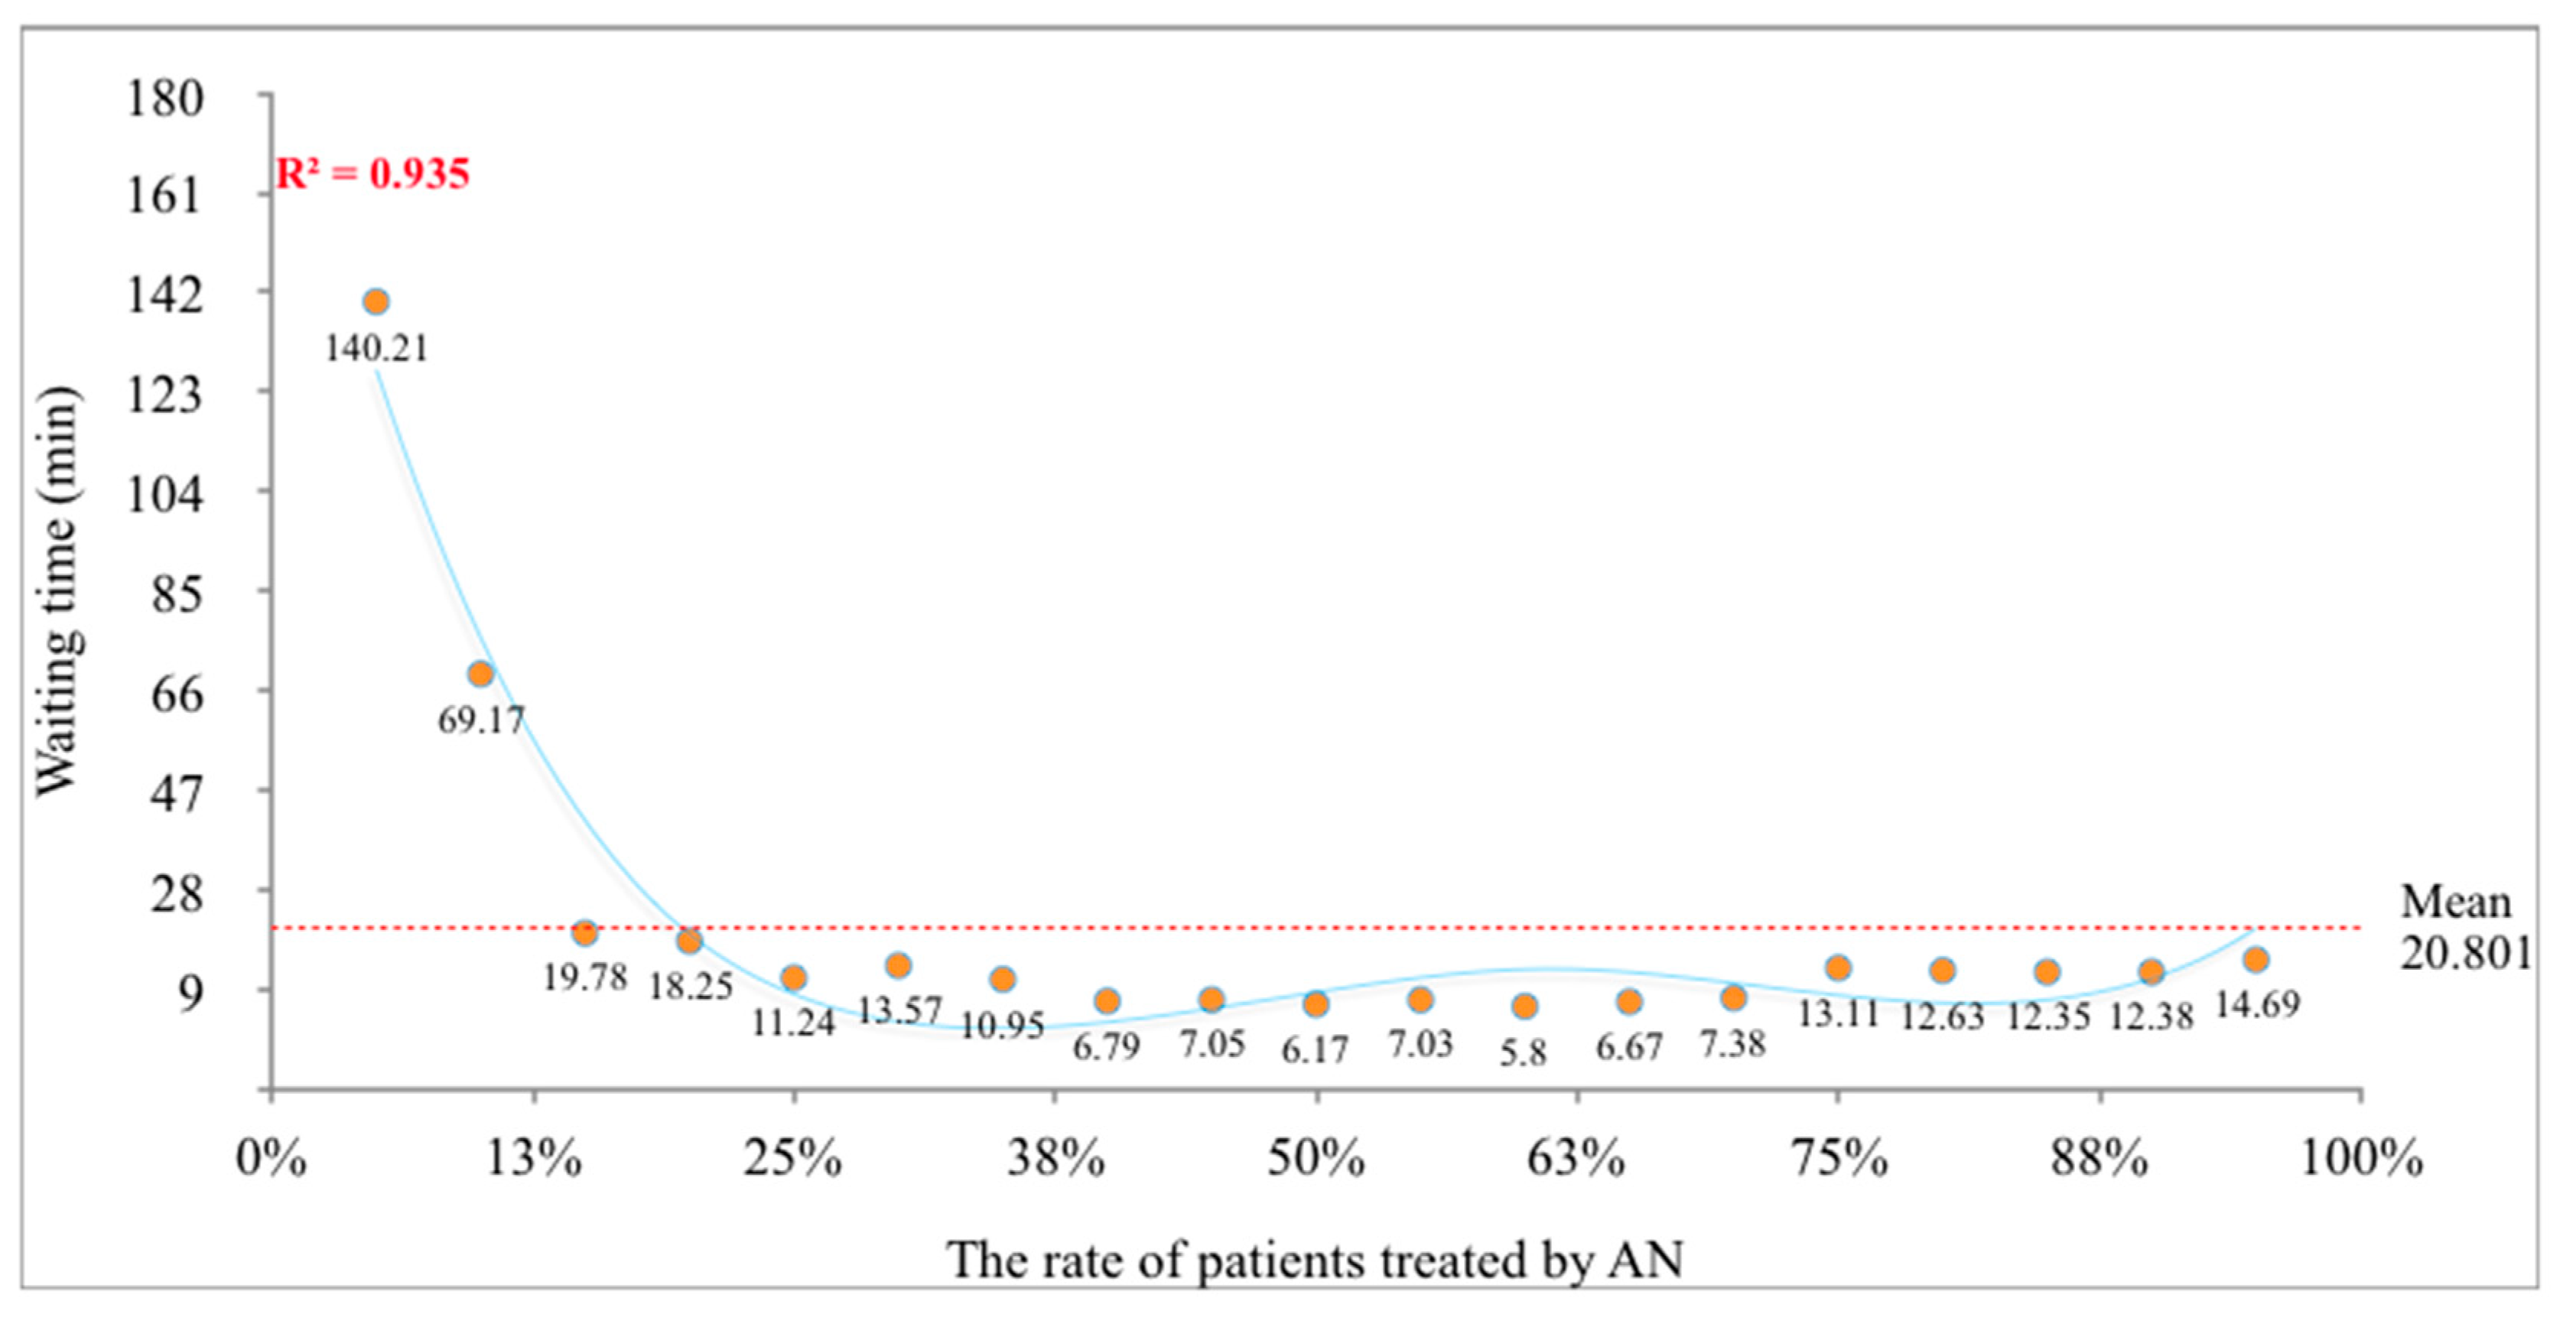
The impact of the rate of patients treated by AN on the waiting times of the patients,
ywt7/24, is given in
Figure 7. The waiting time of a patient was calculated as 20.801 min on a 7/24 basis with the help of an AN resource and a 53.66% reduction was achieved in comparison to that without AN. The following equation was obtained from a fourth-degree parabolic equation with a high R
2:
The relationship between the rate of patients treated by AN on a 7/24 basis, and the total number of patients that are treated is given in
Figure 8. The polynomial equation obtained on the basis of 7/24 with a sixth-degree equation was observed to have the same characteristics as on the basis of 1/24 with the polynomial equation. The sixth-degree non-linear equation that was obtained is formulated as:
The average number of the patients, ypo7/24, that was treated by ANs was computed as 1255. This result was 15.13% more than the number of the patients treated in the normal situation that did not include an AN resource.
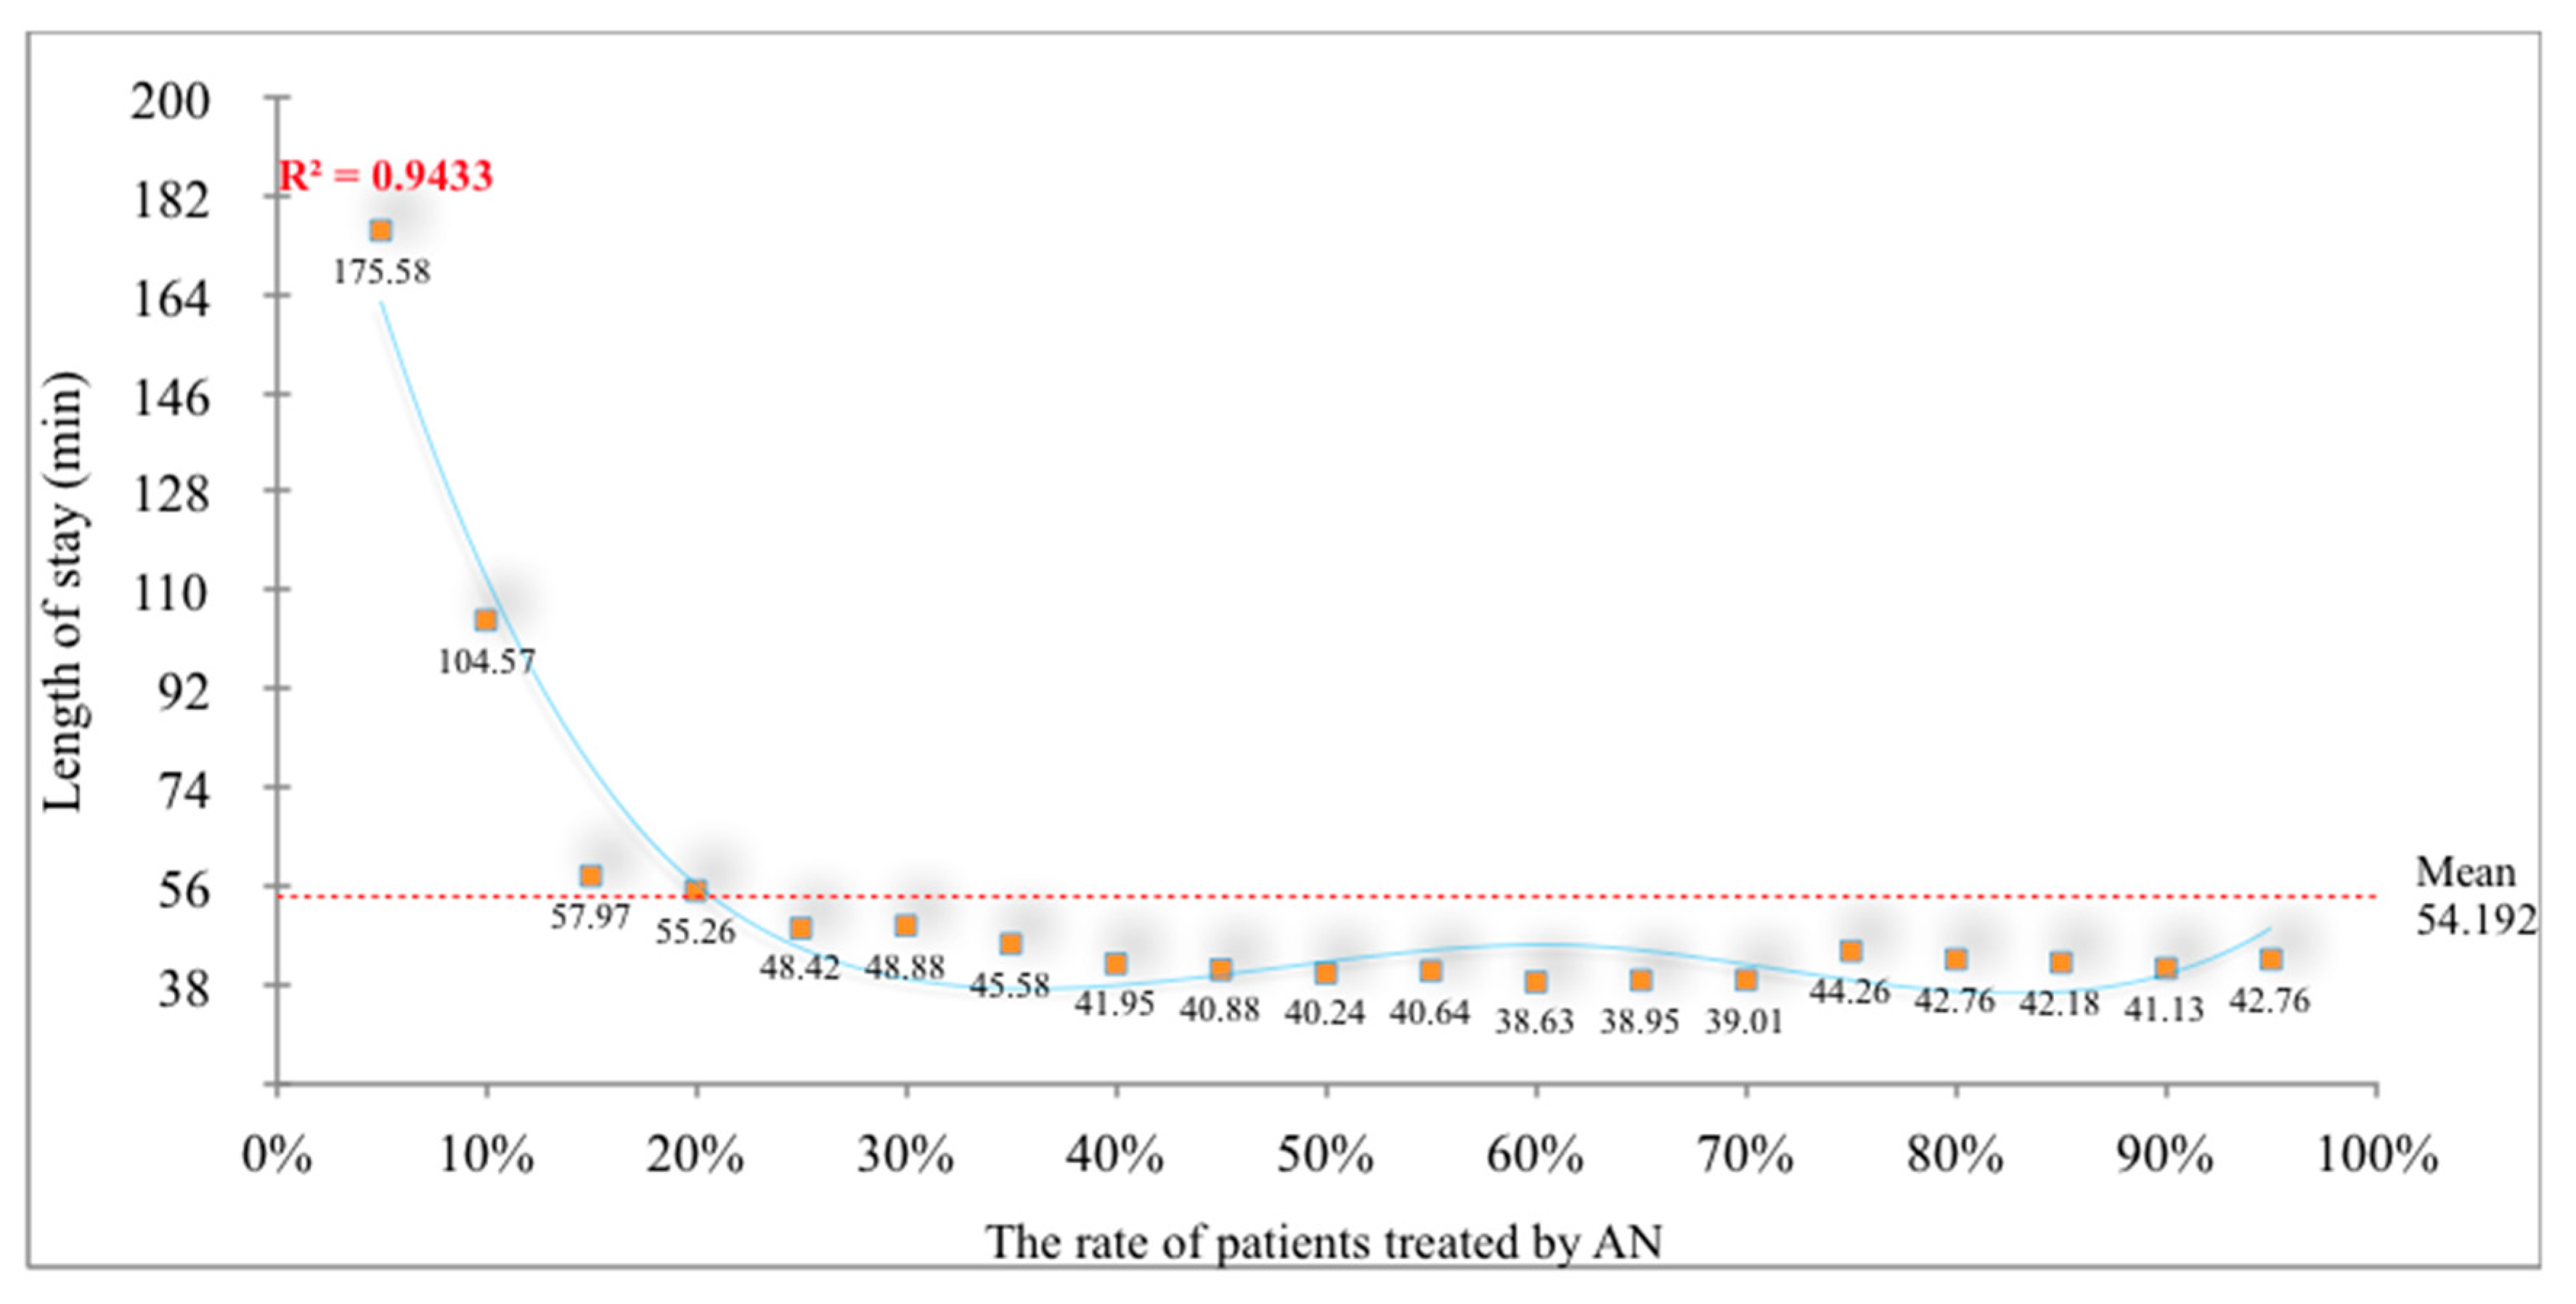
The relationship between the length of stay and the rate of patients treated by AN is shown in
Figure 9. The rate of patients treated by AN showed a fourth-degree polynomial distribution with an increase, and the length of stay in ESs decreased inversely. The average length of stay was computed as 54.192 min, which meant that a 34.28% improvement was reached. The mathematical formula of the length of stay is given as:
Figure 10 shows the efficiency rates of the existing resources of ES. The utilization of physicians and exam rooms decreased with an increased rate of the patients treated by AN. The reason behind the escalation of triage units’ intensity is the utilization of triage units as exam rooms or beds for patients treated by AN.
When the results that were obtained from the scenarios of the simulation models were compared, it was seen that AN employment increased the satisfaction of patients and made the resources more efficient. In
Table 5, data on the simulation models were given in detail. According to these data, changes were observed in the patient waiting times, length of stay in ES, and in the number of patients treated. Similarly, it was seen that changes in the efficiency of the resources used for the simulation model were positive.
The data in these tables were obtained from the 19 scenarios (with AN) and one scenario (without AN) that was produced for the first and second situations of the simulation model. In this study, the results of the scenarios were determined as the percentage changed. The percentage of patients who were treated when ANs were employed, was simulated between 5% and 95%, with 5% intervals. There were differences in the rates of the patients who arrived at ES, but who did not have any urgent conditions. For this reason, 19 scenarios were formed, data were obtained for every possible condition, and the average was considered. However, according to the literature data, the rates of patients who did not have any urgent situations, but which nonetheless applied to ESs, was generally above 50%. When this rate was considered, it was the level at which the patient waiting rates were at the lowest level in the simulation results obtained on a 1/24 basis. The lowest level (D) was obtained with a ratio of 40%/60% (AN) on a 7/24 basis.
It was observed that there was an imbalance in the efficiency rates of the resources that were employed in the ES. As the rate of the number of patients who were treated after ANs changed, it was observed that the resources with unbalanced efficiency rates became more balanced. It was ensured that the productivity of the doctor resource, which was difficult to employ, was reduced, and the need for the number of doctors employed number was decreased.
We conclude that the results of the parameters that are determined are more realistic than the findings of previous studies. The fact that the results obtained in studies using different methods are based on observations, and that the findings obtained in this study are based on numerical results supports the accuracy of the findings. As compared to the findings of other studies, we argue that the waiting time (mean time of 45.6 min vs. 20.69 min) and the length of stay (mean time of 107.2 min vs. 53.88 min) decreased further.
4. Conclusions
The main purpose of this study was to solve the intensity problems in ESs of Turkey. This research recommended that advanced nurses be employed in a more active way, by determining their skills and authorities. The aim of this recommendation was to reduce the intensity in ESs, so as to reduce the waiting times and length of stays of patients, which are the most important indicators of patient satisfaction.
The use of a discrete event computer simulation provided the results of the parameters defined in the research. The reason for the application of simulation models, which were performed by imitating real systems, was their ability to yield tangible, consistent, and valid results. The strategies or scenarios, which are expected to be realized in daily life, require high costs and longer times. However, with the help of the simulation, it was ensured that the results of the strategies and scenarios were obtained in a cost-efficient manner, in a short time span.
In the present study, a 3D simulation model was developed for two situations in an ES of Turkey. The number of the patients treated, waiting times of the patients, length of stays, and utilization of the resources of ES were compared within each scenario. The findings demonstrate that the number of patients treated increased at a rate of 26.71% on a 1/24 basis, and 15.13% on a 7/24 basis, by providing AN employment. From the moment that patients are referred to the ES, the waiting time for treatment was reduced to 20.58 min from 33.24 min on a 1/24 basis, and from 44.89 min to 20.80 min on a 7/24 basis. This means that improvements of 38.09% and 53.66% were achieved, respectively. Another finding of the study was that the length of stay (from registry to discharge) decreased by an average of 28.49 min in the ES. The last finding is related to the appropriate management of the healthcare institution, including the utilization of the resources it has. Generally, the efficiency achieved by the resources is too high or low (unbalanced efficiency rates) in ESs. In the context of the results, it was observed that balance was achieved in the efficiency rates of the resources with the employment of AN.
Briefly, as a result of the inability to use triage units in an accurate manner, disruptions, and intensive workloads are observed in the functioning of ESs in Turkey (after the admittance of a patient in ESs, the unit that will guide the patient and the resources is known as the triage unit). In the current situation, triage units only provide information on the area where the diagnosis and examination of the patient will be made. There are no examinations or treatment procedures in these units. We advocate running triage units in a more active way with the employment of ANs in this study.
As a result, the employment of ANs in ESs must be considered by the government in the healthcare system of Turkey. This recommendation contributes to the decrease of the intensities in ESs, and the employment of resources in a more efficient and effective manner.


