Abstract
To solve the unwieldy problem of coal chemical wastewater reverse osmosis concentrate (ROC), a novel treatment method in which coking coal was used to adsorb the organic from ROC and the adsorption mechanism involved was investigated. The results showed that the organic components in the ROC of coal chemical industry can be effectively absorbed by the coking coal and the total organic carbon, UV254 and chromaticity of treated ROC reduced by 70.18%, 70.15% and 59.55%, respectively, at the coking coal dosage of 80 g/L. The isothermal adsorption data were fitted to the Langmuir model well. The kinetics were expressed well by the quasi-second-order kinetic model. The intragranular diffusion model and the BET (Acronym for three scientists: Brunauer–Emmett–Teller) test showed that the adsorption occurred mainly on the surface of the coking coal and its macropores and mesopores. When the pollutants further diffused to the mesopores and micropores, the adsorption rate decreased. The result of X-ray photoelectron spectroscopy and fourier transform infrared spectroscopy spectra showed that the coking coal mainly adsorbed the nitrogen and oxygen species and the halogenated hydrocarbon organic compounds in the ROC. The chlorinated hydrocarbons and heterocyclic organics in ROC are adsorbed on the surface of coking coal.
1. Introduction
Regarding coal chemical wastewater, especially its reverse osmosis concentrate (ROC), there are serious membrane fouling, serious equipment corrosion and difficult crystallization purification during the processing. Due to its complex composition, high halogen content and its considerable biological toxicity by organic components [1], now treatment of ROC is obstacle to zero discharge of coal chemical enterprises, which needs to be solved urgently.
At present, the ROC processing technologies were actively researched many fields, such as desalination, municipal sewage treatment, industrial sewage treatment and so on. The ROC processing technologies including membrane treatment, biological treatment and advanced oxidation technology. With the application of online coagulation-ultrafiltration pretreatment technology, some organic components were removed under laboratory conditions [2]. In addition, the electrodialysis solution for seawater desalination ROC was proposed [3].
However, the problem of membrane contamination by organic components and inorganic ion scaling is still difficult to completely solve in the membrane treatment process. To address this problem, the direct contact membrane distillation process was applied to the pretreatment of ROC and the calcium hardness and sulfate ions can be removed by Na2CO3, NaOH and BaCl2 [4]. Separation of inorganic ions can effectively alleviate the scale problem but does not solve the problem of organic pollution. Many kinds of algae have the ability to degrade refractory organics but it is extremely difficult to breed microorganisms that are suitable for industrial wastewater environment [5].
Pre-oxidation of ROC before biodegradation can improve its biodegradability but it takes too long to adapt to coal chemical wastewater [6]. Furthermore, in the advanced oxidation treatment of ROC, only the S2O82− progeny free radicals generated by halogen and carbonate can offset the negative interference caused by inorganic ions [7]. In general, in the ROC where the organic and inorganic components are mixed, it is difficult for each treatment method to exert its effect. Thus, we considered separating the organic components and then treating them. On the other hand, activated carbon can be used to adsorb and remove organic components in ROC of seawater desalination [8]. On the other hand, activated carbon is expensive and difficult to regenerate, while coal is not only cheap but also has much higher surface utilization efficiency than traditional activated carbon [9]. Coal-based adsorbents are not only suitable for the adsorption of natural organic matter [10] but also for the adsorption of polycyclic aromatic hydrocarbon compounds [11,12].
In the previous work, on the one hand, advanced oxidation processes were used to treat ROC of coal chemical industry and certain effects were achieved (chemical oxygen demand removal reached more than 50%) [13] but the direct treatment economy was poor and the effect was not ideal. On the other hand, the potential of using coal as adsorbent to purify coking wastewater has been recently verified and the coal adsorbent has a good adsorption effect on refractory organic matter [14]. Based on this, we proposed the treatment process of pre-adsorption of coking coal to improve the efficiency of subsequent treatment process by separating the organic components in ROC. This research investigated the removal effect of coking coal on organic components in ROC of coal chemical industry. Coking coal was used to explore the adsorption process and mechanism by means of adsorption thermodynamics and kinetics tests, combining with chromaticity (Chromaticity), total organic carbon (TOC) and absorbance at the wavelength of 254 nm (UV254) and other indicators.
2. Materials and Methods
2.1. Materials
The coal sorbent used in the experiment was provided by Linhuan Coking Co., Ltd. located in Linhuan, Anhui province, China. And they were ground with an agate mortar to pass through a 0.074 mm sieve. The main characteristics of the coal were listed in Table 1.

Table 1.
1/3 Coking coal characteristics table.
The ROC was taken from the brine of the two-stage reverse osmosis membranes in a coal coking wastewater treatment plant and stored at 4 °C. They had been filtered through a 0.45 μm filter membrane before use. Table 2 provides the main characteristics of coal chemical ROC.
Table 2.
Coal chemical reverse osmosis concentrate (ROC) table.
The experimental water was deionized water. All other reagents were of analytical reagent grade and were purchased from Sinopharm Chemical Reagent Co., Ltd. (Shanghai, China).
2.2. Effect of Adsorbent Dosage
Coking coal of different quantity (0, 0.5, 1, 2, 4, 6 g) ware put into Erlenmeyer flasks pre-filled with 75 mL of ROC, respectively. Each group was incubated at 25 ℃ for 120 min at a thermostatic shaker, then centrifuged at 1800 r/min for 15 min in a centrifuge (L500, Hunan Xiang Yi Laboratory Instrument Development Co., Ltd., Shanghai, China) and finally filtered through a 0.45 μm nylon filter (Tianjin Experiment Equipment Co. Ltd., Tianjin, China) which was boiled three times. The chromaticity, chloride ion content, UV254, electrical conductivity (EC) and total organic carbon (TOC) were measured. And the removal rate (%) of each index is calculated as shown in the Equation (1):
where and respectively represent a certain characteristic value of ROC before and after adsorption.
2.3. Adsorption Isotherm Experiments
Five 100 mL volumetric flasks were separately added to ROC (10, 20, 40, 60, 80) mL and diluted with water to volume. 75 mL of the above diluted ROC solution and 4 g of coking coal were added to a 150 mL Erlenmeyer flask. Each group was incubated at 25 ℃ for 24 h at a thermostatic shaker, then centrifuged at 1800 r/min for 15 min in a centrifuge and finally filtered through a 0.45 μm nylon filter which was boiled three times. Using TOC as a test indicator, equilibrium adsorption capacity is calculated by the following equation:
where qe is the equilibrium adsorption capacity, (mg/g); Ce is the equilibrium liquid phase concentration, (mg/L); C0 is the initial liquid concentration (mg/L, initial concentration); V is the solution volume, (L); M is the adsorbent quality, (g).
Since Freundlich and Langmuir adsorption models were often used for coal-based adsorbents to adsorb organic compounds, they were used to fit the adsorption process [15]. Freundlich adsorption model is an empirical formula, which expresses the uneven adsorption on the surface but its parameters lack physical significance. Langmuir adsorption model is an ideal model, which can derive KL and qm, two physical quantities with practical significance.
The Freundlich isotherm, which is the earliest known relationship describing the adsorption isotherm, is an empirical equation employed to describe heterogeneous systems [16]. The ordinary adsorption isotherm is expressed by the following equation as shown in Equation (3). The ratio of the solute to the solute concentration adsorbed on the adsorption surface is the function of solute concentration. The function is obtained by taking the logarithm into a linear form of , as shown in Equation (4). According to experimental experience, it is easy to adsorb when 1/n is 0.1 to 1 and harder to adsorb when 1/n is greater than 2.
where KF and 1/n are empirical constants.
The Langmuir adsorption model is derived by assuming a single layer of adsorption and no interaction between the solute, as shown in Equation (5). Further, it is converted into straight line by taking the logarithm, as shown in Equation (6).
where qm is the maximum adsorption capacity, (mg/g) and KL is the adsorption equilibrium constant, (L/mg).
2.4. Adsorption Kinetics Experiments
Prepare 14 150 mL conical flasks, add 75 mL of ROC solution and 4 g of adsorbent to each conical flask, respectively, oscillate (0, 5, 10, 15, 30, 40, 50, 120, 240, 360, 480, 540, 720, 1440) min. Each group was incubated at 25 ℃ with a thermostatic shaker, then centrifuged at 1800 r/min for 15 min in a centrifuge and finally filtered through a 0.45 μm nylon filter which was boiled three times. The TOC adsorption amount at different adsorption times was calculated according to the Equation (7).
where qt is the adsorption amount at t time, (mg/g); Ct is the liquid phase concentration at t time, (mg/L).
Quasi-primary and quasi-secondary kinetics are commonly used to describe adsorption of real wastewater by adsorbents [17]. The quasi-first-order kinetics and the quasi-second-order kinetic model were used to fit the kinetic experimental data. The quasi-first-order kinetics model is given by Equation (8) and the quasi-second-order kinetics model is given by Equation (9).
where K1 is the quasi-first-order kinetic coefficient, (min−1); K2 is the quasi-second-order kinetic coefficient, (g·mg−1·min−1); t is time, (min).
and are determined by and , respectively and the fitted value is obtained by fitting the linear intercept.
The diffusion mechanism is explained by the internal diffusion model of the particle, as shown in Equation (10).
where K3 is the internal diffusion rate constant, (mg·g−1·min−1/2).
In general, if qt—t0.5 is a straight line, the adsorption process is controlled by intraparticle diffusion. If the data presents a multilinear graph, the adsorption process is affected by two or more phases.
2.5. Analytical Methods
The water samples were all filtered with 0.45 μm nylon membrane, Cl− detection was measured by AgNO3 titration (GB11896-89); the chromaticity was measured by XINRUI (SD9012A, Shanghai xinrui instruments Co., Ltd., Shanghai, China) water colorimeter; UV254 was measured by UV spectrophotometer (MRCY, UV-1500, Shanghai meishi instrument Co., Ltd., Shanghai, China) at a wavelength of 254 nm. The EC is measured by conductivity meter (Ray-Magnetic, DDS-307, INESA Scientific Instrument Co.,Ltd., Shanghai, China); TOC was measured by a TOC analyzer (Shimadzu, TOC-LCPH, Kyoto, Japan); The particle size was measured by laser particle size analyzer (BT-9300Z, Bettersize Instruments Ltd., Dandong, China); Fourier transform infrared spectroscopy(FTIR) was measured by infrared spectrometer (NICOLET iS10, Thermo Fisher Scientific, Waltham, MA, USA); X-ray photoelectron spectroscopy(XPS) was measured by (Thermo escalab 250Xi, Thermo Fisher Scientific, Waltham, MA, USA),all binding energies were referenced to the C1s peak at 284.8 eV of the surface adventitious carbon to correct the shift caused by charge effect.
Nitrogen adsorption was performed on an automated gas sorption analyzer (JW-BK112W Sci. & Tech., Beijing Jingwei Gaobo Science and Technology Co., Ltd., Beijing, China) to examine the porous characteristics of 1/3 coking coal samples. By measuring the N2 adsorption isotherms, following structural parameters were obtained: the specific surface area, adsorption average pore size and surface area average particle size.
3. Results and Discussion
3.1. Effect of Adsorbent Dosage
The change of TOC removal rate and unit adsorption quantity under different adsorbent dosage is shown in Figure 1. With the addition of adsorbent, the adsorption and the removal rate increased. At a dosage of 80 g/L (from 6 g coking coal to 75 mL solution, similarly hereinafter), the removal rate can reach 70.18%. As the coking coal dosage increased from 6.67 g/L to 80 g/L, the adsorption capacity decreased from 7.09 mg/g to 2.9 mg/g.
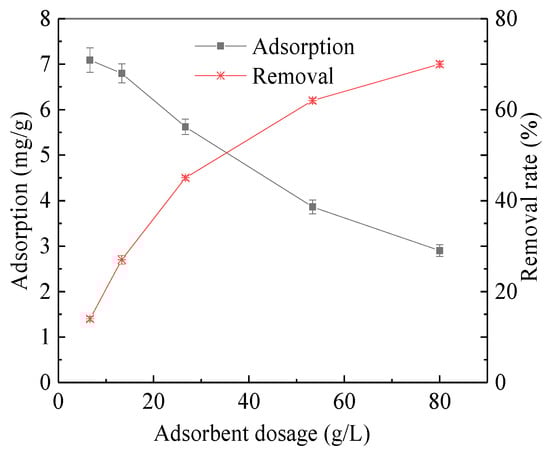
Figure 1.
Absorption and removal rate with the adsorbent dosage changes.
The changes of Cl− concentration and EC value, UV254, chromaticity and TOC under different adsorbent additions are shown in Figure 2 and Figure 3, respectively. There was no change in Cl− concentration and EC value, because of coking coal is difficult to adsorb polar substances; UV254 and chromaticity decrease significantly with the increase of adsorbent addition When coking coal dosage was 80 g/L, UV254 decreased from 9.42 Abs to 3.77 Abs and the chromaticity decreased from 1243 PCU to 271 PCU, with removal rates of 70.15% and 59.55%, respectively. The UV254 index reflects humic macromolecular organics and aromatic compounds containing C=C double bonds and C=O double bonds, which is the most typical toxic and refractory organic matter in coal chemical wastewater; Chromaticity can also macroscopically characterize the concentration of humic macromolecular organics. Moreover, the above two indicators have a good correlation, which confirms the adsorption of organic matter in ROC by coking coal, indicating that coking coal is suitable for the separation of organic and inorganic components in ROC.
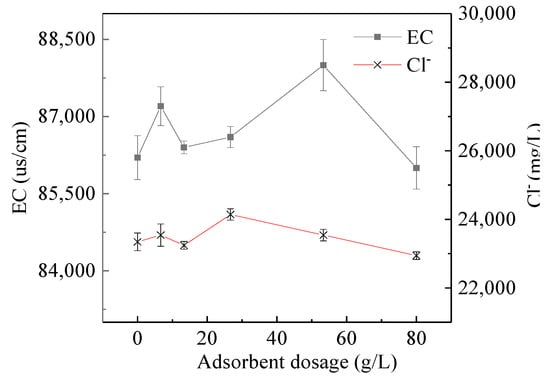
Figure 2.
Electrical conductivity (EC) and Cl− vary with adsorbent dosage.
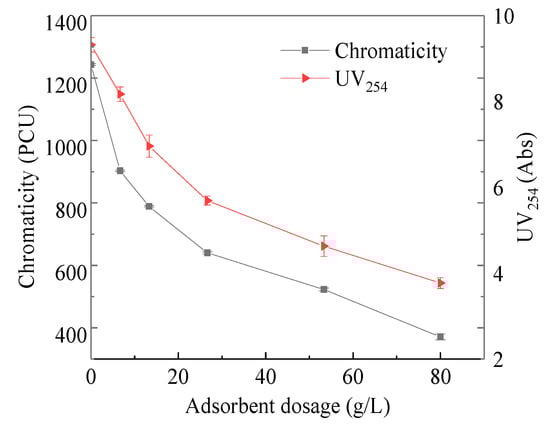
Figure 3.
UV254 and chromaticity vary with adsorbent dosage.
3.2. Adsorption Isotherms
The adsorption isotherm is drawn by the equilibrium adsorption concentration and the equilibrium adsorption amount [18]. As shown in Figure 4, the equilibrium adsorption amount increased with the initial concentration increased. The Freundlich and Langmuir adsorption models were used and the adsorption isotherms of TOC and UV254 were linearly fitted as shown in Figure 5 and Figure 6. The same method was used to fit the chromaticity adsorption isotherms. The results are shown in Table 3. From the fitting results of the Freundlich model, 1/n is between 0.5 and 1, so it is easy to be adsorbed. From the fitting results of the Langmuir model [15], KL values of chromaticity, TOC and UV254 are sorted from large to small as follows: UV254 > chromaticity > TOC, therefore, coking coal is stronger adsorb macromolecular organic matter.
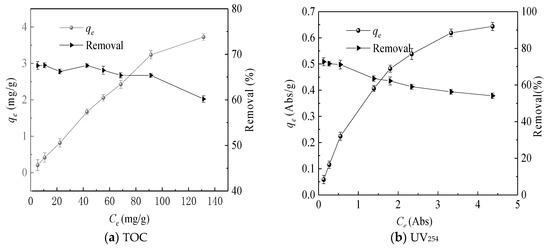
Figure 4.
Adsorption isotherms and removal rate.
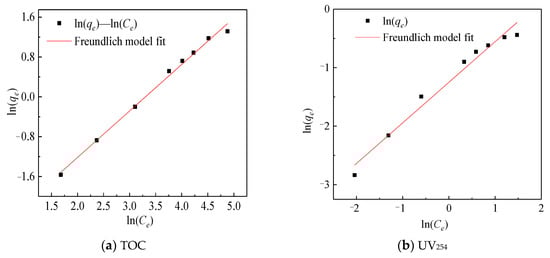
Figure 5.
Freundlich model fitting map.
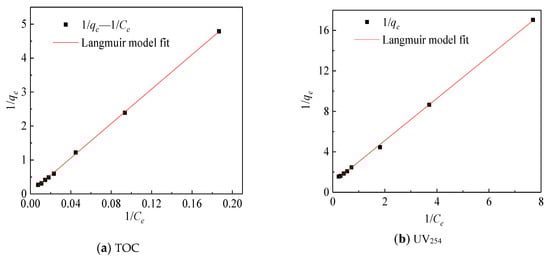
Figure 6.
Langmuir model fit map.
Table 3.
Isotherm constant fittings for TOC, UV254 and Chromaticity adsorption with Langmuir and Freundlich models.
These three isotherms are very close to the fitting results of the two models, indicating that the organic matter adsorbed by coking coal belongs to single-layer adsorption, which is consistent with the previous research work. In previous studies on the adsorption of single organic matter by coking coal, since the surface of coking coal is not an ideal surface, its adsorption of organic matter is more consistent with the Freundlich model [14] but the present study shows that it is closer to the Langmuir model (Langmuir, R2 = 0.9997; Freundlich, R2 = 0.9945). This may be due to the fact that the surface of coking coal contains different active sites that can combine organic compounds with different characteristics in ROC.
3.3. Adsorption Kinetics
TOC and UV254 as a function of adsorption time are presented in Figure 7a. It can be seen from the Figure 7a that the adsorption of coking coal for TOC and UV254 was rapid in the first 45 min and was basically balanced at 9 h. In order to further study its adsorption mechanism, quasi-first-order kinetics and quasi-second-order kinetic models were used to explain the adsorption process [19] and the fitted value was obtained by fitting the linear intercept, as shown in Figure 7b,c. The quasi-first-order kinetics and quasi-second-order kinetic model parameters obtained are given in Table 4. The qe, which was obtained by linear fitting of the quasi-second-order equation, was closer to the real value, so the quasi-second-order equation can explain the adsorption process of coking coal better. The adsorption rate of humic macromolecular organics and aromatic compounds (UV254, K2 = 0.0868) is higher than that of the total organic (TOC, K2 = 0.0138).
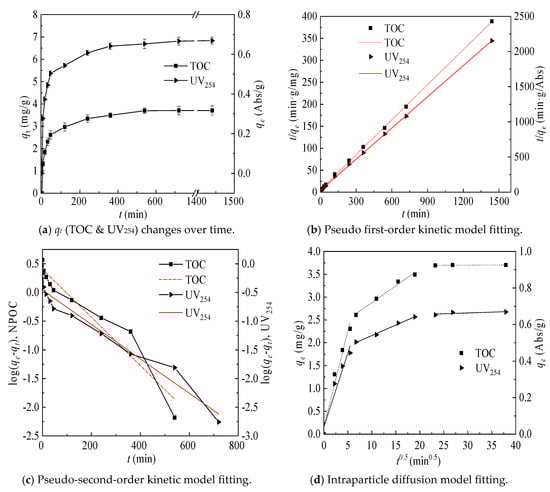
Figure 7.
qt (TOC & UV254) changes over time and kinetics model fitting.
Table 4.
Kinetic parameter fittings using the pseudo-first-order kinetic model and pseudo-second-order kinetic models.
The intraparticle diffusion model is used to analyze the rate control step, which has been widely used in carbon-based adsorbent materials [20]. Figure 7d shows the results of the intraparticle diffusion model fitting. As illustrated in Figure 7d, the adsorption process is divided into three stages. This is because the coking coal pore size is mainly distributed in the mesoporous range and the macroporous range and there are almost no micropores [21]. The first stage reflected that the organic matter was directly adsorbed on the surface active sites of coking coal and its macropores and the large slope indicated that the reaction was rapid at this stage. The second stage was that the organic matter were further diffused into the mesopores and it can be judged from the adsorption time that it was the main limiting step of adsorption. The third stage reflected that the organic matter entered the micropores and the adsorption reached to desorption equilibrium.
3.4. BET Test
The particle diffusion mechanism of coke coal adsorption was verified by comparing the specific surface area, pore size and pore volume change before and after adsorption. After adsorption of ROC, the total pore volume decreased from 0.00819 to 0.00689, a decrease of 15.87%.
Pore volume changes with different pore sizes were further analyzed. The pore volume of each type before and after the absorption of ROC by coking coal, as shown in Figure 8. It can be seen from the figure that the decrease of mesoporous volume was the largest, while the decrease of macroporous volume was very small, with almost no micropores. Mesoporous adsorption plays an important role in the adsorption process, which was consistent with the conclusion of the intraparticle diffusion model.
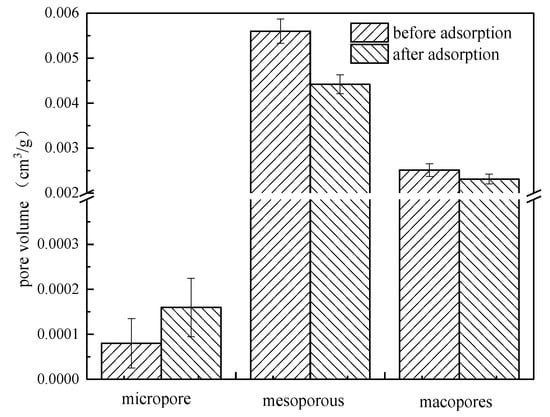
Figure 8.
The pore volume of each type before and after the absorption of ROC by coking coal.
This is mainly caused by the fact that coking coal itself has few micropores and the adsorption of hydrophobic macromolecules on the coking coal surface is stronger than that of polar small molecules.
3.5. FTIR and XPS Analysis
The FTIR of coking coal ROC before and after adsorption to and ROC itself are presented in Figure 9. Figure 9 shows the hydrogen-hydrogen bond stretching vibration of coking coal is at 3430 cm−1 and the CH2 stretching vibration of aliphatic hydrocarbons is characterized at 2922 cm−1 and 2853 cm−1 [22], near 1440 cm−1 is the deformation vibration of CH2 and CH3. The aromatic structure has three types of characteristic absorption peaks. The vicinity of 1600 cm−1 is the aromatic C=C skeleton vibration; the vicinity of 3040 cm−1 is the aromatic C-H stretching vibration; and the 747 cm−1, 808 cm−1 and 877 cm−1 is the aromatic C-H out-of-plane deformation vibration [18,23].
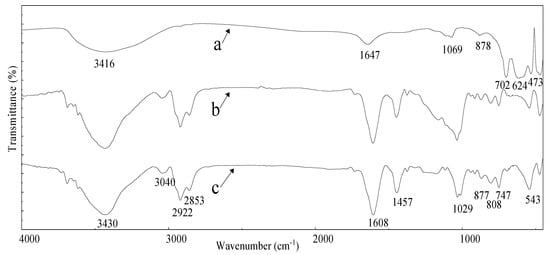
Figure 9.
Fourier transform infrared spectroscopy of ROC (a), coking coal before adsorption (b) and coking coal after adsorption (c).
After absorption, the C-H stretching vibration peak and the aromatic C-H out-of-plane deformation vibration peak absorption intensity increased, while the aromatic nuclear vibration peak did not change significantly. Considering the heterocyclic compounds present in ROC, the increase of C-H bond on the aromatic structure of coking coal mainly comes from these heterocyclic compounds. The C-Cl vibration peak at 543 cm−1 was enhanced by adsorption.
Three types of vibration peaks can be observed in the infrared spectrum of ROC. They are the absorption peaks of the associative amides C=O and N-H vibration peaks near 1647 cm−1 and 702 cm−1, the peak of the aliphatic primary amine(C-N) near 1069 cm−1 [24] and the stretching vibration peak and deformation vibration peak of C-Cl near 624 cm−1 and 473 cm−1.
According to the absorption peak in ROC and the adsorption peak in coking coal after adsorption of ROC, it can be inferred that the chlorinated hydrocarbons and heterocyclic organics in ROC were adsorbed on the surface of coking coal.
The XPS results of coking coal and coking coal after ROC adsorption are shown in Figure 10. The spectrum of the coking coal before adsorption indicates that the content of C element is high, while the content of O element and N element is low. After coking coal adsorbed ROC, the surface of coking coal was mainly covered by C, O and N and the characteristic peaks of Na and Cl were detected.
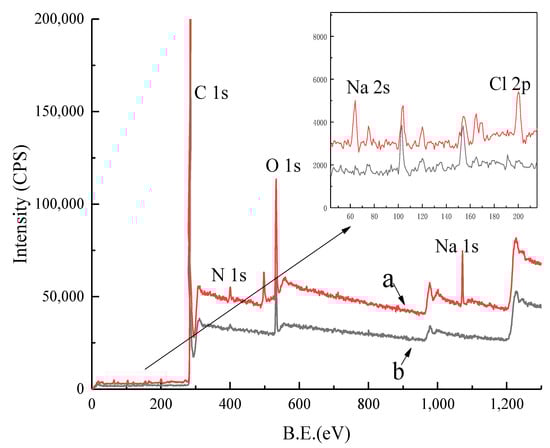
Figure 10.
The X-ray photoelectron spectroscopy and partial enlargement of coking coal after adsorption (a) and coking coal before adsorption (b).
To further investigate the adsorption mechanism, XPS data analysis was performed with the XPSPEAK4.1 program. The high resolution spectrum of C1s was divided into four characteristic peaks. They are respectively 284.8 eV (C-C/C-H), 289.59 eV (C=O), 286.3 eV (C-OH/C-O-C) and 285.74 eV (C-N) peaks. The high resolution spectrum of O1s was divided into three characteristic peaks. The characteristic peaks are 531.24 eV (O=C), 532.54 eV (O-C) and 533.34 eV (O= C-O), respectively [20,25].
The high resolution spectrum of C1s is shown in Figure 11. After adsorption of ROC, the peak area of C=O and C-N of the coking coal increased significantly, which was caused by the adsorption of nitrogen and oxygen-containing organics on the surface in the ROC. The XPS of the high resolution spectrum of O1s is shown in Figure 12. The results showed that the surface of coking coal was mainly composed of hydroxyl groups and the proportion of aldehyde groups and carboxyl groups increased after adsorption of ROC. This was related to the concentration of C=O bonds such as humic acid in the coking coal adsorption ROC.
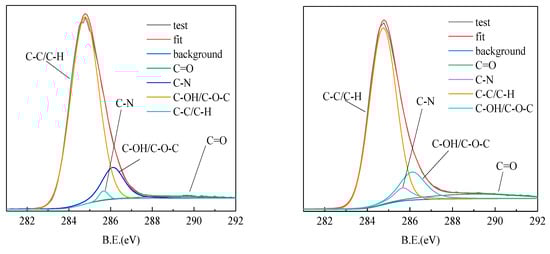
Figure 11.
The XPS fitting spectrum of C(1s) in coking coal before adsorption (left) and coking coal after adsorption (right).
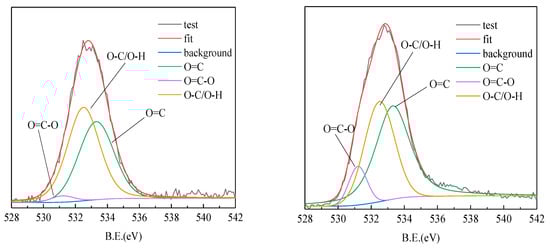
Figure 12.
The XPS fitting spectrum of O(1s) in coking coal before adsorption (left) and coking coal after adsorption (right).
4. Conclusions
Coking coal adsorption treatment of coal chemical wastewater can effectively reduce the TOC, UV254 and chromaticity of ROC. Under the dosage of 80 g/L coking coal, they can be reduced to 70.18%, 70.15% and 59.55% while no reduction of chloride ion was observed.
The adsorption of ROC organics by coking coal conformed to the Langmuir model and was easier to adsorb aromatic compounds. The adsorption process conformed to the quasi-secondary kinetic model; the adsorption speed on the surface of coking coal and its macropores was more rapid than in its mesopores and micropores. The organic matter in ROC was mainly adsorbed in the mesopores and macropores of coking coal and the pore volume and specific surface area of coking coal after adsorption were significantly reduced. The chlorinated hydrocarbons and heterocyclic organics in ROC were adsorbed on the surface of coking coal.
Author Contributions
Conceptualization, H.X. and Q.Q.; Methodology, H.X.; Software, Q.Q.; Validation, K.N., R.Z. and P.W.; Investigation, J.D.; Resources, G.H.; Data Curation, C.Z.; Writing-Original Draft Preparation, Q.Q.; Writing-Review & Editing, Q.Q. and H.X.; Visualization, Q.Q.; Supervision, H.X. and G.H.; Project Administration, H.X.; Funding Acquisition, H.X. and G.H.
Funding
This work was supported by the National Natural Science Foundation of China (NO.51604280) and the Open Fund of Key Laboratory of Coal Processing and Efficient Utilization (No.CPEUKF1803).
Conflicts of Interest
The authors declare no competing financial interest.
References
- Sun, Y.X.; Gao, Y.; Hu, H.Y.; Tang, F.; Yang, Z. Characterization and biotoxicity assessment of dissolved organic matter in RO concentrate from a municipal wastewater reclamation reverse osmosis system. Chemosphere 2014, 117, 545–551. [Google Scholar] [CrossRef] [PubMed]
- Jia, S.H.; Ma, Z.; Qin, J.; Si, H.S.; Toh, C.S. Inline coagulation–ultrafiltration as the pretreatment for reverse osmosis brine treatment and recovery. Desalination 2015, 365, 242–249. [Google Scholar]
- Jiang, C.; Wang, Y.; Zhang, Z.; Xu, T. Electrodialysis of concentrated brine from RO plant to produce coarse salt and freshwater. J. Membr. Sci. 2014, 450, 323–330. [Google Scholar] [CrossRef]
- Sanmartino, J.A.; Khayet, M.; García-Payo, M.C.; El-Bakouri, H.; Riaza, A. Treatment of reverse osmosis brine by direct contact membrane distillation: Chemical pretreatment approach. Desalination 2017, 420, 79–90. [Google Scholar] [CrossRef]
- Maeng, S.K.; Khan, W.; Park, J.W.; Han, I.; Yang, H.S.; Song, K.G.; Choi, W.J.; Kim, S.; Woo, H.; Kim, H.C. Treatment of highly saline RO concentrate using Scenedesmus quadricauda for enhanced removal of refractory organic matter. Desalination 2018, 430, 128–135. [Google Scholar] [CrossRef]
- Lu, J.; Fan, L.; Roddick, F.A. Potential of BAC combined with UVC/H2O2 for reducing organic matter from highly saline reverse osmosis concentrate produced from municipal wastewater reclamation. Chemosphere 2013, 93, 683–688. [Google Scholar] [CrossRef]
- Yang, Y.; Pignatello, J.J.; Ma, J.; Mitch, W.A. Effect of matrix components on UV/H2O2 and UV/S2O82− advanced oxidation processes for trace organic degradation in reverse osmosis brines from municipal wastewater reuse facilities. Water Res. 2016, 89, 192–200. [Google Scholar] [CrossRef] [PubMed]
- Wang, W. Characterisation and removal of organic matter from a reverse osmosis concentrate by a PAC accumulative countercurrent four-stage adsorption-MF hybrid process. Sep. Purif. Technol. 2017, 189, 425–432. [Google Scholar] [CrossRef]
- Simate, G.S.; Maledi, N.; Ochieng, A.; Ndlovu, S.; Zhang, J.; Walubita, L.F. Coal-based adsorbents for water and wastewater treatment. J. Environ. Chem. Eng. 2016, 4, 2291–2312. [Google Scholar] [CrossRef]
- Karanfil, T. Role of Granular Activated Carbon Surface Chemistry on the Adsorption of Organic Compounds. 1. Priority Pollutants. Environ. Sci. Technol. 1999, 33, 3217–3224. [Google Scholar] [CrossRef]
- Zeledon-Toruno, Z.C.; Lao-Luque, C.; de las Heras, F.X.C.; Sole-Sardans, M. Removal of PAHs from water using an immature coal (leonardite). Chemosphere 2007, 67, 505–512. [Google Scholar] [CrossRef] [PubMed]
- Liu, G.Q.; Sui, J.H.; Zhang, H.; Wu, B.C.; Li, Y.Z. Adsorption mechanism of RO concentrate by peanut shell activated carbon. Environ. Chem. 2012, 31, 862–868. [Google Scholar]
- Yang, J.; Wang, J.B.; Wang, Y.H.; Zhang, F.Y. Treatment of reverse osmosis concentrate from coal chemical industry with advanced oxidation process. Chin. J. Environ. Eng. 2015, 9, 3680–3686. [Google Scholar]
- Ning, K.J.; Wang, J.F.; Xu, H.X.; Sun, X.F.; Huang, G.; Liu, G.W.; Zhou, L.M. Effects and mechanistic aspects of absorbing organic compounds by coking coal. Water Sci. Technol. J. Int. Assoc. Water Pollut. Res. 2017, 9, 76. [Google Scholar] [CrossRef] [PubMed]
- Li, P.; Ailijiang, N.; Cao, X.; Lei, T.; Liang, P.; Zhang, X.; Huang, X.; Teng, J. Pretreatment of coal gasification wastewater by adsorption using activated carbons and activated coke. Colloids Surf. A Physicochem. Eng. Asp. 2015, 482, 177–183. [Google Scholar] [CrossRef]
- Chetima, A.; Wahabou, A.; Zomegni, G.; Ntieche Rahman, A.; Bup Nde, D. Bleaching of Neutral Cotton Seed Oil Using Organic Activated Carbon in a Batch System: Kinetics and Adsorption Isotherms. Processes 2018, 6, 22. [Google Scholar] [CrossRef]
- Kyzas, G.; Christodoulou, E.; Bikiaris, D. Basic Dye Removal with Sorption onto Low-Cost Natural Textile Fibers. Processes 2018, 6, 166. [Google Scholar] [CrossRef]
- Yuliani, G.; Garnier, G.; Chaffee, A.L. Utilization of raw and dried Victorian brown coal in the adsorption of model dyes from solution. J. Water Process Eng. 2017, 15, 43–48. [Google Scholar] [CrossRef]
- Goswami, S.; Pant, H.J.; Ambade, R.N.; Paul, B.; Varshney, L.; Dash, A. Study of adsorption characteristics of Au(III) onto coal particles and their application as radiotracer in a coal gasifier. Appl. Radiat. Isotopes 2017, 122, 127–135. [Google Scholar] [CrossRef]
- Yang, X.; Yi, H.H.; Tang, X.L.; Zhao, S.Z.; Yang, Z.Y.; Ma, Y.Q.; Feng, T.C.; Cui, X.X. Behaviors and kinetics of toluene adsorption-desorption on activated carbons with varying pore structure. J. Environ. Sci. 2017, 5, 67. [Google Scholar] [CrossRef]
- Zhu, J.F.; Liu, J.Z.; Yang, Y.M.; Cheng, J.; Zhou, J.H.; Cen, K.F. Fractal characteristics of pore structures in 13 coal specimens: Relationship among fractal dimension, pore structure parameter, and slurry ability of coal. Fuel Process. Technol. 2016, 149, 256–267. [Google Scholar] [CrossRef]
- Ji, X.Q.; Yao, H.F.; Li, W. FTIR spectroscopic study on tectonically deformed coals in Hancheng mining area. J. China Coal Soc. 2016, 41, 2050–2056. [Google Scholar]
- Xu, B.; Chen, L.; Xing, B.; Li, Z.; Zhang, L.; Yi, G.; Huang, G.; Mohanty, M.K. Physicochemical properties of Hebi semi-coke from underground coal gasification and its adsorption for phenol. Process Saf. Environ. Prot. 2017, 107, 147–152. [Google Scholar] [CrossRef]
- Tao, G.; Zhang, M.X.; Ma, X.M. XPS and FTIR Spectroscopy Characterization about the Structure of Coking Coal in Xinyang. Spectrosc. Spectr. Anal. 2017, 37, 2406–2411. [Google Scholar]
- Chen, S.; Tang, L.; Tao, X.; Chen, L.; Yang, Z.; Li, L. Effect of oxidation processing on the surface properties and floatability of Meizhiyou long-flame coal. Fuel 2017, 210, 177–186. [Google Scholar] [CrossRef]
© 2019 by the authors. Licensee MDPI, Basel, Switzerland. This article is an open access article distributed under the terms and conditions of the Creative Commons Attribution (CC BY) license (http://creativecommons.org/licenses/by/4.0/).