Article

Fuel Gas Network Synthesis Using Block Superstructure

Artie McFerrin Department of Chemical Engineering, Texas A&M University, College Station, TX 77843-3122, USA
*
Author to whom correspondence should be addressed.
Processes 2018, 6(3), 23; https://doi.org/10.3390/pr6030023
Submission received: 2 February 2018 / Revised: 24 February 2018 / Accepted: 26 February 2018 / Published: 1 March 2018

Abstract

:
Fuel gas network (FGN) synthesis is a systematic method for reducing fresh fuel consumption in a chemical plant. In this work, we address FGN synthesis problems using a block superstructure representation that was originally proposed for process design and intensification. The blocks interact with each other through direct flows that connect a block with its adjacent blocks and through jump flows that connect a block with all nonadjacent blocks. The blocks with external feed streams are viewed as fuel sources and the blocks with product streams are regarded as fuel sinks. An additional layer of blocks are added as pools when there exists intermediate operations among source and sink blocks. These blocks can be arranged in a I × J two-dimensional grid with I = 1 for problems without pools, or I = 2 for problems with pools. J is determined by the maximum number of pools/sinks. With this representation, we formulate FGN synthesis problem as a mixed-integer nonlinear (MINLP) formulation to optimally design a fuel gas network with minimal total annual cost. We revisit a literature case study on LNG plants to demonstrate the capability of the proposed approach.

1. Introduction

Over 40% of the operating cost of a petrochemical plant is attributed to energy consumption [1]. Energy is needed for raw material preprocessing (preheating, purification), separation of products from intermediates or impurities (product refining), and material transportation. There are multiple energy sources that can be exploited in a refinery, such as liquefied petroleum gas, fuel gas, off-gas, etc. [2,3]. These energy sources either come from external process raw materials and purchased fuels or from internal process products, and byproducts. Depending on where these fuel sources originate from, they can be classified as fuel from feed (FFF, e.g., natural gas) or fuel from product (FFP, e.g., products, byproducts) [4]. In 2016, external fuels supplied to refinery industry in the United States mainly consisted of natural gas (31%), electricity (5%), purchased steam and coal (1%) [5]. About 63% of the energy consumed by the refining industry comes from byproducts of the refining process for heat and power. These energy sources can be converted to each other. For example, fuel gas, produced internally from the distillation columns, crackers and reformers [6], can be converted to steam, electricity or heat. Fuel gas accounts for 46% of all energy sources for the refining industry in the United States [5,7,8,9]. Fuel gas is often composed of hydrocarbons (methane, ethane, propane and butane), hydrogen, and carbon monoxide, which have large heating values [10]. In most cases, these fuels are flared to the atmosphere, leading to detrimental effects on the environment and loss of heating values [11,12].
Due to the importance of fuel gas and the environment concern of fuel gas emission, many efforts have been made on improving the equipment efficiency [13] or exploiting new energy sources to decrease fuel gas generation and pollution emission [14]. Although these works give insights and directions on improving design of equipment and operating conditions, a generic and systematic strategy for elucidating the effective utilization of fuel gas is crucial. For example, in a typical fuel gas system, multiple fuel gas sources with different qualities are available for various equipment (sinks). As a result, effective and systematic management of fuel gas flow among fuel gas sources and fuel gas sinks can provide economic benefits for process design by fully utilizing the heating value embedded in the fuel gas [15,16].
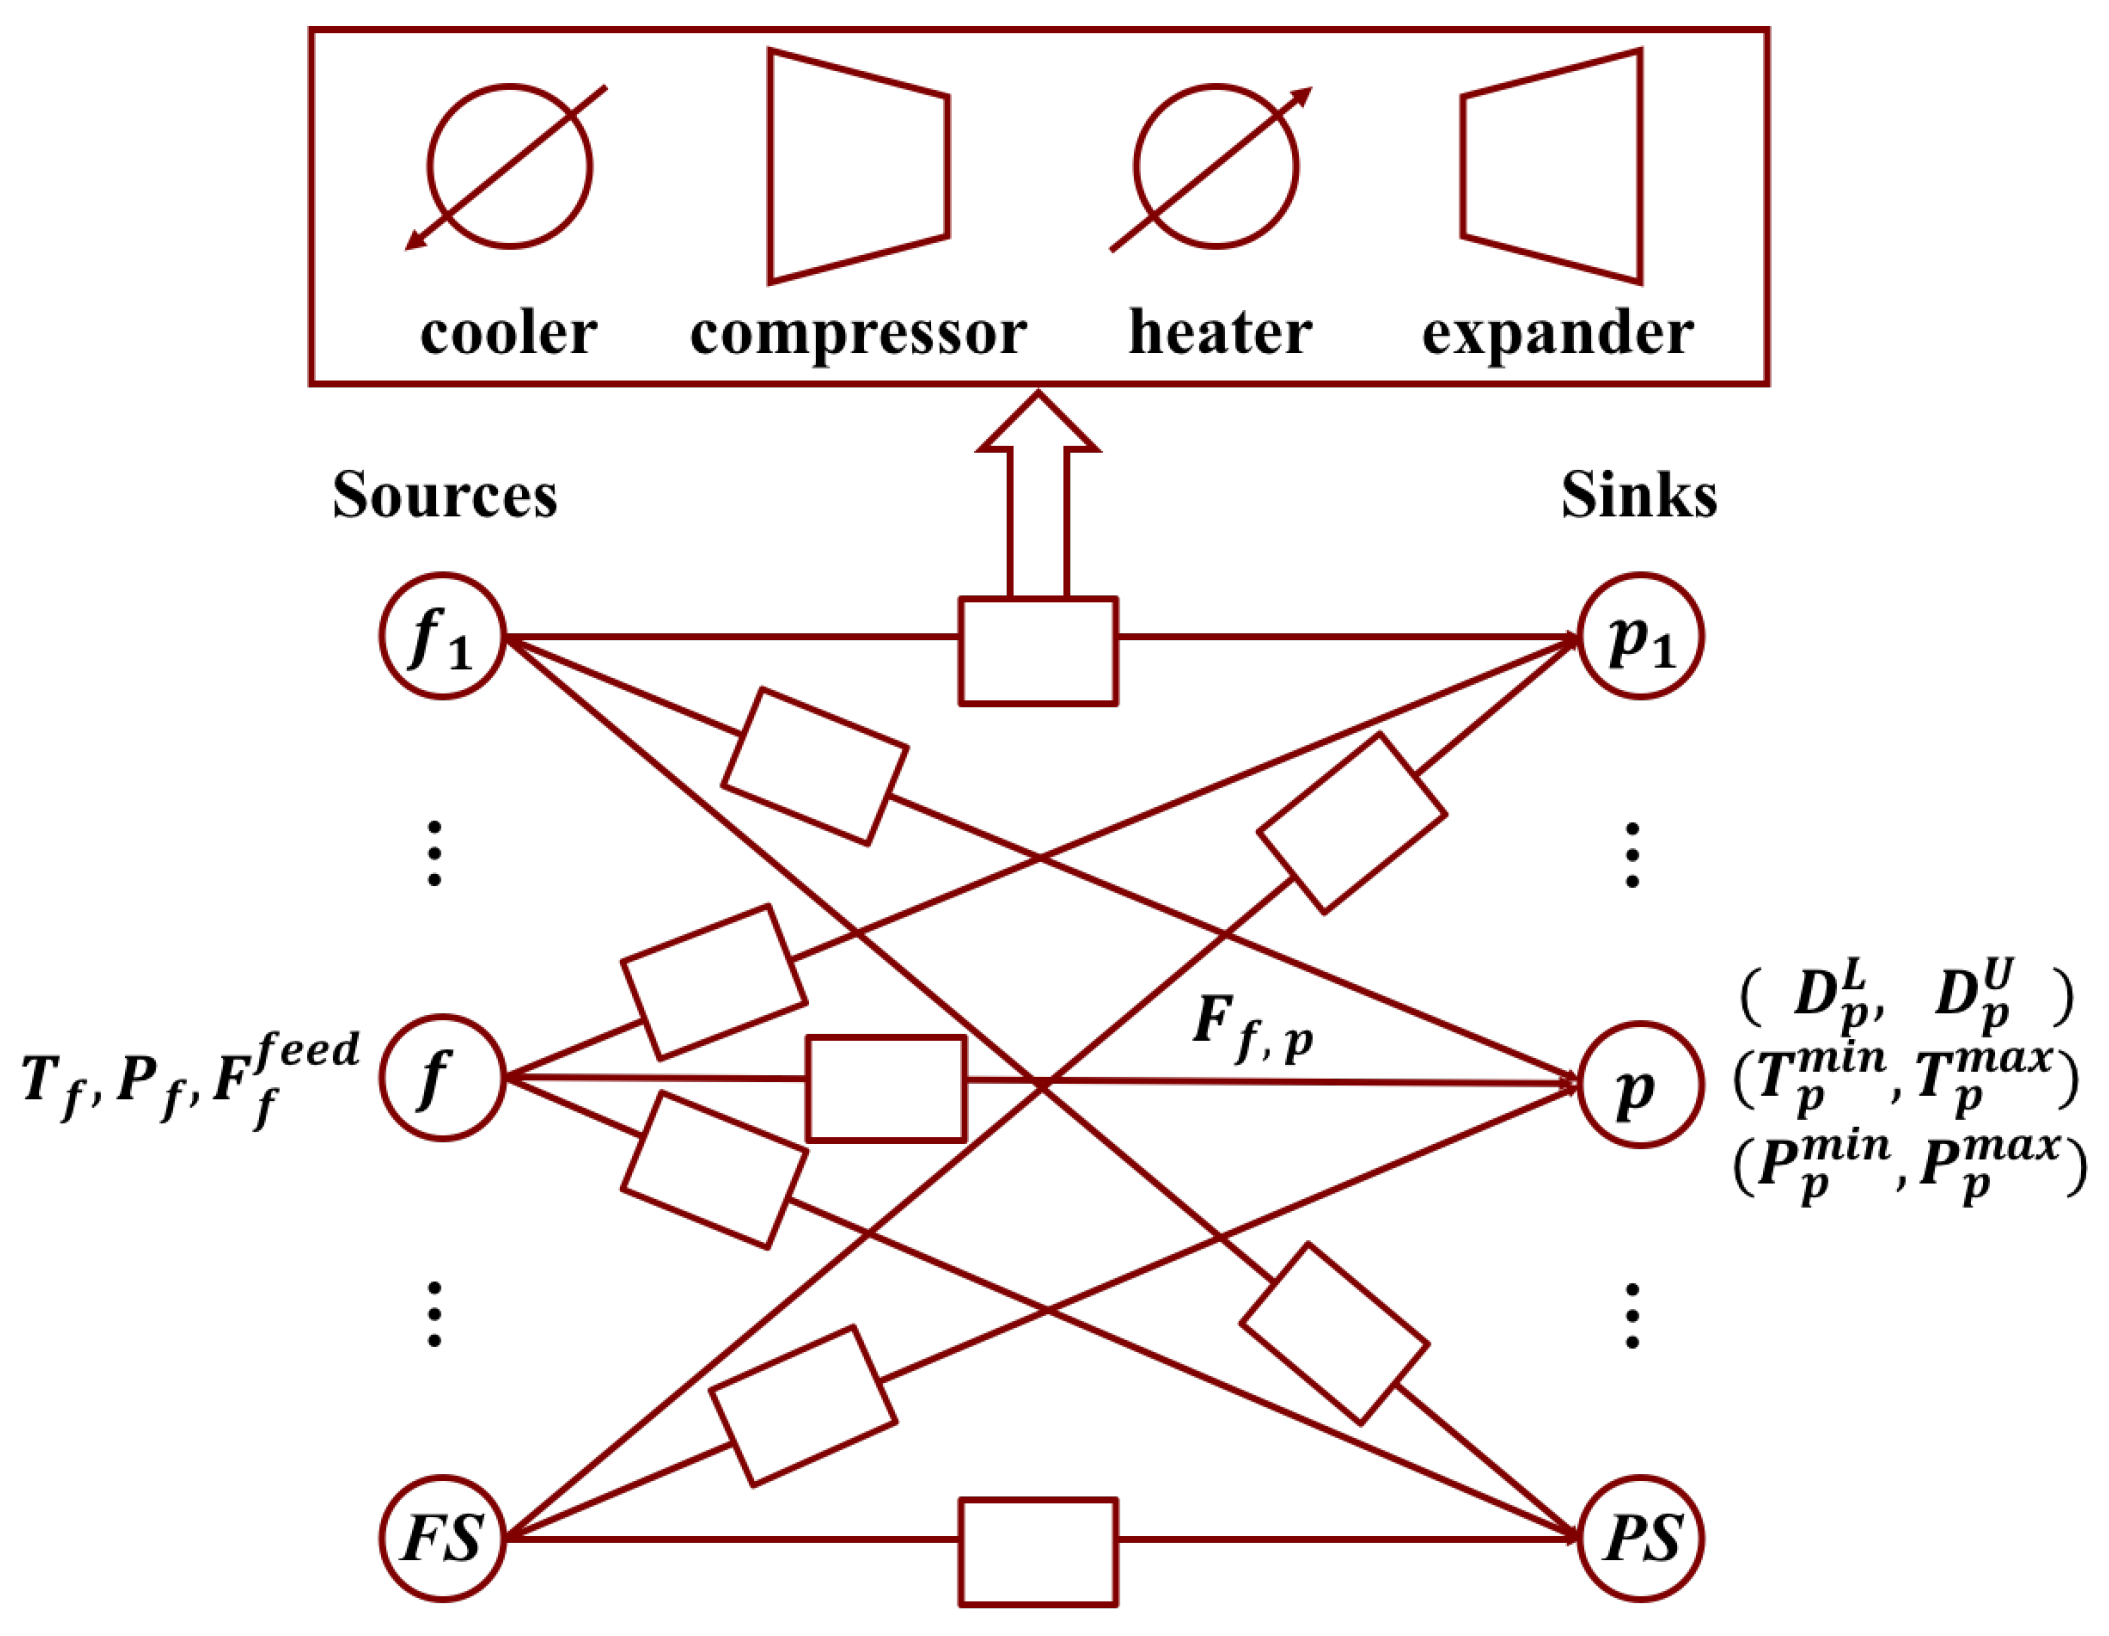
Optimization-based methods enable the user to address fuel gas network (FGN) synthesis problems, which are aimed at redistributing the fuel gas at the system level [1,4,17]. To this end, Hasan et al. formalized the FGN synthesis problem as a nonlinear programming problem (NLP) considering the integration of fuel gases appropriately though auxiliary equipment (valves, pipelines, compressors, heaters/coolers, etc.) to achieve best utilization of them [4]. They posed the FGN problem as a special class of pooling problem which leads a superstructure involving many practical features such as nonisobaric and nonisothermal operation, nonisothermal mixing, nonlinear fuel-quality specifications, and emission standards. Here the superstructure is defined as a superset of postulated process alternatives [18]. The proposed FGN superstructure in the work of Hasan et al. (shown in Figure 1) includes a set of fuel gas sources with temperature specification T f , pressure specification P f and feed availability specification F f f e e d for each source f, and a set of fuel gas sinks with demand range [ D p L , D p U ] , temperature range T p m i n , T p m a x , and pressure range P p m i n , P p m a x for each sink stream p. To achieve the sink requirements, the intermediate operations such as cooling, compression, heating and expansion are considered in addition to mixing and splitting. Jagannath et al. [17] extended this work to include the multi-period FGN operation. This FGN design makes dynamic plant operation more robust and helps to reduce capital costs. Nassim et al. [1,19] modified the FGN model introduced by Hasan et al. [4] to include more constraints on addressing environmental issues and developed a novel methodology for grass-root and retrofit design of FGNs.
The first step for many optimization-based methods is the construction of a superstructure. Hence the appropriate selection of superstructure representation method is critical. There are many representations such as state-task-network [20,21], state-equipment-network [21], P-graph [22,23], state-space [24,25] , HEN and MEN building blocks [26,27], phenomena building blocks [28,29,30], process-group contribution method [31], and unit-port-conditioning-stream (UPCS) approach [32,33]. We recently proposed a new superstructure representation method using building blocks for systematic process intensification [34,35,36]. The block superstructure has been constructed based on the dissection of various unit operations into fundamental building blocks. Later on, the proposed block-based approach is applied to address process synthesis problems [37].
In this work, we address the optimal synthesis of fuel gas networks using a block superstructure, originally proposed in our previous work for process synthesis and intensification [34,35,36,37]. Since the fuel gas network by its definition is a special class of pooling problem, our block representation method can be extended to general pooling problems as well. In this representation, each block allows multiple fuel gas inlet flows and single product outlet flow (unique composition for different product streams). The blocks with external feeds and external products serve as sources and sinks for fuel gas respectively. The material and energy flow among different blocks are achieved via jump flow streams connecting all nonadjacent blocks with each other and direct connecting streams connecting only adjacent blocks. The involvement of jump flows avoids the utilization of unnecessary intermediate blocks for inter-block connections. Each stream connecting two adjacent blocks are placed with compressors/expanders to adjust the pressure for achieving the sink requirements. Options for supplying extra hot/cold utility are provided to each block for allowing nonisothermal operation. When there is no direct connecting stream, the block boundary between adjacent blocks is regarded as completely restricted boundary. These blocks are collected in a two-dimensional grid to form a superstructure of blocks. We formulate the fuel gas synthesis problem as a mixed-integer nonlinear optimization (MINLP) problem. The model constraints involve mass and energy balance, flow directions, work calculation and logic constraints. The nonlinear terms of the proposed model arise from splitting, energy balances and work-related calculations.
The remaining of the article is structured as follows. First, we elaborate the representation of fuel gas network using block-based approach. Next, we present the MINLP formulation for fuel gas network synthesis problem. Finally, we demonstrate the applicability of our approach with one case study on FGN synthesis in an LNG plant.

2. Block-Based Representation of Fuel Gas Network

In this section, we describe how the classic fuel gas network superstructure such as the one proposed by Hasan et al. [4] can be represented using block-based approach [34,37] as a generic tool for designing fuel gas utilization system. First, we illustrate the classic FGN superstructure and analyze the operation involved in synthesizing a FGN. Next, we construct a block superstructure that can also include the same features. We provide block superstructures for fuel gas network with or without intermediate pools which bring additional mixing operations for more economic benefits.
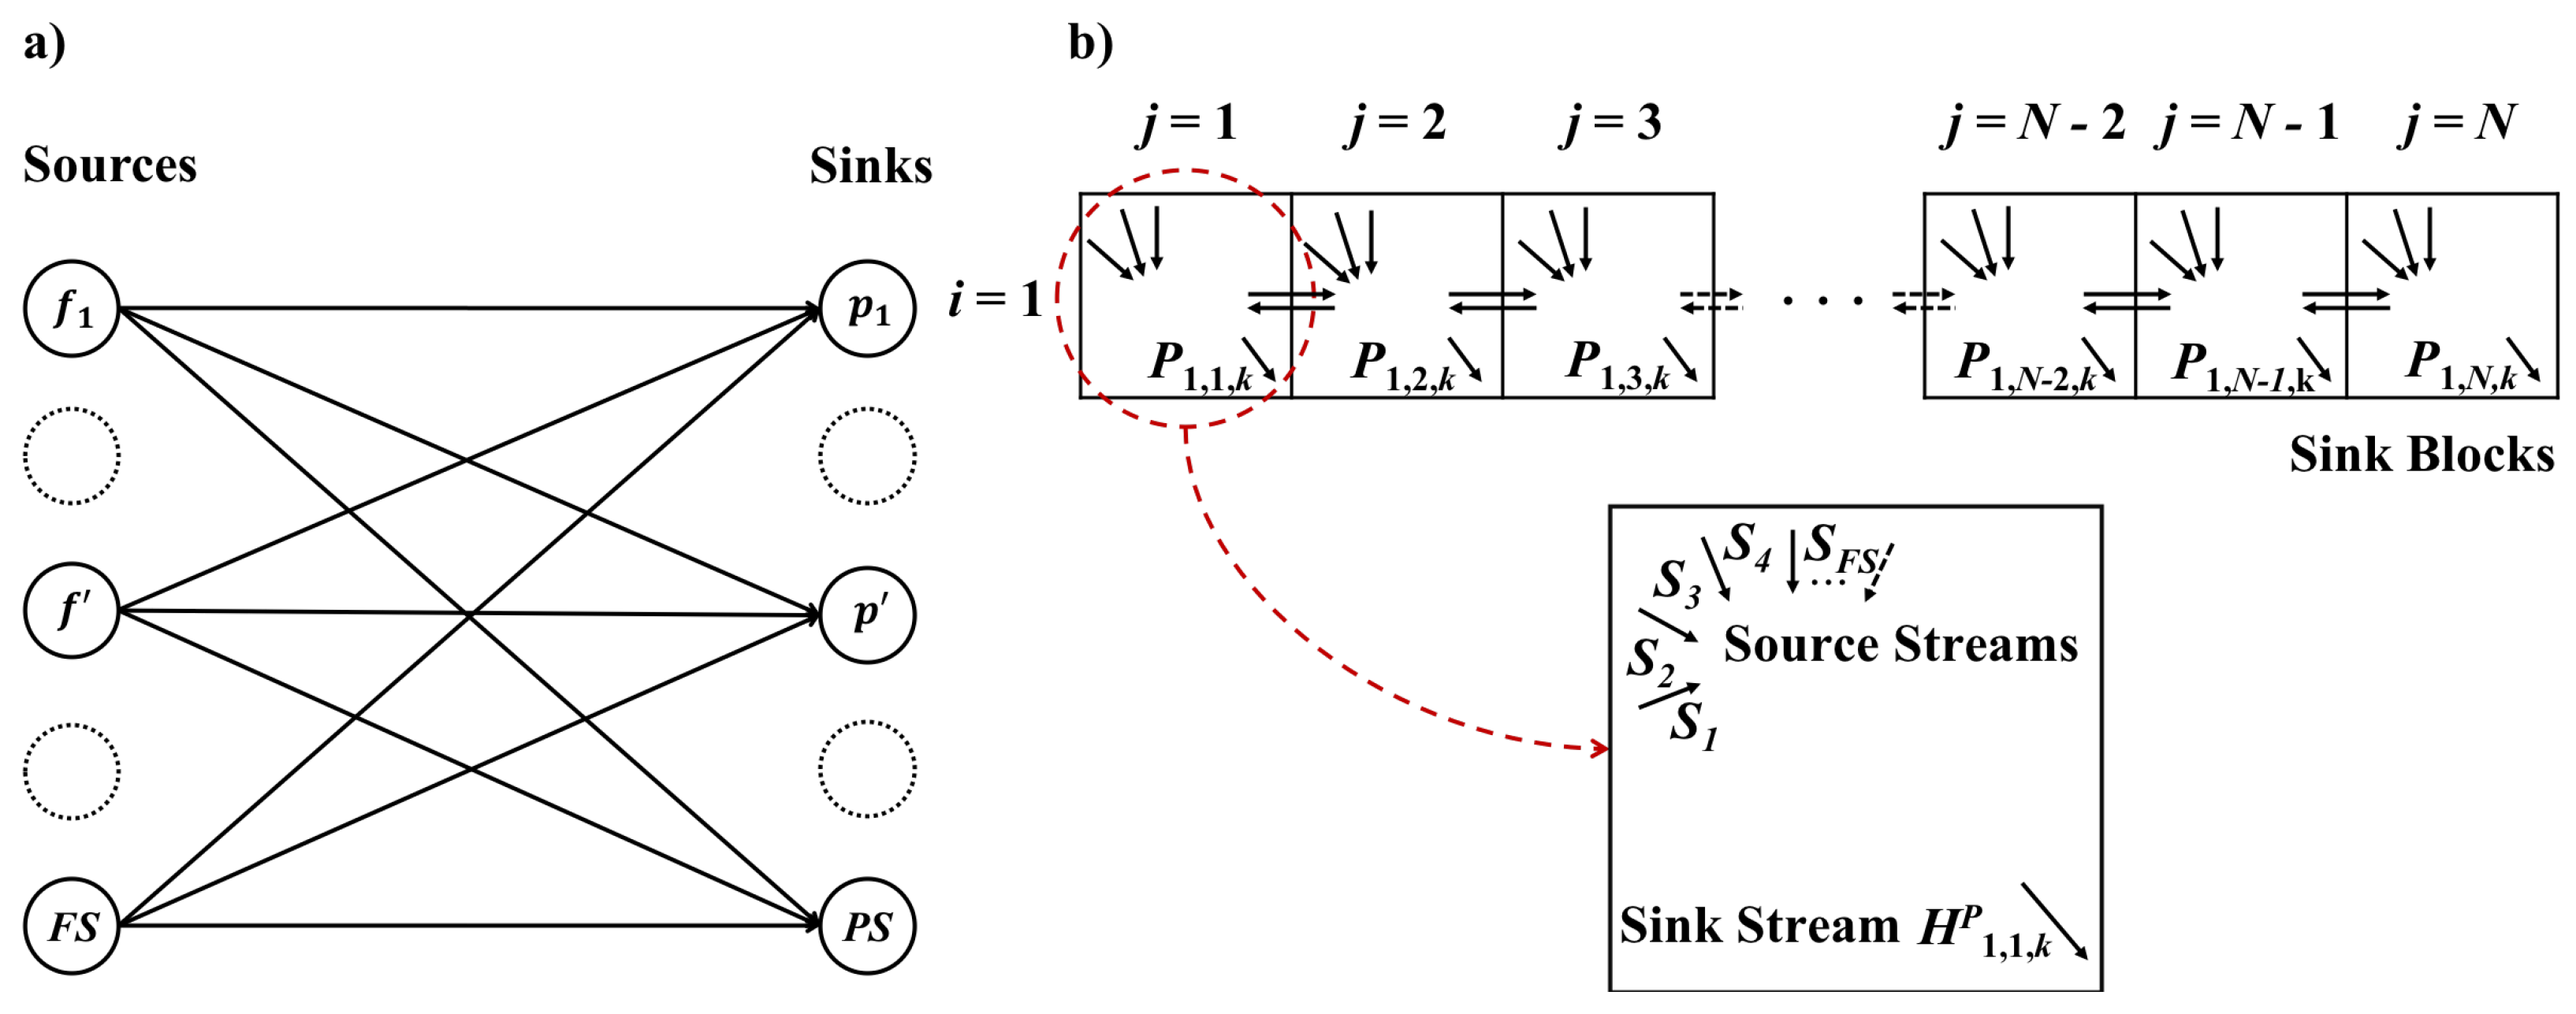
In a classic FGN superstructure (Hasan et al. [4]), shown in Figure 1, there are F S number of fuel gas sources and P S number of fuel gas sinks. The source stream f has the temperature as T f and the pressure as P f . The sink stream p is obtained with temperature range as T p m i n , T p m a x , pressure range as P p m i n , P p m a x and demand range as D p L , D p U . Each stream F f , p connecting a source f and a sink p passes through two utility exchangers (heater and/or cooler) and one mover (compressor or expander). The sources completely or partially come from different fuel gas sources and are mixed at different fuel gas sinks with different temperature, pressure and quality requirements. The operations in a FGN problem typically include mixing, cooling, heating, pressurizing and depressurizing.
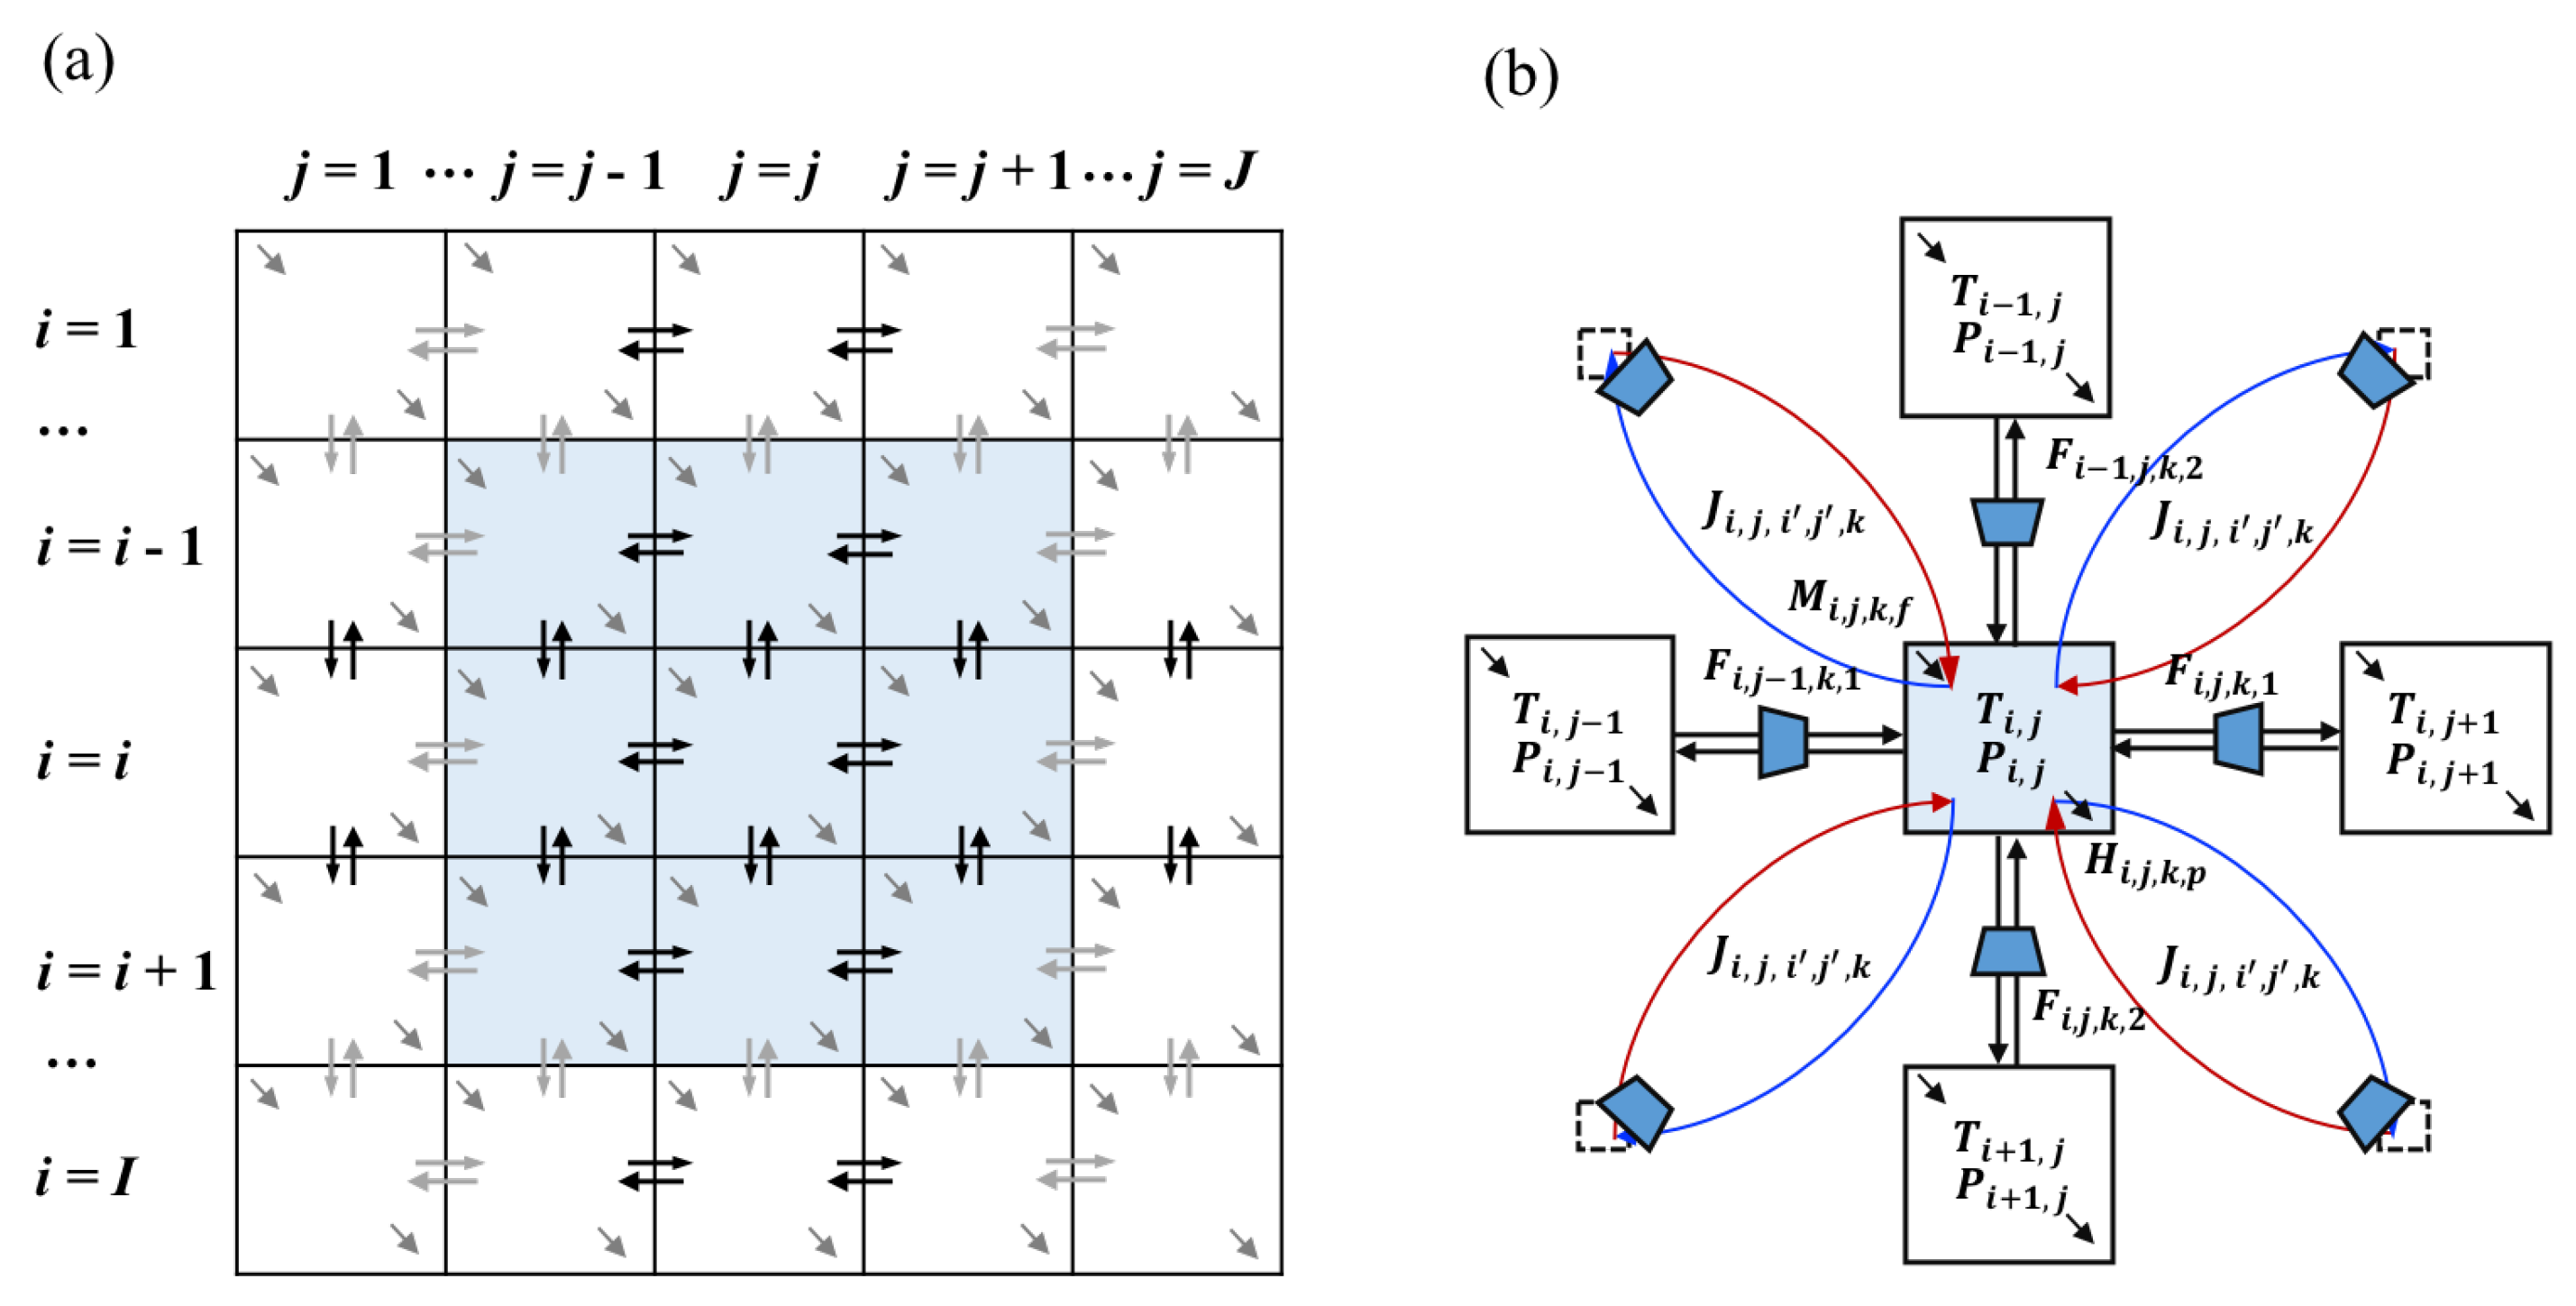
Most FGN synthesis problems involve multiple sources and multiple sinks. In addition, there are similar equipment assignment that are assigned between sources and sinks. This allows us to develop a general block representation for FGN synthesis as shown in Figure 2. It involves I number of rows and J number of columns, where each row or column is a collection of blocks. Let B i , j represent the block at row i and column j. Each block allows multiple external feed streams M i , j , k , f to enter block B i , j . The available amount of feed f can be partially or completely fed into a block B i , j with z i , j , f f e e d f r a c fraction of available amount F f f e e d . Similarly, product stream p can be withdrawn from each block with the component flowrate of H i , j , k , p .
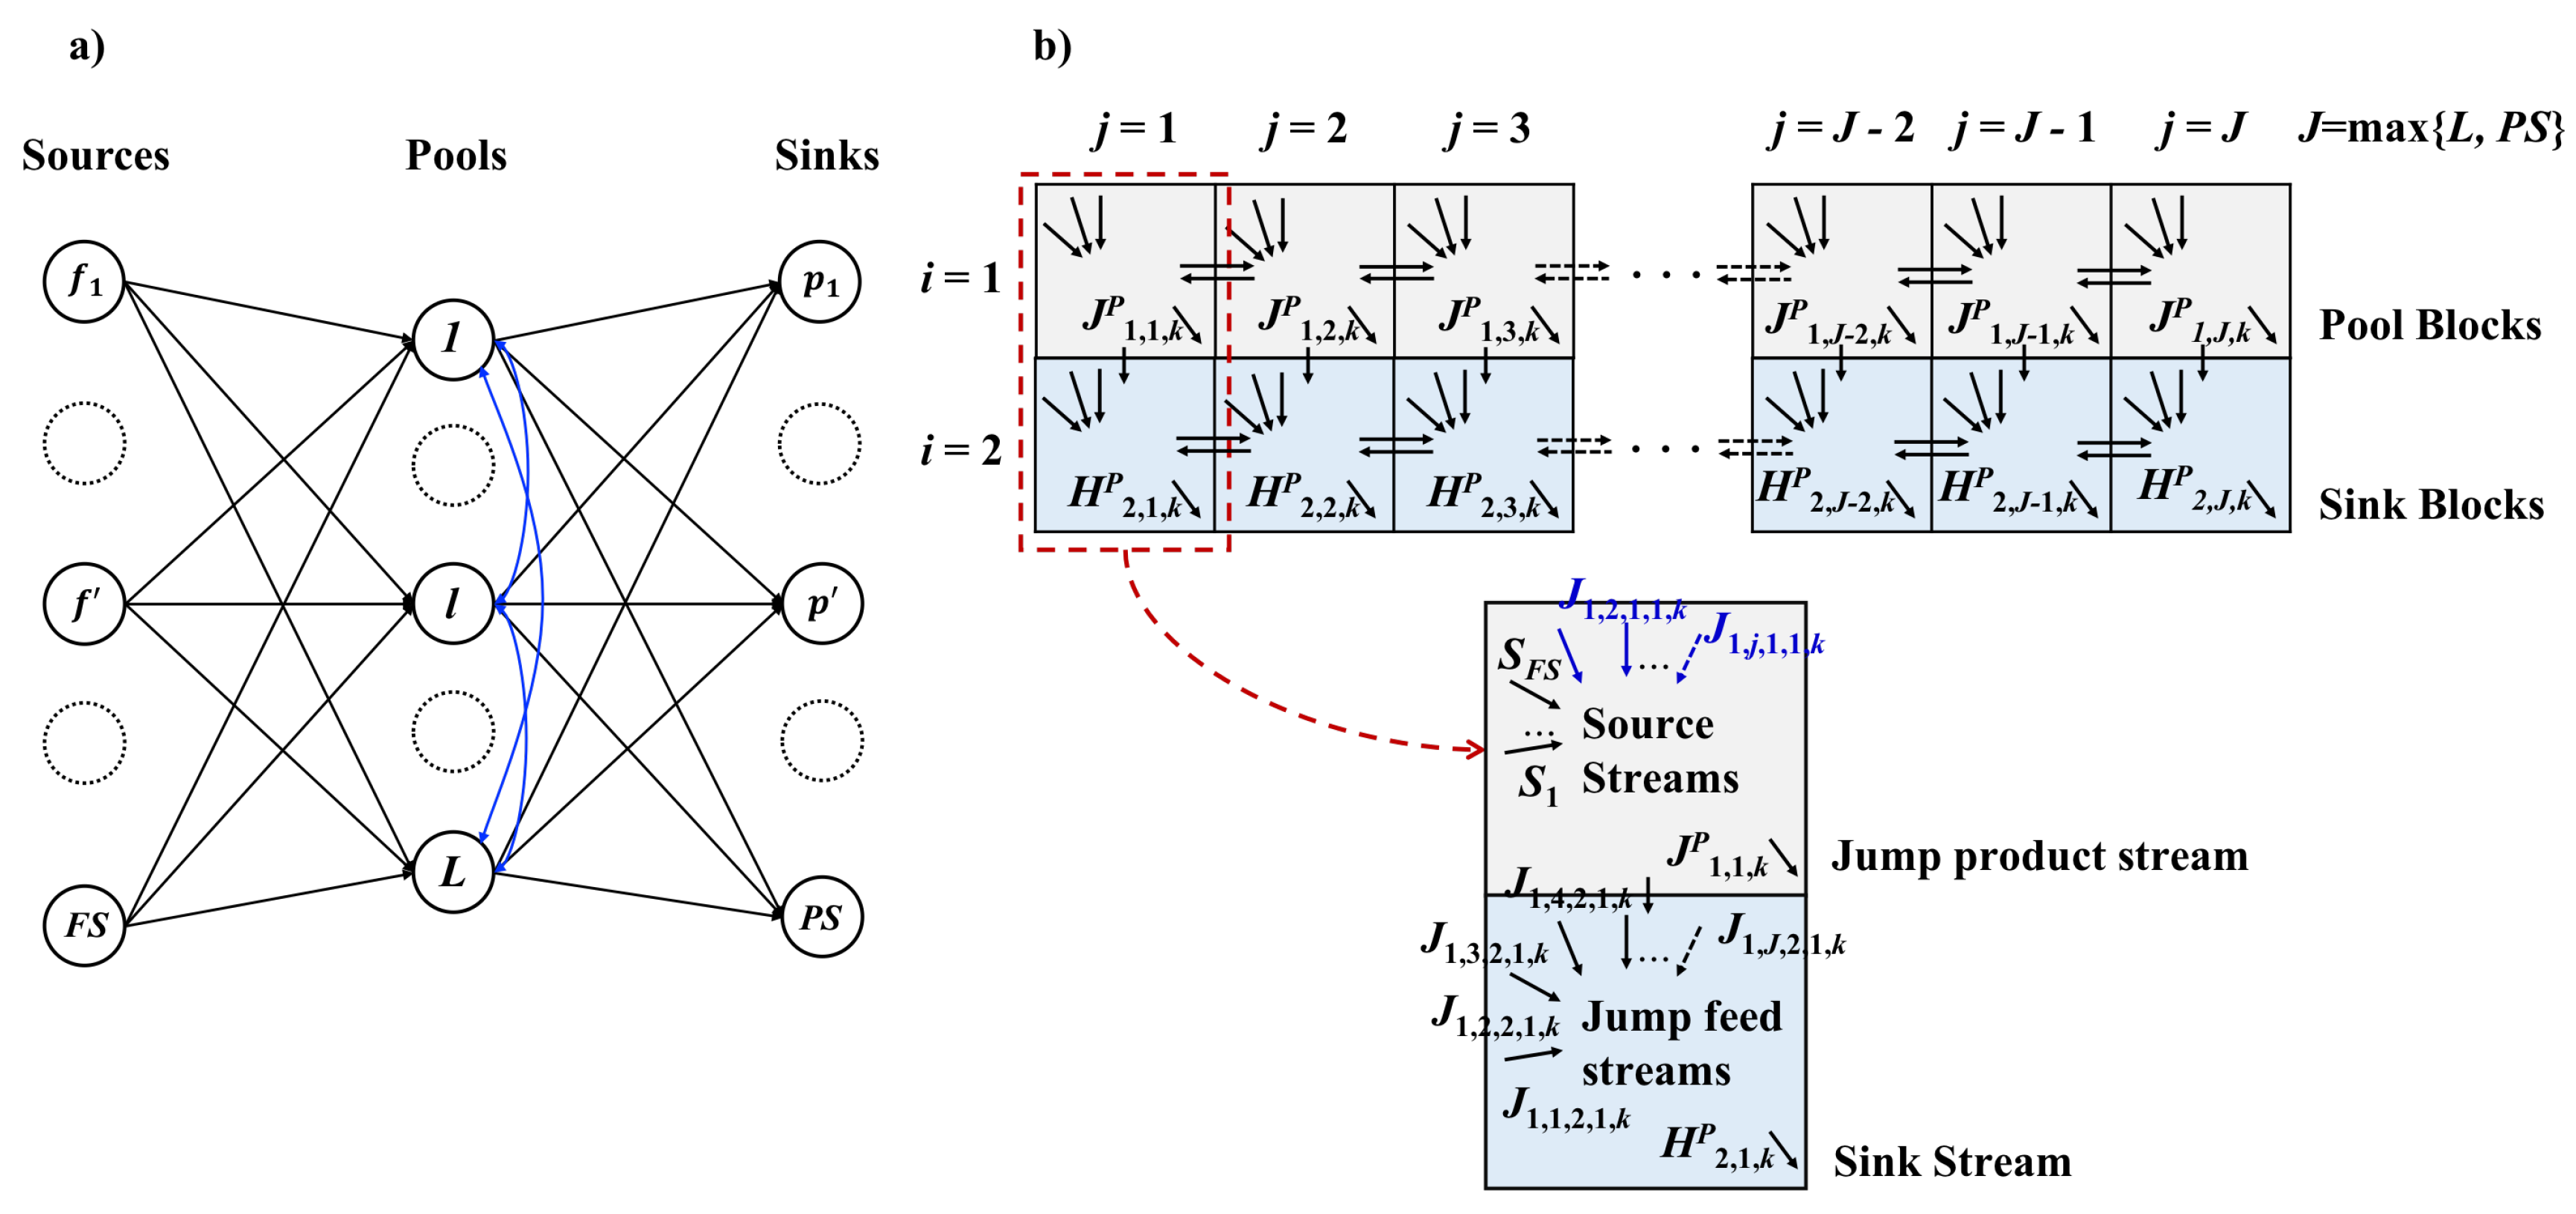
As shown in Figure 2b, the mass and energy transfer within the block superstructure is achieved through the direct connecting streams between adjacent blocks and jump connecting streams among all nonadjacent blocks. Direct connecting streams are achieved via inter-block flow F i , j , k , d , which is the flowrate of component k between block B i , j and B i , j + 1 when the flow alignment d = 1 (the connecting flow between adjacent blocks is in horizontal direction) or the flowrate of component k between block B i , j and B i + 1 , j when the flow alignment d = 2 (the connecting flow between adjacent blocks is in vertical direction) . These direct connecting streams can be either positive when the flow is from block B i , j to B i , j + 1 for d = 1 (from block B i , j to B i + 1 , j for d = 2 ) or negative when the flow is from block B i , j + 1 to B i , j for d = 1 (from block B i + 1 , j to B i , j for d = 2 ). Also, these direct connecting stream flow across the block boundary between adjacent blocks. When there is no direct connecting stream ( F i , j , k , d = 0 ), the block boundary between B i , j and B i , j + 1 (d = 1) or between B i , j and B i + 1 , j (d = 2) is identified as completely restricted boundary. The jump connecting streams are depicted by J i , j , i , j , k , which is the flowrate of component k from block B i , j to B i , j , where i and j designate the row number and column number of a different block. Because of this unidirectional feature, J i , j , i , j , k is a jump flow withdrawn from B i , j and supplied to B i , j .
With these direct and jump connecting streams, blocks with multiple inlets and multiple outlets can serve as stream mixers and splitters, respectively. Source block is identified when multiple external feed streams enter into a block and get mixed, while blocks with external product stream are sinks. Note that splitting of the source streams is not regarded as a splitting operation because it can be achieved through the splitting fraction z i , j , f f e e d f r a c of source stream f into block B i , j and thus can be regarded as supplies of multiple source streams with the same specification.
The operation equipment (heaters/coolers, compressors/expanders) is embedded in the block superstructure through auxiliary units. To represent the pressurizing/depressurizing operation, both direct connecting streams and jump connecting streams are assigned with compressor or expander (only one of them would be selected). Each stream leaving block B i , j has a pressure designated as P i , j , which is also the inlet pressure for the compressors or expanders on these streams. The inlet temperature for these compressors/expanders arranged at outlet streams ( F i , j , k , d and J i , j , i , j , k ) of B i , j is the block temperature T i , j , which is also the common temperature of outlet streams from B i , j . The heating and cooling operations are achieved through the heat duty Q i , j h and cold duty Q i , j c , which are obtained from the energy balance around block B i , j .
The general block superstructure for FGN synthesis problem developed in Figure 2 can be reduced to block superstructure with smaller size if the number of intermediate pools is known beforehand. As an illustrative example, we first consider the case without intermediate pools. Knowing certain number of sources and sinks together with their specification and requirement, the classic superstructure is built by connecting each source and sink and shown in Figure 3a. Here all stream heaters/coolers and expanders/compressors are ignored for representation simplicity. As is shown in Figure 3b, we use a 1×N block superstructure to incorporate the classic superstructure. In this case, the column number is directly equal to number of sinks ( J = P S ). Since there are no intermediate pools, row number I = 1 . Each block serves as sink block, from which product streams are withdrawn. Meanwhile, each block could also function as feed block, where multiple types of source streams are fed. Specifically, taking the first sink block B 1 , 1 as an example, there could be at most F S number of source streams entering this block. The activation of connectivity between sources and sinks could be reflected by the feed fraction z i , j , f f e e d f r a c of different sources f. If the feed fraction z i , j , f f e e d f r a c of source stream at the sink block B i , j is zero, then there is no connectivity between the source f and the sink p in block B i , j ; source-sink connectivity exists as long as the feed fraction of source stream z i , j , f f e e d f r a c is nonzero. Besides, the horizontal connecting streams between adjacent blocks in Figure 3b are also allowed. This additional feature physically indicates the material flowing between two fuel gas sinks.
As for the more general case of the fuel gas network superstructure, between the sources and sinks layer, there can be another layer consisting of L number of intermediate pools, as is shown in Figure 4. Source streams first come into the intermediate pools, where certain operations such as mixing, purifying are executed according to different sink requirements. The outlet streams coming from the intermediate pools are further directed to the sinks or to the other different pools (shown as the blue line in Figure 4a). One way to incorporate the general superstructure is to utilize a block superstructure with larger size so that pools (involving mixing and splitting operations) can be included into the system. With this new feature of intermediate pools, the updated block superstructure is shown in Figure 4b. The first row consists of L number of pool blocks (grey blocks) and the second row consists of P S number of sink blocks (blue blocks). In this case, the number of columns can be taken as J = m a x { L , P S } . The existence of intermediate pools make the row number as I = 2 , one row to accommodate pools and another row for sinks. The distribution of source streams into each pool blocks is achieved through splitting operation of source streams. In the first row, the jump flows are withdrawn from each block as outlet streams of intermediate pools. Specifically, taking the first column of block superstructure in Figure 4b as an example, the jump flow J 1 , 1 , k P (the summation of all the jump connecting streams to other blocks from block B 1 , 1 ) is withdrawn and directed to other blocks as inlet flows. The inlet jump flows, J 1 , j , 2 , 1 , k , from nonadjacent blocks B 1 , j ( j [ 2 , J ] ) are mixed in the second row at sink block B 2 , 1 and then taken as the final product H 2 , 1 , k p (the overall component flowrate for all product stream p).
As is discussed above, the block superstructure can be converted from the classic superstructure of fuel gas network. When there is no prior information provided on flow connectivity among sources, pools and sinks, the block superstructure can be constructed by simply setting the row number I and column number J (i.e., J = m a x {L, P S }), which then involves as many process alternatives as possible. The benefit for block representation method is on its generic feature that each block follows the same pattern with multiple inlet streams and outlet streams. Based on the representation method, we now develop the MINLP formulation for the FGN synthesis problem.

3. FGN Synthesis Problem Statement

This section gives the formal problem description for FGN synthesis problem using block superstructure. The sets given for this problem are the set K = { k | k = 1 , , | K | } of components, the set F S = { f | f = 1 , , | F S | } of fuel gas sources with component specification y k , f f e e d , a set P S = { p | p = 1 , , | P S | } of fuel gas sinks with the material demand range as [ D p L , D p U ], energy demand range as [ D e p L , D e p U ], purity range as [ y k , p m i n , p r o d , y k , p m a x , p r o d ] for species k as well as ranges for other specifications [ q s , p m i n , p r o d , q s , p m a x , p r o d ]. The objective is to synthesize a fuel gas network that systematically utilizes the arrangement of fuel gas resources and minimizes the total annual cost. The set D = { d | d = 1 , 2 } designates the flow alignment. The flow alignment d = 1 when the stream is flowing in the horizontal direction, i.e., from block B i , j to B i , j + 1 ; d = 2 when the stream is flowing in the vertical direction, i.e., from block B i , j to B i + 1 , j . The temperature range and flowrate range for all connecting flows including direct connecting flow and jump connecting flow are set as [ T m i n , T m a x ] and [ F L , F U ] respectively.
We consider the assumptions for this work as constant properties (heat capacity, lower heating value, etc.), continuous steady-state operation, ideal gas condition, adiabatic expansion/compression, and ideal mixing. With this, we now describe the MINLP model for fuel gas network synthesis based on block superstructure.

4. MINLP Model Formulation for Block-Based Fuel Gas Network Synthesis

The main constraints for the MINLP model involve block material balance, flow directions, block energy balance, work calculation and task assignment/logic constraints. The objective of the FGN synthesis is to minimize the total annual cost.

4.1. Block Material Balance

The general material balance for each block B i , j considers the material flows of component k including horizontal inlet flow F i , j 1 , k , 1 , the horizontal outlet flow F i , j , k , 1 , vertical inlet flow F i 1 , j , k , 2 , vertical outlet flow F i , j , k , 2 , external feed stream M i , j , k f , external product stream H i , j , k p , jump flow into the block J i , j , k f , and jump flow from the block J i , j , k p . Specifically, the material balance relation is presented as follows.
F i , j 1 , k , 1 F i , j , k , 1 + F i 1 , j , k , 2 F i , j , k , 2 + M i , j , k f H i , j , k p + J i , j , k f J i , j , k p = 0 , i I , j J , k K
The last four terms in the above relation are obtained though the following constraints.
M i , j , k f = f F S M i , j , k , f i I , j J , k K
H i , j , k p = p P S H i , j , k , p i I , j J , k K
J i , j , k f = ( i , j ) L N J i , j , i , j , k i I , j J , k K
J i , j , k p = ( i , j ) L N J i , j , i , j , k i I , j J , k K
All variables including M i , j , k f , H i , j , k p , J i , j , k f and J i , j , k p are obtained by summing multiple inlet streams or outlet streams within single block B i , j . The positive continuous variable M i , j , k , f indicates the amount of component flowrate k into block B i , j carried by feed stream f. The amount of component k taken from block B i , j through product stream p is designated by positive continuous variable H i , j , k , p . The material flowrate for component k from block B i , j to B i , j is J i , j , i , j , k . The index i and j indicate row position and column position of a block B i , j that is different from B i , j . The subset L N ( i , j , i , j ) designates the connection between block B i , j and block B i , j . It should be noted that for jump connecting flow J i , j , i , j , k , i i and j j so as to avoid remixing in block B i , j . The stream connectivities at the outer boundary of block superstructure are set as F i = I , j , k , 1 = F i , j = J , k , 2 = 0 to ensure that the interaction between the superstructure and the environment is only achieved through external feeds and products.
The flowrate M i , j , k , f for each feed f into block B i , j is completely or partially from the overall available amount F f f e e d . The distribution of feed stream f is achieved by the feed fraction z i , j , f f e e d f r a c 0 in block B i , j . Hence M i , j , k , f can be determined as follows:
M i , j , k , f = F f f e e d y k , f f e e d z i , j , f f e e d f r a c , i I , j J , k K , f F S
0 i I j J z i , j , f f e e d f r a c 1 , f F S
Typically, headers receiving fuel gas have purity requirement for inlet streams to ensure the required operating conditions of the corresponding equipment. This is achieved through the following inequality constraints:
y k , p m i n , p r o d k K H i , j , k , p H i , j , k , p y k , p m a x , p r o d k K H i , j , k , p , i I , j J , ( k , p ) k p
Here, the purity range for component k in product stream p is given by y k , p m i n , p r o d , y k , p m a x , p r o d . The set k p relates the key component k with product stream p with purity specifications. The product stream p have no purity restrictions when it does not appear in set k p .
On top of purity requirement of key component k in product stream p, possible requirement on ratio of different component k in product stream p is also considered.
P i , j , k = k , p k K π k , k , p p r o d P i , j , k , p i I , j J , p P s
where π k , k , p p r o d is the minimum product ratio requirement between component k and component k for product p.
We also impose the demand constraint for product p supplied to different headers:
D p L i I j J k K H i , j , k , p D p U , p P S
Here, D p L and D p U are minimum and maximum allowed amount for product stream p respectively. Hence if there is no specification existing for D p L , D p U or both, we set D p L = 0 and D p U = max f F S F f f e e d .
Besides, energy demands D e p for each product stream p should be satisfied based on the following constraint:
i I j J k K H i , j , k , p L H V k D e p , p P S
where L H V k refers to lower heating value for each component k, which measures energy content per unit mass or volume of pure combustible component.
Furthermore, each product stream should have acceptable limits on other certain specifications including lower heating value ( L H V ), reverse specific gravity ( 1 / S G ), etc. Assuming that all the considered specifications are linearly related with mixture compositions, the following constraint is supplied below for each product stream p [4].
q s , p m i n , p r o d i I j J k K H i , j , k , p i I j J k K H i , j , k , p q s , k q s , p m a x , p r o d i I j J k K H i , j , k , p , p P S
Here the parameter q s , k denote the value of specification s for component k, and q s , p m i n , p r o d , q s , p m a x , p r o d is the acceptable range of specification s for product stream p. Note that the quality specification q s , k is component flowrate-based instead of total flowrate-based, which is considered in the work of Hasan et al. [4].
To obtain the total flowrate for all streams associated with the block B i , j , we sum all components in each stream. Specifically, we obtain the total flowrate F P i , j , d T , F N i , j , d T , J i , j , i , j T , M i , j , f T , and H i , j , p T from the component flowrate for F P i , j , k , d , F N i , j , k , d , J i , j , i , j , k , M i , j , k , f , and H i , j , k , p through the following relations.
F P i , j , d T = k K F P i , j , k , d , i I , j J , d D
F N i , j , d T = k K F N i , j , k , d , i I , j J , d D
J i , j , i , j T = k K J i , j , i , j , k , ( i , j , i , j ) L N ( i , j , i , j )
M i , j , f T = k K M i , j , k , f , i I , j J , f F S
H i , j , p T = k K H i , j , k , p , i I , j J , s P S
With the total flowrate information, we model the splitting operation for achieving identical composition for all outlet streams as follows:
F P i , j , k , d = y i , j , k b F P i , j , d T i I , j J , d D
F N i , j 1 , k , 1 = y i , j , k b F N i , j 1 , 1 T i I , j J
F N i 1 , j , k , 2 = y i , j , k b F N i 1 , j , 2 T i I , j J
J i , j , i , j , k = y i , j , k b J i , j , i , j T ( i , j , i , j ) L N ( i , j , i , j ) , k K
H i , j , k , p = y i , j , k b H i , j , p T i I , j J , k K , s P S
Here the positive continuous variable y i , j , k b refers to the block composition of component k. This block composition refers to the composition of component k in all the outlet streams from block B i , j .

4.2. Flow Directions

The direct connectivity F i , j , k , d among adjacent blocks is a bidirectional flow with its positive component F P i , j , k , d and negative component F N i , j , k , d . Only one of them is active when the connecting flow F i , j , k , d is chosen to be nonzero. The selection of flow direction is a decision variable, which is achieved through the following binary variable:
z i , j , d P l u s = 1 if F i , j , k , d is from block B i , j to B i , j + 1 ( d = 1 ) or from block B i , j to B i + 1 , j ( d = 2 ) 0 otherwise
As a result, the flow direction determination is achieved though the following constraints:
F i , j , k , d = F P i , j , k , d F N i , j , k , d i I , j J , k K , d D
F P i , j , k , d F U z i , j , d P l u s , i I , j J , k K , d D
F N i , j , k , d F U ( 1 z i , j , d P l u s ) , i I , j J , k K , d D

4.3. Block Energy Balance

The enthalpy terms for block energy balance includes inlet and outlet inter-block stream enthalpy, feed enthalpy, product enthalpy, external heating/cooling, work energy associated with expansion/compression. Then the steady-state energy balance for block B i , j is formulated as follows:
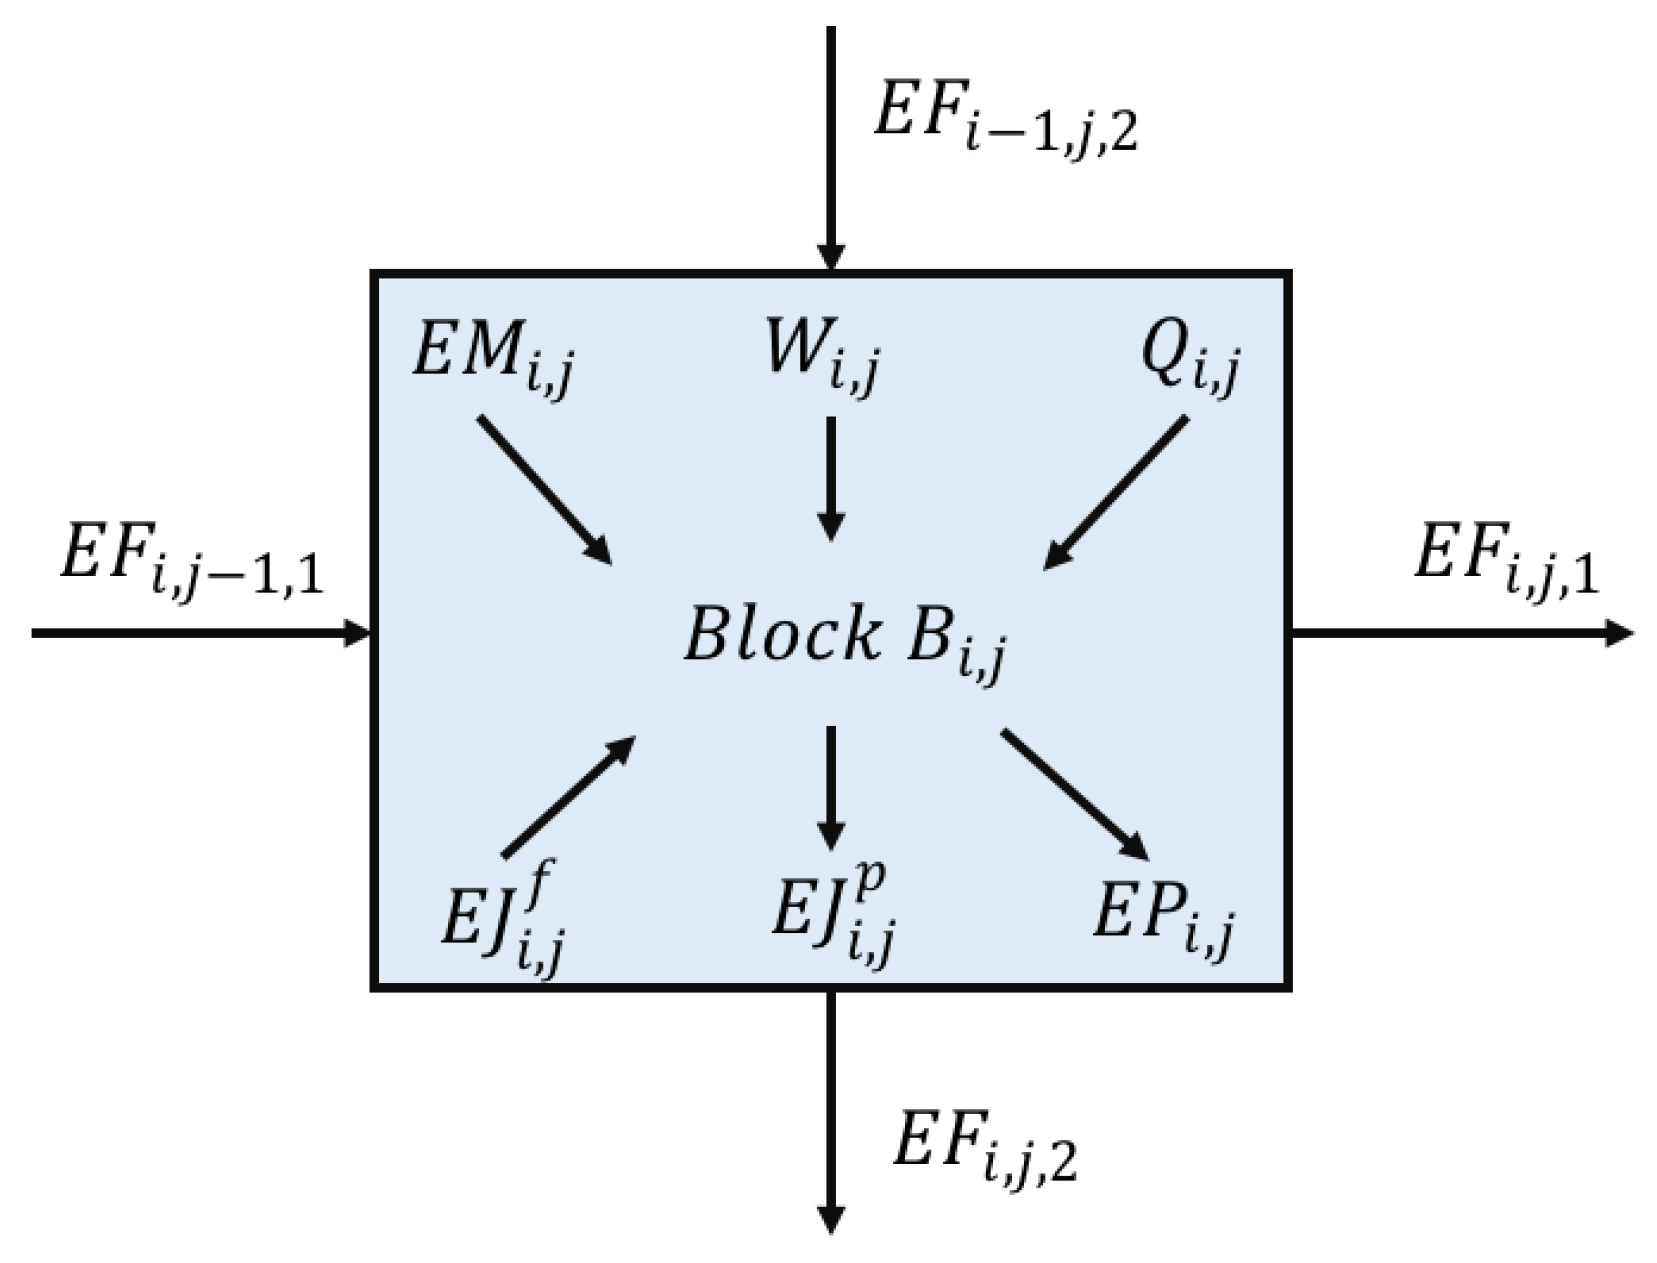
E F i , j 1 , 1 E F i , j , 1 + E F i 1 , j , 2 E F i , j , 2 + E M i , j E P i , j + E J i , j f E J i , j p + Q i , j + W i , j = 0 , i I , j J
where, E F i , j , d represents the stream enthalpy carried by the material flow F i , j , k , d in flow direction d, E M i , j is the overall enthalpy brought into block B i , j along with external feed streams , E P i , j is overall enthalpy taken away by external product streams, E J i , j f is overall enthalpy carried into block B i , j through jump flows, E J i , j p is overall enthalpy taken out from block B i , j through jump flows, Q i , j represents amount of heat added into or removed from the block B i , j , W i , j indicates the amount of work energy added into or withdrawn from block B i , j . These energy flow variables are shown in Figure 5.
The stream enthalpy is determined as follows with the information provided on flowrate, component heat capacities and the block temperature. Depending on the flow direction, in flow alignment d = 1 , the inlet temperature for block B i , j is either T i , j from block B i , j to B i , j + 1 or T i , j + 1 from block B i , j + 1 to B i , j ; in flow alignment d = 2 , the inlet temperature for block B i , j is either T i , j from block B i , j to B i + 1 , j or T i + 1 , j from block B i + 1 , j to B i , j .
E F i , j , 1 = k K F P i , j , k , 1 C p k T i , j k K F N i , j , k , 1 C p k T i , j + 1
E F i , j , 2 = k K F P i , j , k , 2 C p k T i , j k K F N i , j , k , 2 C p k T i + 1 , j
where C p k is the heat capacity of component k.
The enthalpy amount brought into or withdrawn from block B i , j through jump flows are determined as follows:
E J i , j f = k K ( i , j ) L N J i , j , i , j , k C p k T i , j i I , j J
E J i , j p = k K ( i , j ) L N J i , j , i , j , k C p k T i , j i I , j J
It should be noted that the inlet temperature of jump flow is always the temperature of the source block, T i , j . Likewise, the feed enthalpy and product enthalpy are determined with the following constraints:
E M i , j = k K f F M i , j , k , f C p k T f i I , j J
E P i , j = k K p P P i , j , k , p C p k T i , j i I , j J
The amount of hot/cold utility consumed in block B i , j can be evaluated through the amount of heat introduced into ( Q i , j h ) or withdrawn from ( Q i , j c ) block B i , j .
Q i , j = Q i , j h Q i , j c
The work energy can be also determined by the amount of work added into or taken out of block B i , j , which are denoted as W i , j c o m for compression and W i , j e x p for expansion respectively. The calculation of W i , j c o m and W i , j e x p is explained later in this Section 4.6.
W i , j = W i , j c o m W i , j e x p
Finally, to prevent condensation in the FGN and ensure sufficient superheating, the following constraints are supplied for product stream p in block B i , j [4].
k K H i , j , k , p C p k T i , j ( M D P p + 5 9 ( 5.15 P i , j 100 312 ) k K H i , j , k , p C p k i I , j J , p P S
k K H i , j , k , p C p k T i , j ( H D P p + 5 9 ( 2.33 ( P i , j 100 ) 2 2.8 P i , j 100 305 ) k K H i , j , k , p C p k i I , j J , p P S
where parameter M D P p is moisture dew-point temperature and parameter H D P p is the hydrocarbon dew-point temperature for the product p.

4.4. Product Stream Assignments and Logical Constraints

We define binary variables for each product stream p at block B i , j to determine whether they are active in B i , j or not:
z i , j , p p r o d u c t = 1 if product stream p is withdrawn from block B i , j 0 otherwise
The identification of block as product block is achieved through the following logical relation, which involves product binary variable:
k K P i , j , k , p D p U z i , j , p p r o d u c t i I , j J , p P S
For each block, there are at most one type of product stream present in block B i , j . The logic proposition is illustrated as follows:
p P S z i , j , p p r o d u c t 1 i I , j J
Each product stream p appears in the block superstructure for at least once so as to ensure the supply of fuel gas header.
i I j J z i , j , p p r o d u c t 1 p P S
The temperature range for block with product stream p is from T p m i n to T p m a x .
T p m i n z i , j , p p r o d u c t + T m i n ( 1 z i , j , p p r o d u c t ) T i , j T p m a x z i , j , p p r o d u c t + T m a x ( 1 z i , j , p p r o d u c t ) i I , j J , p P S
Likewise, the pressure range for product block is [ P p m i n to P p m a x ] .
P p m i n z i , j , p p r o d u c t + P m i n ( 1 z i , j , p p r o d u c t ) T i , j P p m a x z i , j , p p r o d u c t + P m a x ( 1 z i , j , p p r o d u c t ) i I , j J , p P S

4.5. Boundary Assignment

The boundary type between adjacent blocks can be either completely restricted or not. If there is no direct connecting stream between adjacent blocks, then the inter-block boundary is identified as completely restricted boundary. The decision of boundary type is achieved through the following binary variable z i , j , d c r .
z i , j , d c r = 1 If boundary between B i , j and B i , j + 1 for d = 1 ( between B i , j and B i + 1 , j for d = 2 ) is completetly restricted 0 Otherwise
According to the definition of completely restricted boundary, the following constraints are supplied to relate flowrate F i , j , k , d with boundary type.
F i , j , k , d F U ( 1 z i , j , d c r ) , i I , j J , d D

4.6. Work Calculation

The work term W i , j consists of compression work term W i , j c o m and expansion work term W i , j e x p . Both W i , j c o m and W i , j e x p consist of work components for direct connecting streams ( W i , j , d c o m p , F P and W i , j , d e x p , F P for compression and expansion work of positive component, W i , j , d c o m p , F N and W i , j , d e x p , F N for compression and expansion work of negative component), feed streams ( W i , j , f c o m p , F S and W i , j , f e x p , F S for compression and expansion work respectively), and jump connecting streams ( W i , j , i , j c o m p , J F and W i , j , i , j e x p , J F for compression and expansion work respectively). Accordingly,
W i , j c o m = d D ( W i , j , d c o m p , F P + W i , j , d c o m p , F N ) + f F S W i , j , f c o m p , F S + ( i , j ) L N ( i , j , i , j ) W i , j , i , j c o m p , J F , i I , j J
W i , j e x p = d D ( W i , j , d e x p , F P + W i , j , d e x p , F N ) + f F S W i , j , f e x p , F S + ( i , j ) L N ( i , j , i , j ) W i , j , i , j e x p , J F , i I , j J
We define the positive variable P R i , j , d F to designate the pressure ratio between the block B i , j + 1 and B i , j for flow alignment d = 1 or between the block B i + 1 , j and B i , j for flow alignment d = 2 . In horizontal direction, the pressure ratio is determined as follows:
P R i , j , 1 F = P i , j + 1 P i , j i I , j J
Similarly, in vertical direction, the pressure ratio is determined as follows:
P R i , j , 2 F = P i + 1 , j P i , j i I , j J
For feed stream f, the pressure ratio is taken as the ratio between block pressure P i , j and parameter P f f e e d for feed pressure .
P R i , j , f f e e d = P i , j P f f e e d i I , j J , f F S
From these pressure ratio definitions, we calculate the isentropic work on direct connecting streams, feed streams and jump connecting streams. In the horizontal direction, the inlet isentropic work is determined as follows:
η W i , j , 1 c o m p , F P W i , j , 1 e x p , F P / η = k K F P i , j 1 , k , 1 T i , j 1 , 1 s R g a s γ γ 1 { ( P R i , j 1 , 1 F ) γ 1 γ 1 } i I , j J
η W i , j , 1 c o m p , F N W i , j , 1 e x p , F N / η = k K F N i , j , k , 1 T i , j , 1 s R g a s γ γ 1 { ( 1 P R i , j , 1 F ) γ 1 γ 1 } i I , j J
Here R g a s is the gas constant and γ is the adiabatic compression coefficient for process streams. γ is taken as heat capacity ratio. η is the adiabatic compression efficiency. Similarly, the isentropic work for a vertical entering stream is calculated as follows:
η W i , j , 2 c o m p , F P W i , j , 2 e x p , F P / η = k K F P i 1 , j , k , 2 T i 1 , j , 2 s R g a s γ γ 1 { ( P R i 1 , j , 2 F ) γ 1 γ 1 } i I , j J
η W i , j , 2 c o m p , F N W i , j , 2 e x p , F N / η = k K F N i , j , k , 2 T i , j , 2 s R g a s γ γ 1 { ( 1 P R i , j , 2 F ) γ 1 γ 1 } i I , j J
The work terms related to feed streams and jump connecting streams are calculated in a similar way:
η W i , j , f c o m p , F S W i , j , f e x p , F S / η = k K M i , j , k , f T f f e e d R g a s 1 n f s { ( P R i , j , f f e e d ) n f s 1 } i I , j J , f F S
η W i , j , i , j c o m p , J F W i , j , i , j e x p , J F / η = J i , j , i , j T T i , j R g a s γ γ 1 { ( P i , j P i , j ) γ 1 γ 1 } ( i , j , i , j ) L N ( i , j , i , j )
Here n f s is the adiabatic compression coefficient for source stream f.

4.7. Objective Function

We consider the components of economic objective in the work of Hasan et al. [4] and derive the objective function for the FGN synthesis as follows.
min T A C = f F S ( i I j J U F C f F f f e e d z i , j , f f e e d f r a c + D i f ( F f f e e d i I j J F f f e e d z i , j , f f e e d f r a c ) ) p P S R e v p ( k K L H V k ( i I j J H i , j , k , p s ) D e p ) + i I j J f F S π f F f f e e d z i , j , f f e e d f r a c + C C H U i I j J Q h i , j + C C C U i I j J Q c i , j + C C e x p i I j J W i , j e x p + C C c o m i I j J W i , j c o m
This objective function aims at minimizing total annual cost ( T A C ). Here parameter U F C f is the unit cost of different source streams, D i f is the unit cost of treatment cost for unused source streams, R e v p is the unit profit from excess energy in product stream p. Besides, the parameter π f denotes the unit transportation cost for source stream f. Parameters C C H U , C C C U , C C e x p and C C c o m denote the unit cost of heaters, coolers, expansion operations and compression operations, respectively. The first term in the objective function consists of source stream purchase cost and disposal cost. The second term corresponds to the profit gained from the released excess amount of energy in product stream p. The third term indicates the transporting cost of source streams. The last four terms refer to overall cost (both capital cost and operating cost) for heaters, coolers, expansion operations and compression operations.
This completes the MINLP model for block-based FGN synthesis. It should be noted that commercial solvers can handle the proposed FGN design problems with small number of sinks or pools. However, when a large-scale problem is considered, further simplification can be made by fixing the streams associated with unused blocks to zero when the number of pools and sinks do not match each other. This fixing ensures that the number of blocks in the first row is only equal to the number of pools assigned in the system and the number of blocks in the second row is equal to the number of sinks.
5. Case Study

In this section, the FGN synthesis problem in an LNG plant is presented to demonstrate the application of block superstructure in synthesis of FGN. We consider two cases for the FGN synthesis problem: case 1 for representation without intermediate pools; case 2 for representation with intermediate pools. The case study is from the work of Hasan et al. [4] and all problem instances are solved using ANTIGONE 1.1. [38] in GAMS 24.4 on a Dell Optiplex 9020 computer (Intel 8 Core i7-4770 CPU 3.4 GHz, 15.5 GB memory) running Springdale Linux.

5.1. Case Study Description

Natural gas (NG) utilization has expanded from residential utilization to industrial productions due to its lower waste emission compared with fossil fuel [39]. NG is delivered to destination by transporting through pipelines or transporting as liquefied natural gas (LNG) [40]. For long-distance transportation, LNG is preferred for economical, technical, safety-related, and political considerations [41]. A conventional LNG plant flowsheet is found in Figure 6. Typically, an LNG process train contains acid-gas removal, dehydration and mercury removal, liquefaction, nitrogen rejection, and sulfur recovery systems, etc. [41,42]. The fuel gas system in the LNG plant normally takes the natural gas as a feed (FFF) to generate steam, provide power and supply electricity to the LNG process, while large amount of energy is lost through flares, turbine exhausts, flash gas, etc. if they are not integrated to fuel sinks in the process. Hence, identification of other fuel gas sources (FFP) in the LNG plant can help to effectively exploit their heating value and reduce the consumption of FFF.
As can be seen from Figure 6, there are three fuel gas sources from byproducts (FFP) for the fuel gas system: high-pressure fuel gas (HPFG) from acid gas removal, end flash gas (EFG) from nitrogen rejection, and tankage boil-off gas (TBOG) from storage process. These fuel gas sources EFG, HPFG, TBOG, FFF are represented as S 1 , S 2 , S 3 , and S 4 respectively. The main components in each source streams are methane, ethane, propane, C 3 + , CO and N 2 . Although the definition of fuel gas network is taken from the literature (Hasan et al. [4]), the model we utilized in this work is not based on the total flowrate but the component flowrate. Because of the model discrepancy, we keep part of the fuel gas source data from the literature in Table 1 and update other required component parameters in Table 2. These component parameters include lower heating value ( L H V ) and reverse specific gravity ( 1 / S G ) corresponding to the sink requirements on these specifications as well as component heat capacity (Cp k ) required for block energy balance.
Within the LNG process, liquefaction is the most energy-intensive process section and the majority of energy is required to run refrigeration compressors which are driven by frame-type gas turbine drivers (GTD) and gas turbine generators (GTG). Besides, boilers consume certain amount of fuel gas to generate steam for the LNG process. According to similarity of specifications among fourteen units [four gas turbine generators (GTG) for power generation, two gas turbine drivers (GTD) for the propane cycle, three GTDs for the mixed refrigerant (MR) cycle, and five boilers] that consume fuel in the LNG plant, five process sinks are identified (C 1 , C 2 , C 3 , C 4 , and C 5 ). The sink data is directly taken from the literature without any changes and listed in Table 3. The sink specifications include energy demand, material demand, temperature and pressure specification, moisture dew-point temperature ( M D P p ) and hydrocarbon dew-point temperature ( H D P p ), lower heating value ( L H V ) and reverse specific gravity ( 1 / S G ). We do not consider the profit from excess energy in sink streams C 1 , C 2 , C 3 and C 4 . It should be noted that all the data have been converted to standard units.
Table 4 lists the cost parameters including capital expenditure (CAPEX) and operating expenditure (OPEX) for various FGN units (heaters/coolers, and compressors/expanders). Finally, we assign temperature lower bound as T m i n = 113 K, temperature upper bound as T m a x = 1000 K. The transporting cost for each source stream f is π f = 8.37 × 10 4 $/kmol. The adiabatic compression coefficient for process streams is γ = 0.286 . The operating time per year is 365 days.

5.2. Case 1: FGN Synthesis Without Pools

In this case, the block representation of FGN shown in Figure 3 is used. To avoid part of product stream recycled as feed into adjacent blocks through direct connecting flow, all the horizontal and vertical material flow, namely F i , j , k , d = 1 and F i , j , k , d = 2 , are ignored for each product block. Accordingly, horizontal ( d = 1 ) and vertical ( d = 2 ) energy flow, E F i , j , d , as well as their associated work terms are removed from energy balance. Also jump connecting streams from product blocks are fixed to be zero since they make the product blocks as intermediate pools.
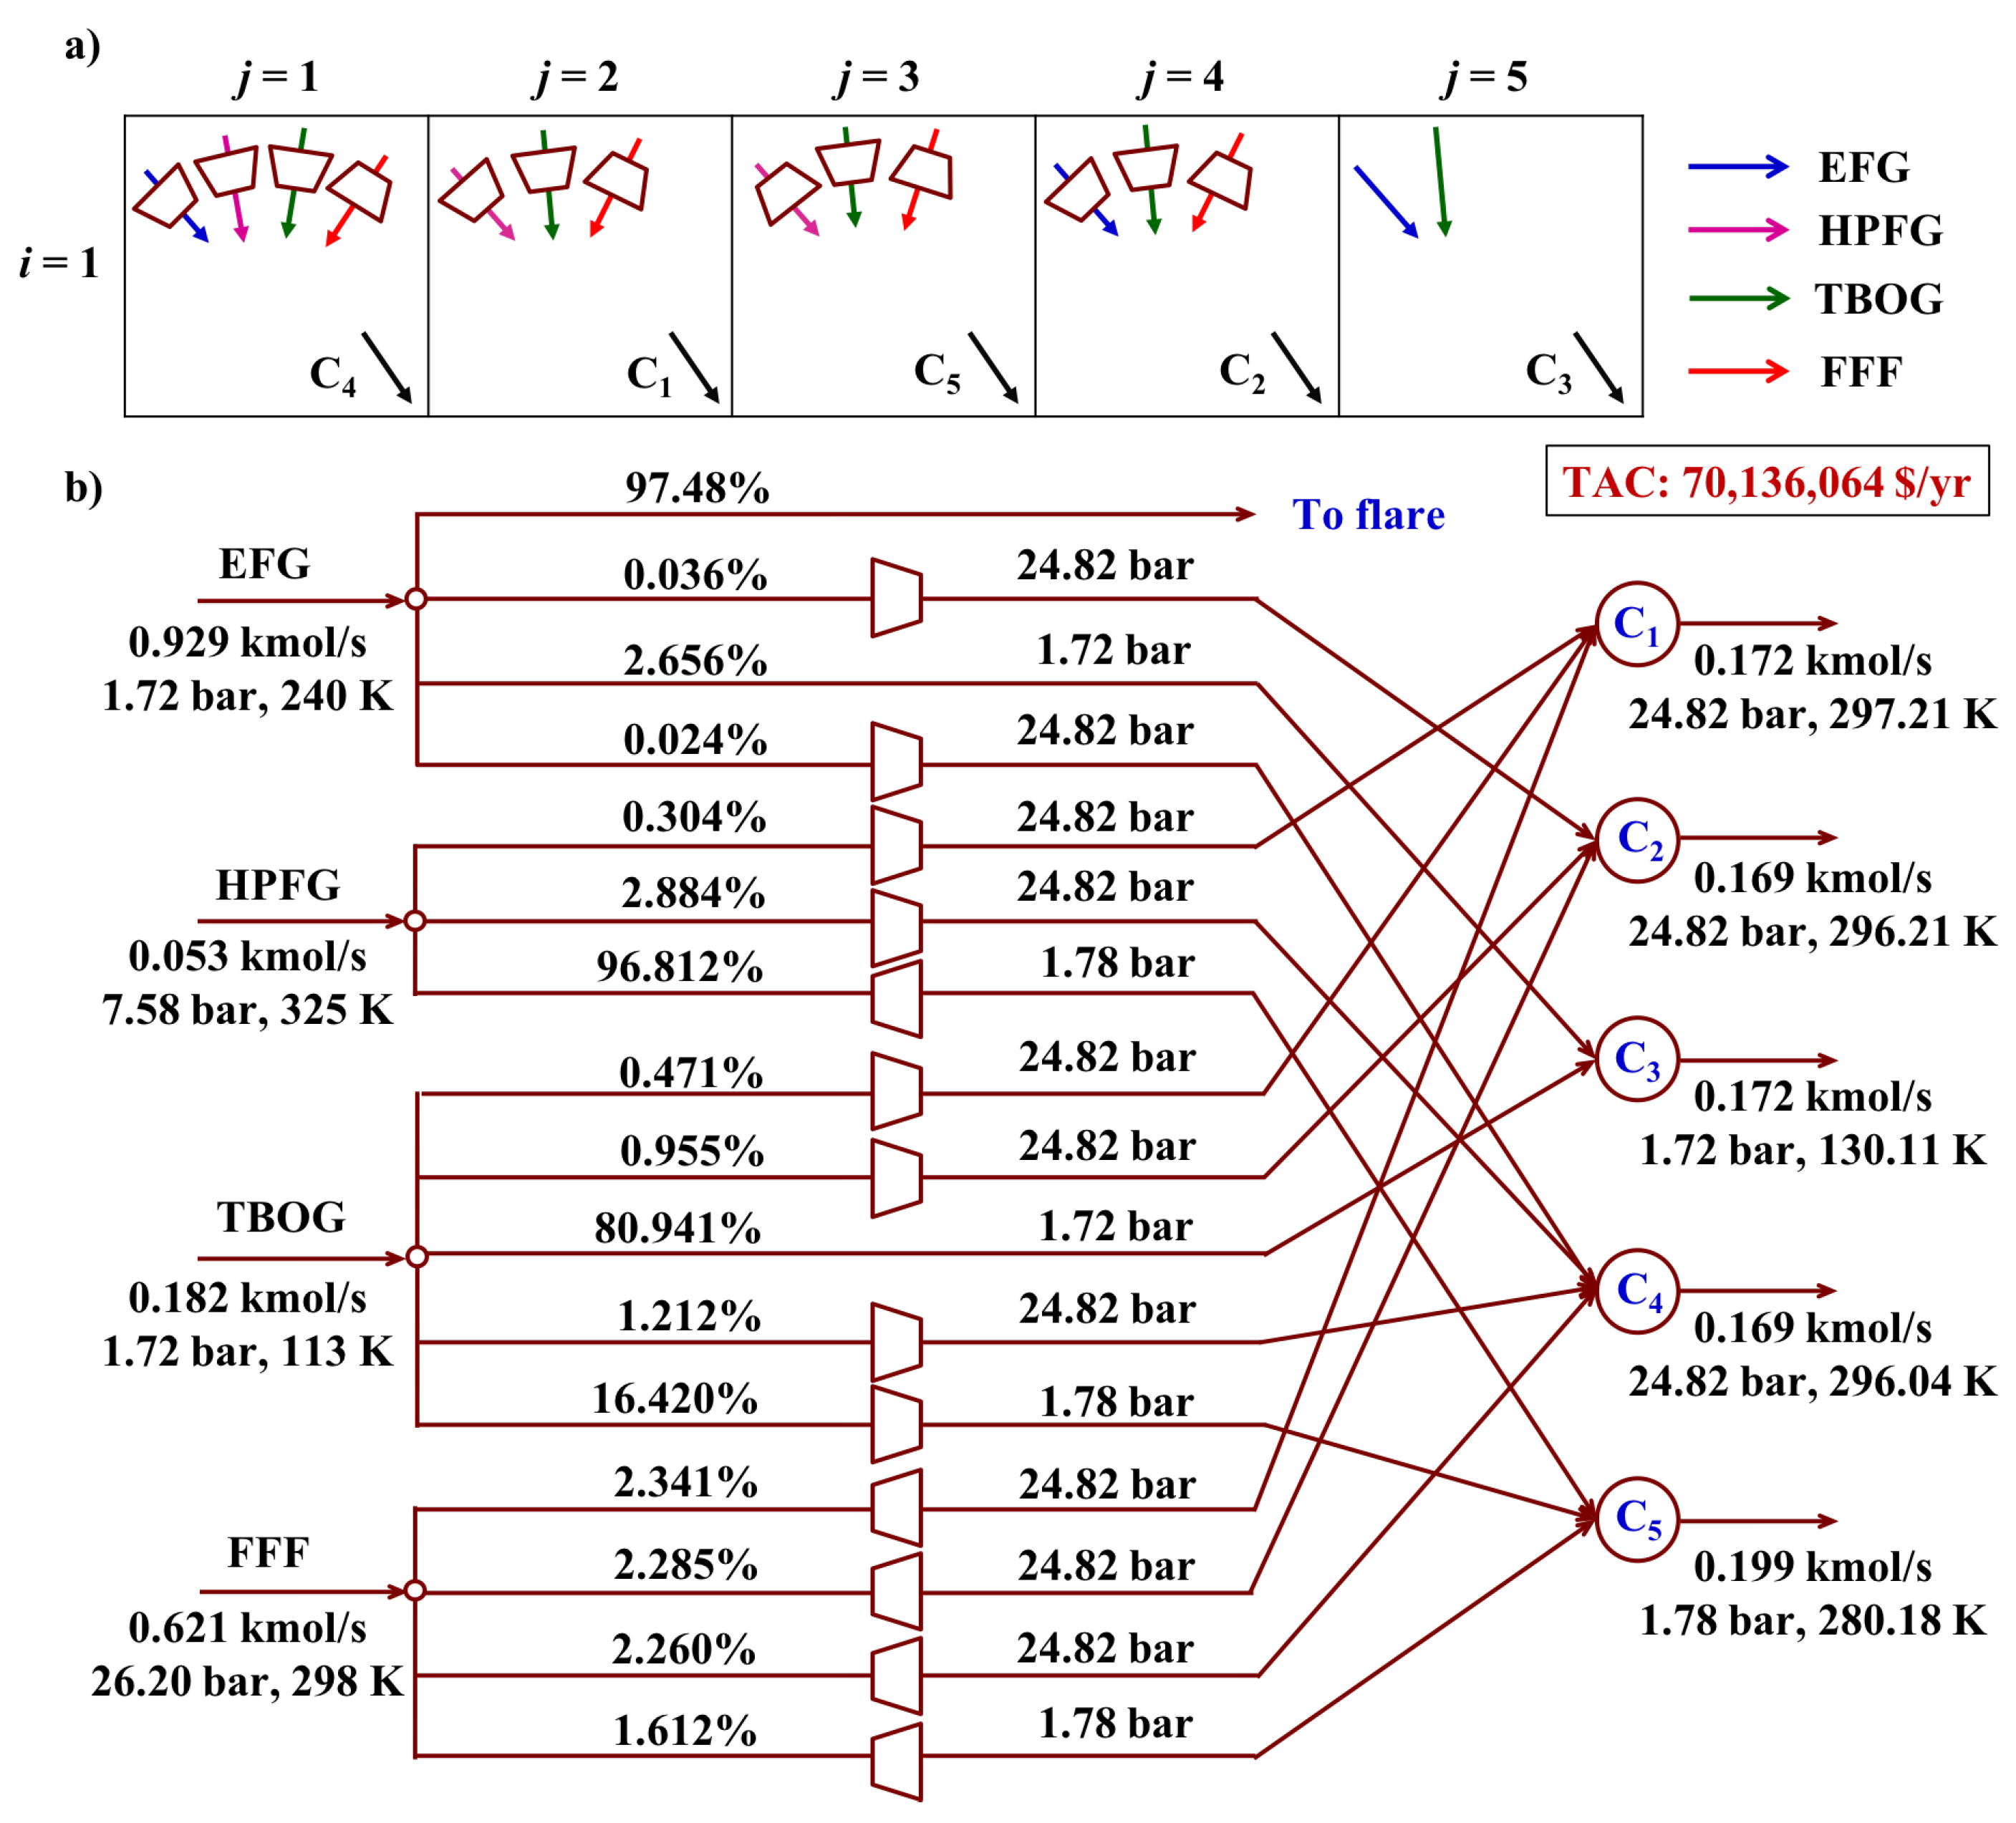
The model for FGN without intermediate pools has 397 continuous variables, 45 binary variables, 849 bilinear terms, 243 signomial terms. The solution is obtained within 565 CPU seconds with optimal total annual cost as 70,136,064 $/year and optimality gap as 0.1 % . The optimal solution reported in the literature [4] is 79,943,071 $/year. This 12.27 % reduction in TAC could be attributed to the facts that: (1) we do not consider the nonlinear quality in this work, i.e., wobbe index, which brings less strict requirement on network design; and (2) we assume ideal gas instead of real gas for expansion operation. The optimal block configuration for FGN and its corresponding optimal network are shown in Figure 7a,b respectively.
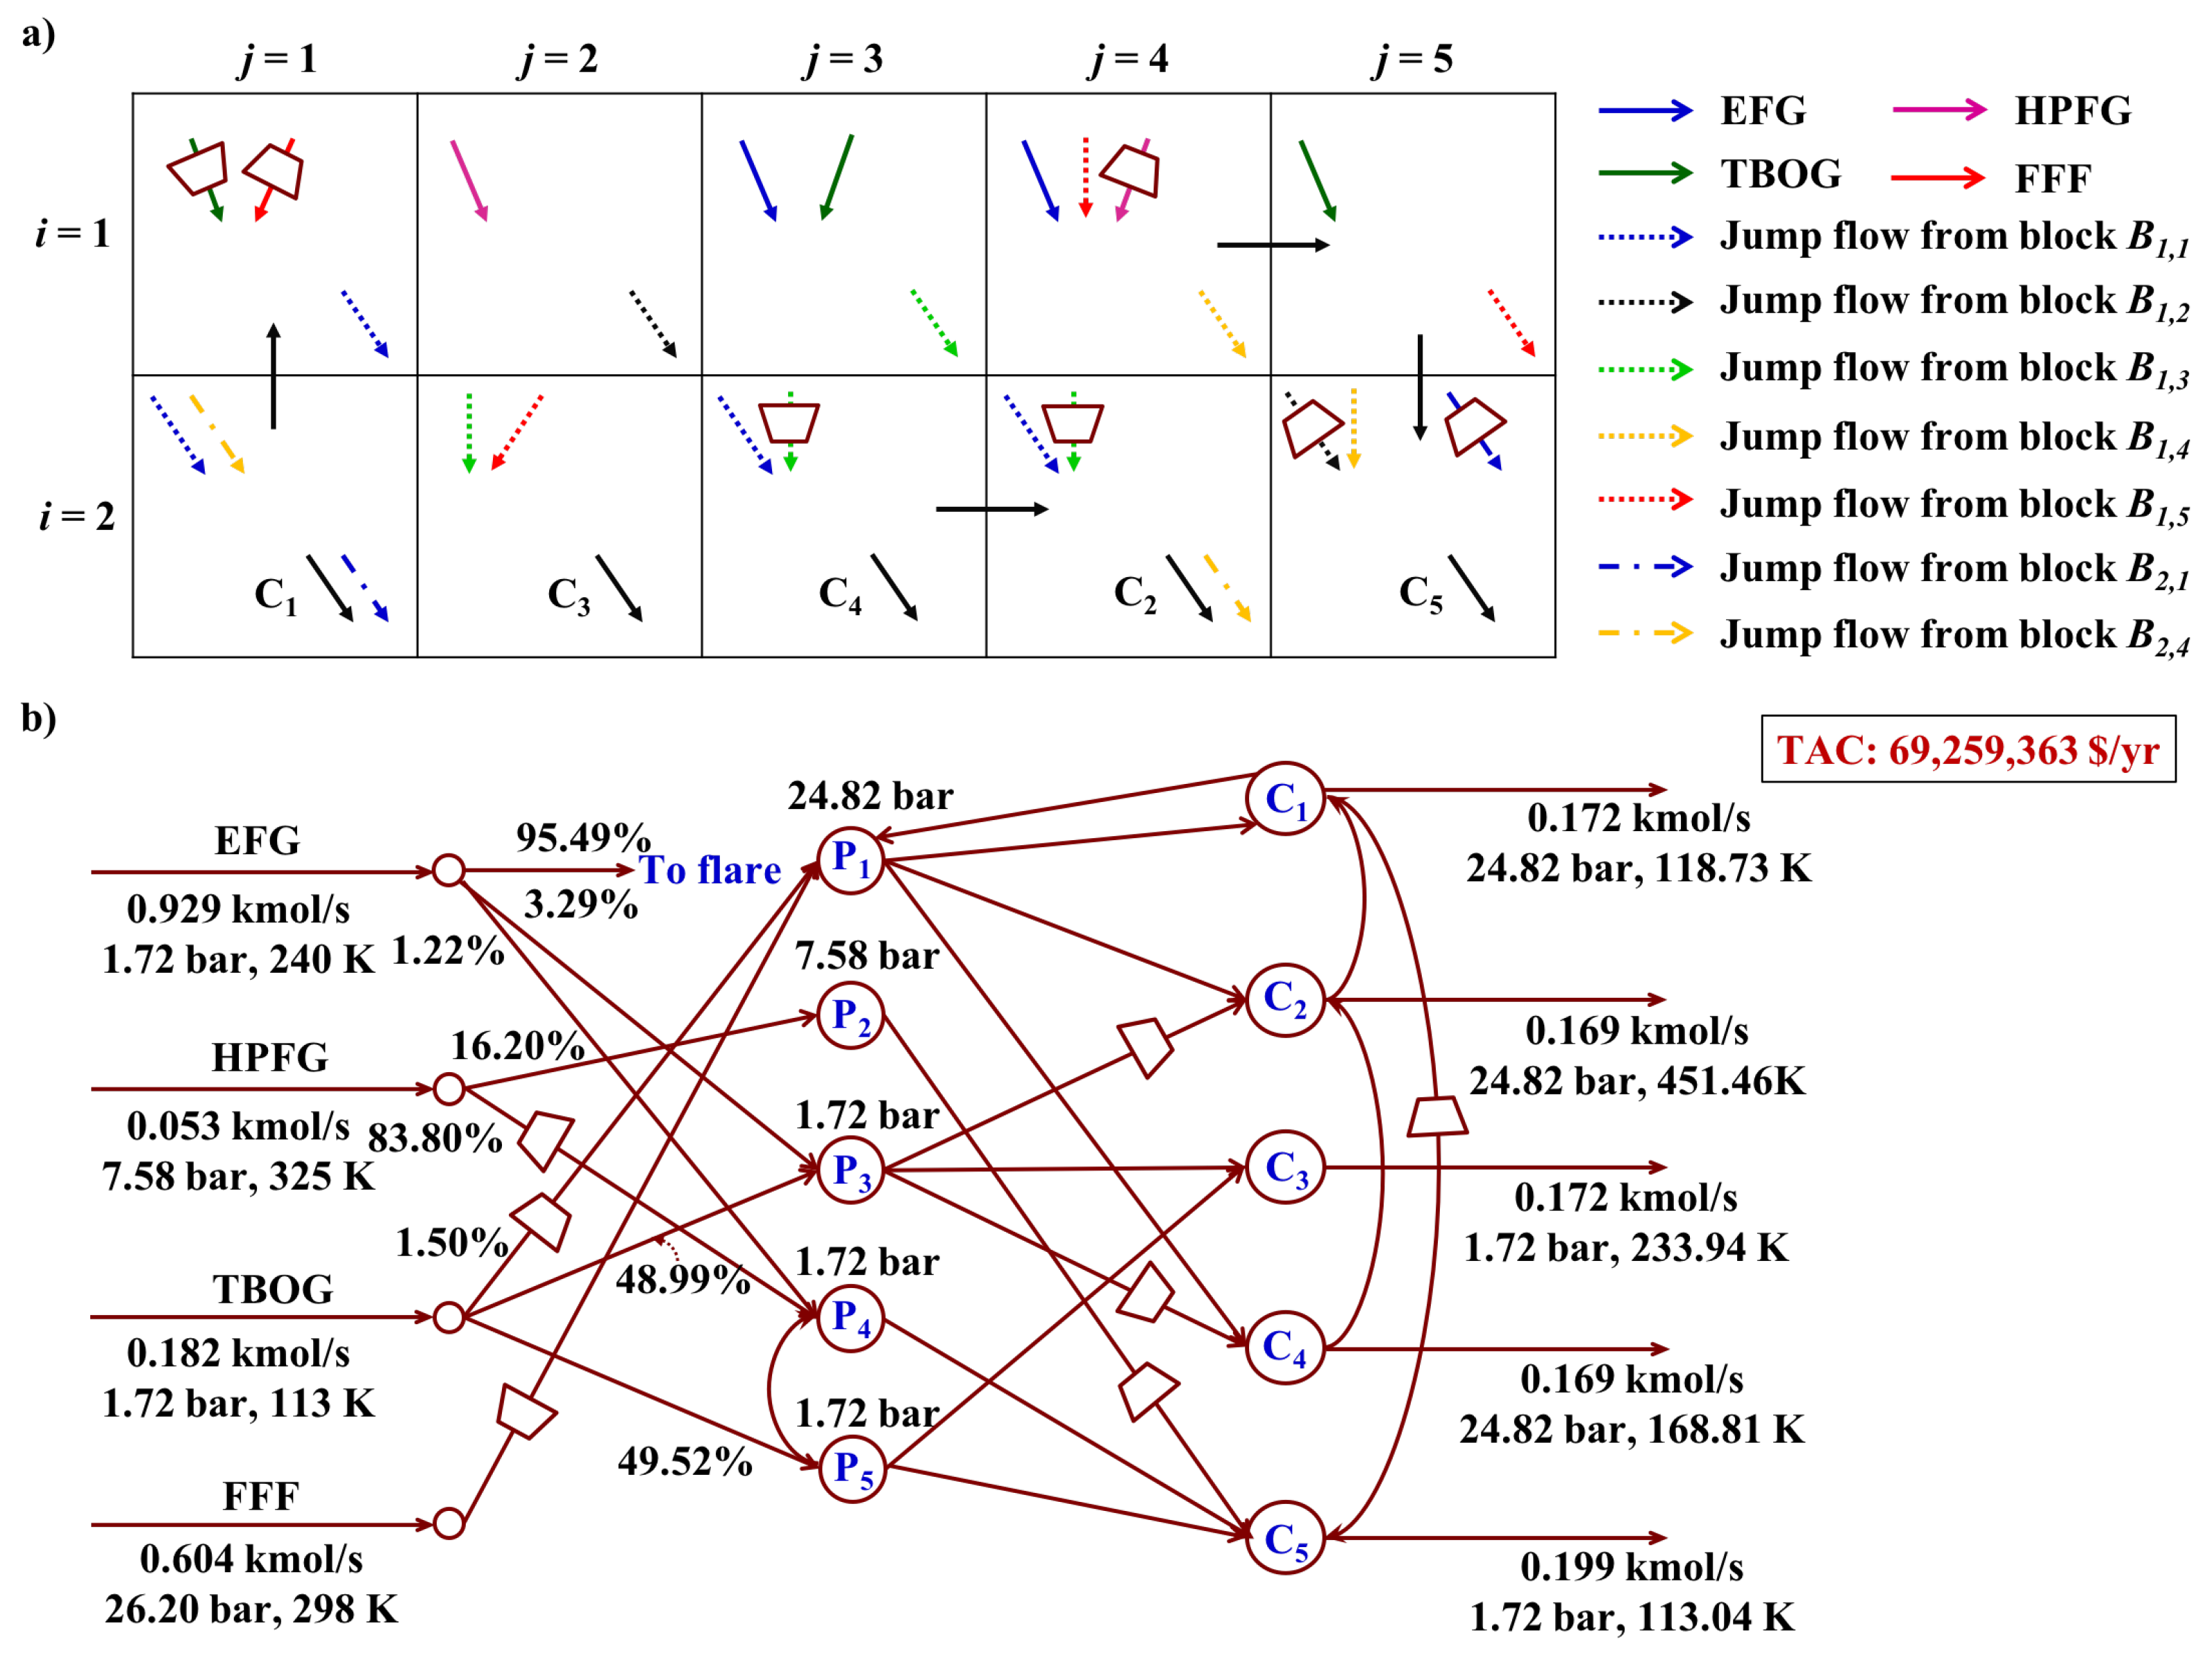
In the block representation of the optimal result (Figure 7a), the block B 1 , 1 takes compressed streams from source EFG, HPFG, and TBOG and expanded stream from source FFF while supplying sink stream to header C 4 . Both the block B 1 , 2 and block B 1 , 3 collect part of compressed streams from source HBFG and TBOG and expanded stream from source FFF to generate sink stream for header C 1 and C 5 respectively. In block B 1 , 4 , partial compressed streams from source EFG and TBOG mix with expanded stream from source FFF. This block yields the sink stream for header C 2 . The block B 1 , 5 blend streams from source EFG and TBOG to yield a product stream for header C 3 .
This obtained block representation is converted into FGN network shown in Figure 7b. It utilizes both HPFG and TBOG fully. Among all sink streams, only C 4 uses all source streams EFG, HPFG, TBOG, FFF while C 1 , C 5 only use HPFG, TBPG, and FFF as source streams. Sink C 2 blends streams from EFG, HPFG, and TBOG. Sink C 3 takes source streams from EFG, and TBOG. It should be noted that both C 2 and C 3 accept part of EFG. The whole FGN network could only utilize 2.716% of EFG and the rest of it goes to flare. The reason is that EFG contains low methane (60%) and high inert content (40%). To utilize EFG as much as possible, it should be mixed with other source streams; however, such mixing could bring unacceptable large flows to sinks so EFG is only partially utilized in the system. Regarding the FFF, none of sinks are taking it alone and sink C3 does not use FFF at all.
The optimal header pressures are 24.82, 24.82, 1.72, 24.82, and 1.78 bar for header C 1 –C 5 respectively. The flow rate of sink streams at headers at C 1 –C 5 are 0.172, 0.169, 0.172, 0.169, 0.199 kmol/s respectively. The optimal header temperatures are found as 297.21, 296.21, 130.11, 296.04, 280.18 K for header C 1 –C 5 respectively. HPFG needs expanders before mixing with TBOG (1.72 bar) and FFF (1.72 bar) in C 5 because of its high pressure (7.58 bar). Similarly, all the FFF (26.20 bar) needs expanders so as to mix with other flows in C 1 , C 2 , C 4 and C 5 . However, EFG and TBOG do not need any compressors or expanders before entering C 3 , which are already at 1.72 bar. No heating and cooling operations are required in the optimal FGN.

5.3. Case 2: FGN Synthesis With Pools

To investigate the influence of existence of pools on improving the economic performance of FGN, we use the representation shown in Figure 4. Note that the problem specifications are the same for case 1 and case 2. The only difference is that the row number I = 1 for case 1 and it is I = 2 for case 2. The material balance involving jump connecting streams is utilized to build connection between pool blocks and product blocks. For the jump flow J i , j , k p withdrawn from the pool block, it is distributed back into other pool blocks or product block. To avoid self-recycle of the jump connecting stream, the inlet streams coming via jump flows from the same block is fixed to be zero, J i , j , i , j , k = 0 , where i = i and j = j . External feed streams are only allowed to enter into the first row, i.e., pool blocks while external product streams are only withdrawn from the second row, i.e., sink blocks.
The model contains 1741 continuous variables, 58 binary variables, 9530 bilinear terms and 1321 signomial terms. The comparison of model statistics for these two cases are summarized in Table 5.
The solution is obtained within 935 CPU seconds with optimal TAC as 69,259,363 $/year and optimality gap as 0.1 % . The involvement of intermediate pools results in a reduction of total annual cost by 1.25%, compared to the one reported as 70,136,064$/year for the fuel gas network without intermediate pools. The detailed TAC comparison is shown in Table 6. Through this additional row for intermediate pools, less source cost (specifically FFF) for purchase and disposal is needed although the revenue obtained from excess energy in product stream C 5 is also decreased. Less cost is spent on expansion and compression operation in case 2. No heating and cooling operations are required in the optimal FGN for both cases. Figure 8 shows the optimal fuel gas network configuration.
The obtained block representation for the FGN is given in Figure 8a. Feed stream EFG is distributed into block B 1 , 3 and B 1 , 4 . Part of feed stream HPFG is expanded and then enters into block B 1 , 4 while extra amount distributes into block B 1 , 2 . In addition, feed stream TBOG is partially supplied to block B 1 , 3 and block B 1 , 5 . Some other amount of TBOG is compressed and then enter block B 1 , 1 . The feed stream FFF only enters the block B 1 , 1 after expanding operation. The blocks B 1 , j in the first row (column number j ranges from 1 to 5) collect the mixed stream and yield the outlet jump flow which are supplied into the second row. Hence, these blocks are identified as intermediate pools, i.e., P 1 , P 2 , P 3 , P 4 , and P 5 . At the second row of the block representation, the jump flow withdrawn from block B 1 , 1 and block B 2 , 4 mix at block B 2 , 1 , which supplies product stream to sink C 1 and generates outlet jump flows entering block B 2 , 5 . The block B 2 , 2 blends the outlet jump flows from block B 1 , 3 and B 1 , 5 to obtain sink stream C 3 . The outlet jump flows from block B 1 , 3 split into three parts. One part compresses first and mixes with outlet jump flow from block B 1 , 1 at block B 2 , 3 , where the sink stream C 4 is generated. Another part is compressed and mixes with outlet jump flow from block B 1 , 1 at block B 2 , 4 , where the sink stream C 2 is obtained. The last part mixes with outlet jump flow from block B 1 , 5 at block B 2 , 2 , where the sink stream C 3 is obtained. Besides, an outlet jump flow is withdrawn from block B 2 , 4 and fed into block B 2 , 1 . The outlet jump flows from block B 2 , 1 , B 1 , 2 are compressed and mixed with other outlet jump flows from block B 1 , 4 and B 1 , 5 to supply the sink stream C 5 .
The corresponding network structure is shown in Figure 8b. The optimal network consumes both HPFG and TBOG fully. Since all the blocks in the first row embed the inlet flow for mixing, five pools can be identified. Pool P 1 accepts source stream from TBOG and FFF, which only supply feed to P 1 . P 2 takes part of source stream HPFG. P 3 blends streams from EFG and TBOG. Part of external stream from EFG and HPFG enter pool P 4 while P 5 only takes stream from source TBOG. The outlet flow from pool P 1 is distributed into sink C 1 , C 2 and C 4 . The outlet flows from pool P 2 and P 4 are directly transported to sink C 5 . Sink C 2 , C 3 and C 4 accept inlet flow withdrawn from pool P 3 . Part of the outlet flow from pool P 5 is recycled back to pool P 4 and another is transported into sink C 3 . Part of product streams from C 2 and C 1 are recycled back to C 1 and C 5 . The utilization of EFG in the whole FGN network is only 4.51% and the rest of it goes to flare.
The header pressures are 24.82, 24.82, 1.72, 24.82, and 1.72 bar for C 1 –C 5 respectively. Expanders are arranged on inlet stream to P 4 from HPFG and inlet stream to P 1 from FFF. TBOG needs compressor before mixing with FFF in P 1 because of its low pressure (7.58 bar). Compressors are placed on the outlet streams of P 3 to sink C 2 and C 4 respectively. Expanders are arranged on the stream from P 2 to sink C 5 as well as on the stream from sink C 1 to sink C 5 so as to meet the pressure requirement. The temperature for sink streams C 1 –C 5 are 118.73, 451.46, 233.94, 168.81 and 113.04 K. In addition, headers C 1 –C 5 collect the flow rate of sink streams as 0.172, 0.169, 0.172, 0.169 and 0.199 kmol/s respectively.
To summarize for the case study section, the block-based representation method can effectively handle the FGN synthesis problem and the involvement of intermediate pools helps to improve the management of FGN network, which decreases the total annual cost.

6. Conclusions

We present an abstract superstructure representation for FGN synthesis, which is based on a block-based arrangement of sources and sinks. Each block allows multiple external fuel gas source streams and single fuel gas sink streams. The direct connecting streams between adjacent blocks and jump connecting streams among all nonadjacent blocks enable many alternative ways for the mass and energy flow from sources to sinks. The blocks with multiple inlet streams serve as mixers and the blocks with multiple outlet streams are splitters. These blocks form a superstructure when arranged in a two-dimensional grid. The row number is determined by the number of intermediate pool layers and the number of sink layers. The column number is determined by the number of intermediate pools and the number of sinks. With the representation method, an MINLP model for fuel gas network synthesis problem was proposed with constraints on material balance, energy balance, flow directions, logical relations, and work calculation. A case study from LNG plant was presented for two instances: one without intermediate pools and another with intermediate pools. The FGN with pools reduces the total annual cost by 1.25% to 69.3 MM$/year, compared to TAC (70.1 MM$/year) of the FGN without intermediate pools. This case study revealed that the block-based representation method enables the synthesis of fuel gas network and helps to find novel network design. Note that the block-based representation method is initially proposed for systematic process intensification, and then applied to process synthesis. The application of block-based approach for FGN integration suggests a general framework towards process intensification, integration and synthesis.

Acknowledgments

The authors gratefully acknowledge financial support from the U.S. National Science Foundation (NSF CBET-1606027).

Author Contributions

J.L., S.E.D. and M.M.F.H. conceived the model and prepared the manuscript.

Conflicts of Interest

The authors declare no conflict of interest.

Nomenclature

Sets and Indices
ISet of row numbers indexed by i
JSet of column numbers indexed by j
DSet of flow alignments indexed by d
KSet of components indexed by k
F S Set of feed streams indexed by f
P S Set of product streams indexed by p
Subsets
L N ( i , j , i , j ) Set designating the connection between block B i , j and block B i , j
k p ( k , p ) Set relating the key component k with product stream p with purity specifications
Variables
F i , j , k , d Flowrate of component k between block B i , j and B i , j + 1 in the flow alignment d
Q i , j Amount of heat/cold utility consumed in block B i , j
W i , j Amount of work energy added into or withdrawn from block B i , j
T A C Total annual cost
Positive Continuous Variables
F f , p Stream connecting source f and sink p in the classic superstructure
M i , j , k , f Component flowrate for k in external feed stream f into block B i , j
M i , j , k f Component flowrate k of external feed stream into block B i , j
z i , j , f f e e d f r a c Distribution of feed f into block B i , j
H i , j , k , p Amount of component k in external product stream p withdrawn from block B i , j
H i , j , k p Component flowrate k of external product stream withdrawn from block B i , j
J i , j , i , j , k Flowrate of component k from block B i , j to another block B i , j
J i , j , k f Overall component flowrate k of jump connecting flow into block B i , j
J i , j , k p Overall component flowrate k of jump connecting flow withdrawn from block B i , j
F P i , j , k , d Positive component of flow F i , j , k , d
F N i , j , k , d Negative component of flow F i , j , k , d
F P i , j , d T Total flowrate for flow F P i , j , k , d
F N i , j , d T Total flowrate for flow F N i , j , k , d
J i , j , i , j T Total flowrate for flow J i , j , i , j , k
M i , j , f T Total flowrate for flow M i , j , k , f
H i , j , p T Total flowrate for flow H i , j , k , p
y i , j , k b Block composition of component k in block B i , j
P i , j Pressure designation in block B i , j
T i , j Temperature designation in block B i , j
Q i , j h Heat amount supplied into block B i , j
Q i , j c Heat amount withdrawn from block B i , j
E F i , j , d Stream enthalpy carried by the material flow F i , j , k , d in flow direction d
E M i , j Overall enthalpy brought into block B i , j along with feed streams
E P i , j Overall enthalpy taken away by product streams at block B i , j
E J i , j f Overall enthalpy carried into block B i , j through jump flow
E J i , j p Overall enthalpy taken out from block B i , j through jump flow
W i , j c o m Work energy associated with compression operation
W i , j e x p Work energy associated with expansion operation
W i , j , d c o m p , F P Compression work for positive component of flow F i , j , k , d
W i , j , d c o m p , F N Compression work for negative component of flow F i , j , k , d
W i , j , f c o m p , F S Compression work for feed stream f
W i , j , i , j c o m p , J F Compression work for jump flow J i , j , i , j , k
W i , j , d e x p , F P Expansion work for positive component of flow F i , j , k , d
W i , j , d e x p , F N Expansion work for negative component of flow F i , j , k , d
W i , j , f e x p , F S Expansion work for feed stream f
W i , j , i , j e x p , J F Expansion work for jump flow J i , j , i , j , k
P R i , j , d F Pressure ratio between the block B i , j + 1 and B i , j for flow alignment d = 1 or
between the block B i + 1 , j and B i , j for flow alignment d = 2
Binary Variables
z i , j , d P l u s 1 if F i , j , k , d is from block B i , j to B i , j + 1 ( d = 1 ) or from block B i , j to B i + 1 , j ( d = 2 )
z i , j , p p r o d u c t 1 if product stream p is withdrawn from block B i , j
z i , j , d c r 1 if boundary between B i , j and B i , j + 1 for d = 1 (between B i , j and B i + 1 , j for d = 2 ) is completely restricted
Parameters
T f Temperature of feed stream f
P f Pressure of feed stream f
T m i n Minimum temperature in the process
T m a x Maximum temperature in the process
F L Flowrate lower bound in the process
F U Flowrate upper bound in the process
T p m i n Minimum temperature of product stream p
T p m a x Maximum temperature of product stream p
P p m i n Minimum pressure of product stream p
P p m a x Maximum pressure of product stream p
F f f e e d Available amount of feed stream f
y k , f f e e d Specification of component k in feed stream f
D p L Minimum amount requirement for product p
D p U Maximum amount requirement for product p
D e p L Minimum energy demand for product p
D e p U Maximum energy demand for product p
y k , p m i n , p r o d Minimum purity requirement of component k in product stream p
y k , p m a x , p r o d Maximum purity requirement of component k in product stream p
q s , p m i n , p r o d Minimum requirement of specification s in product stream p
q s , p m a x , p r o d Maximum requirement of specification s in product stream p
π k , k , p p r o d Minimum product ratio requirement between component k and component k for product p
L H V k Lower heating value for component k
q s , k Specification s for component k
C p k Heat capacity of component k
M D P p Moisture dew-point temperature for the product p
H D P p Hydrocarbon dew-point temperature for the product p
R g a s Gas constant
γ Adiabatic compression coefficient for process streams
η Adiabatic compression efficiency
n f s Adiabatic compression coefficient for feed f
U F C f Unit cost of different source streams
D i f Unit cost of treatment cost for the remaining source stream
R e v p Unit profit from excess energy in product stream p
π f Unit transportation cost for source stream f
C C H U Unit cost of heaters
C C C U Unit cost of coolers
C C e x p Unit cost of expansion operations
C C c o m Unit cost of compression operations
Abbreviations
FGNFuel Gas Network
MINLPMixed-integer nonlinear programming problem
NLPNonlinear programming problem
HENHeat exchange network
MENMass exchange network
UPCSunit-port-conditioning-stream approach
LLower bound
UUpper bound
minMinimum
maxMaximum
prodProduct
feedFeed stream
TTotal
B i , j The block at row i and column j
NGNatural gas
EFGEnd flash gas
HPFGHigh-pressure fuel gas
TBOGTankage boil-off gas
FFFFuel from feed
FFPFuel from products or byproducts
GTGGas turbine generators
GTDGas turbine drivers
MRMixed refrigerant

References

  1. Tahouni, N.; Gholami, M.; Panjeshahi, M.H. Integration of flare gas with fuel gas network in refineries. Energy 2016, 111, 82–91. [Google Scholar] [CrossRef]
  2. Zhang, J.; Zhu, X.; Towler, G. A simultaneous optimization strategy for overall integration in refinery planning. Ind. Eng. Chem. Res. 2001, 40, 2640–2653. [Google Scholar] [CrossRef]
  3. Pellegrino, J.; Brueske, S.; Carole, T.; Andres, H. Energy and Environmental Profile of the US Petroleum Refining Industry; Technical Report; EERE Publication and Product Library: Washington, DC, USA, 2007.
  4. Hasan, M.M.F.; Karimi, I.A.; Avison, C.M. Preliminary synthesis of fuel gas networks to conserve energy and preserve the environment. Ind. Eng. Chem. Res. 2011, 50, 7414–7427. [Google Scholar] [CrossRef]
  5. U.S. Department of Energy (DOE): Refinery Capacity 2017; Number Energy Information Administration: Washington, DC, USA, 2017.
  6. De Carli, A.; Falzini, S.; Liberatore, R.; Tomei, D. Intelligent management and control of fuel gas network. In Proceedings of the IECON 02 IEEE 2002 28th Annual Conference of the Industrial Electronics Society, Sevilla, Spain, 5–8 November 2002; Volume 4, pp. 2921–2926. [Google Scholar]
  7. Zhou, L.; Liao, Z.; Wang, J.; Jiang, B.; Yang, Y.; Du, W. Energy configuration and operation optimization of refinery fuel gas networks. Appl. Energy 2015, 139, 365–375. [Google Scholar] [CrossRef]
  8. Zhang, J.; Rong, G. An MILP model for multi-period optimization of fuel gas system scheduling in refinery and its marginal value analysis. Chem. Eng. Res. Des. 2008, 86, 141–151. [Google Scholar] [CrossRef]
  9. Zhang, J.; Rong, G.; Hou, W.; Huang, C. Simulation based approach for optimal scheduling of fuel gas system in refinery. Chem. Eng. Res. Des. 2010, 88, 87–99. [Google Scholar] [CrossRef]
  10. White, D.C. Advanced automation technology reduces refinery energy costs. Oil Gas J. 2005, 103, 45–53. [Google Scholar]
  11. Ismail, O.S.; Umukoro, G.E. Global impact of gas flaring. Energy Power Eng. 2012, 4, 290–302. [Google Scholar] [CrossRef]
  12. Fawole, O.G.; Cai, X.M.; MacKenzie, A. Gas flaring and resultant air pollution: A review focusing on black carbon. Environ. Pollut. 2016, 216, 182–197. [Google Scholar] [CrossRef] [PubMed]
  13. Quan, C.; Gao, N.; Wu, C. Utilization of NiO/porous ceramic monolithic catalyst for upgrading biomass fuel gas. J. Energy Inst. 2017. [Google Scholar] [CrossRef]
  14. Mokheimer, E.M.; Dabwan, Y.N.; Habib, M.A. Optimal integration of solar energy with fossil fuel gas turbine cogeneration plants using three different CSP technologies in Saudi Arabia. Appl. Energy 2017, 185, 1268–1280. [Google Scholar] [CrossRef]
  15. Friedler, F. Process integration, modelling and optimisation for energy saving and pollution reduction. Appl. Therm. Eng. 2010, 30, 2270–2280. [Google Scholar] [CrossRef]
  16. El-Halwagi, M.M. Pollution prevention through process integration. Clean Prod. Process. 1998, 1, 5–19. [Google Scholar] [CrossRef]
  17. Jagannath, A.; Hasan, M.M.F.; Al-Fadhli, F.M.; Karimi, I.A.; Allen, D.T. Minimize flaring through integration with fuel gas networks. Ind. Eng. Chem. Res. 2012, 51, 12630–12641. [Google Scholar] [CrossRef]
  18. Chen, Q.; Grossmann, I. Recent developments and challenges in optimization-based process synthesis. Annu. Rev. Chem. Biomol. Eng. 2017, 8, 249–283. [Google Scholar] [CrossRef] [PubMed]
  19. Tahouni, N.; Gholami, M.; Panjeshahi, M. Reducing energy consumption and GHG emission by integration of flare gas with fuel gas network in refinery. Int. J. Chem. Nucl. Mater. Metall. Eng. 2014, 8, 900–904. [Google Scholar]
  20. Kondili, E.; Pantelides, C.; Sargent, R. A general algorithm for short-term scheduling of batch operations—I. MILP formulation. Comput. Chem. Eng. 1993, 17, 211–227. [Google Scholar] [CrossRef]
  21. Yeomans, H.; Grossmann, I.E. A systematic modeling framework of superstructure optimization in process synthesis. Comput. Chem. Eng. 1999, 23, 709–731. [Google Scholar] [CrossRef]
  22. Friedler, F.; Tarjan, K.; Huang, Y.; Fan, L. Graph-theoretic approach to process synthesis: Axioms and theorems. Chem. Eng. Sci. 1992, 47, 1973–1988. [Google Scholar] [CrossRef]
  23. Friedler, F.; Tarjan, K.; Huang, Y.; Fan, L. Graph-theoretic approach to process synthesis: Polynomial algorithm for maximal structure generation. Comput. Chem. Eng. 1993, 17, 929–942. [Google Scholar] [CrossRef]
  24. Bagajewicz, M.J.; Manousiouthakis, V. Mass/heat-exchange network representation of distillation networks. AIChE J. 1992, 38, 1769–1800. [Google Scholar] [CrossRef]
  25. Bagajewicz, M.J.; Pham, R.; Manousiouthakis, V. On the state space approach to mass/heat exchanger network design. Chem. Eng. Sci. 1998, 53, 2595–2621. [Google Scholar] [CrossRef]
  26. Papalexandri, K.P.; Pistikopoulos, E.N. Generalized modular representation framework for process synthesis. AIChE J. 1996, 42, 1010–1032. [Google Scholar] [CrossRef]
  27. Proios, P.; Goula, N.F.; Pistikopoulos, E.N. Generalized modular framework for the synthesis of heat integrated distillation column sequences. Chem. Eng. Sci. 2005, 60, 4678–4701. [Google Scholar] [CrossRef]
  28. Lutze, P.; Gani, R.; Woodley, J.M. Process intensification: A perspective on process synthesis. Chem. Eng. Process. Process Intensif. 2010, 49, 547–558. [Google Scholar] [CrossRef]
  29. Lutze, P.; Babi, D.K.; Woodley, J.M.; Gani, R. Phenomena based methodology for process synthesis incorporating process intensification. Ind. Eng. Chem. Res. 2013, 52, 7127–7144. [Google Scholar] [CrossRef]
  30. Babi, D.K.; Holtbruegge, J.; Lutze, P.; Górak, A.; Woodley, J.M.; Gani, R. Sustainable process synthesis—Intensification. Comput. Chem. Eng. 2015, 81, 218–244. [Google Scholar] [CrossRef]
  31. Tula, A.K.; Eden, M.R.; Gani, R. Process synthesis, design and analysis using a process-group contribution method. Comput. Chem. Eng. 2015, 81, 245–259. [Google Scholar] [CrossRef]
  32. Wu, W.; Henao, C.A.; Maravelias, C.T. A superstructure representation, generation, and modeling framework for chemical process synthesis. AIChE J. 2016, 62, 3199–3214. [Google Scholar] [CrossRef]
  33. Wu, W.; Yenkie, K.; Maravelias, C.T. A superstructure-based framework for bio-separation network synthesis. Comput. Chem. Eng. 2017, 96, 1–17. [Google Scholar] [CrossRef]
  34. Demirel, S.E.; Li, J.; Hasan, M.M.F. Systematic process intensification using building blocks. Comput. Chem. Eng. 2017, 105, 2–38. [Google Scholar]
  35. Li, J.; Demirel, S.E.; Hasan, M.M.F. Simultaneous Process Synthesis and Process Intensification using Building Blocks. Comput. Aided Chem. Eng. 2017, 40, 1171–1176. [Google Scholar]
  36. Demirel, S.E.; Li, J.; Hasan, M.M.F. A General Framework for Process Synthesis, Integration and Intensification. In Proceedings of the 13th International Symposium on Process System Engineering, San Diego, CA, USA, 1–5 July 2018. (accepted). [Google Scholar]
  37. Li, J.; Demirel, S.E.; Hasan, M.M.F. Process Synthesis using Block Superstructure with Automated Flowsheet Generation and Optimization. AIChE J. 2018. under review. [Google Scholar]
  38. Misener, R.; Floudas, C.A. ANTIGONE: Algorithms for continuous/integer global optimization of nonlinear equations. J. Glob. Optim. 2014, 59, 503–526. [Google Scholar] [CrossRef]
  39. Aslambakhsh, A.H.; Moosavian, M.A.; Amidpour, M.; Hosseini, M.; AmirAfshar, S. Global cost optimization of a mini-scale liquefied natural gas plant. Energy 2018. [Google Scholar] [CrossRef]
  40. Alabdulkarem, A.; Mortazavi, A.; Hwang, Y.; Radermacher, R.; Rogers, P. Optimization of propane pre-cooled mixed refrigerant LNG plant. Appl. Therm. Eng. 2011, 31, 1091–1098. [Google Scholar] [CrossRef]
  41. Lim, W.; Choi, K.; Moon, I. Current status and perspectives of liquefied natural gas (LNG) plant design. Ind. Eng. Chem. Res. 2013, 52, 3065–3088. [Google Scholar] [CrossRef]
  42. Hasan, M.M.F. Modeling and Optimization of Liquefied Natural Gas Process. Ph.D. Thesis, National University of Singapore, Singapore, 13 August 2009. [Google Scholar]
Figure 1. A classic superstructure for the fuel gas network.
Processes 06 00023 g001
Figure 2. Construction of superstructure for fuel gas synthesis problems: (a) Block superstructure illustration; (b) Block interaction via connecting streams (blue line: jump connecting flow from the block B i , j ; red line: jump connecting flow into the block B i , j ; blocks at diagonal positions are ignored for simplicity).
Processes 06 00023 g002
Figure 3. Block representation for fuel gas network problem: (a) Classical superstructure for fuel gas network; (b) Equivalent block superstructure for fuel gas network.
Processes 06 00023 g003
Figure 4. General superstructure for fuel gas network synthesis problem with intermediate pools: (a) General superstructure for fuel gas network with intermediate pools; (b) equivalent block superstructure.
Processes 06 00023 g004
Figure 5. Illustration of energy balance on block B i , j .
Processes 06 00023 g005
Figure 6. Process diagram for a conventional LNG plant.
Processes 06 00023 g006
Figure 7. Block representation and process flowsheet for the optimal solution of FGN without intermediate pools: (a) Block representation for the optimal solution of FGN; (b) process flowsheet for the optimal solution of FGN.
Processes 06 00023 g007
Figure 8. Block representation and process flowsheet for the optimal solution of FGN with intermediate pools: (a) Block representation for the optimal solution of FGN; (b) process flowsheet for the optimal solution of FGN.
Processes 06 00023 g008
Table 1. Sources streams specifications.
Specification/ParameterEFGHPFGTBOGFFF
Adiabatic compression coefficient, n f s 0.2540.20.180.2
Availability, F f f e e d (kmol/s)0.929380.053100.18255<7.30229
Temperature, T f f e e d (K)240325113298
Pressure, P f f e e d (bar)1.723697.584231.7236926.20007
Methane, CH 4 (%)60.081.092.085.0
Ethane, C 2 H 6 (%)0.06.00.05.0
Propane, C 3 H 8 (%)0.05.00.04.0
C 3 + (%)0.02.50.02.0
CO (%)0.00.00.00.05
N2 (%)40.05.58.03.95
Source unit cost, U F C f ($/kmol)0.00.00.04.184
Source disposal cost, D i f ($/kmol)0.2090.2920.2090
Feed transporting cost, π f ($/kmol)0.00080.00080.00080.0008
EFG: end flash gas; HPFG: high-pressure fuel gas; TBOG: tankage boil-off gas; FFF: fuel from feed.
Table 2. Component quality parameters.
ParameterMethaneEthanePropaneC 3 + CON2
LHV(MJ/kmol)800.2341425.5802041.1132654.134282.6370
1/SG (28.96/mol wt)1.80600.96360.65710.49851.03441.0342
Cp [KJ/(kmol K)]37.1657.4080.30114.9329.2029.15
Table 3. Specification for product streams (sinks).
Specification/ParameterC1C2C3C4C5
Energy demand,152.309149.378120.305149.37887.921
D e p (MJ/s)
Material demand,0.159–0.1720.156–0.1690.159–0.1720.149–0.1690.132–0.199
D p L , D p U (kmol/s)
Temperature range,113–1000113–1000113–1000113–1000113–1000
T p m i n , T p m a x (K)
Pressure range,1.72–24.821.72–24.821.72–24.821.72–24.821.72–24.82
P p m i n , P p m a x (bar)
M D P p (K)277277277277277
H D P p (K)277277277277277
L H V (MJ/kmol)264.885–8829.500264.885–8829.500264.885–8829.500264.885–8829.500264.885–8829.500
1 / S G (28.96/mol wt)1.0–2.41.0–2.41.0–2.41.0–2.41.0–2.4
Methane, CH 4 (%)>85.0>85.0>85.0>85.0>65.0
Ethane, C 2 H 6 (%)<15.0<15.0<15.0<15.0<15.0
Propane, C 3 H 8 (%)<15.0<15.0<15.0<15.0<15.0
C 3 + (%)<5.0<5.0<5.0<5.0<5.0
CO (%)<10.0<10.0<10.0<10.0<10.0
N2 (%)<15.0<15.0<15.0<15.0<15.0
Treatment factor, ψ s p 1.01.01.01.01.0
Unit profit, R e v p ($/KJ)00006.6347×10 6
Table 4. CAPEX and OPEX Coefficients for Various Equipment Units.
UnitCAPEX ($/KWh)OPEX ($/KWh)Total ($/KWh)
Compressor100.01 C C c o m = 10.01
Expander10.05 C C e x p = 1.05
Heater50.01 C C H U = 5.01
Cooler50.02 C C C U = 5.02
Table 5. Summary of model statistics for case 1 and case 2.
Case 1Case 2
Continuous variable3971741
Binary variable4558
Bilinear terms8499530
Signomial terms2431321
CPU time (second)565935
Solution (MM$/year)70.169.3
Table 6. Total annual cost comparison for case 1 and case 2.
TAC Component ($/Year)Case 1Case 2
Source cost87,852,76468,530,679
Revenue from excess energy in sinks17,736,11716,329,735
Source transportation cost23,24623,246
Heaters cost00
Coolers cost00
Expansion operation cost58503016
Compression operation cost31682744