The Impact of Oriented Perforations on Fracture Propagation and Complexity in Hydraulic Fracturing


Abstract
1. Introduction
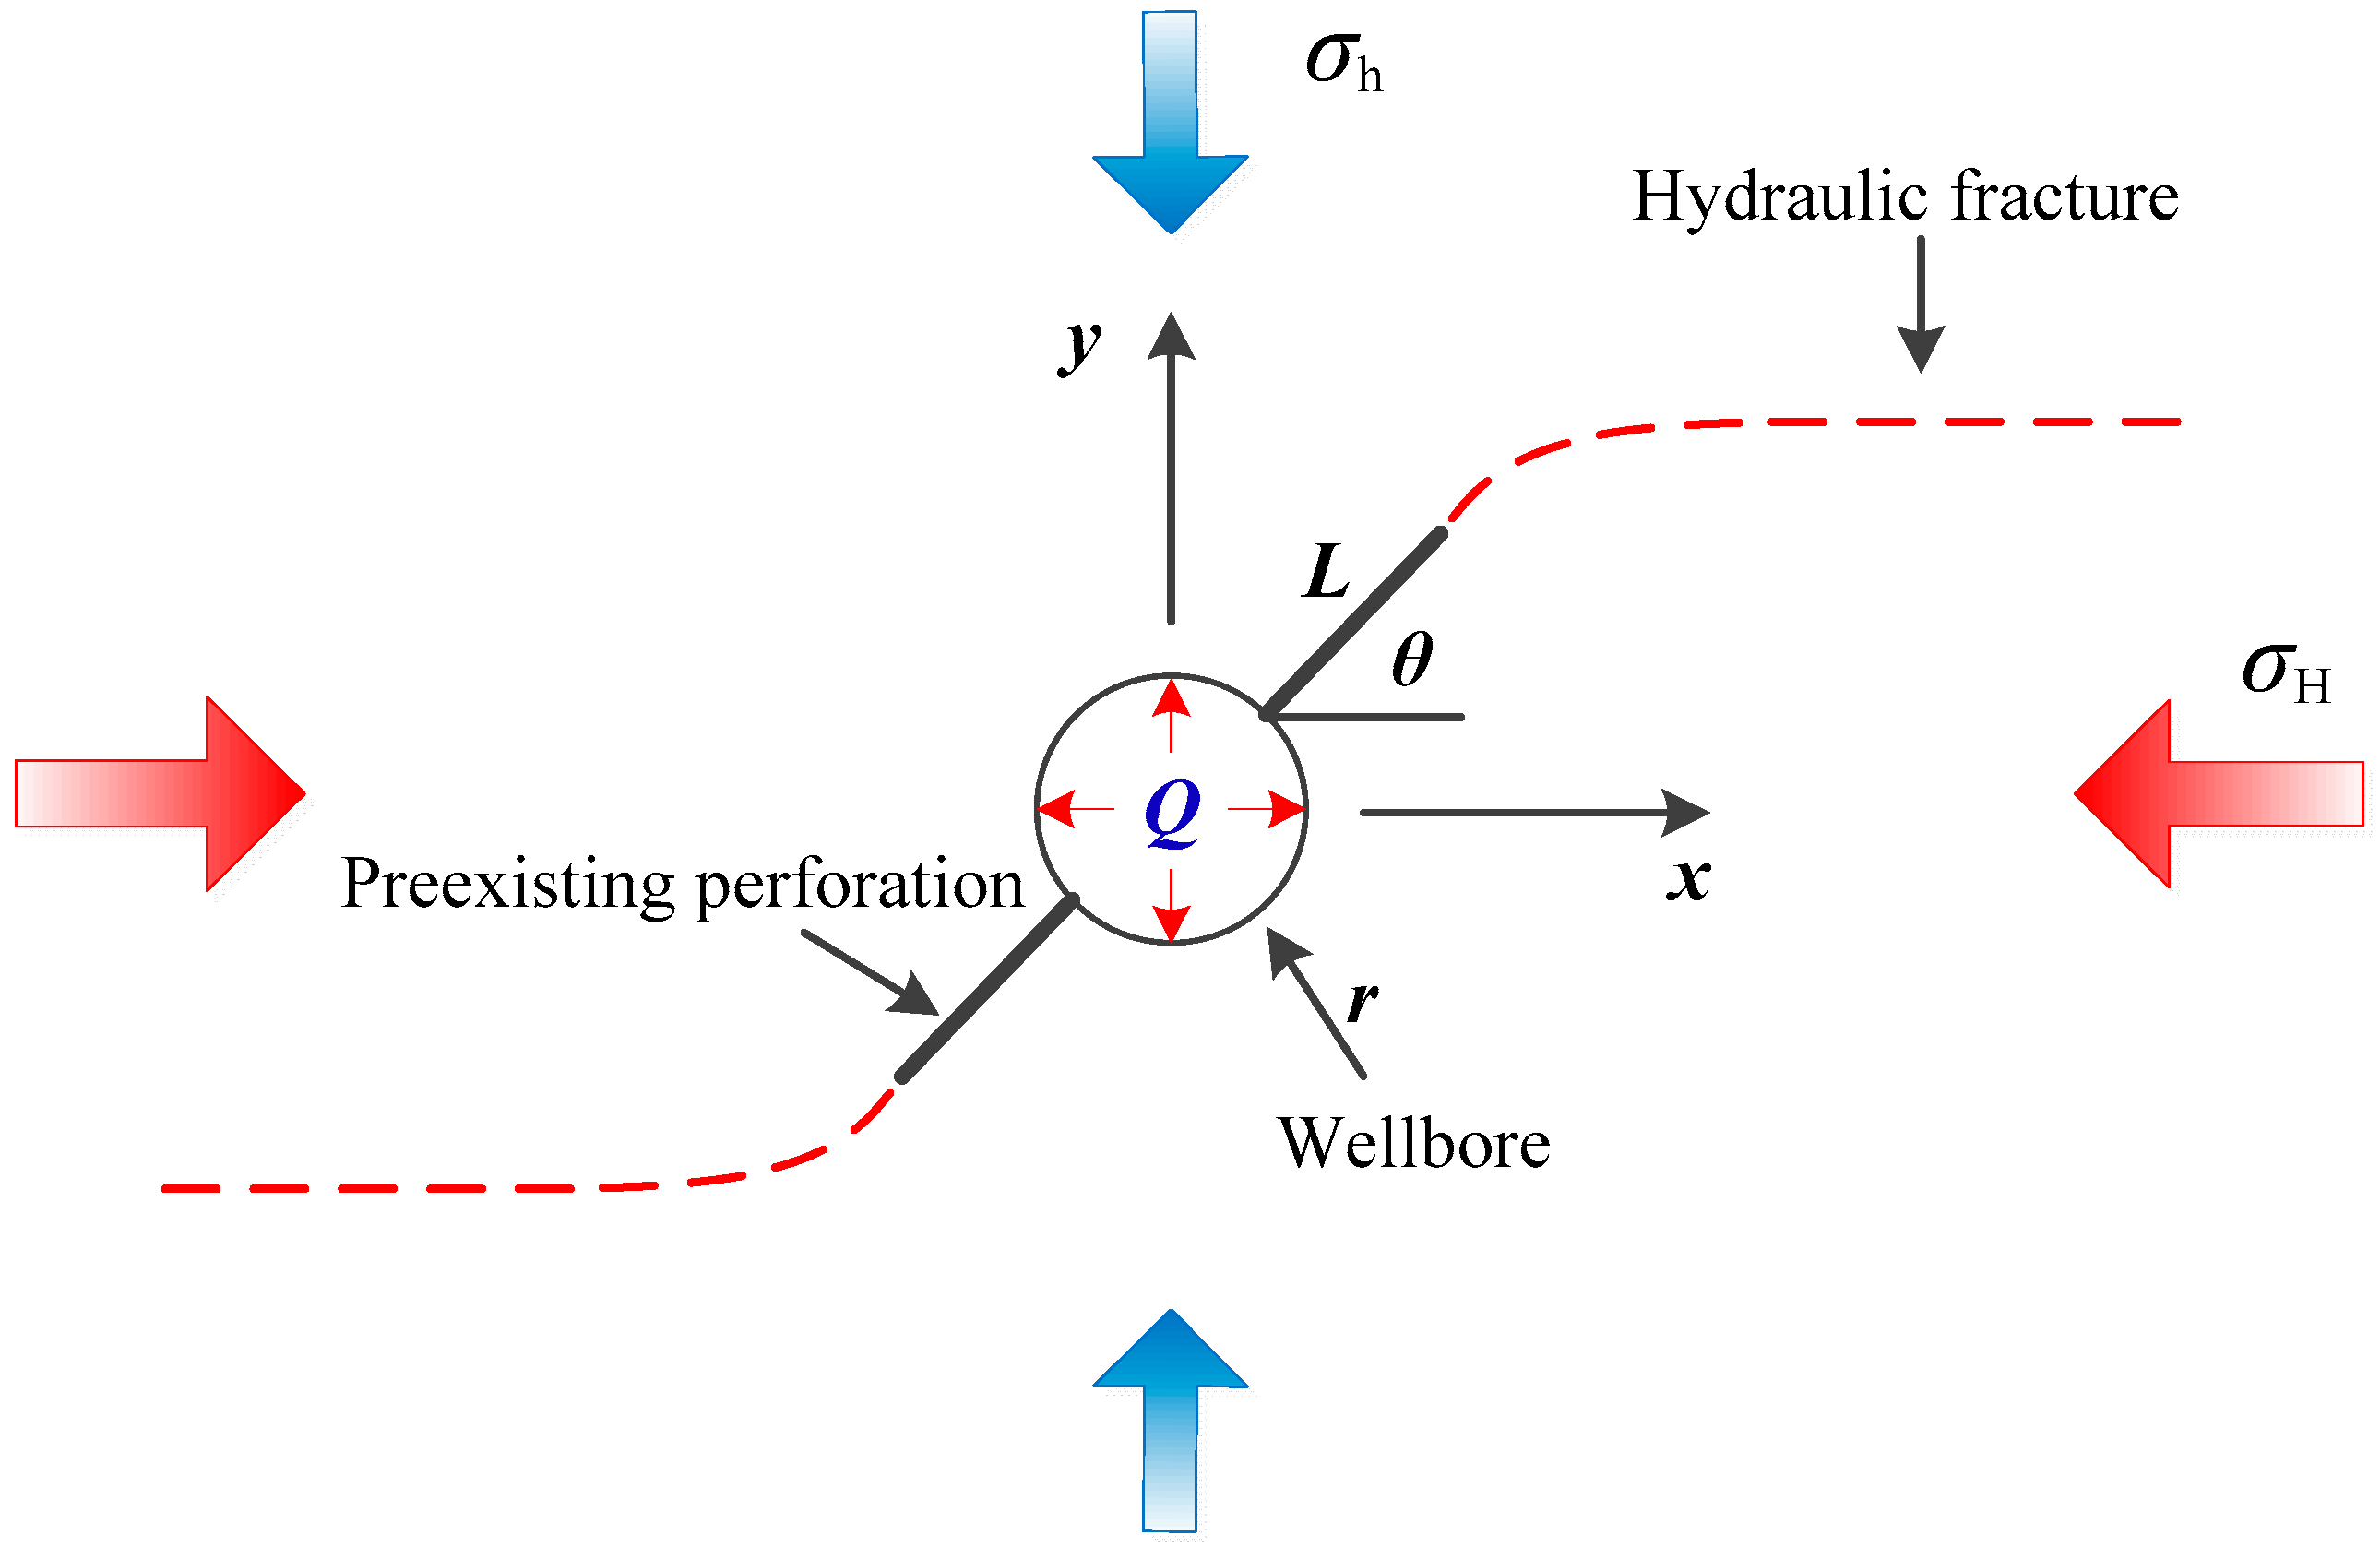
2. Conceptual Model
3. Formulation of the Conceptual Model
3.1. Governing Equations for Mechanical Response
3.2. Governing Equations for Fluid Flow
3.2.1. Slightly Compressible Fluids
3.2.2. Compressible Fluids
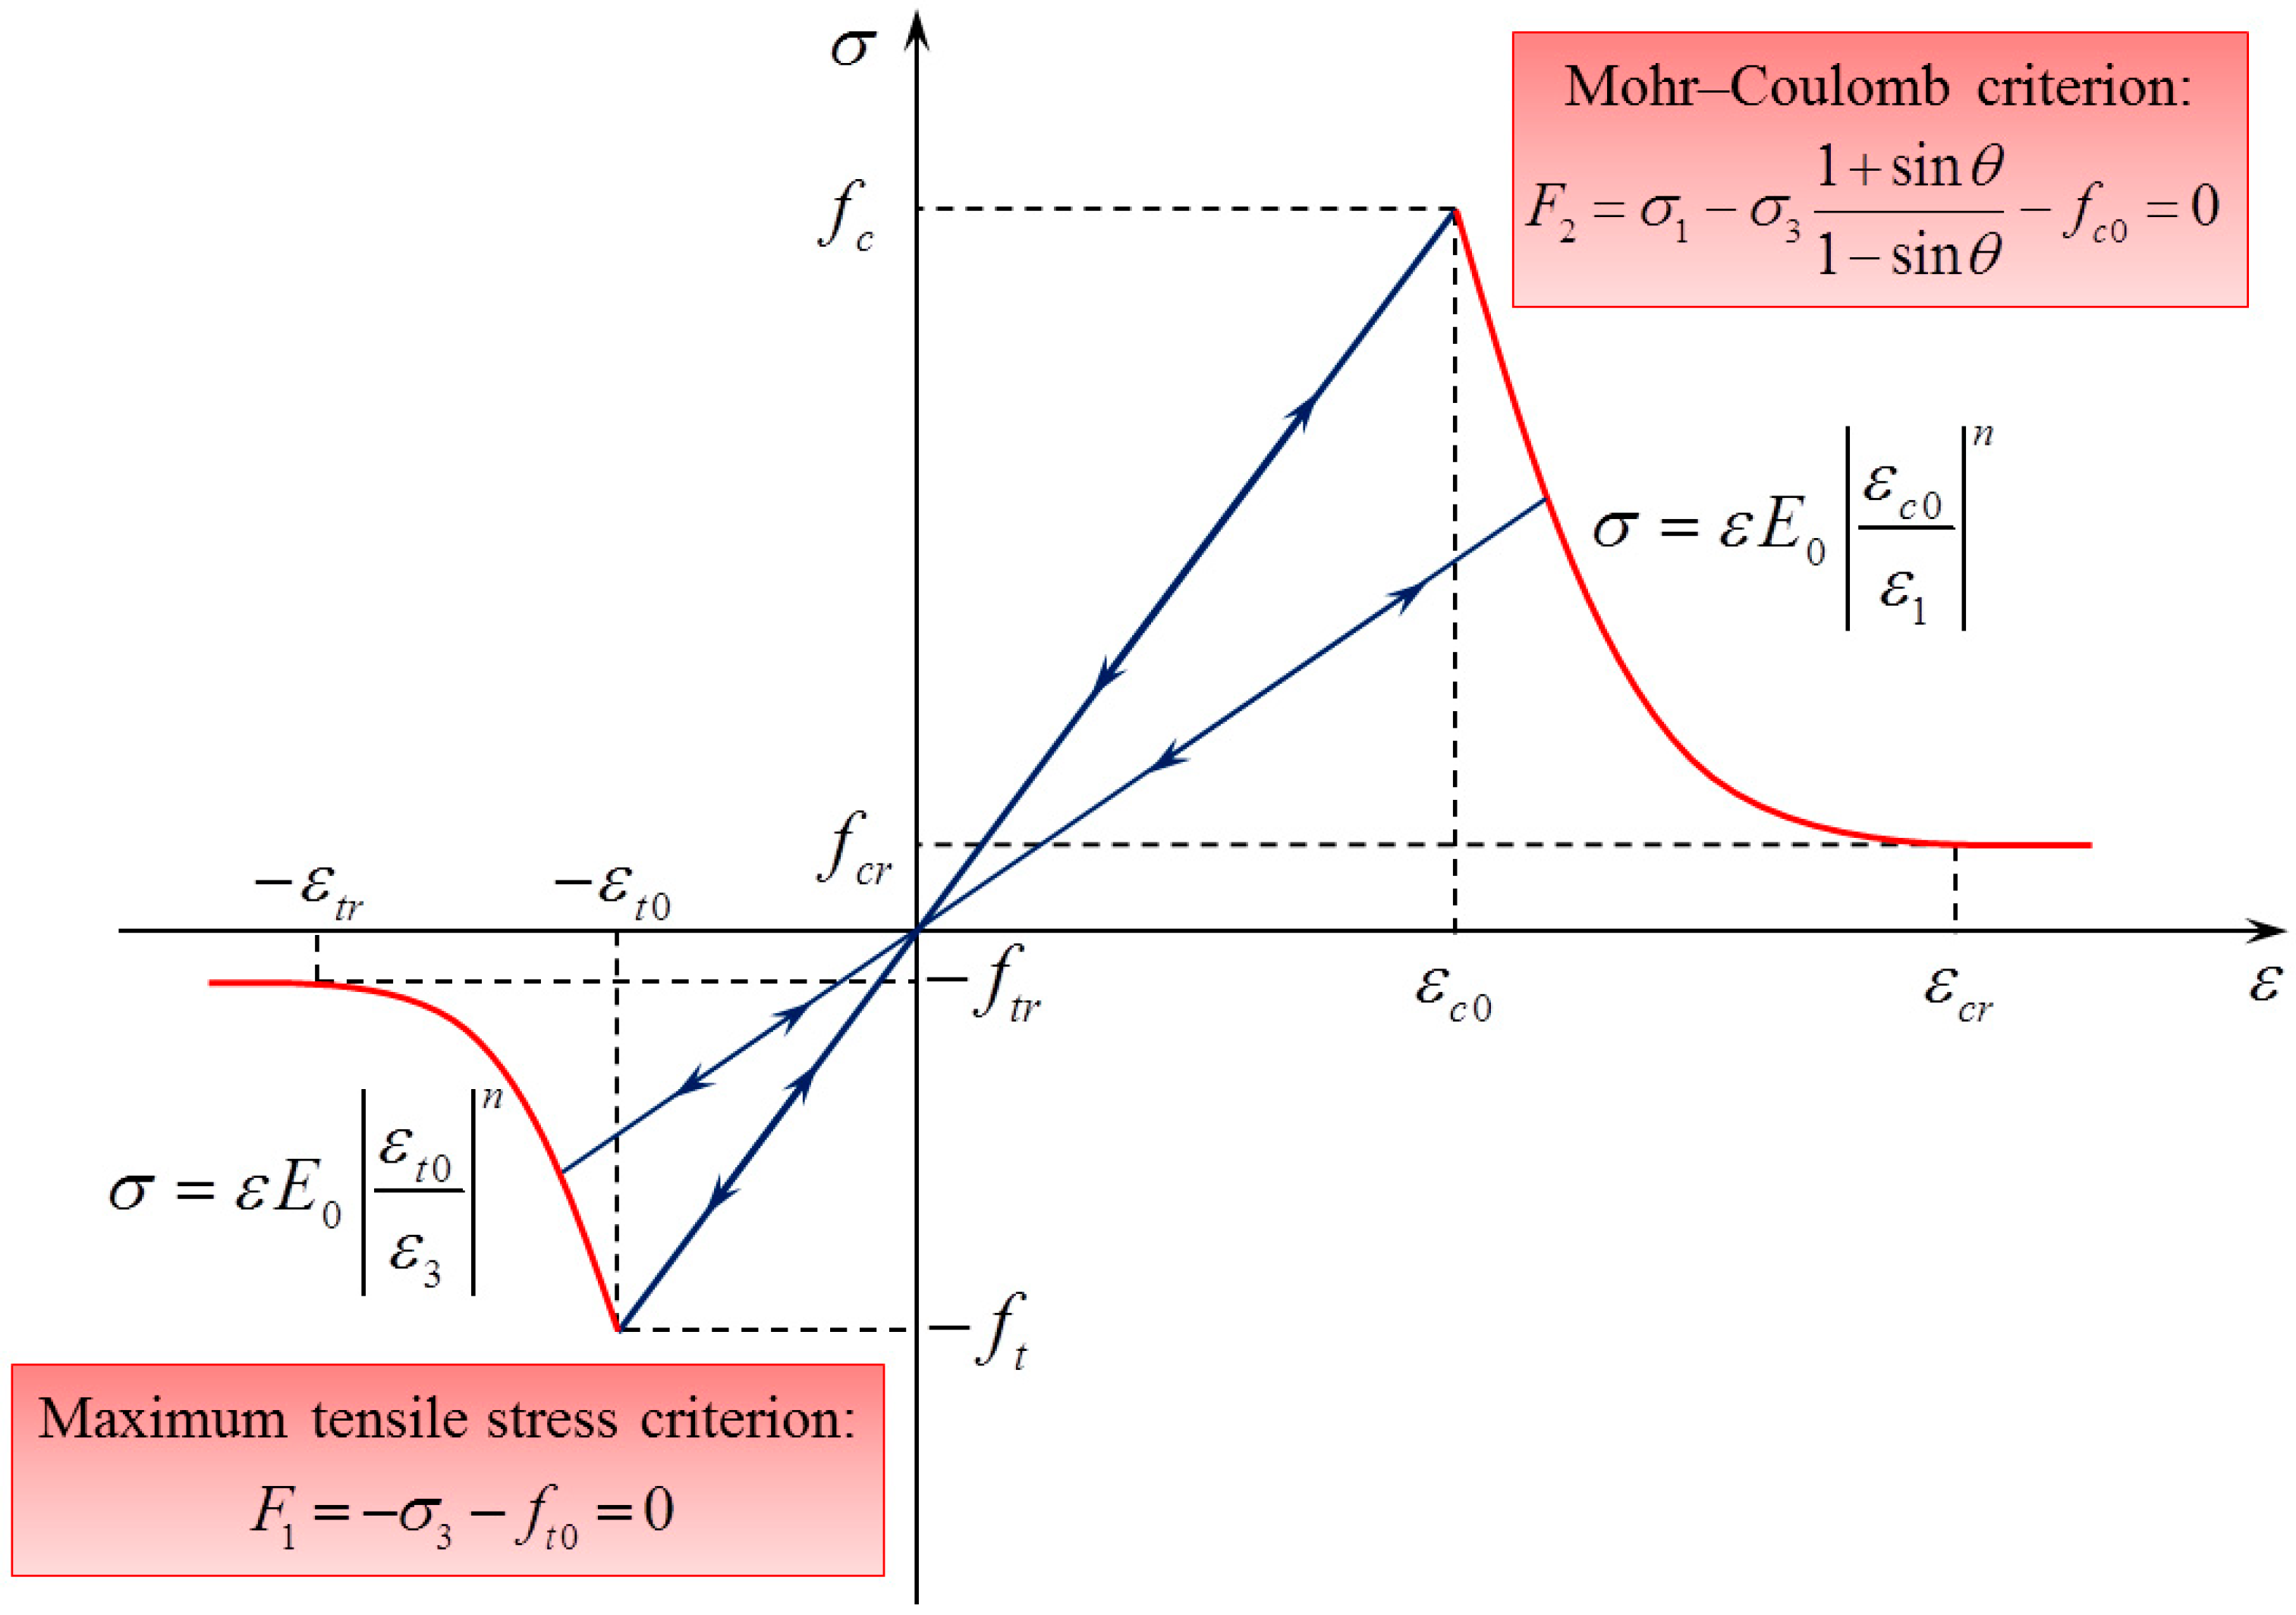
3.3. Governing Equations Accommodating Rock Heterogeneity and Damage Evolution
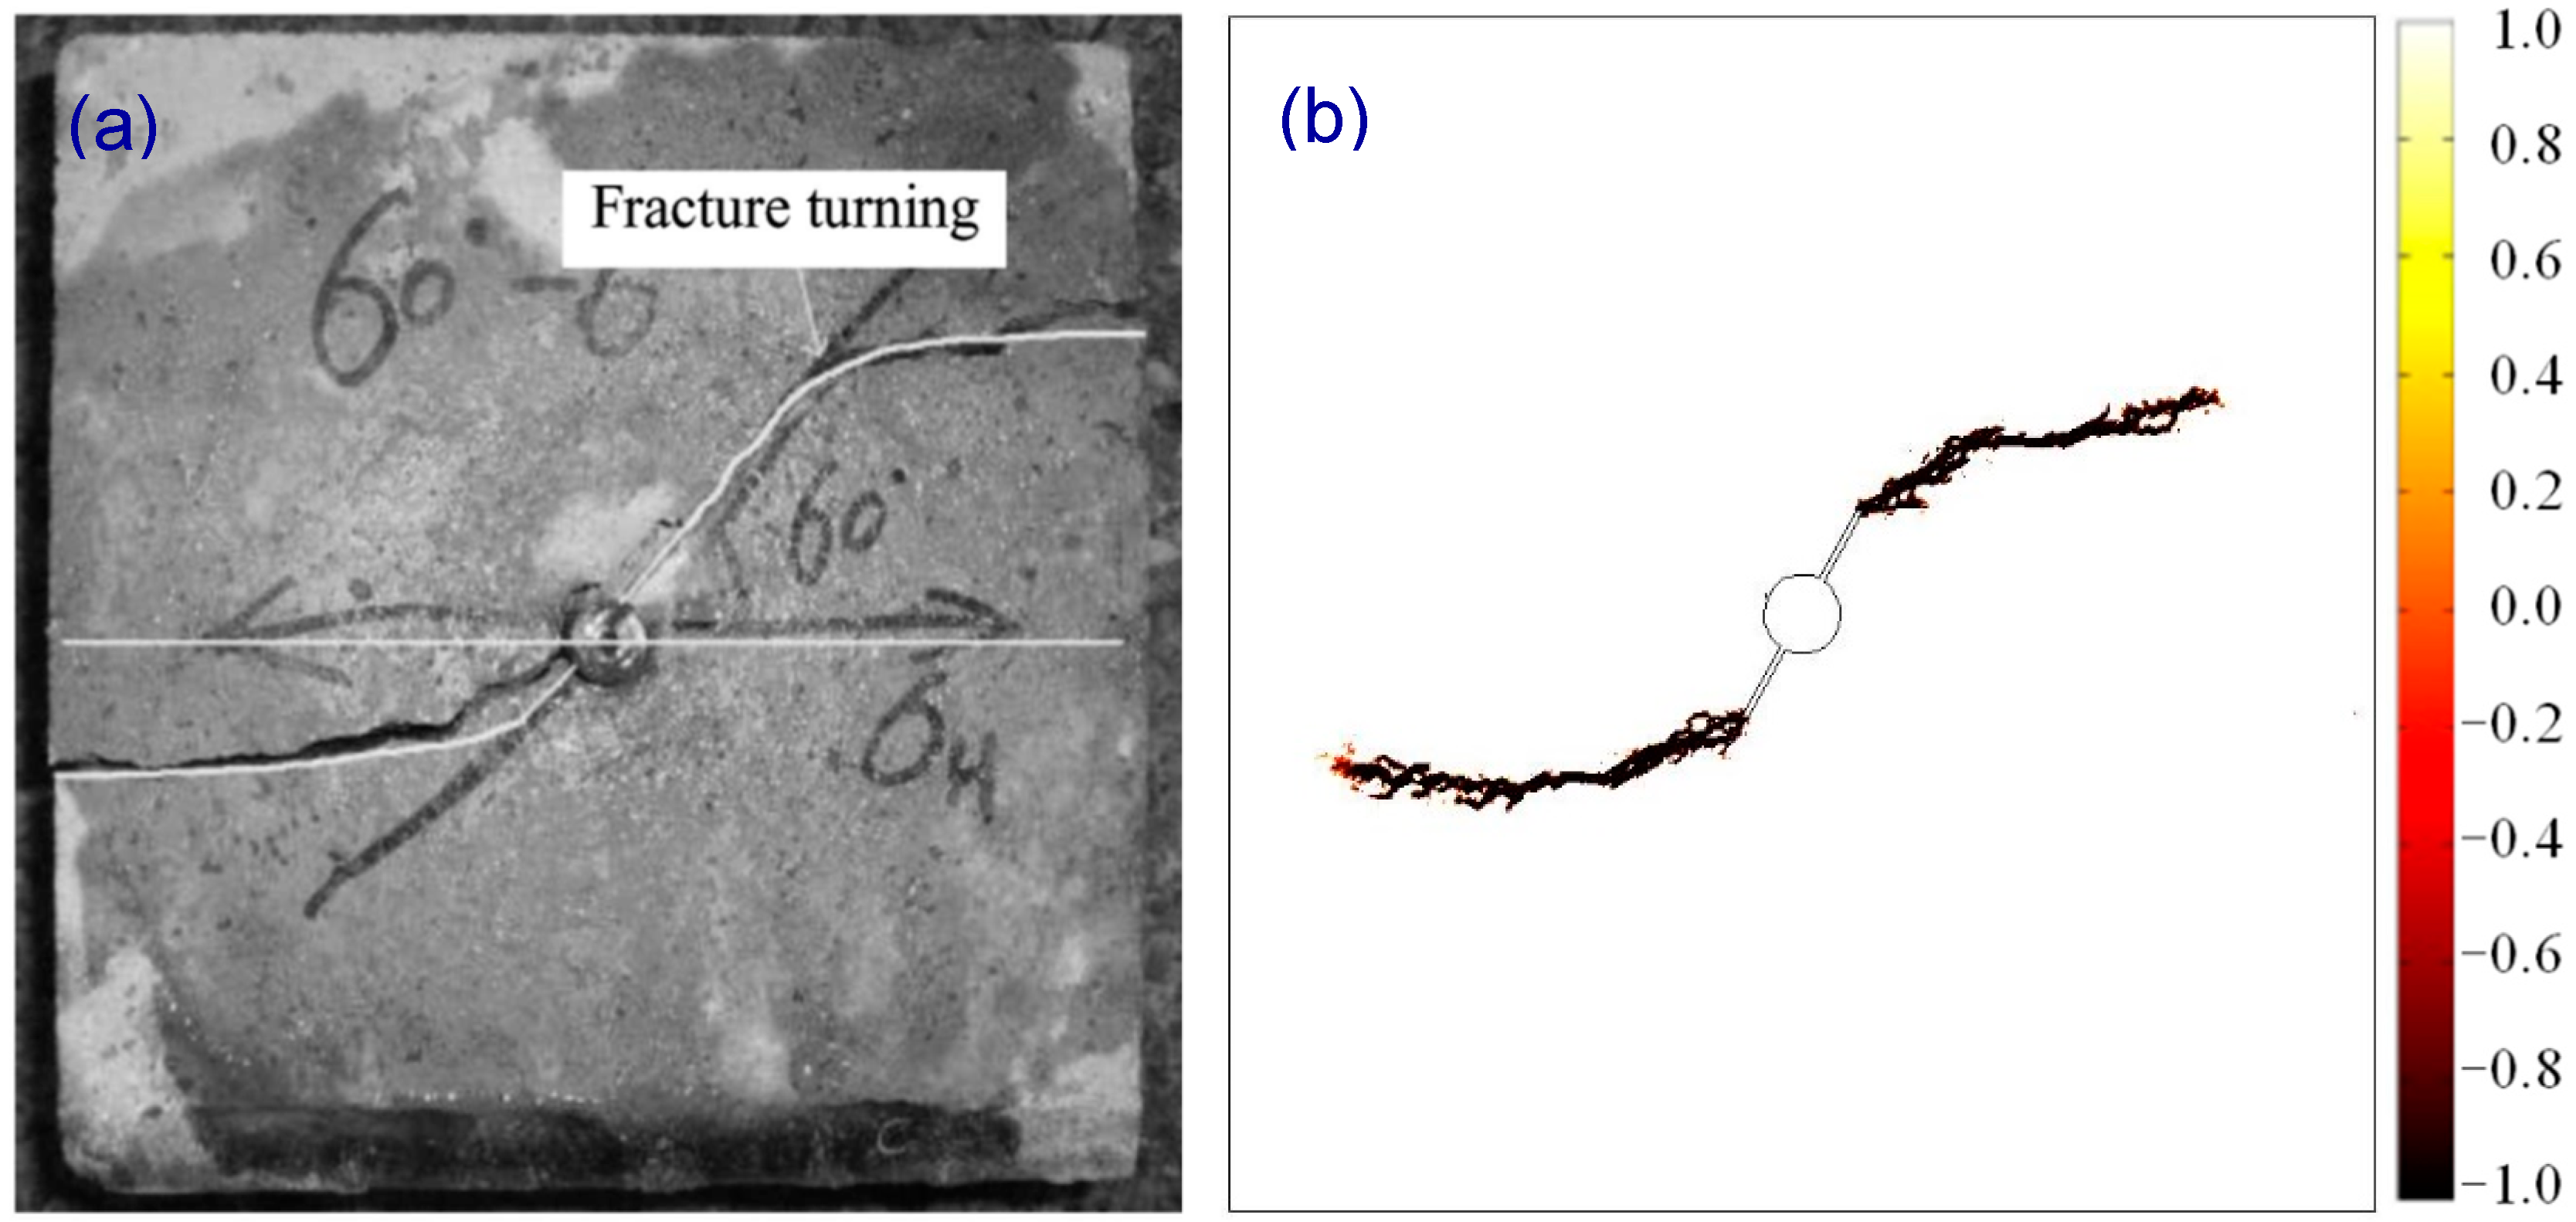
4. Model Validation against Experimental Observations
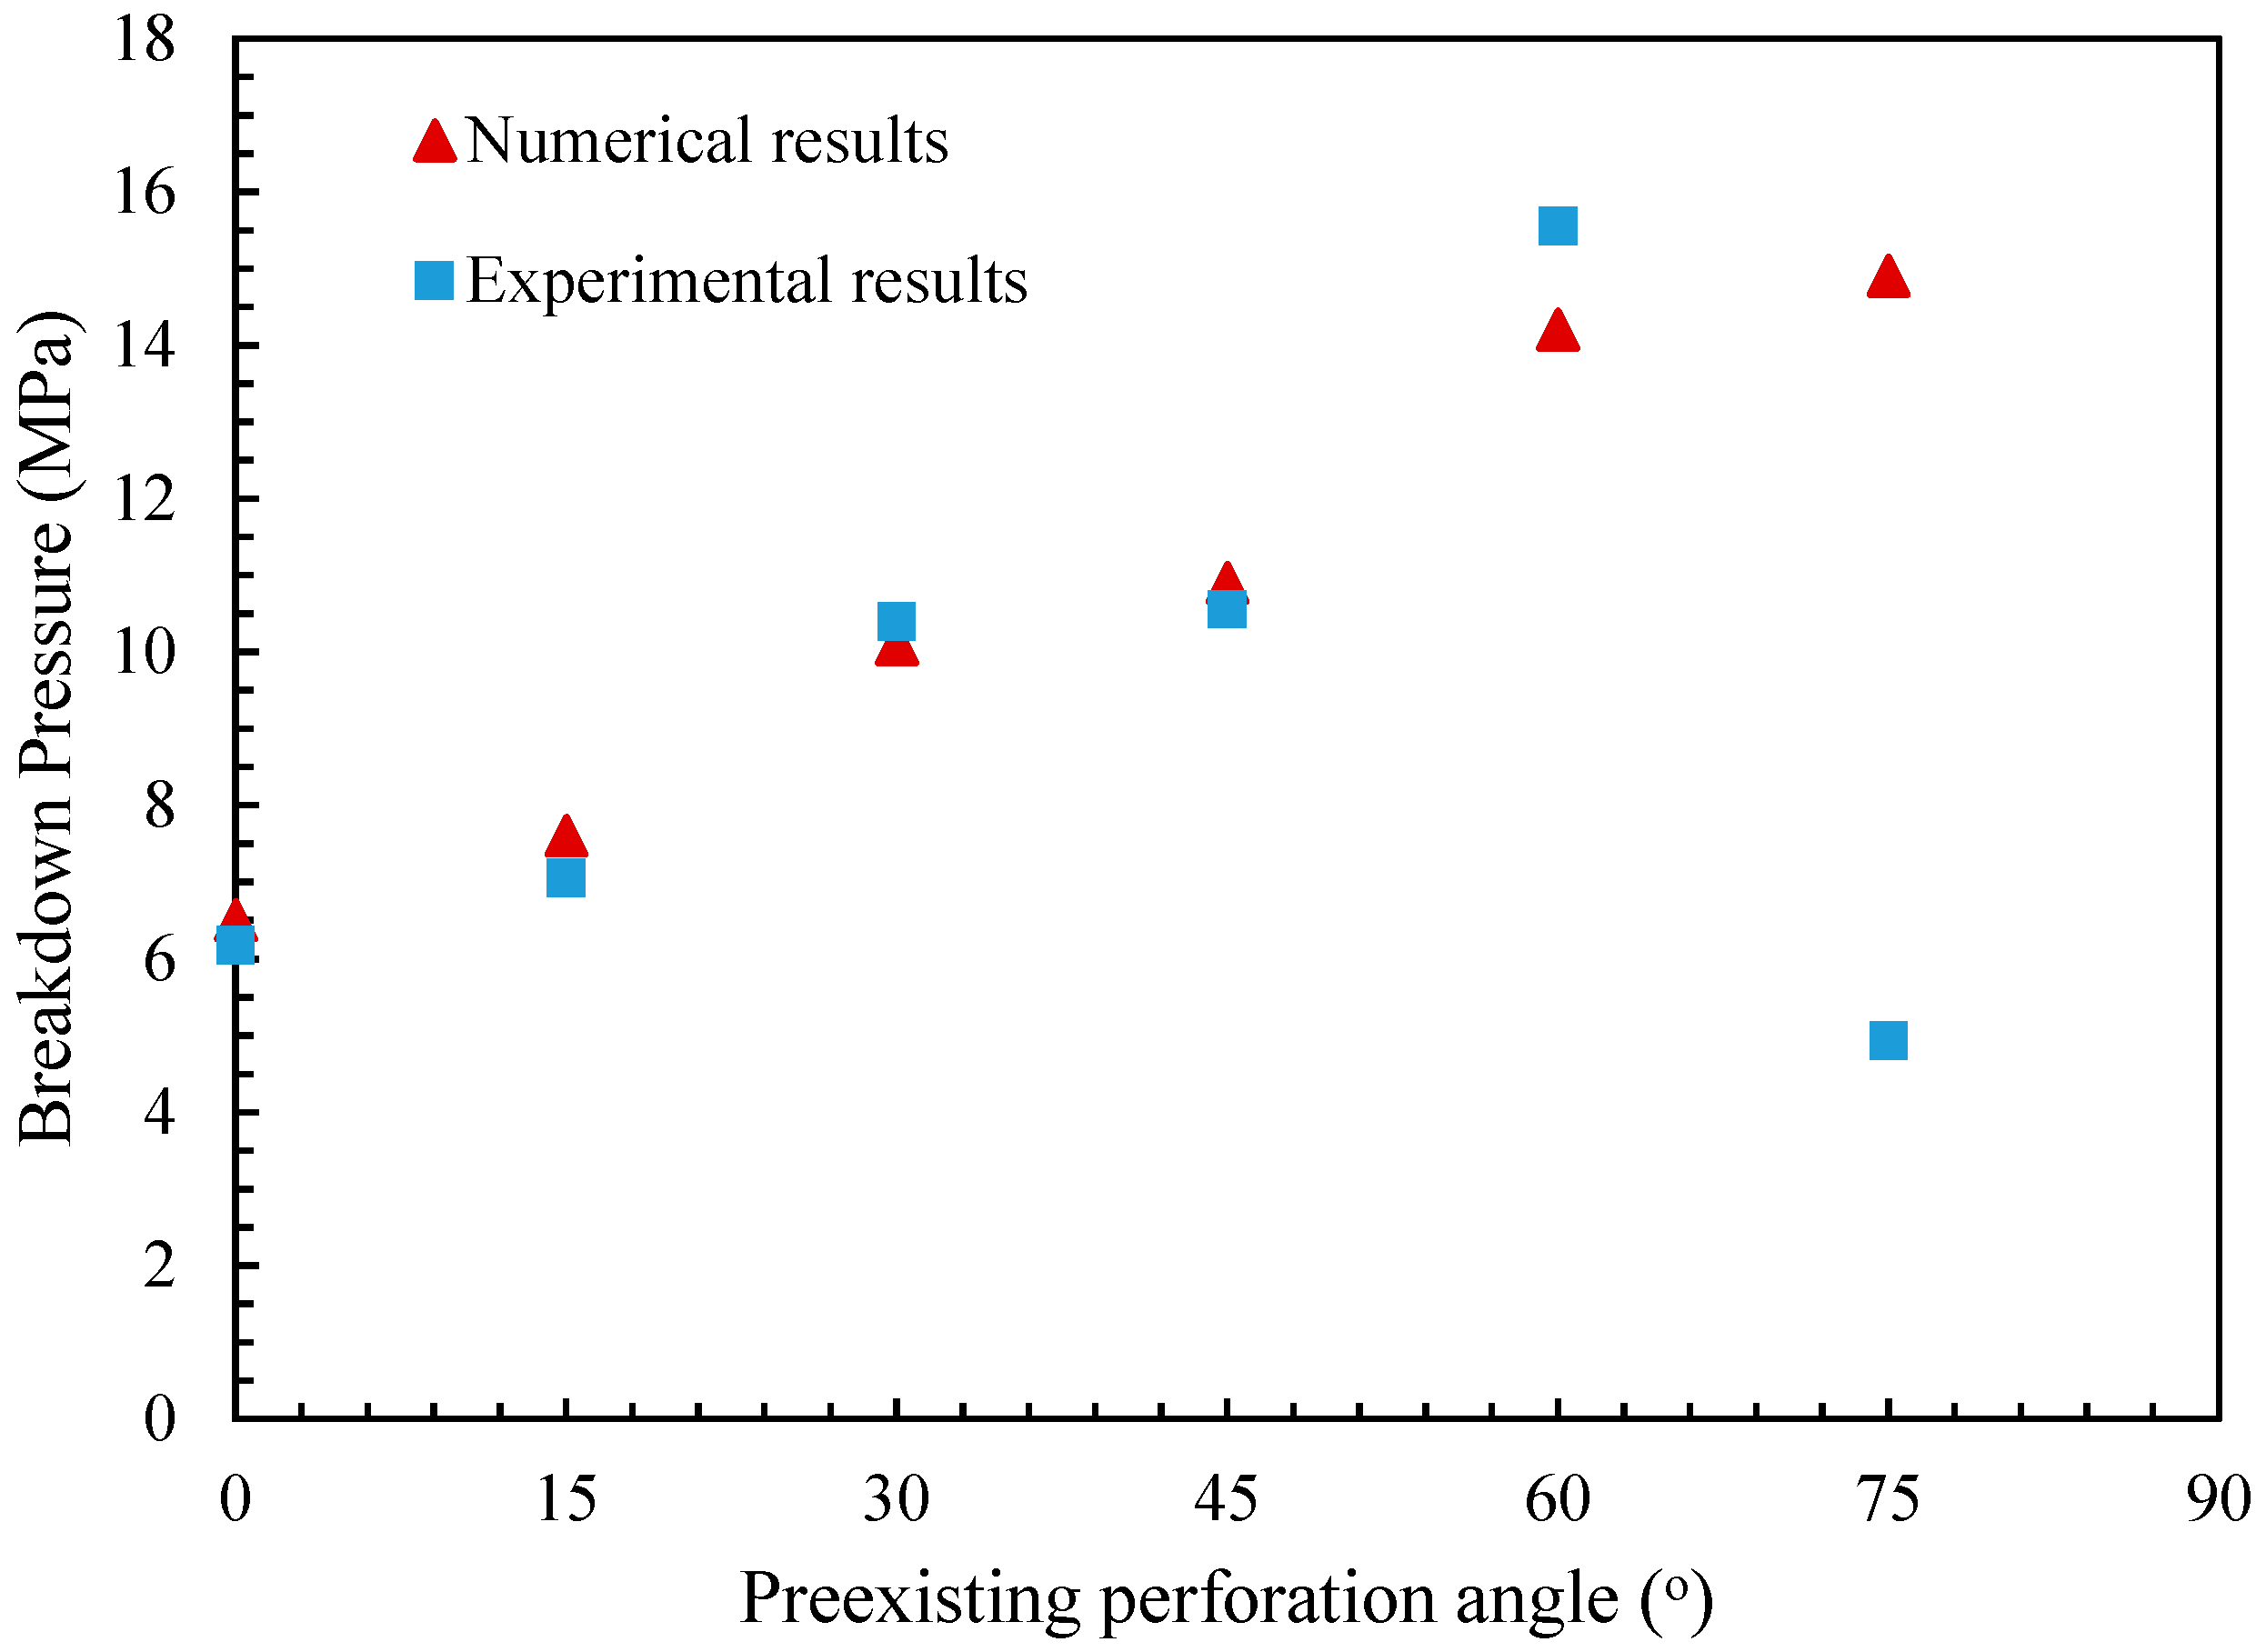
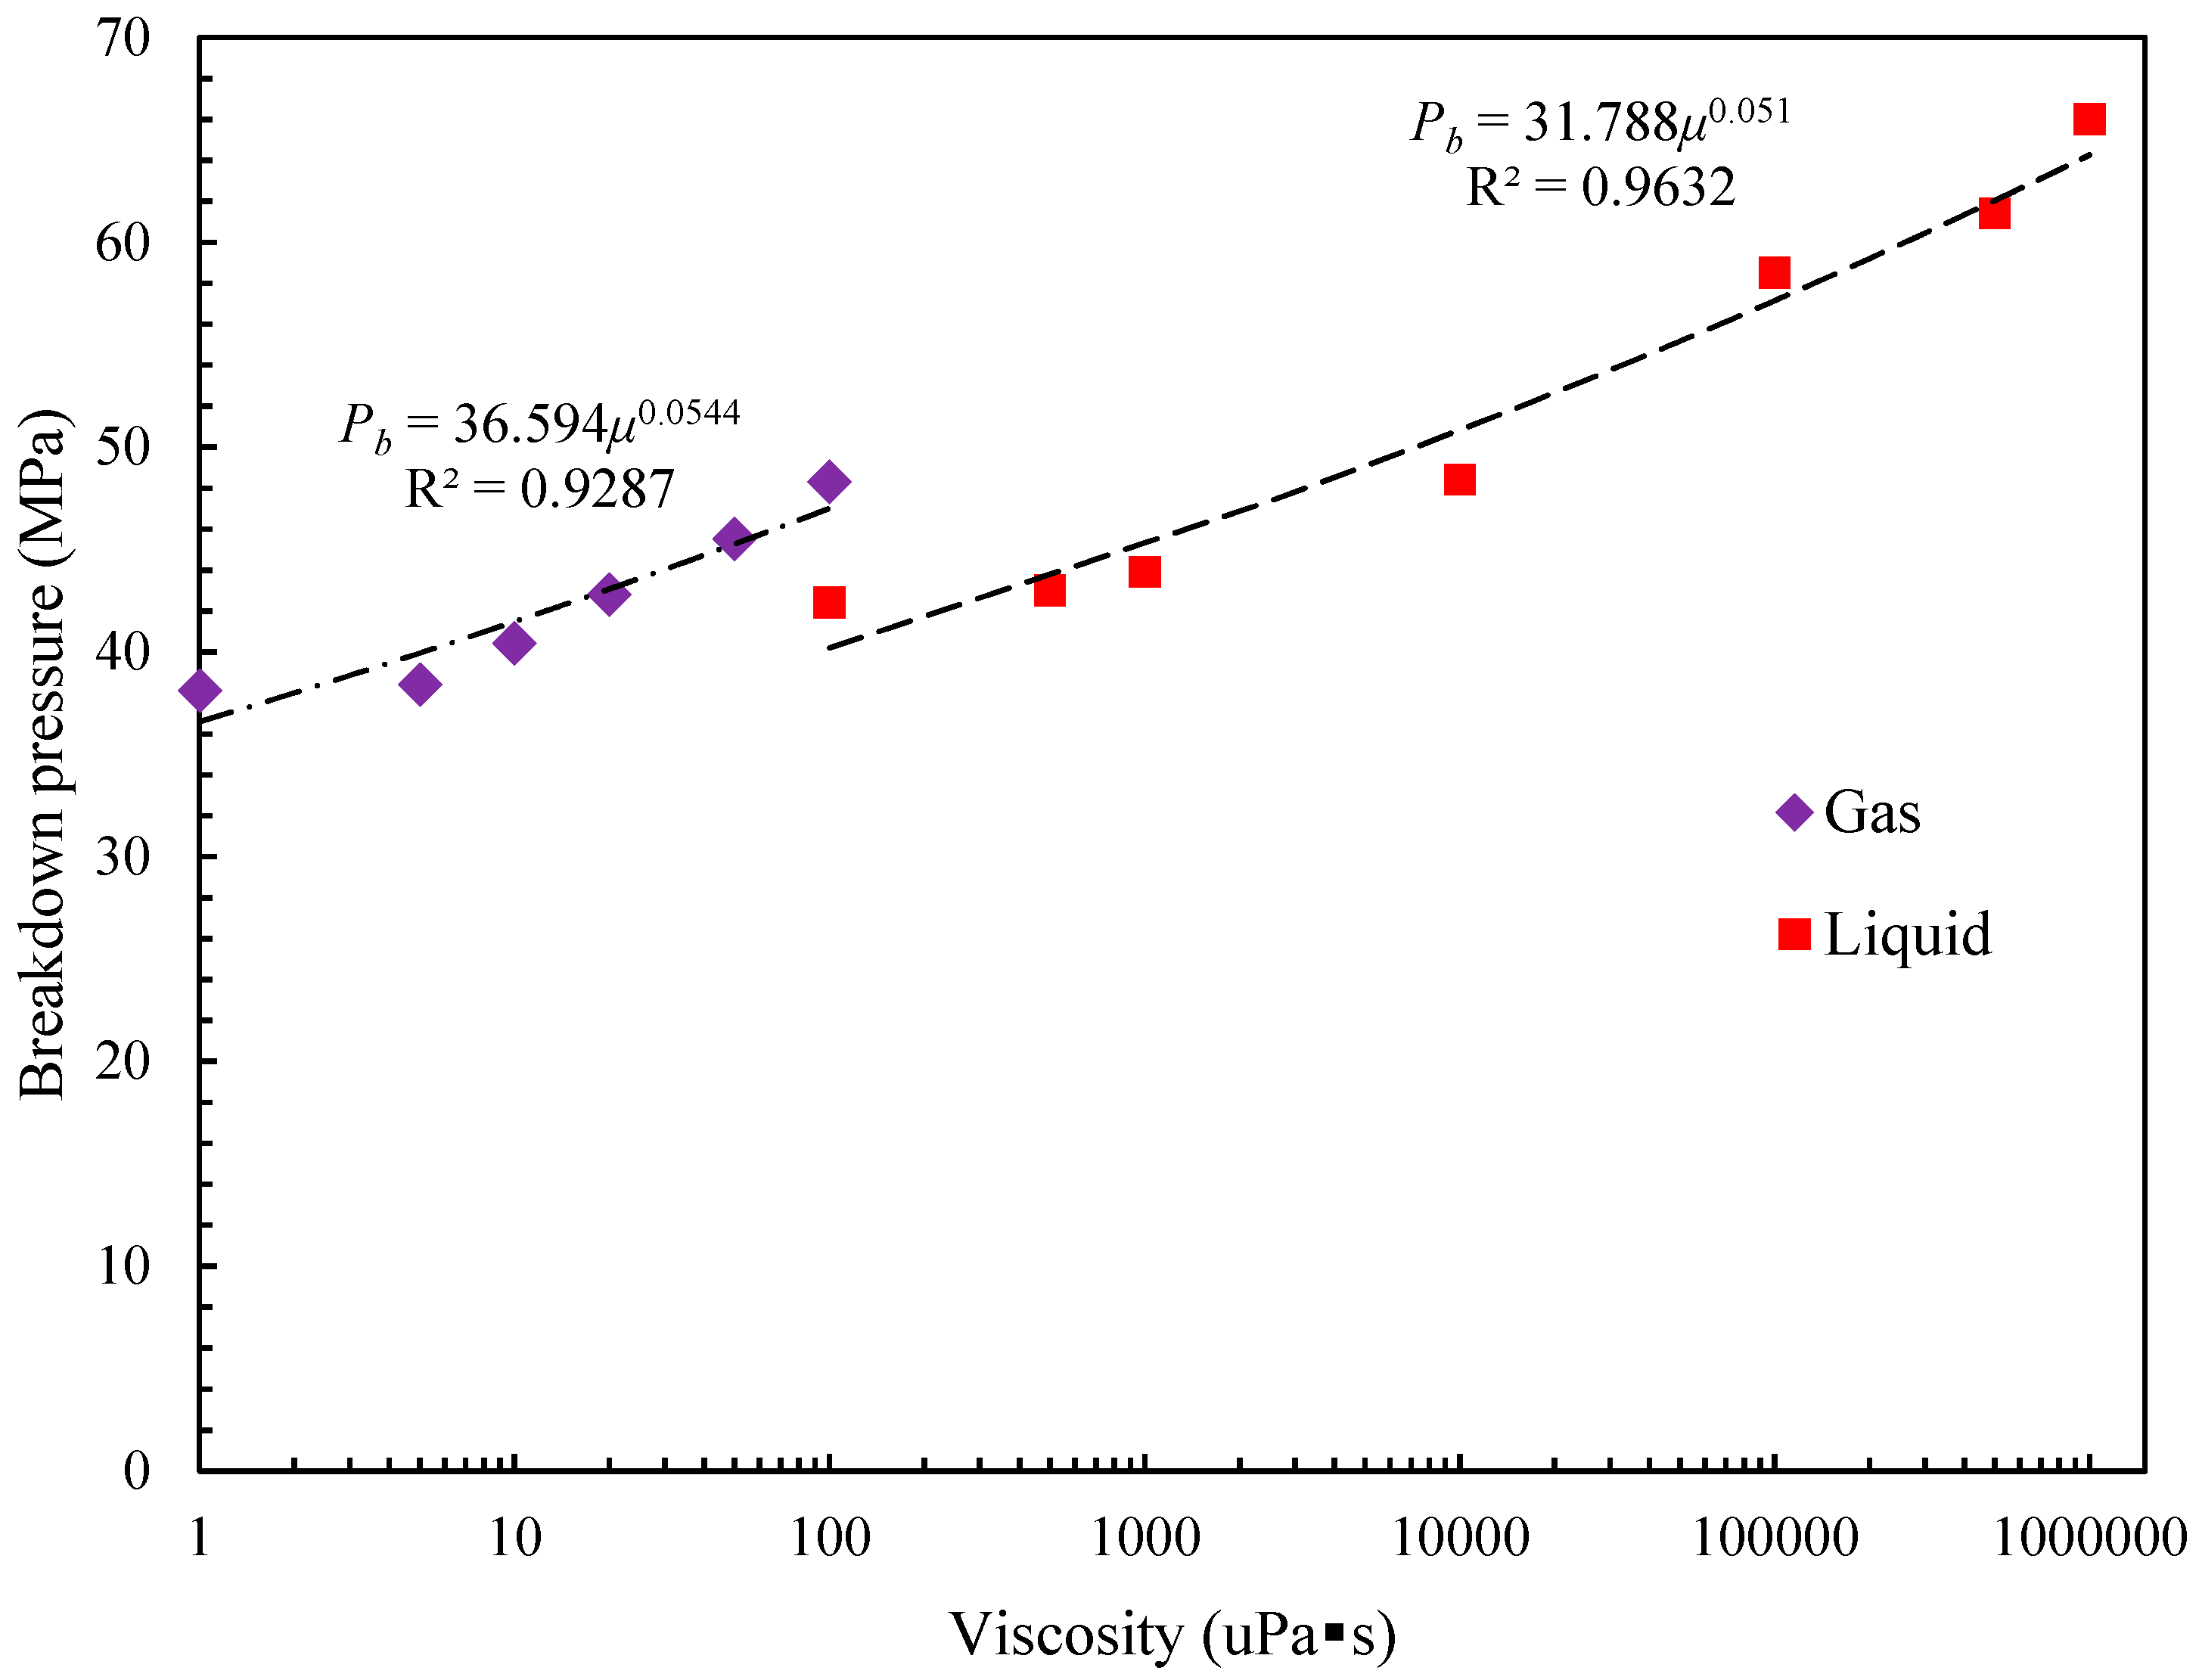
4.1. Comparisons of Breakdown Pressure and Fracture Geometry
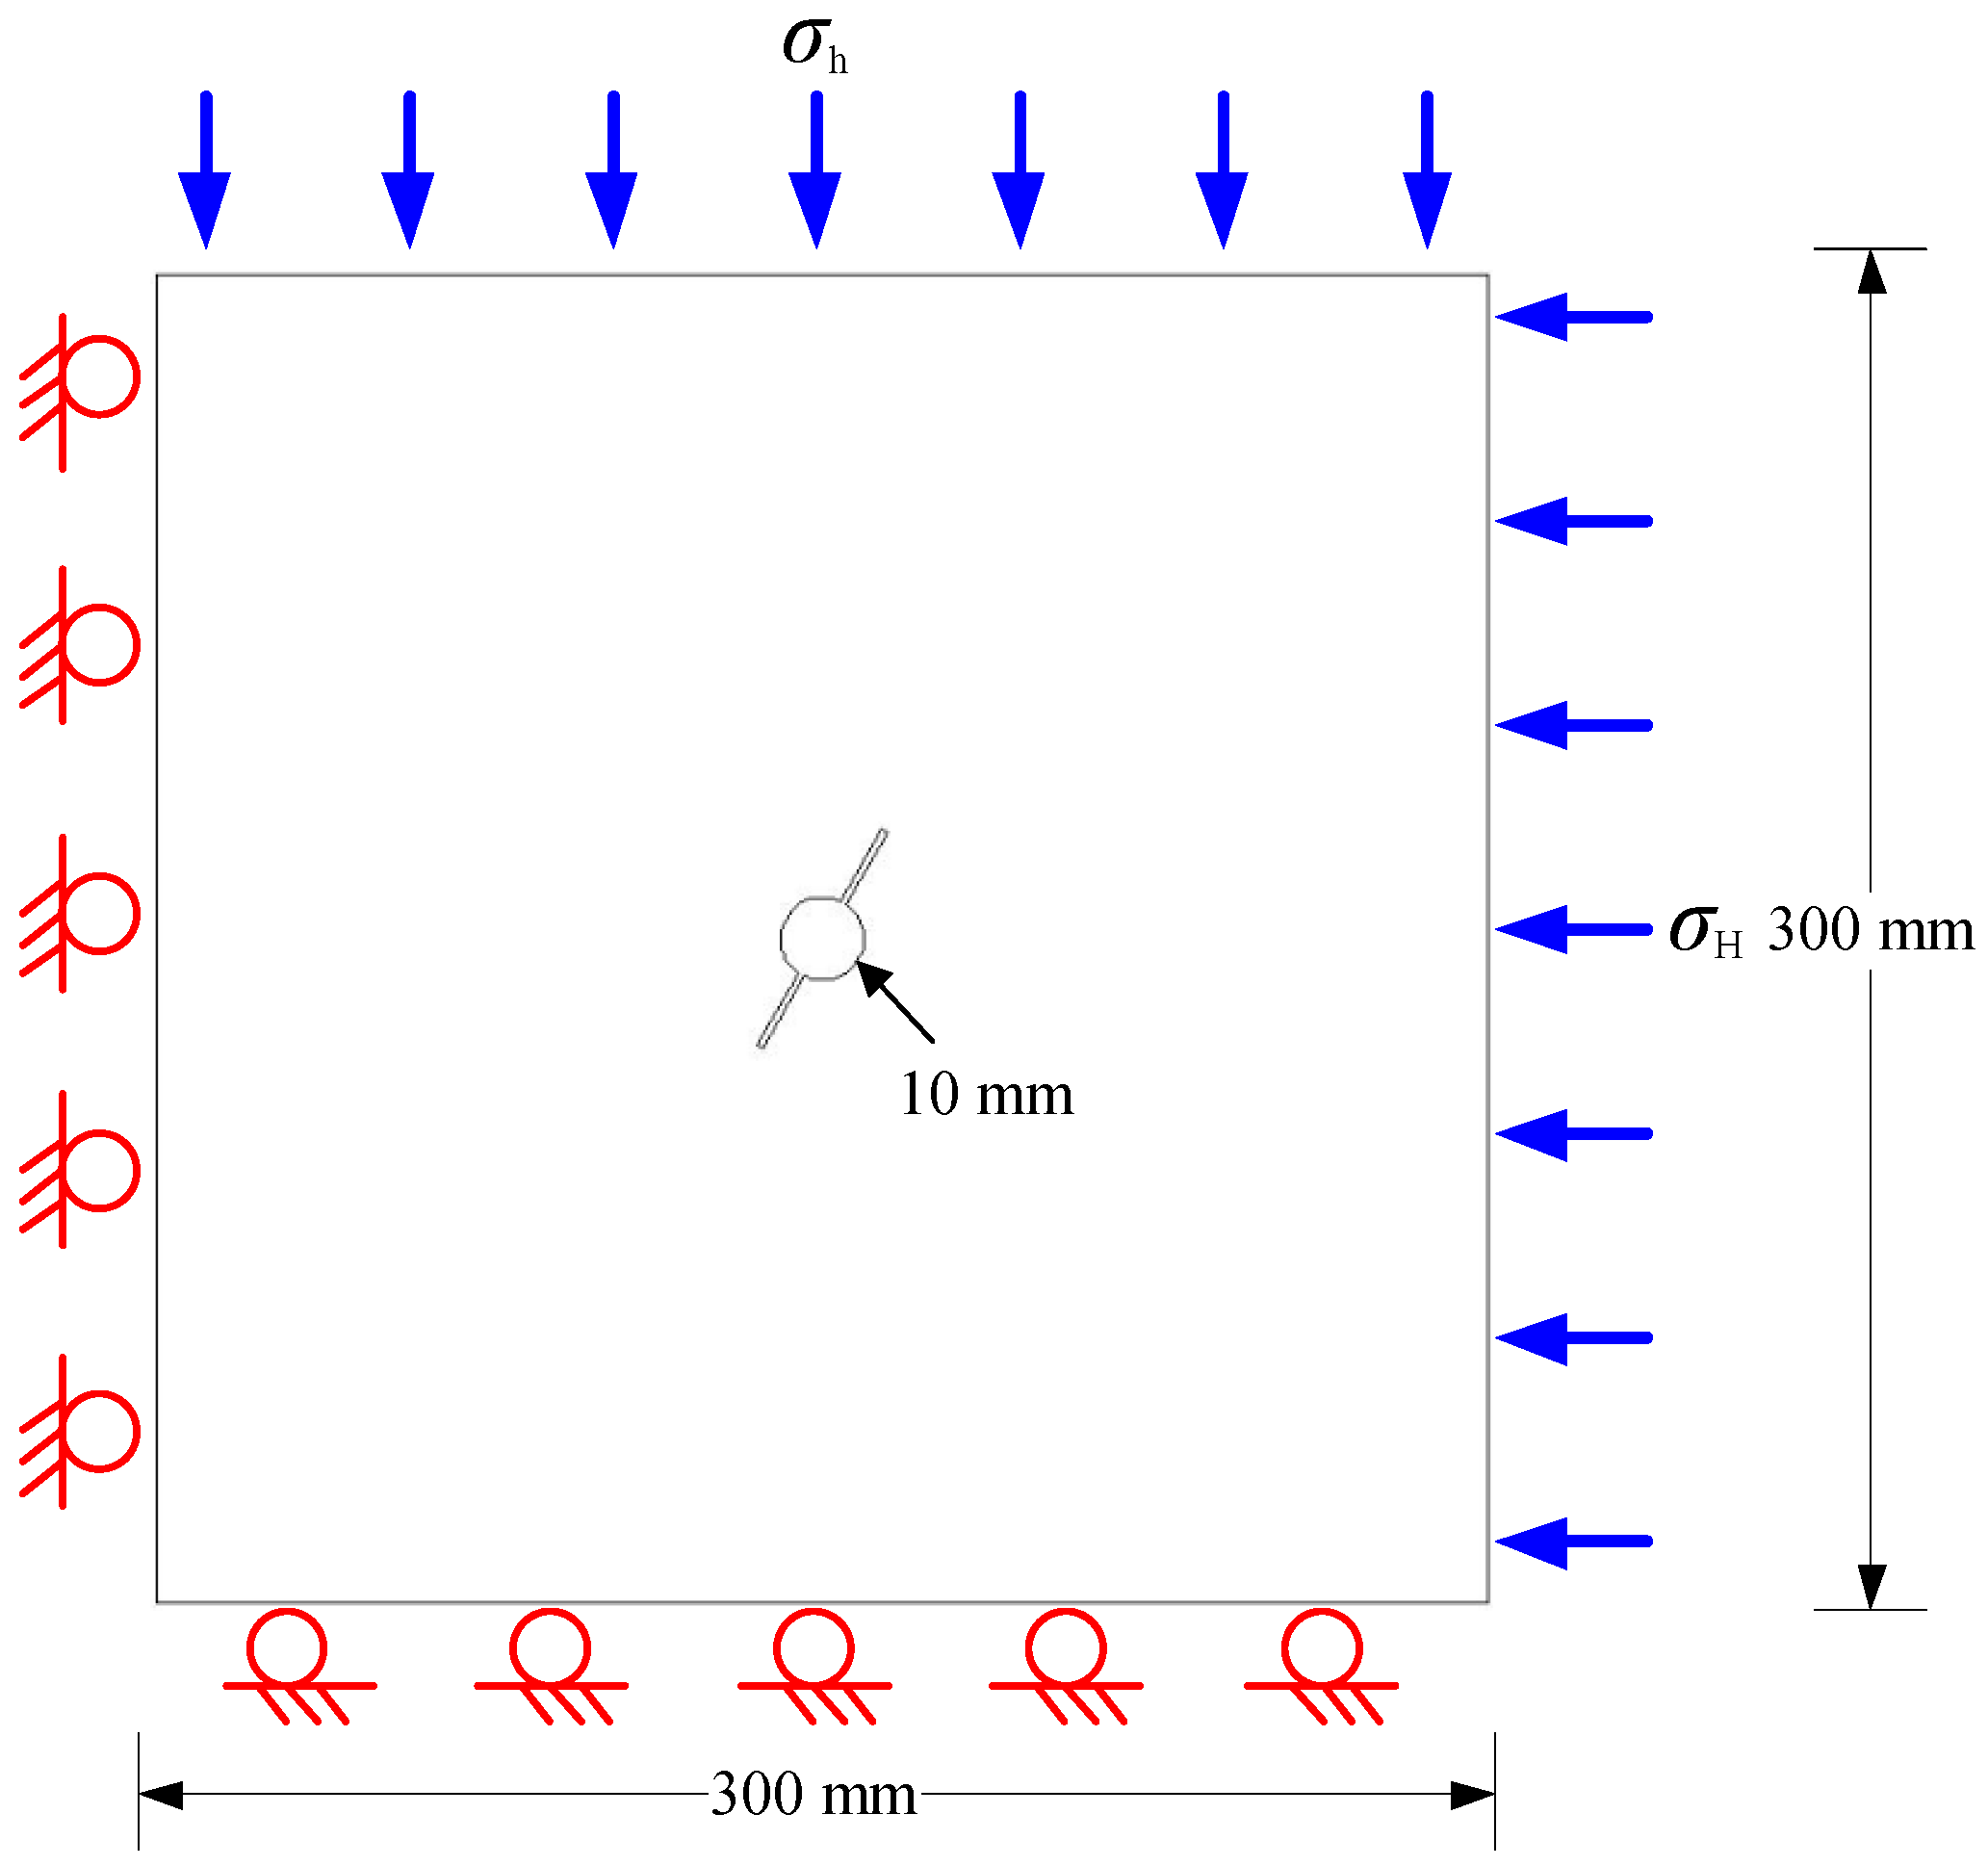
4.2. Geometric Model and Boundary Conditions
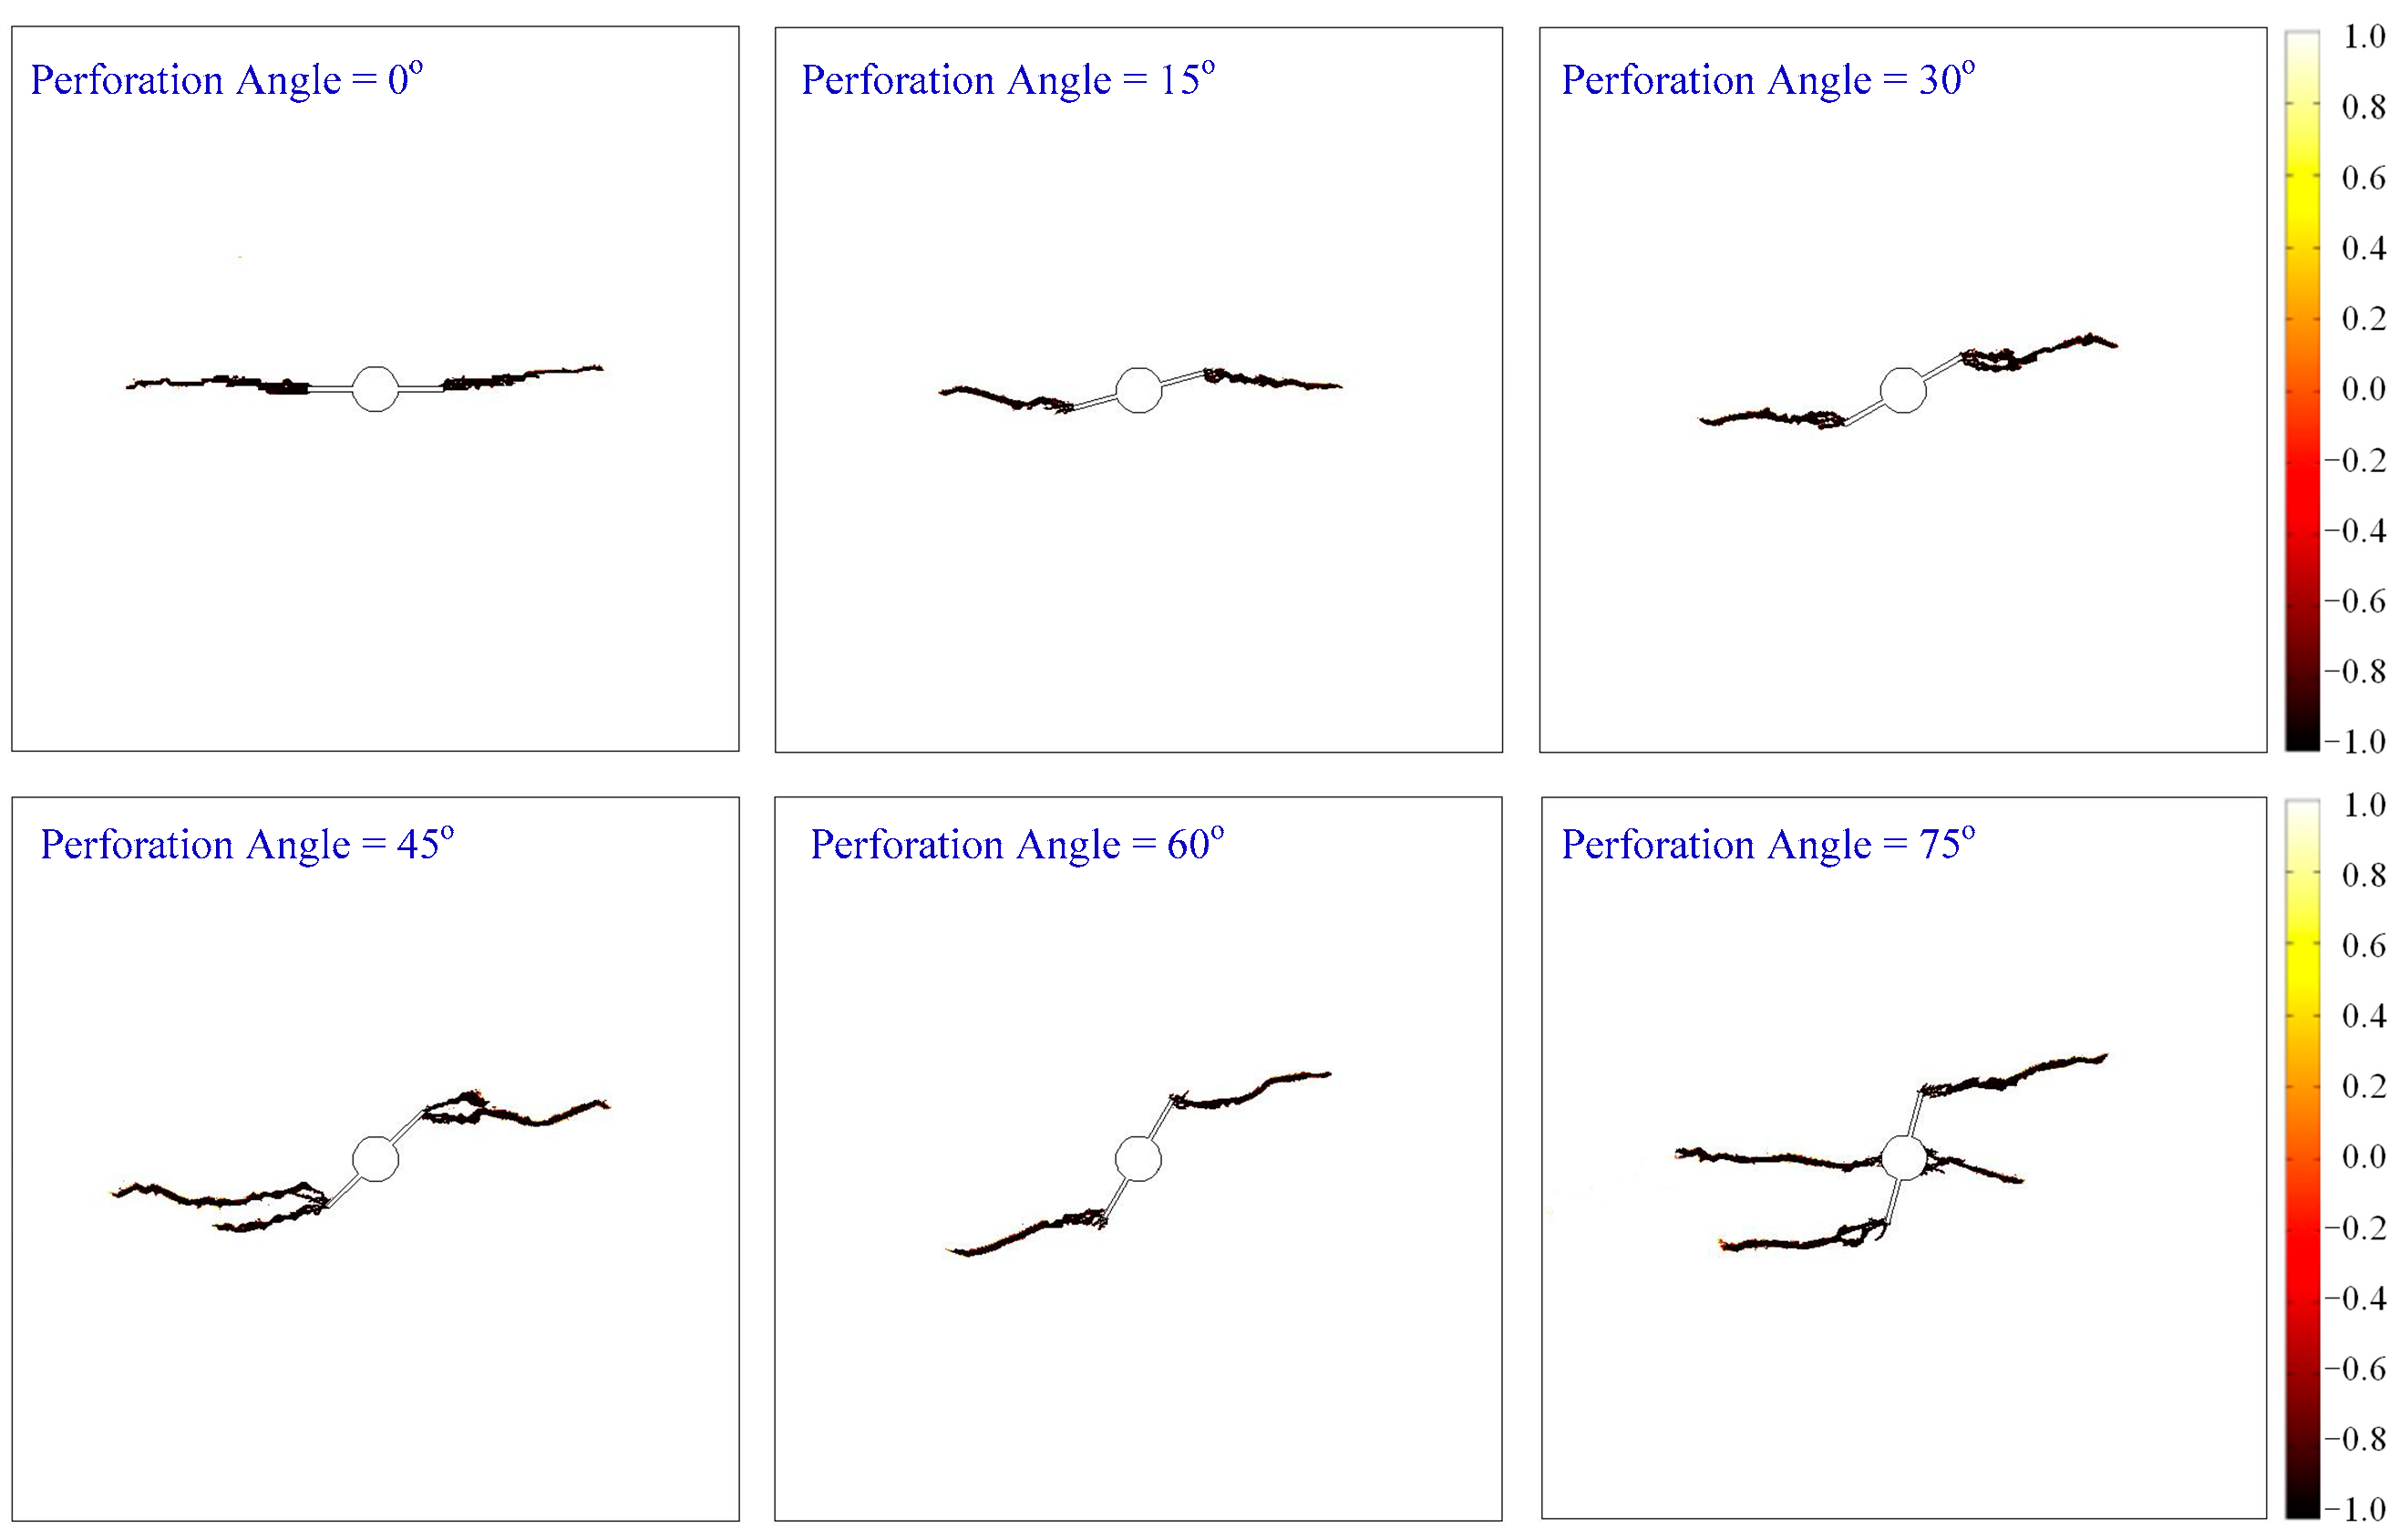
4.3. Effects of Preexisting Perforation Orientation
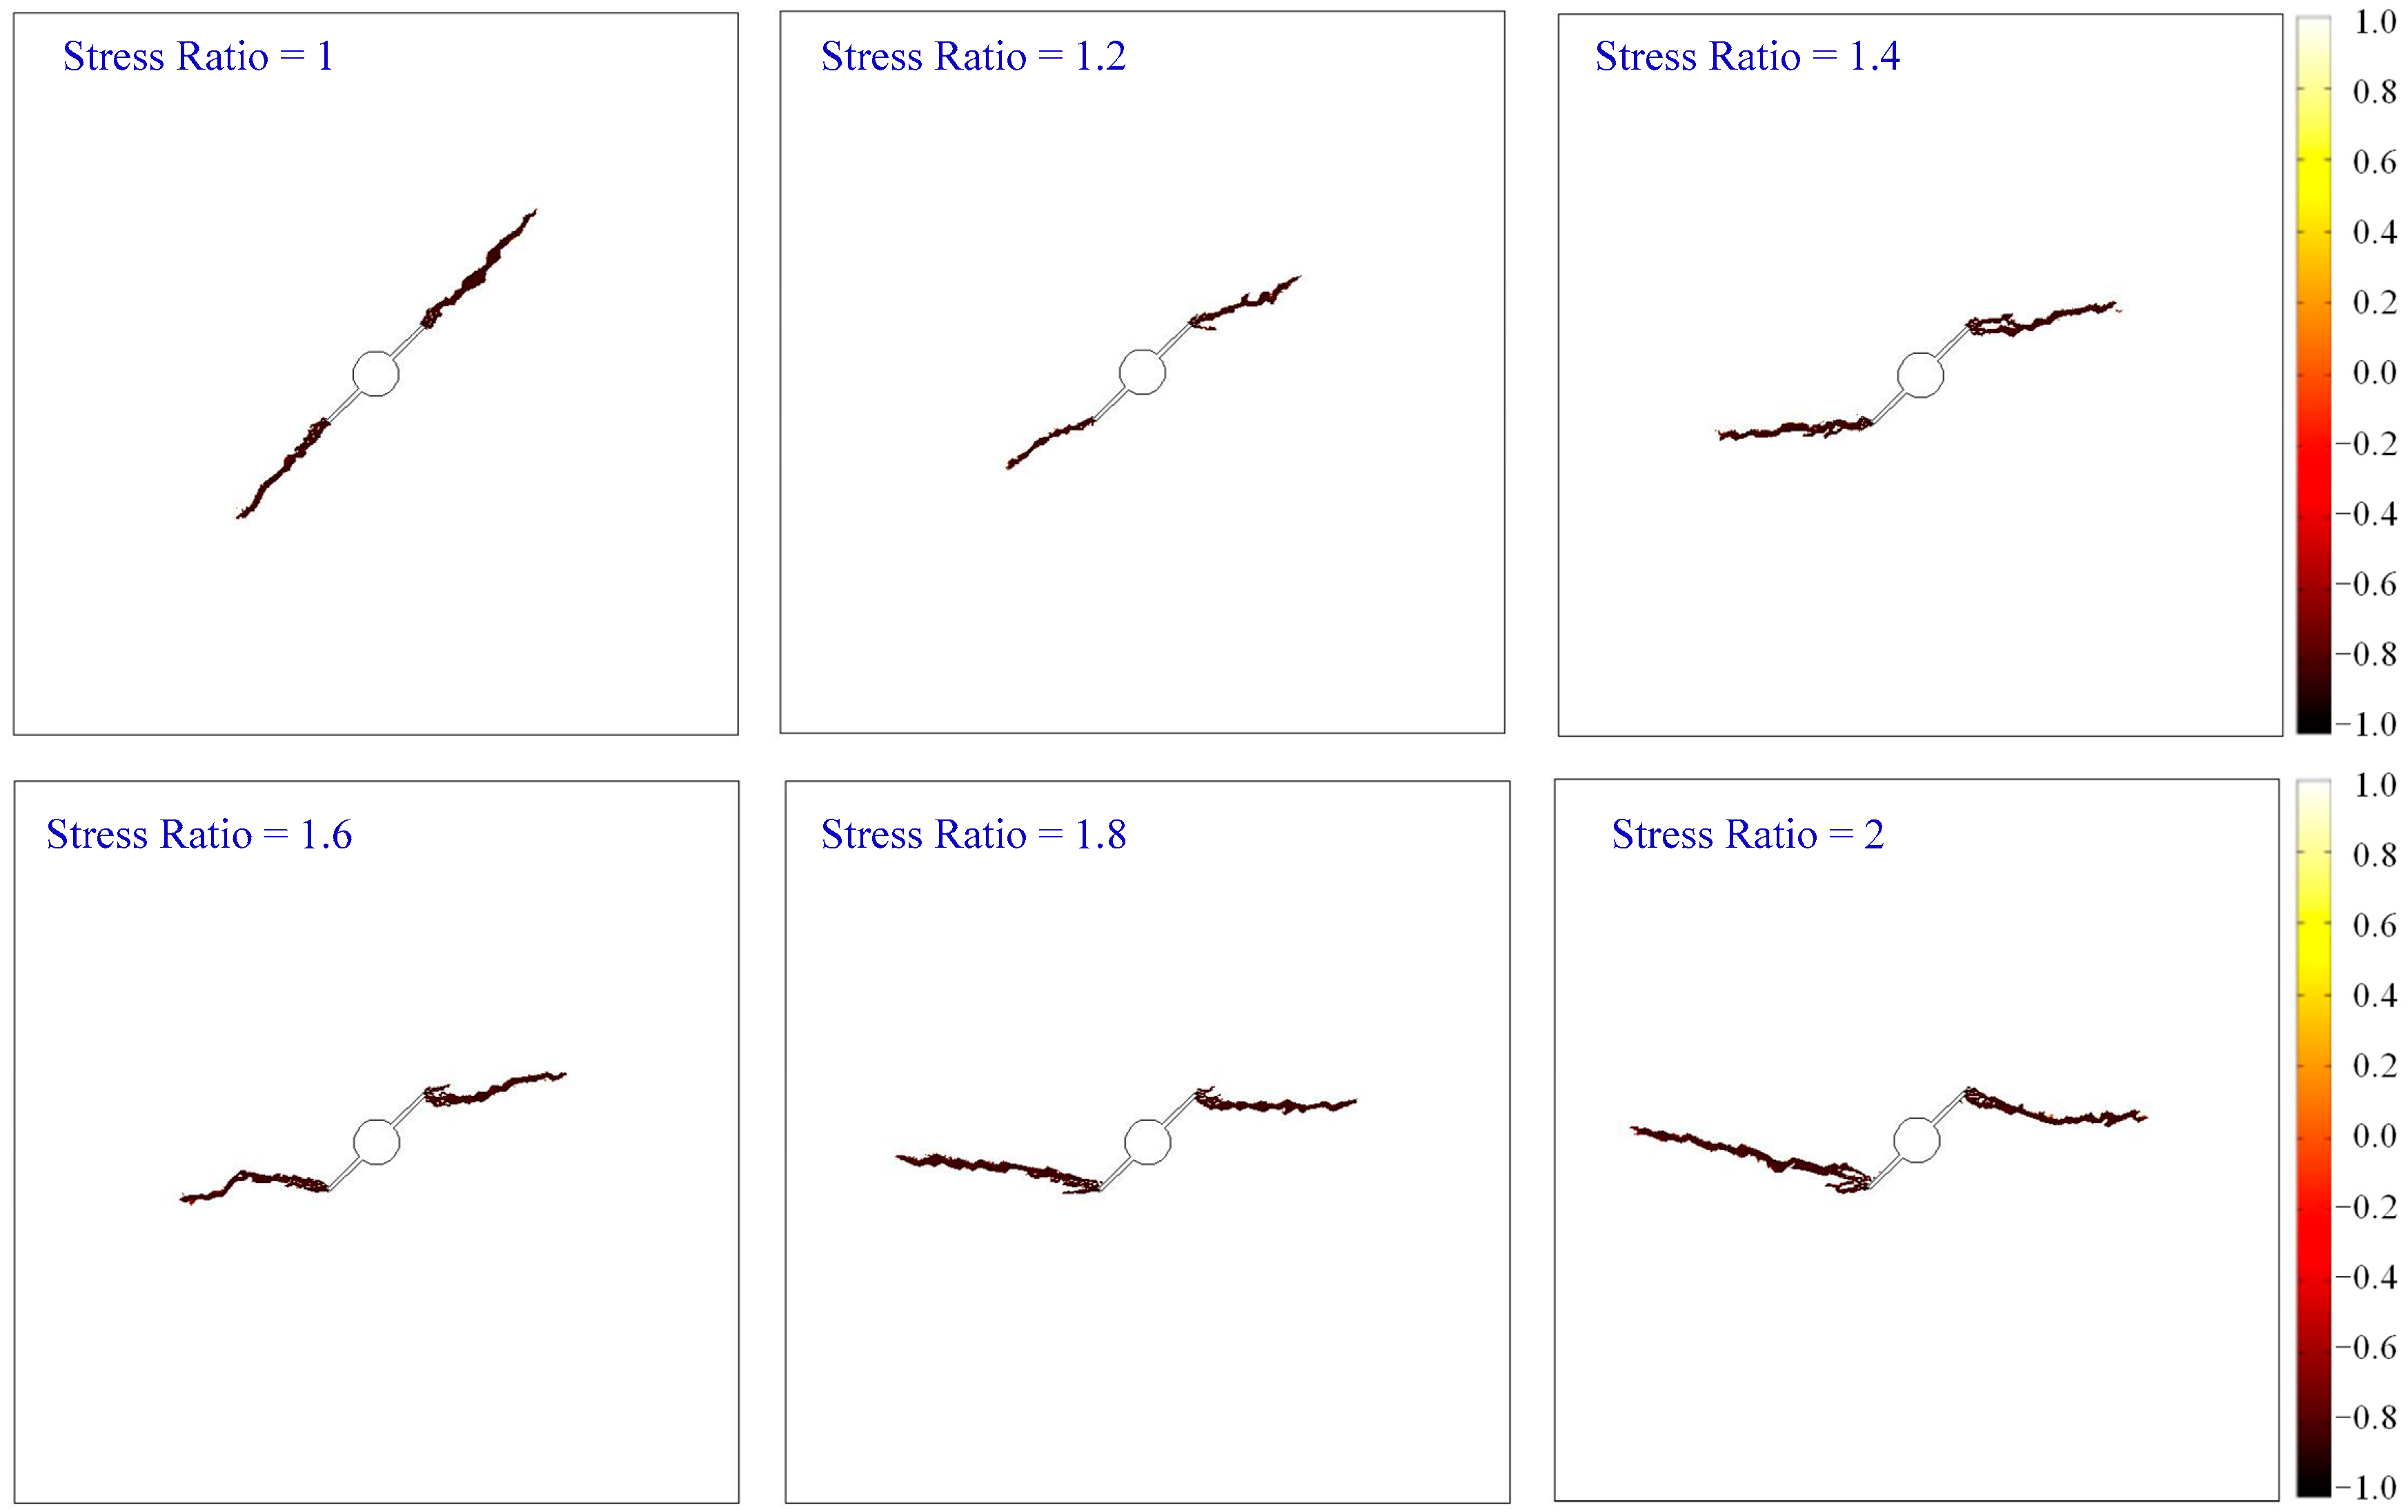
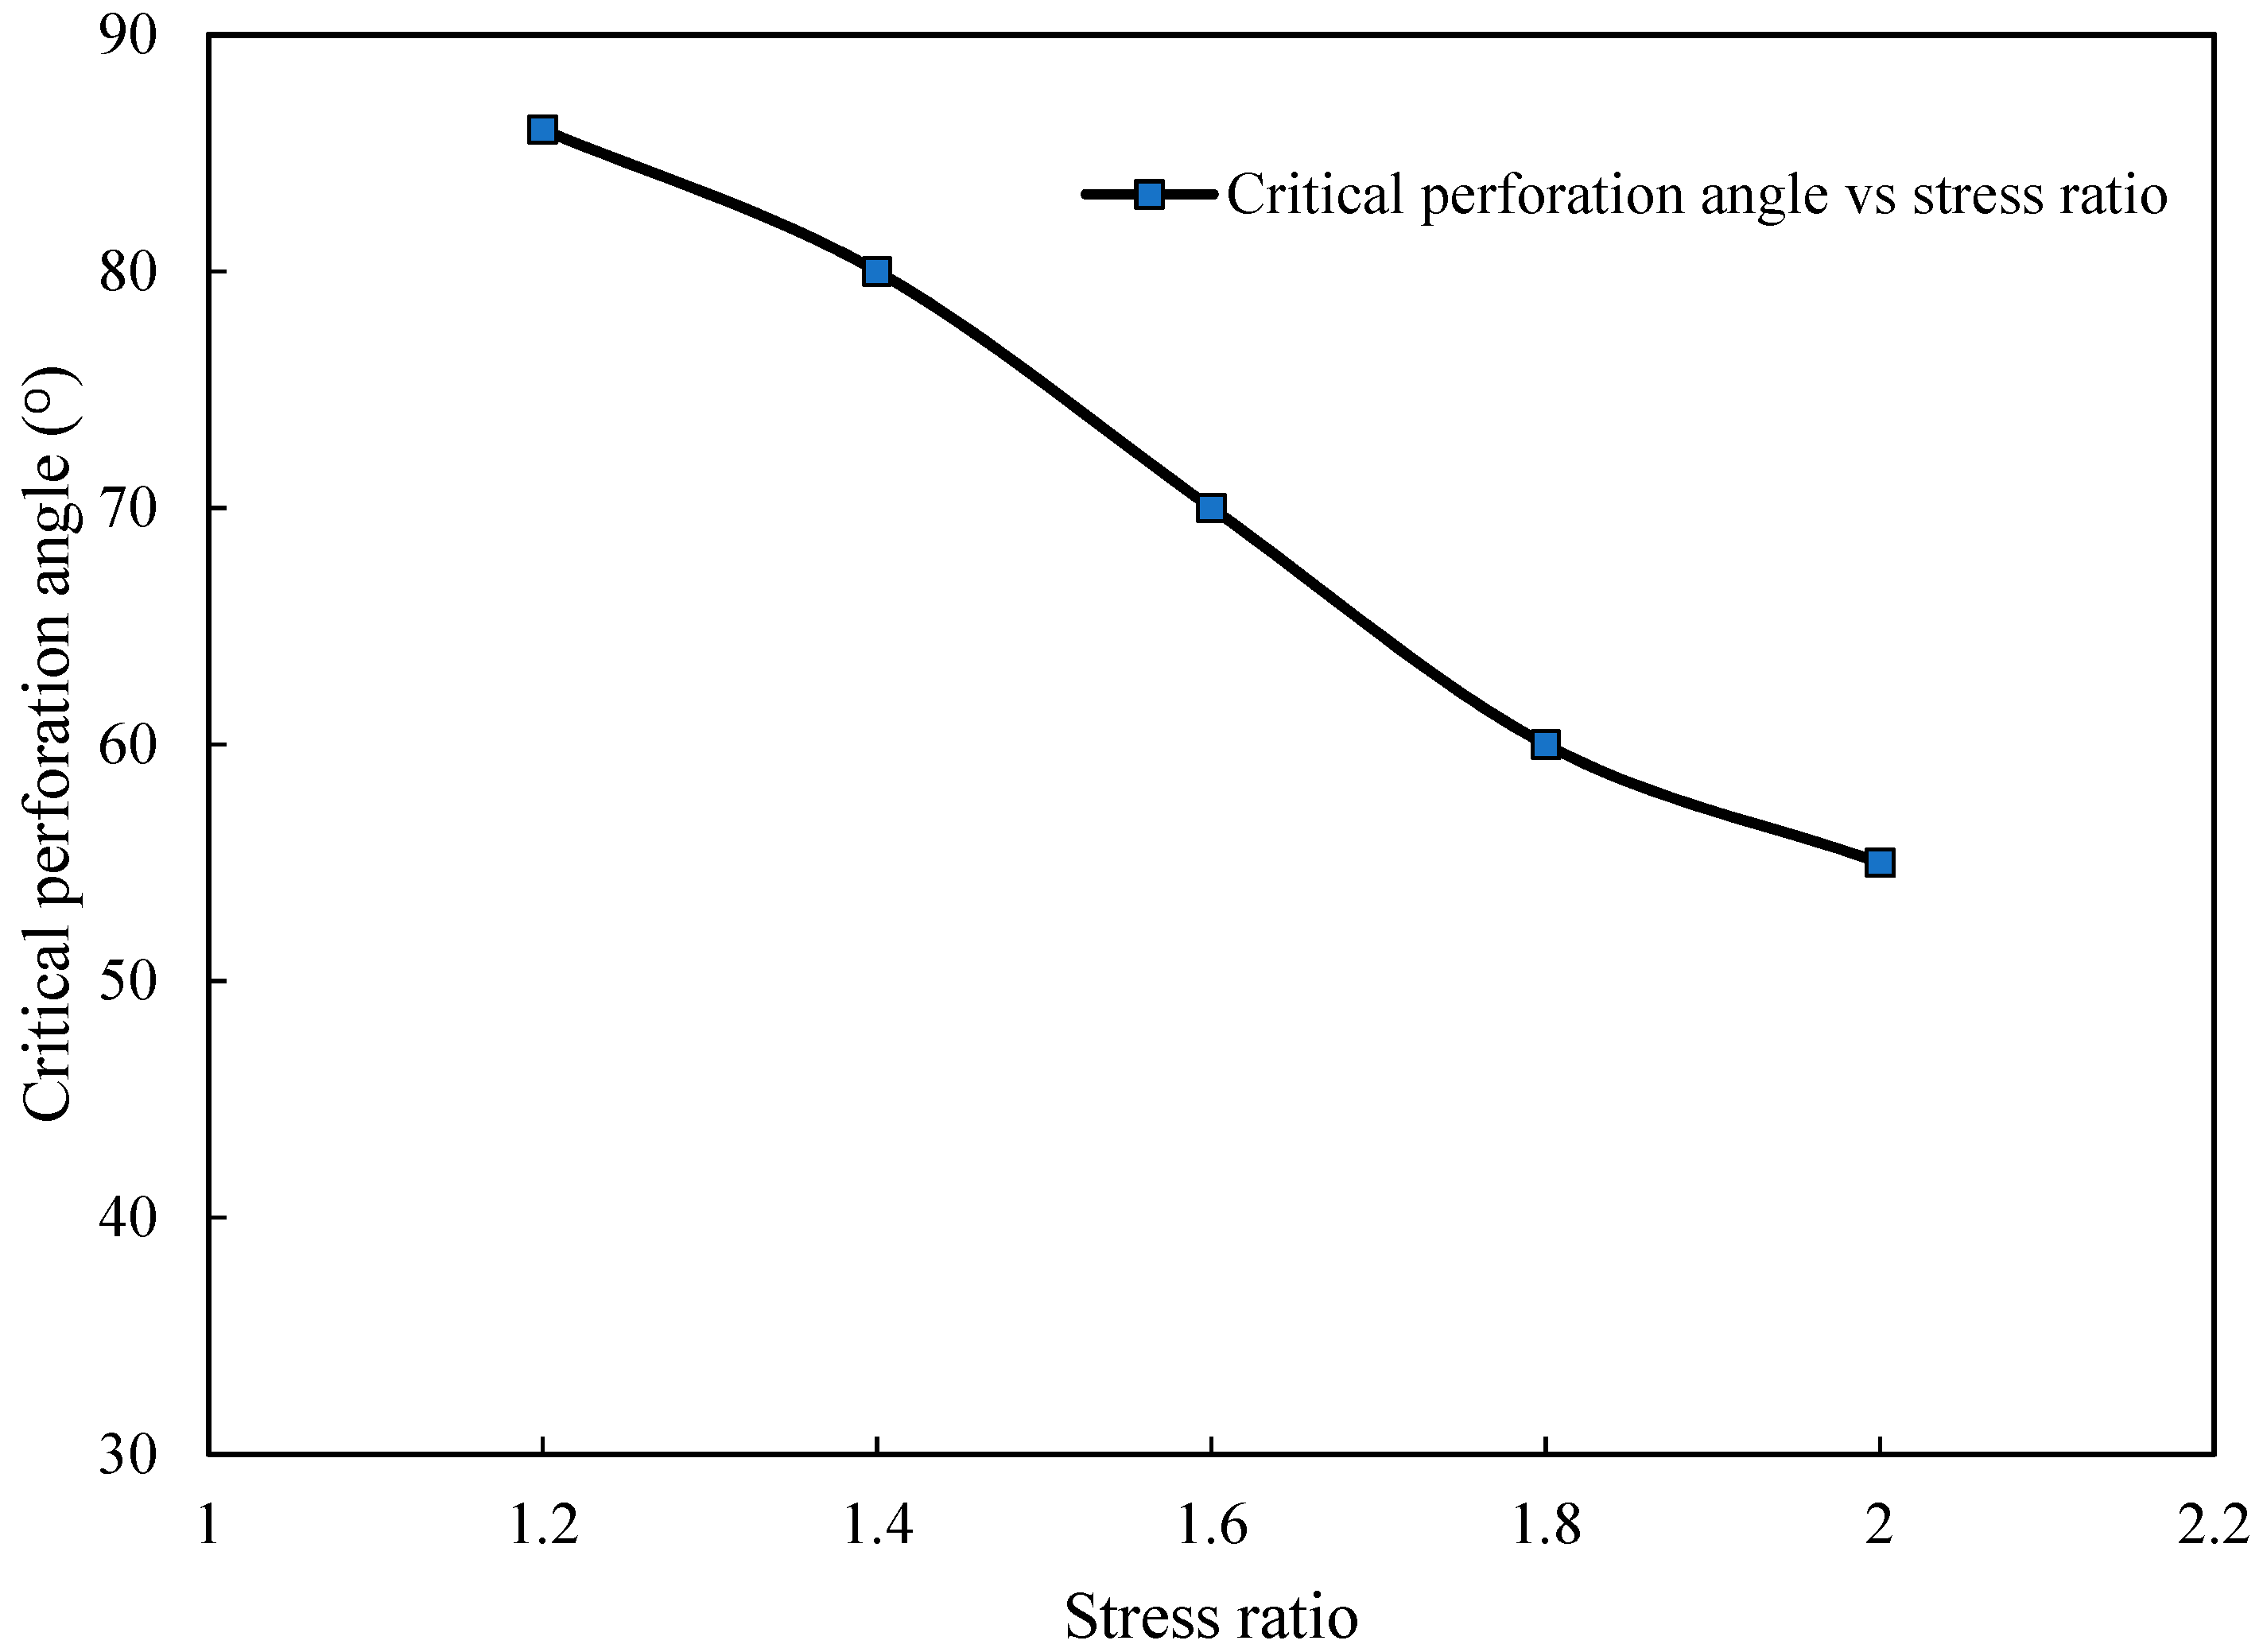
5. Analysis of Near-Wellbore Hydraulic Fracture Complexity
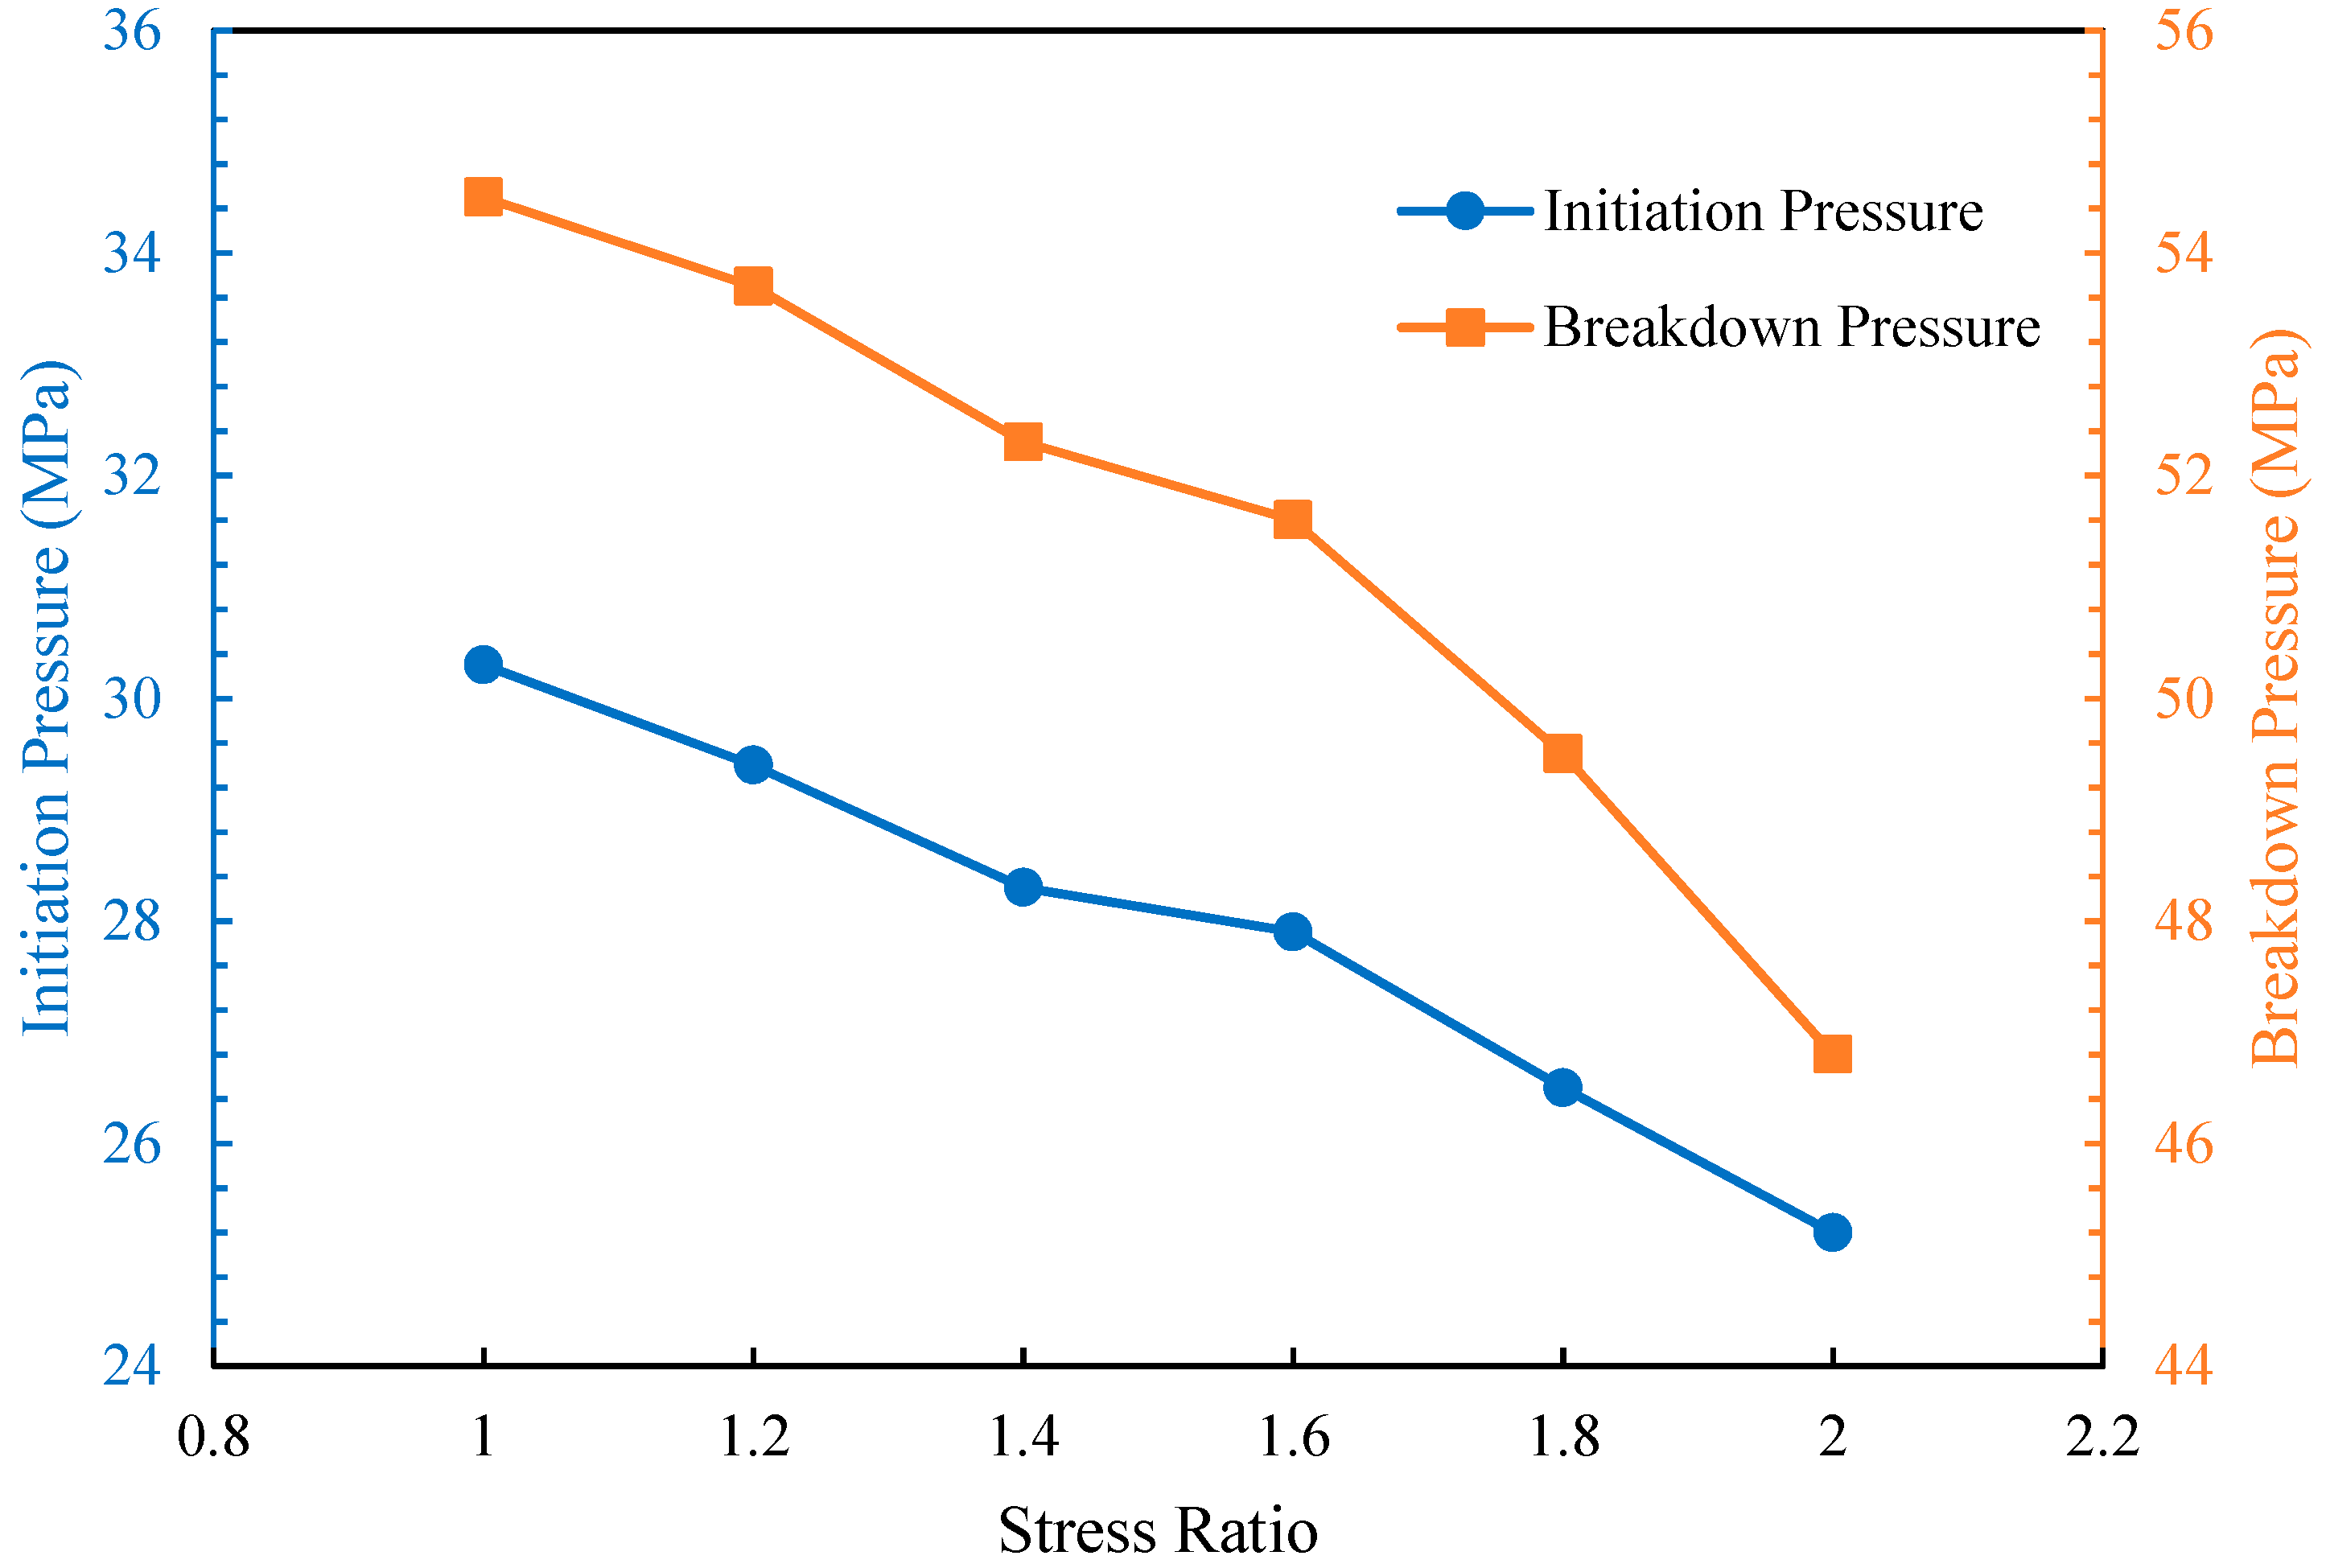
5.1. Effects of Horizontal Differential Stress
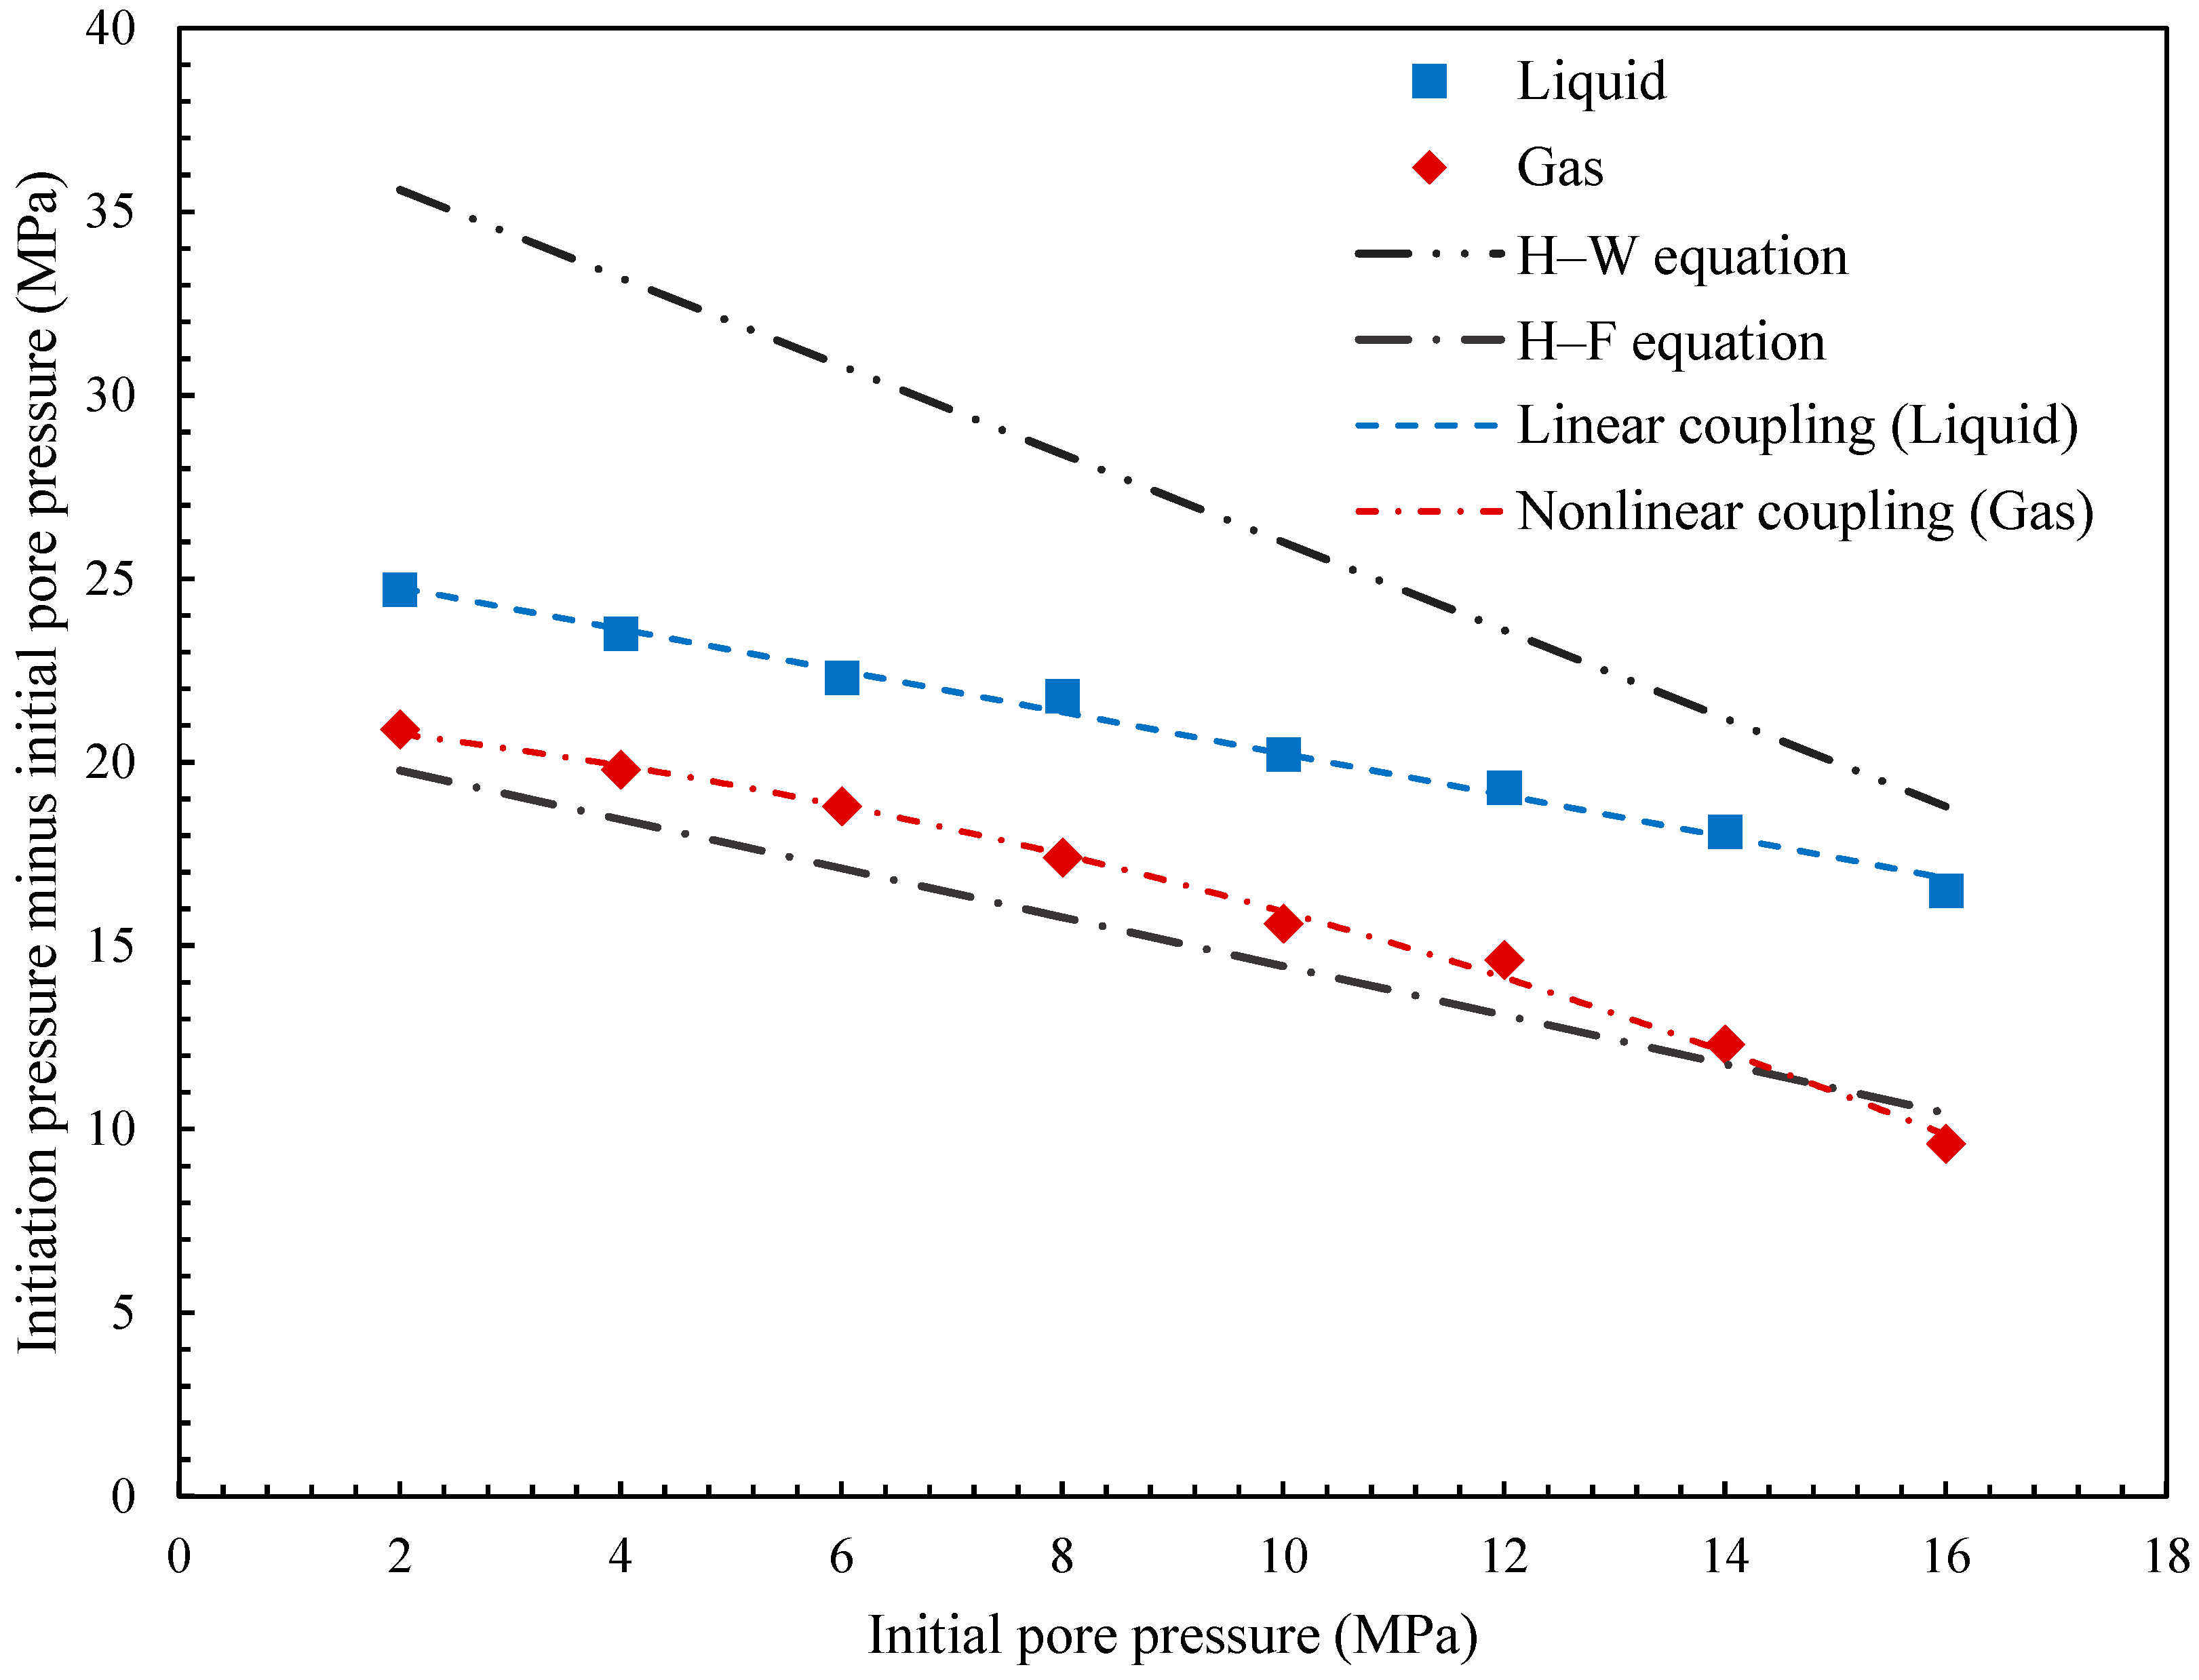
5.2. Effects of Initial Pore Pressure
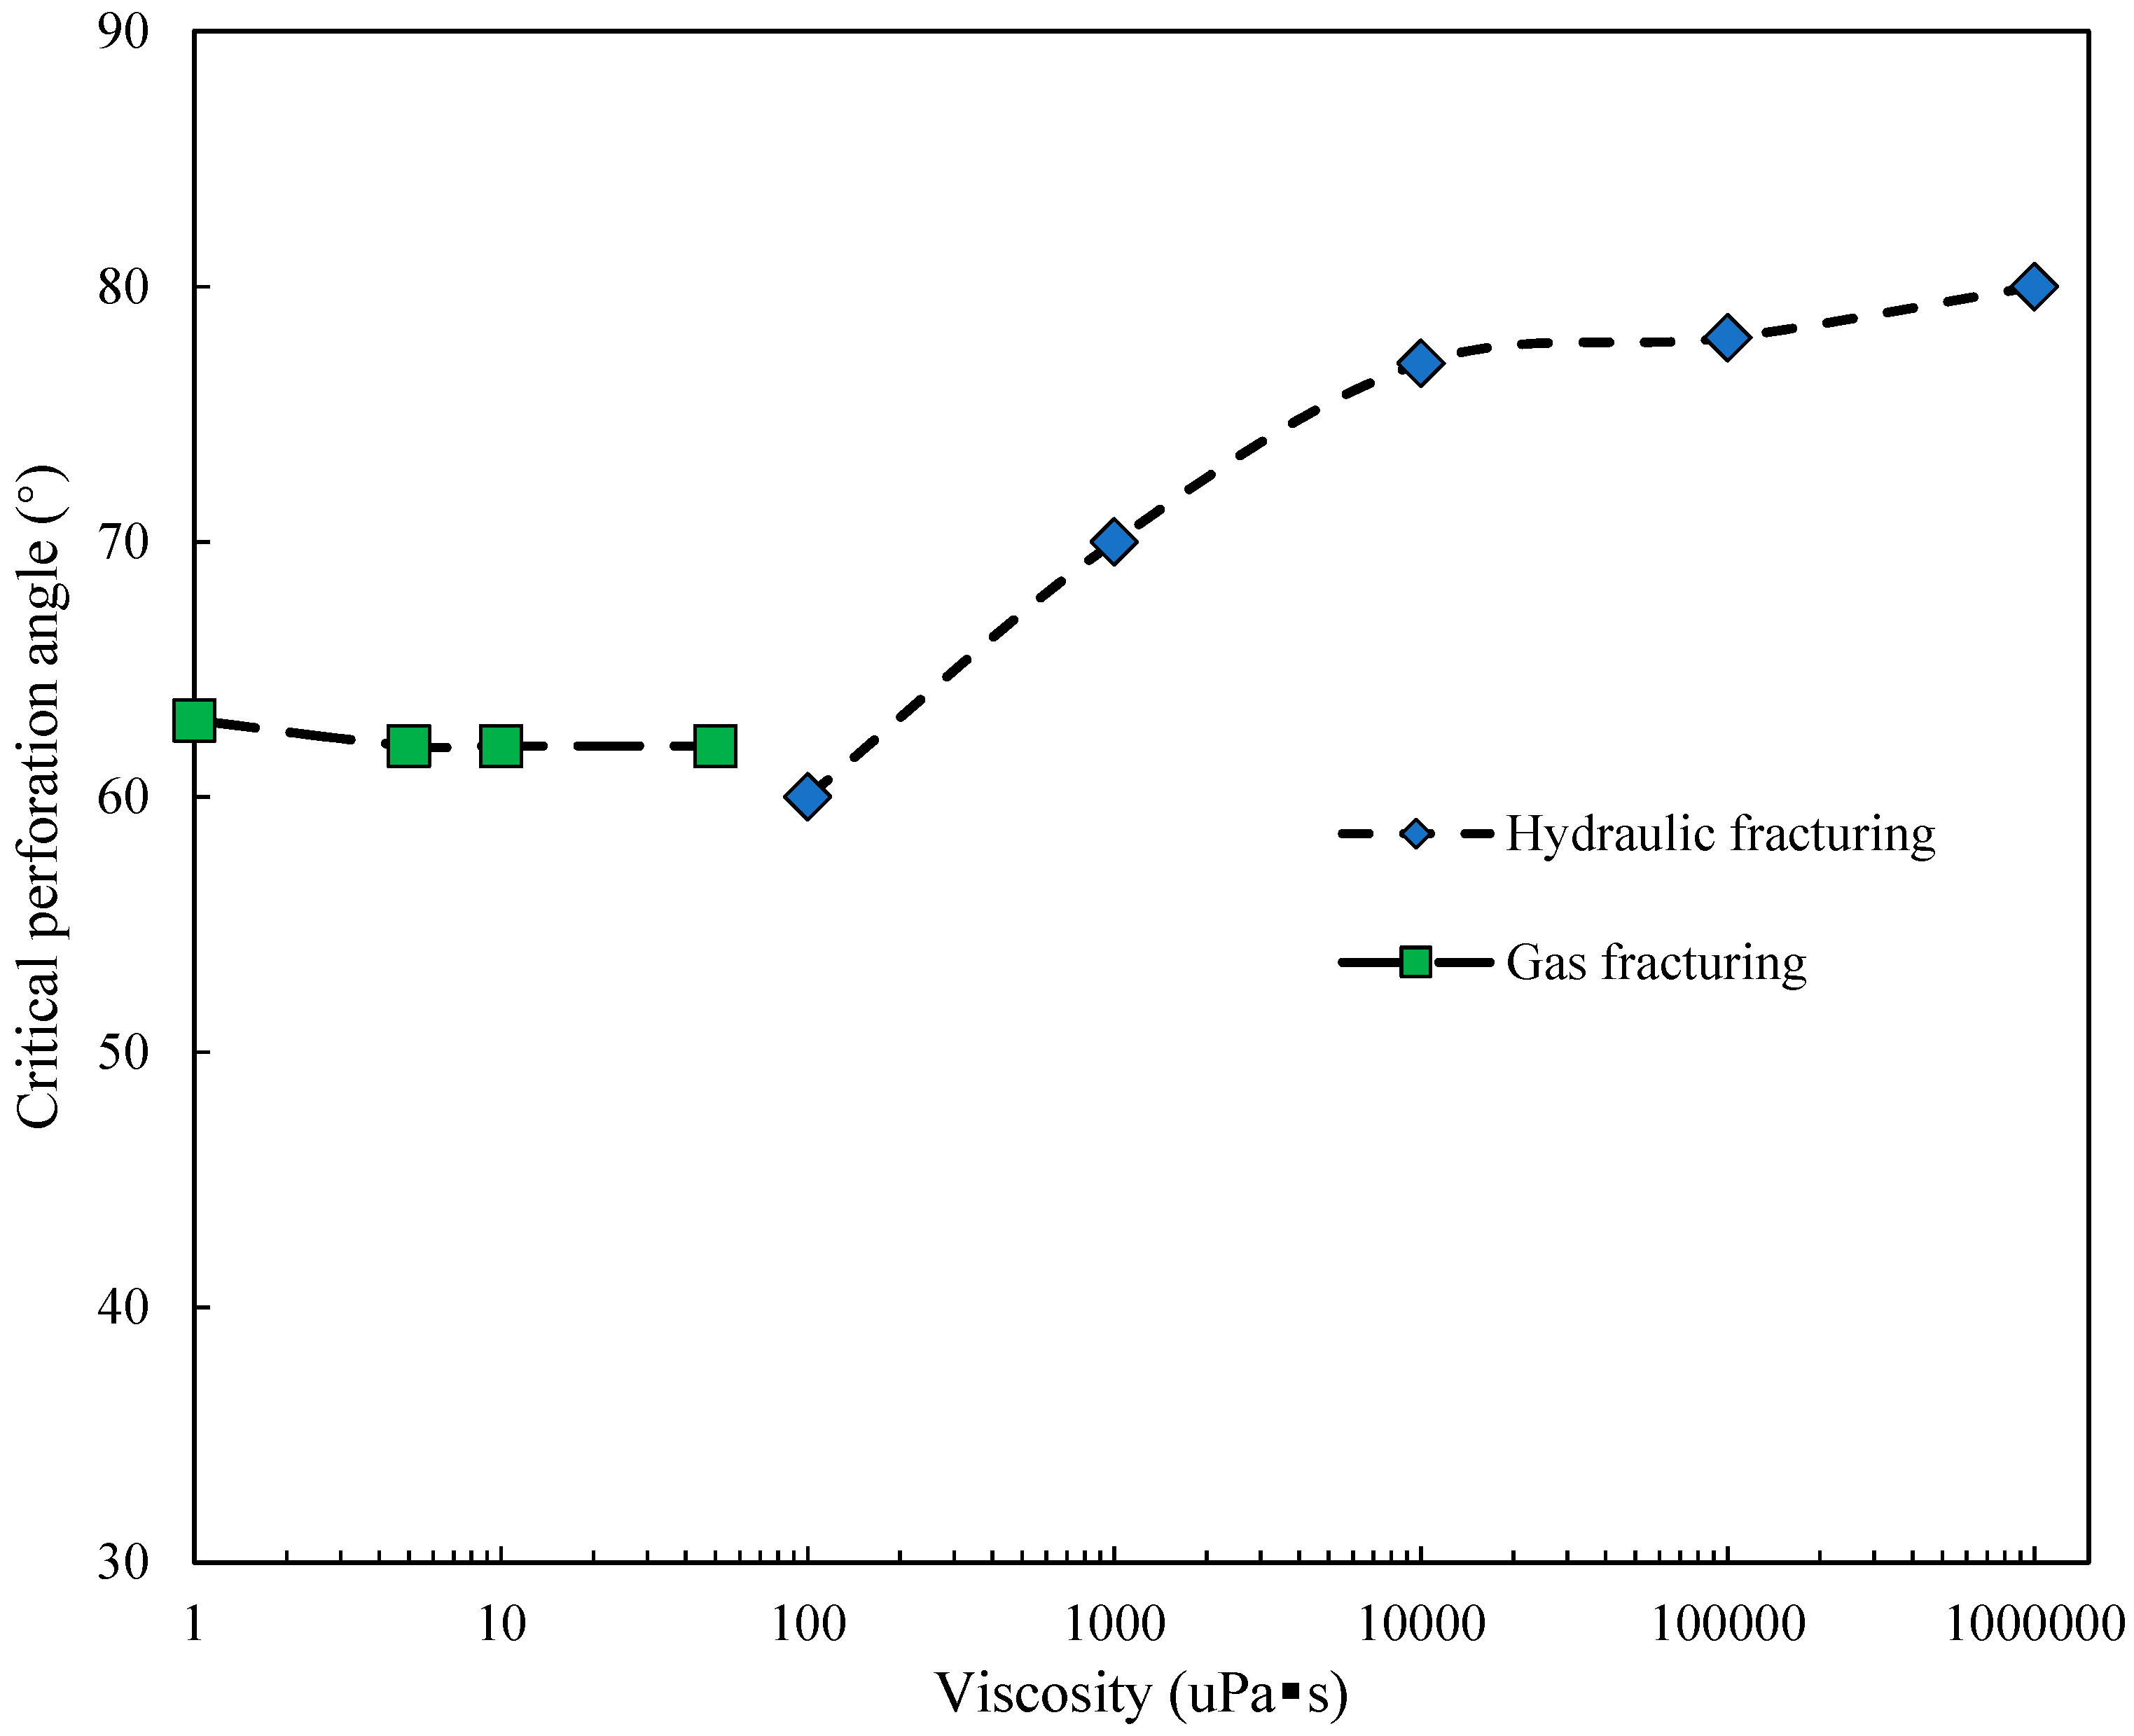
5.3. Effects of Fracturing Fluids
6. Conclusions
Author Contributions
Funding
Conflicts of Interest
References
- Cherny, S.; Chirkov, D.; Lapin, V.; Muranov, A.; Bannikov, D.; Miller, M.; Willberg, D.; Medvedev, O.; Alekseenko, O. Two-dimensional modeling of the near-wellbore fracture tortuosity effect. Int. J. Rock Mech. Min. 2009, 46, 992–1000. [Google Scholar] [CrossRef]
- Abdollahipour, A.; Marji, M.F.; Bafghi, A.Y.; Gholamnejad, J. Simulating the propagation of hydraulic fractures from a circular wellbore using the displacement discontinuity method. Int. J. Rock Mech. Min. 2015, 80, 281–291. [Google Scholar] [CrossRef]
- Palmer, I.; Cameran, J.; Moschovidis, Z.; Ponce, J. Natural fractures influence shear stimulation direction. Oil Gas J. 2009, 107, 37–43. [Google Scholar]
- Zhou, J.; Chen, M.; Jin, Y.; Zhang, G.Q. Analysis of fracture propagation behavior and fracture geometry using a tri-axial fracturing system in naturally fractured reservoirs. Int. J. Rock Mech. Min. 2008, 45, 1143–1152. [Google Scholar] [CrossRef]
- Ye, Z.; Janis, M.; Ghassemi, A.; Riley, S. Laboratory Investigation of fluid flow and permeability evolution through shale fractures. In Proceedings of the Unconventional Resources Technology Conference, Austin, TX, USA, 24–26 July 2017. [Google Scholar]
- Hossain, M.M.; Rahman, M.K.; Rahman, S.S. Hydraulic fracture initiation and propagation: Roles of wellbore trajectory, perforation and stress regimes. J. Pet. Sci. Eng. 2000, 27, 129–149. [Google Scholar] [CrossRef]
- Fallahzadeh, S.H.; Rasouli, V.; Sarmadivaleh, M. An investigation of hydraulic fracturing initiation and near-wellbore propagation from perforated boreholes in tight formations. Rock Mech. Rock Eng. 2015, 48, 573–584. [Google Scholar] [CrossRef]
- Feng, Y.; Gray, K.E. Discussion on field injectivity tests during drilling. Rock Mech. Rock Eng. 2017, 50, 493–498. [Google Scholar] [CrossRef]
- Sepehri, J.; Soliman, M.Y.; Morse, S.M. Application of extended finite elementmethod to simulate hydraulic fracture propagation from orientedperforations. In Proceedings of the SPE Hydraulic Fracturing Technology Conference, The Woodlands, TX, USA, 3–5 February 2015. [Google Scholar]
- Zhang, G.; Chen, M. Complex fracture shapes in hydraulic fracturing with orientated perforations. Pet. Explor. Dev. 2009, 36, 103–107. [Google Scholar] [CrossRef]
- Chen, M.; Jiang, H.; Zhang, G.Q.; Jin, Y. The experimental investigation of fracture propagation behavior and fracture geometry in hydraulic fracturing through oriented perforations. Pet. Sci. Technol. 2010, 28, 1297–1306. [Google Scholar] [CrossRef]
- Mahrer, K.D. A review and perspective on far-field hydraulic fracture geometry studies. J. Pet. Sci. Eng. 1999, 24, 13–28. [Google Scholar] [CrossRef]
- Haimson, B.C.; Cornet, F.H. ISRM suggested methods for rock stress estimation—Part 3: Hydraulic fracturing (hf) and/or hydraulic testing of pre-existing fractures (HTPF). Int. J. Rock Mech. Min. 2003, 40, 1011–1020. [Google Scholar] [CrossRef]
- Feng, Y.; Gray, K.E. Modeling near-wellbore hydraulic fracture complexity using coupled pore pressure extended finite element method. In Proceedings of the 51st US Rock Mechanics/Geomechanics Symposium, San Francisco, CA, USA, 25–28 June 2017; American Rock Mechanics Association: San Francisco, CA, USA, 2017. [Google Scholar]
- Daneshy, A.A. A study of inclined hydraulic fractures. Soc. Pet. Eng. J. 1973, 13, 61–68. [Google Scholar] [CrossRef]
- Feng, Y.; Gray, K.E. Modeling of curving hydraulic fracture propagation from a wellbore in a poroelastic medium. J. Nat. Gas Sci. Eng. 2018, 53, 83–93. [Google Scholar] [CrossRef]
- Zhang, X.; Jeffrey, R.G.; Bunger, A.P.; Thiercelin, M. Initiation and growth of a hydraulic fracture from a circular wellbore. Int. J. Rock Mech. Min. 2011, 48, 984–995. [Google Scholar] [CrossRef]
- Narasingam, A.; Siddhamshetty, P.; Kwon, J.S.I. Temporal clustering for order reduction of nonlinear parabolic PDE systems with time-dependent spatial domains: Application to a hydraulic fracturing process. Aiche J. 2017, 63, 3818–3831. [Google Scholar] [CrossRef]
- Sidhu, H.S.; Narasingam, A.; Siddhamshetty, P.; Kwon, J.S.I. Model order reduction of nonlinear parabolic PDE systems with moving boundaries using sparse proper orthogonal decomposition: Application to hydraulic fracturing. Comput. Chem. Eng. 2018, 112, 92–100. [Google Scholar] [CrossRef]
- Gu, Q.Y.; Hoo, K.A. Model-based closed-loop control of the hydraulic fracturing process. Ind. Eng. Chem. Res. 2015, 54, 1585–1594. [Google Scholar] [CrossRef]
- Siddhamshetty, P.; Wu, K.; Kwon, S.I. Optimization of simultaneously propagating multiple fractures in hydraulic fracturing to achieve uniform growth using data-based model reduction. Chem. Eng. Res. Des. 2018, 136, 675–686. [Google Scholar] [CrossRef]
- Wu, K.; Olson, J.E. Mechanisms of simultaneous hydraulic-fracture propagation from multiple perforation clusters in horizontal wells. SPE J. 2016, 21, 1000–1008. [Google Scholar] [CrossRef]
- Rutqvist, J.; Jeanne, P.; Dobson, P.F.; Garcia, J.; Hartline, C.; Hutchings, L.; Singh, A.; Vasco, D.W.; Walters, M. The northwest geysers EGS demonstration project, California—Part 2: Modeling and interpretation. Geothermics 2016, 63, 120–138. [Google Scholar] [CrossRef]
- Wang, H.Y. Numerical modeling of non-planar hydraulic fracture propagation in brittle and ductile rocks using xfem with cohesive zone method. J. Pet. Sci. Eng. 2015, 135, 127–140. [Google Scholar] [CrossRef]
- Schmitt, D.R.; Zoback, M.D. Diminished pore pressure in low-porosity crystalline rock under tensional failure: Apparent strengthening by dilatancy. J. Geophys. Res. Solid Earth 1992, 97, 273–288. [Google Scholar] [CrossRef]
- Zhu, W.C.; Liu, J.; Tang, C.A.; Zhao, X.D.; Brady, B.H. Simulation of progressive fracturing processes around underground excavations under biaxial compression. Tunn. Undergr. Space Technol. 2005, 20, 231–247. [Google Scholar] [CrossRef]
- Liu, L.Y.; Zhu, W.C.; Wei, C.H.; Elsworth, D.; Wang, J.H. Microcrack-based geomechanical modeling of rock-gas interaction during supercritical CO2 fracturing. J. Pet. Sci. Eng. 2018, 164, 91–102. [Google Scholar] [CrossRef]
- Li, Z.C.; Li, L.C.; Li, M.; Zhang, L.Y.; Zhang, Z.L.; Huang, B.; Tang, C.A. A numerical investigation on the effects of rock brittleness on the hydraulic fractures in the shale reservoir. J. Nat. Gas Sci. Eng. 2018, 50, 22–32. [Google Scholar] [CrossRef]
- Zhang, X.; Jeffrey, R.G. The role of friction and secondary flaws on deflection and re-initiation of hydraulic fractures at orthogonal pre-existing fractures. Geophys. J. Int. 2006, 166, 1454–1465. [Google Scholar] [CrossRef]
- Zhang, H.B.; Liu, J.S.; Elsworth, D. How sorption-induced matrix deformation affects gas flow in coal seams: A new Fe model. Int. J. Rock Mech. Min. 2008, 45, 1226–1236. [Google Scholar] [CrossRef]
- Robertson, E.P.; Christiansen, R.L. Modeling laboratory permeability in coal using sorption-induced-strain data. SPE Reserv. Eval. Eng. 2007, 10, 260–269. [Google Scholar] [CrossRef]
- Detournay, E.; Cheng, A.H.D. 5—Fundamentals of poroelasticity. In Analysis and Design Methods; Fairhurst, C., Ed.; Pergamon: Oxford, UK, 1993; pp. 113–171. [Google Scholar]
- Zhu, W.C.; Tang, C.A. Micromechanical model for simulating the fracture process of rock. Rock Mech. Rock Eng. 2004, 37, 25–56. [Google Scholar] [CrossRef]
- Behrmann, L.A.; Nolte, K.G. Perforating requirements for fracture stimulations. SPE Drill. Complet. 1998, 14, 228–234. [Google Scholar] [CrossRef]
- Li, X.; Wang, J.H.; Elsworth, D. Stress redistribution and fracture propagation during restimulation of gas shale reservoirs. J. Pet. Sci. Eng. 2017, 154, 150–160. [Google Scholar] [CrossRef]
- Detournay, E.; Cheng, A. Influence of pressurization rate on the magnitude of the breakdown pressure. In Proceedings of the 33th US Symposium on Rock Mechanics, Santa Fe, NM, USA, 3–5 June 1992; American Rock Mechanics Association: Santa Fe, NM, USA, 1992. [Google Scholar]
- Song, I.; Haimson, B. Effect of pressurization rate and initial pore pressure on the magnitude of hydrofracturing breakdown pressure in Tablerock Sandstone. In Proceedings of the 38th U.S. Rock Mechanics Symposium, Washington, DC, USA, 7–10 July 2001; American Rock Mechanics Association: Washington, DC, USA, 2001. [Google Scholar]
- Haimson, B.; Fairhurst, C. Initiation and extension of hydraulic fractures in rocks. Soc. Pet. Eng. J. 1967, 7, 310–318. [Google Scholar] [CrossRef]
- Guo, F.; Morgenstern, N.R.; Scott, J.D. Interpretation of hydraulic fracturing breakdown pressure. Int. J. Rock Mech. Min. Sci. Geomech. Abstr. 1993, 30, 617–626. [Google Scholar] [CrossRef]
- Hubbert, M.K.; Willis, D.G.W. Mechanics of hydraulic fracturing. Trans. Soc. Pet. Eng. AIME 1957, 210, 153–168. [Google Scholar]
- Zhu, W.C.; Liu, L.Y.; Liu, J.S.; Wei, C.H.; Peng, Y. Impact of gas adsorption-induced coal damage on the evolution of coal permeability. Int. J. Rock Mech. Min. 2018, 101, 89–97. [Google Scholar] [CrossRef]
- Liu, L.Y.; Zhu, W.C.; Wei, C.H.; Ma, X.H. Mechanical model and numerical analysis of mechanical property alterations of coal induced by gas adsorption. Rock Soil Mech. 2018, 39, 1500–1508. (In Chinese) [Google Scholar] [CrossRef]
- Detournay, E. Propagation regimes of fluid-driven fractures in impermeable rocks. Int. J. Geomech. 2004, 4, 35–45. [Google Scholar] [CrossRef]
- Zhang, X.; Jeffrey, R.G.; Thiercelin, M. Deflection and propagation of fluid-driven fractures at frictional bedding interfaces: A numerical investigation. J. Struct. Geol. 2007, 29, 396–410. [Google Scholar] [CrossRef]
- Wang, J.; Elsworth, D.; Wu, Y.; Liu, J.; Zhu, W.; Liu, Y. The influence of fracturing fluids on fracturing processes: A comparison between water, oil and SC-CO2. Rock Mech. Rock Eng. 2017, 51, 299–313. [Google Scholar] [CrossRef]


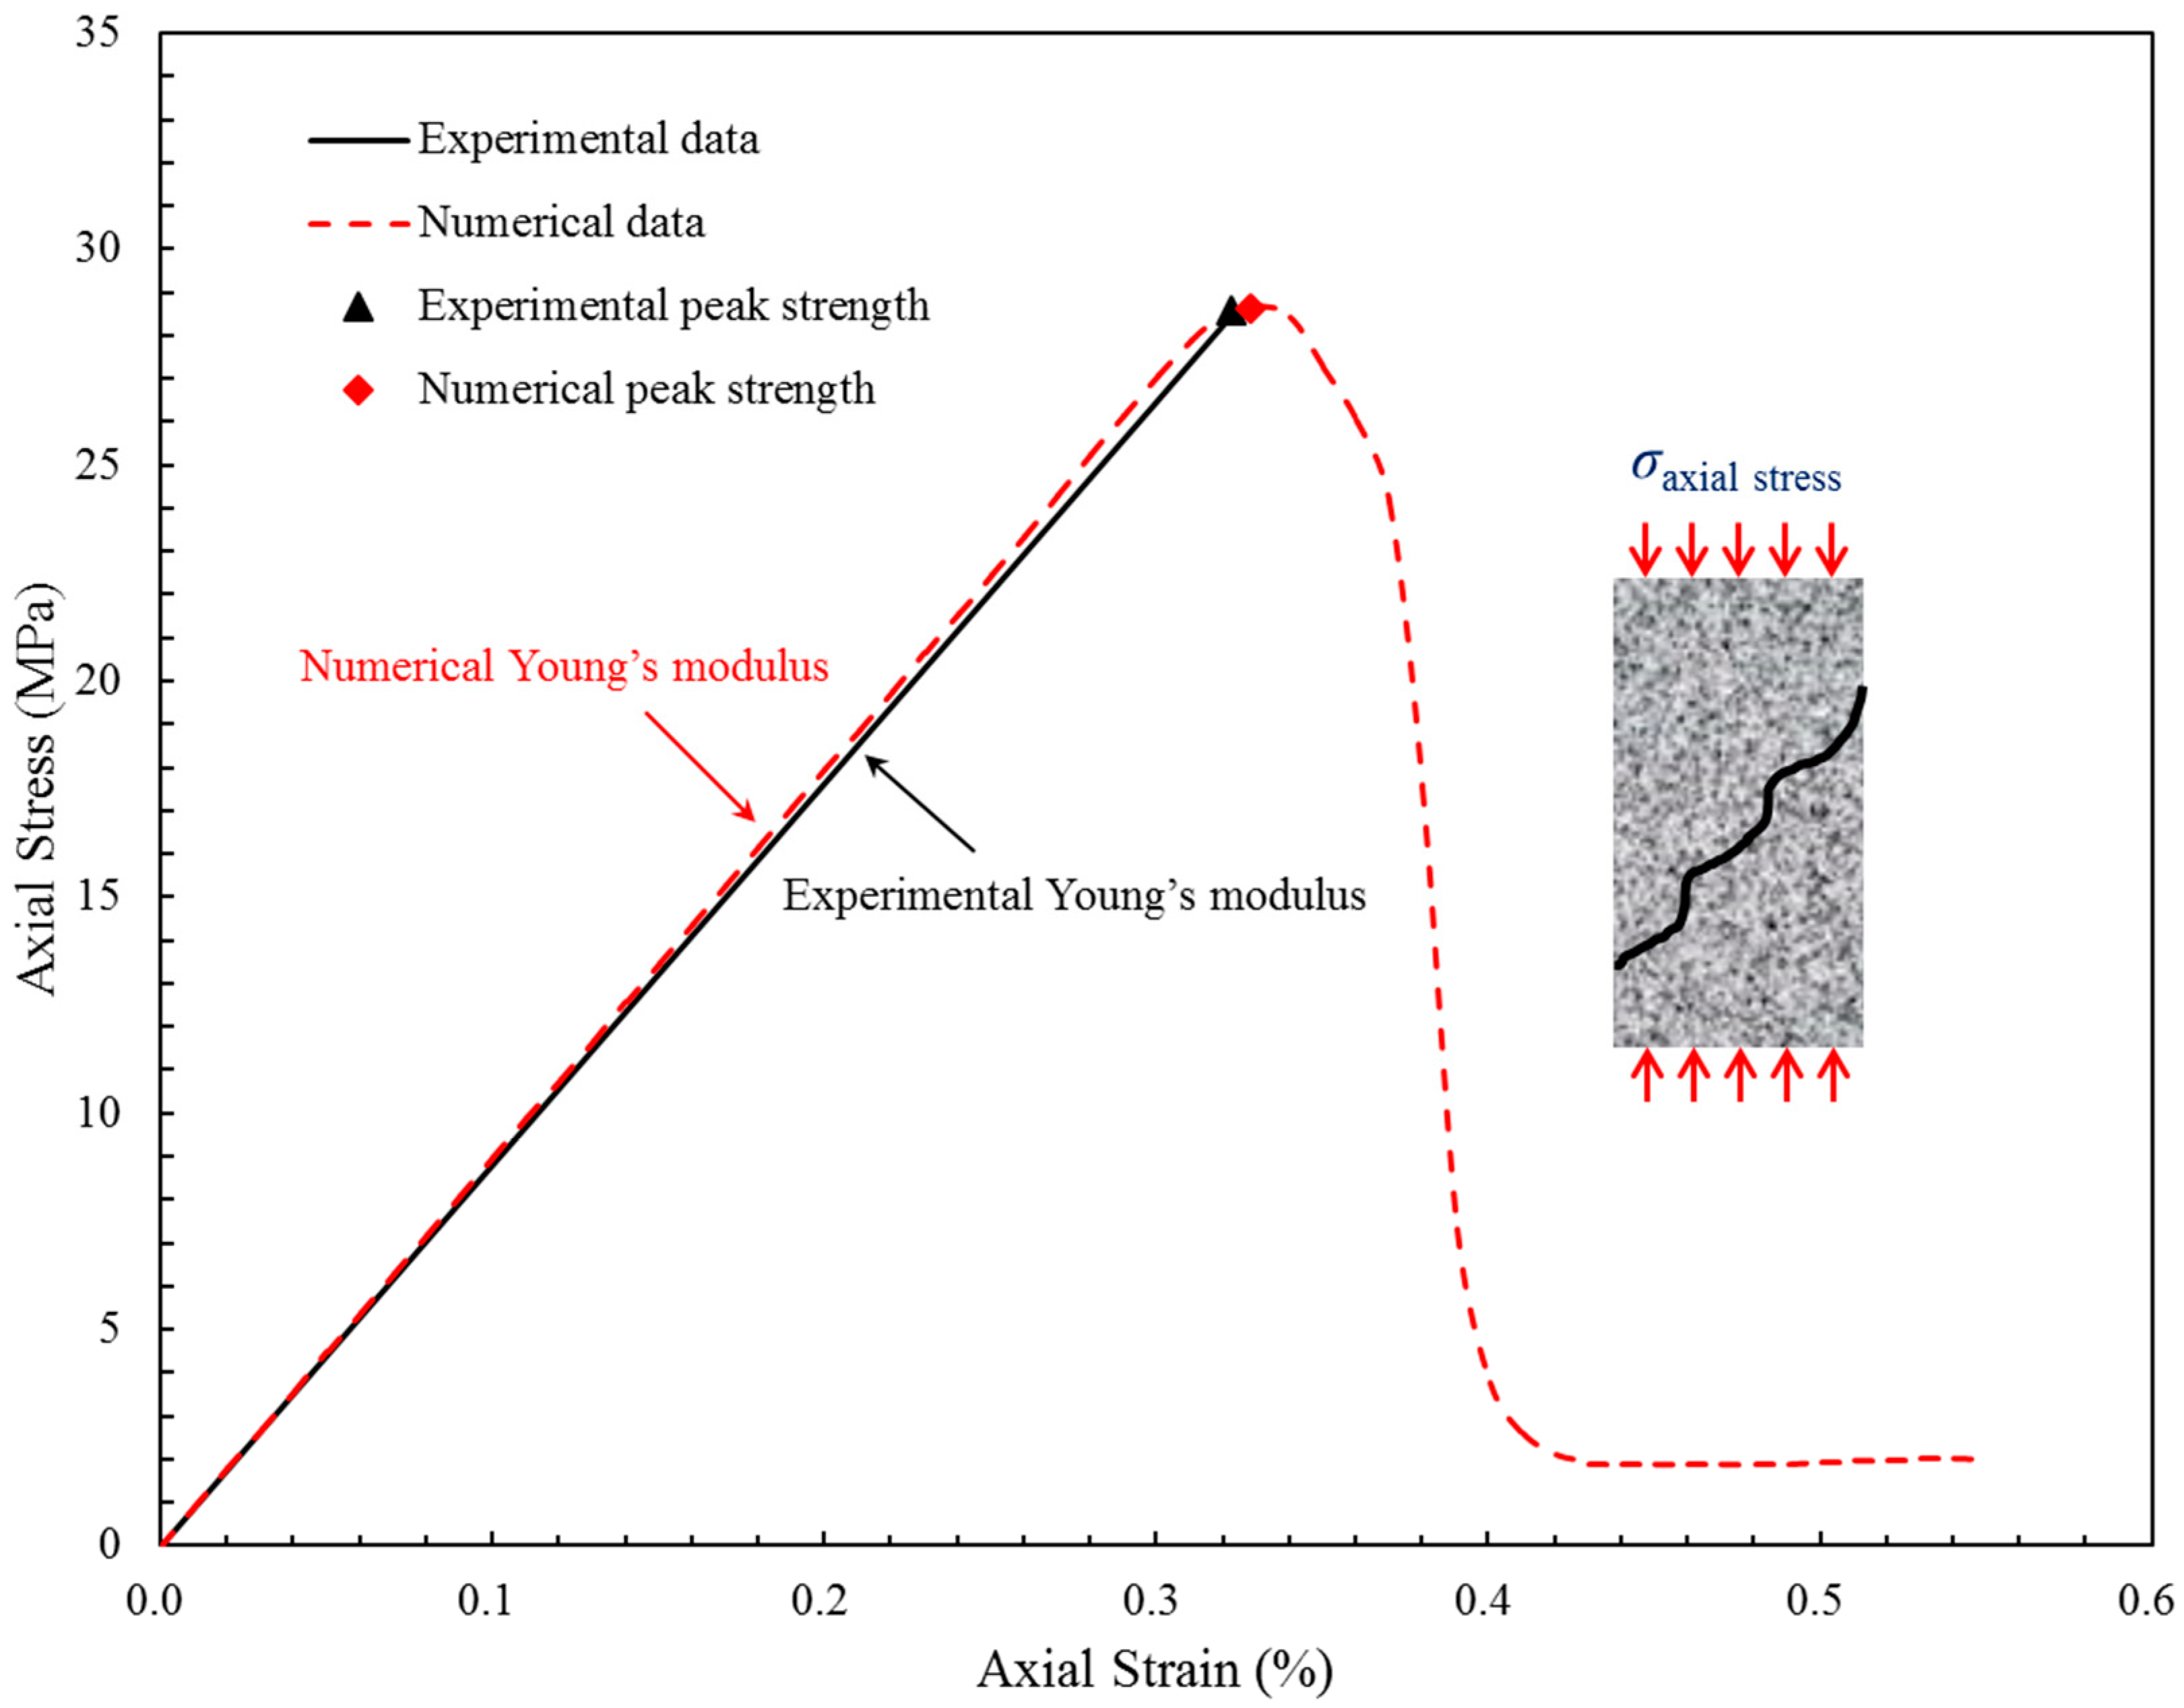
| Symbol | Experimental Data | Numerical Data | |||
|---|---|---|---|---|---|
| Young’s modulus, E (GPa) | 8.402 | 8.51 | 1.29% | - | - |
| Uniaxial compressive strength, σc (MPa) | 28.34 | 28.57 | - | 0.81% | - |
| Tensile strength, σt (MPa) | 2.59 | 2.56 | - | - | −1.16% |
| Symbol | Value | Unit |
|---|---|---|
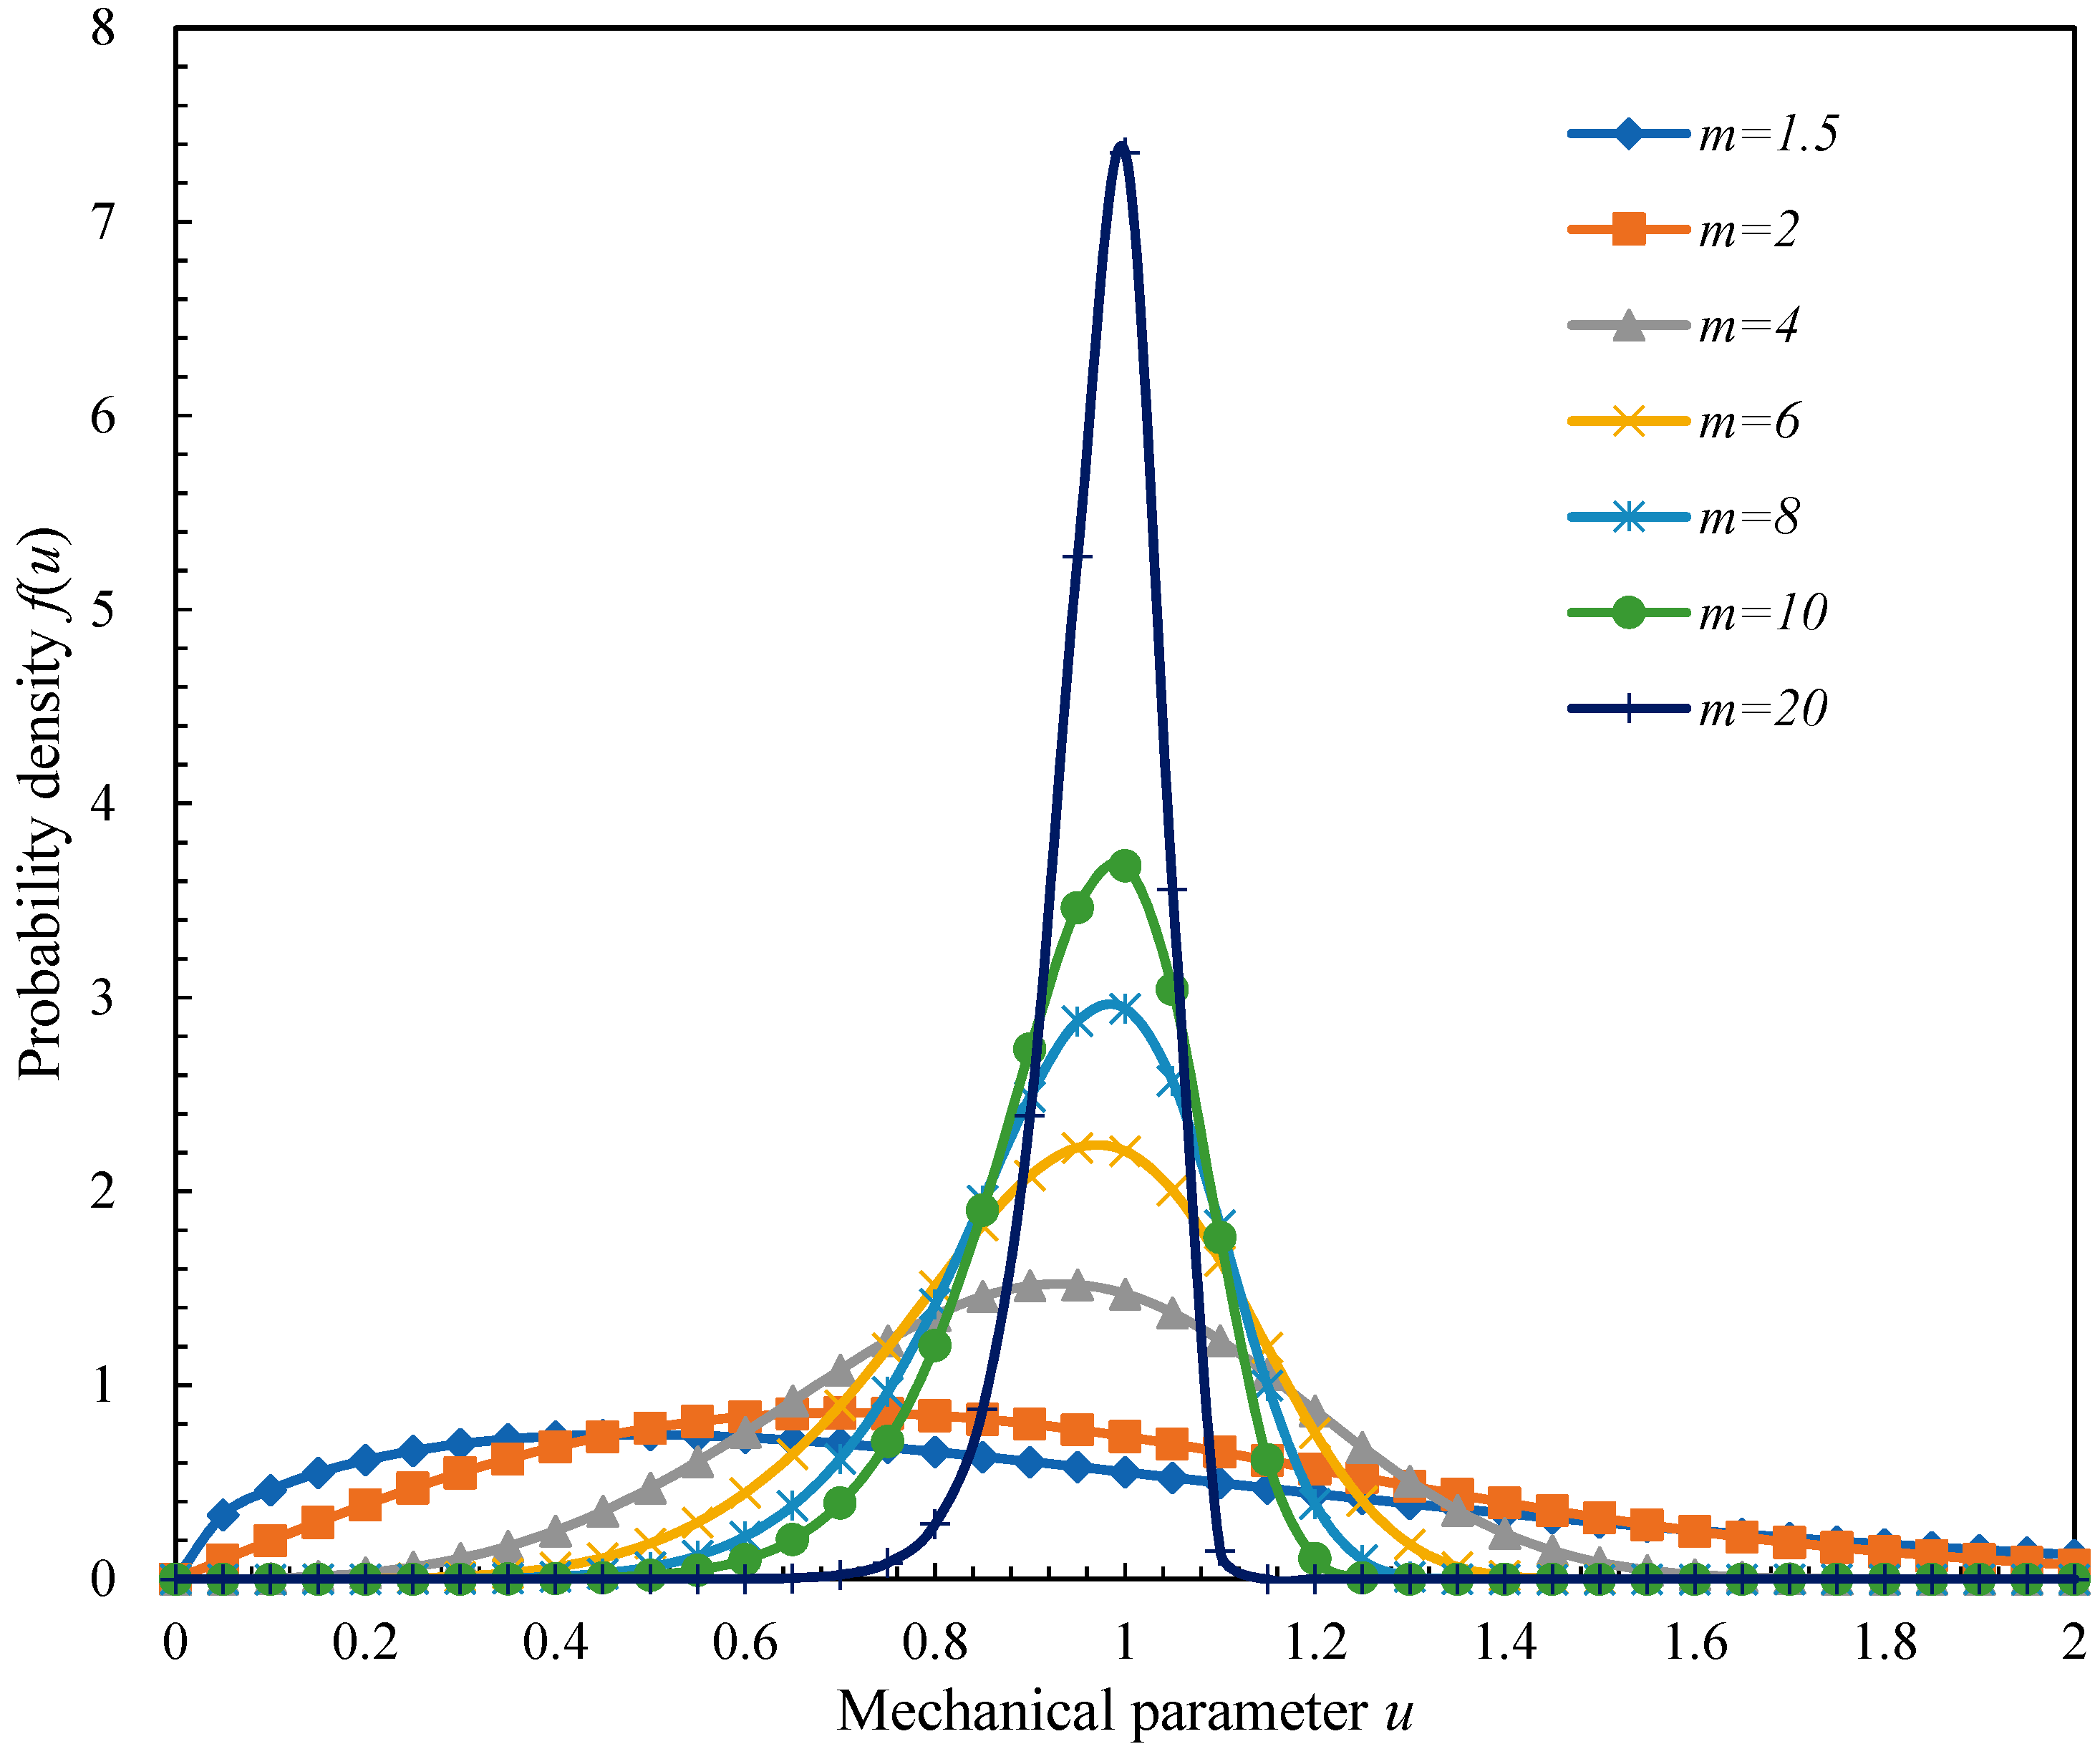
| Homogeneity index, m | 10 | - |
| Mean value of the elasticity modulus, E | 8.737 | GPa |
| Mean value of uniaxial compressive strength, | 45.53 | MPa |
| Mean value of uniaxial tensile strength, | 5.69 | MPa |
| Poisson ratio, | 0.23 | - |
| Initial porosity, | 1.85 | % |
| Initial permeability, | 1.0 × 10⁻¹⁶ | m2 |
| Initial pore pressure, | 0.1 | MPa |
| Viscosity, | 133 | mPa·s |
| Stress Ratio | Perforation Angle (o) | Initiation Pressure (MPa) | Breakdown Pressure (MPa) |
|---|---|---|---|
| 1.0 | 45 | 30.3 | 54.5 |
| 1.2 | 45 | 29.4 | 53.7 |
| 1.4 | 45 | 28.3 | 52.3 |
| 1.6 | 45 | 27.9 | 51.6 |
| 1.8 | 45 | 26.5 | 49.5 |
| 2.0 | 45 | 25.2 | 46.8 |
© 2018 by the authors. Licensee MDPI, Basel, Switzerland. This article is an open access article distributed under the terms and conditions of the Creative Commons Attribution (CC BY) license (http://creativecommons.org/licenses/by/4.0/).
Share and Cite
Liu, L.; Li, L.; Elsworth, D.; Zhi, S.; Yu, Y. The Impact of Oriented Perforations on Fracture Propagation and Complexity in Hydraulic Fracturing. Processes 2018, 6, 213. https://doi.org/10.3390/pr6110213
Liu L, Li L, Elsworth D, Zhi S, Yu Y. The Impact of Oriented Perforations on Fracture Propagation and Complexity in Hydraulic Fracturing. Processes. 2018; 6(11):213. https://doi.org/10.3390/pr6110213
Chicago/Turabian StyleLiu, Liyuan, Lianchong Li, Derek Elsworth, Sheng Zhi, and Yongjun Yu. 2018. "The Impact of Oriented Perforations on Fracture Propagation and Complexity in Hydraulic Fracturing" Processes 6, no. 11: 213. https://doi.org/10.3390/pr6110213
APA StyleLiu, L., Li, L., Elsworth, D., Zhi, S., & Yu, Y. (2018). The Impact of Oriented Perforations on Fracture Propagation and Complexity in Hydraulic Fracturing. Processes, 6(11), 213. https://doi.org/10.3390/pr6110213