Article

The Impact of Oriented Perforations on Fracture Propagation and Complexity in Hydraulic Fracturing

1
Center for Rock Instability and Seismicity Research, Northeastern University, Shenyang 110819, China
2
Department of Energy and Mineral Engineering, EMS Energy Institute and G3 Center, Pennsylvania State University, University Park, State College, PA 16802, USA
*
Author to whom correspondence should be addressed.
Processes 2018, 6(11), 213; https://doi.org/10.3390/pr6110213
Submission received: 30 September 2018 / Revised: 25 October 2018 / Accepted: 26 October 2018 / Published: 1 November 2018
(This article belongs to the Special Issue Fluid Flow in Fractured Porous Media)

Abstract

:
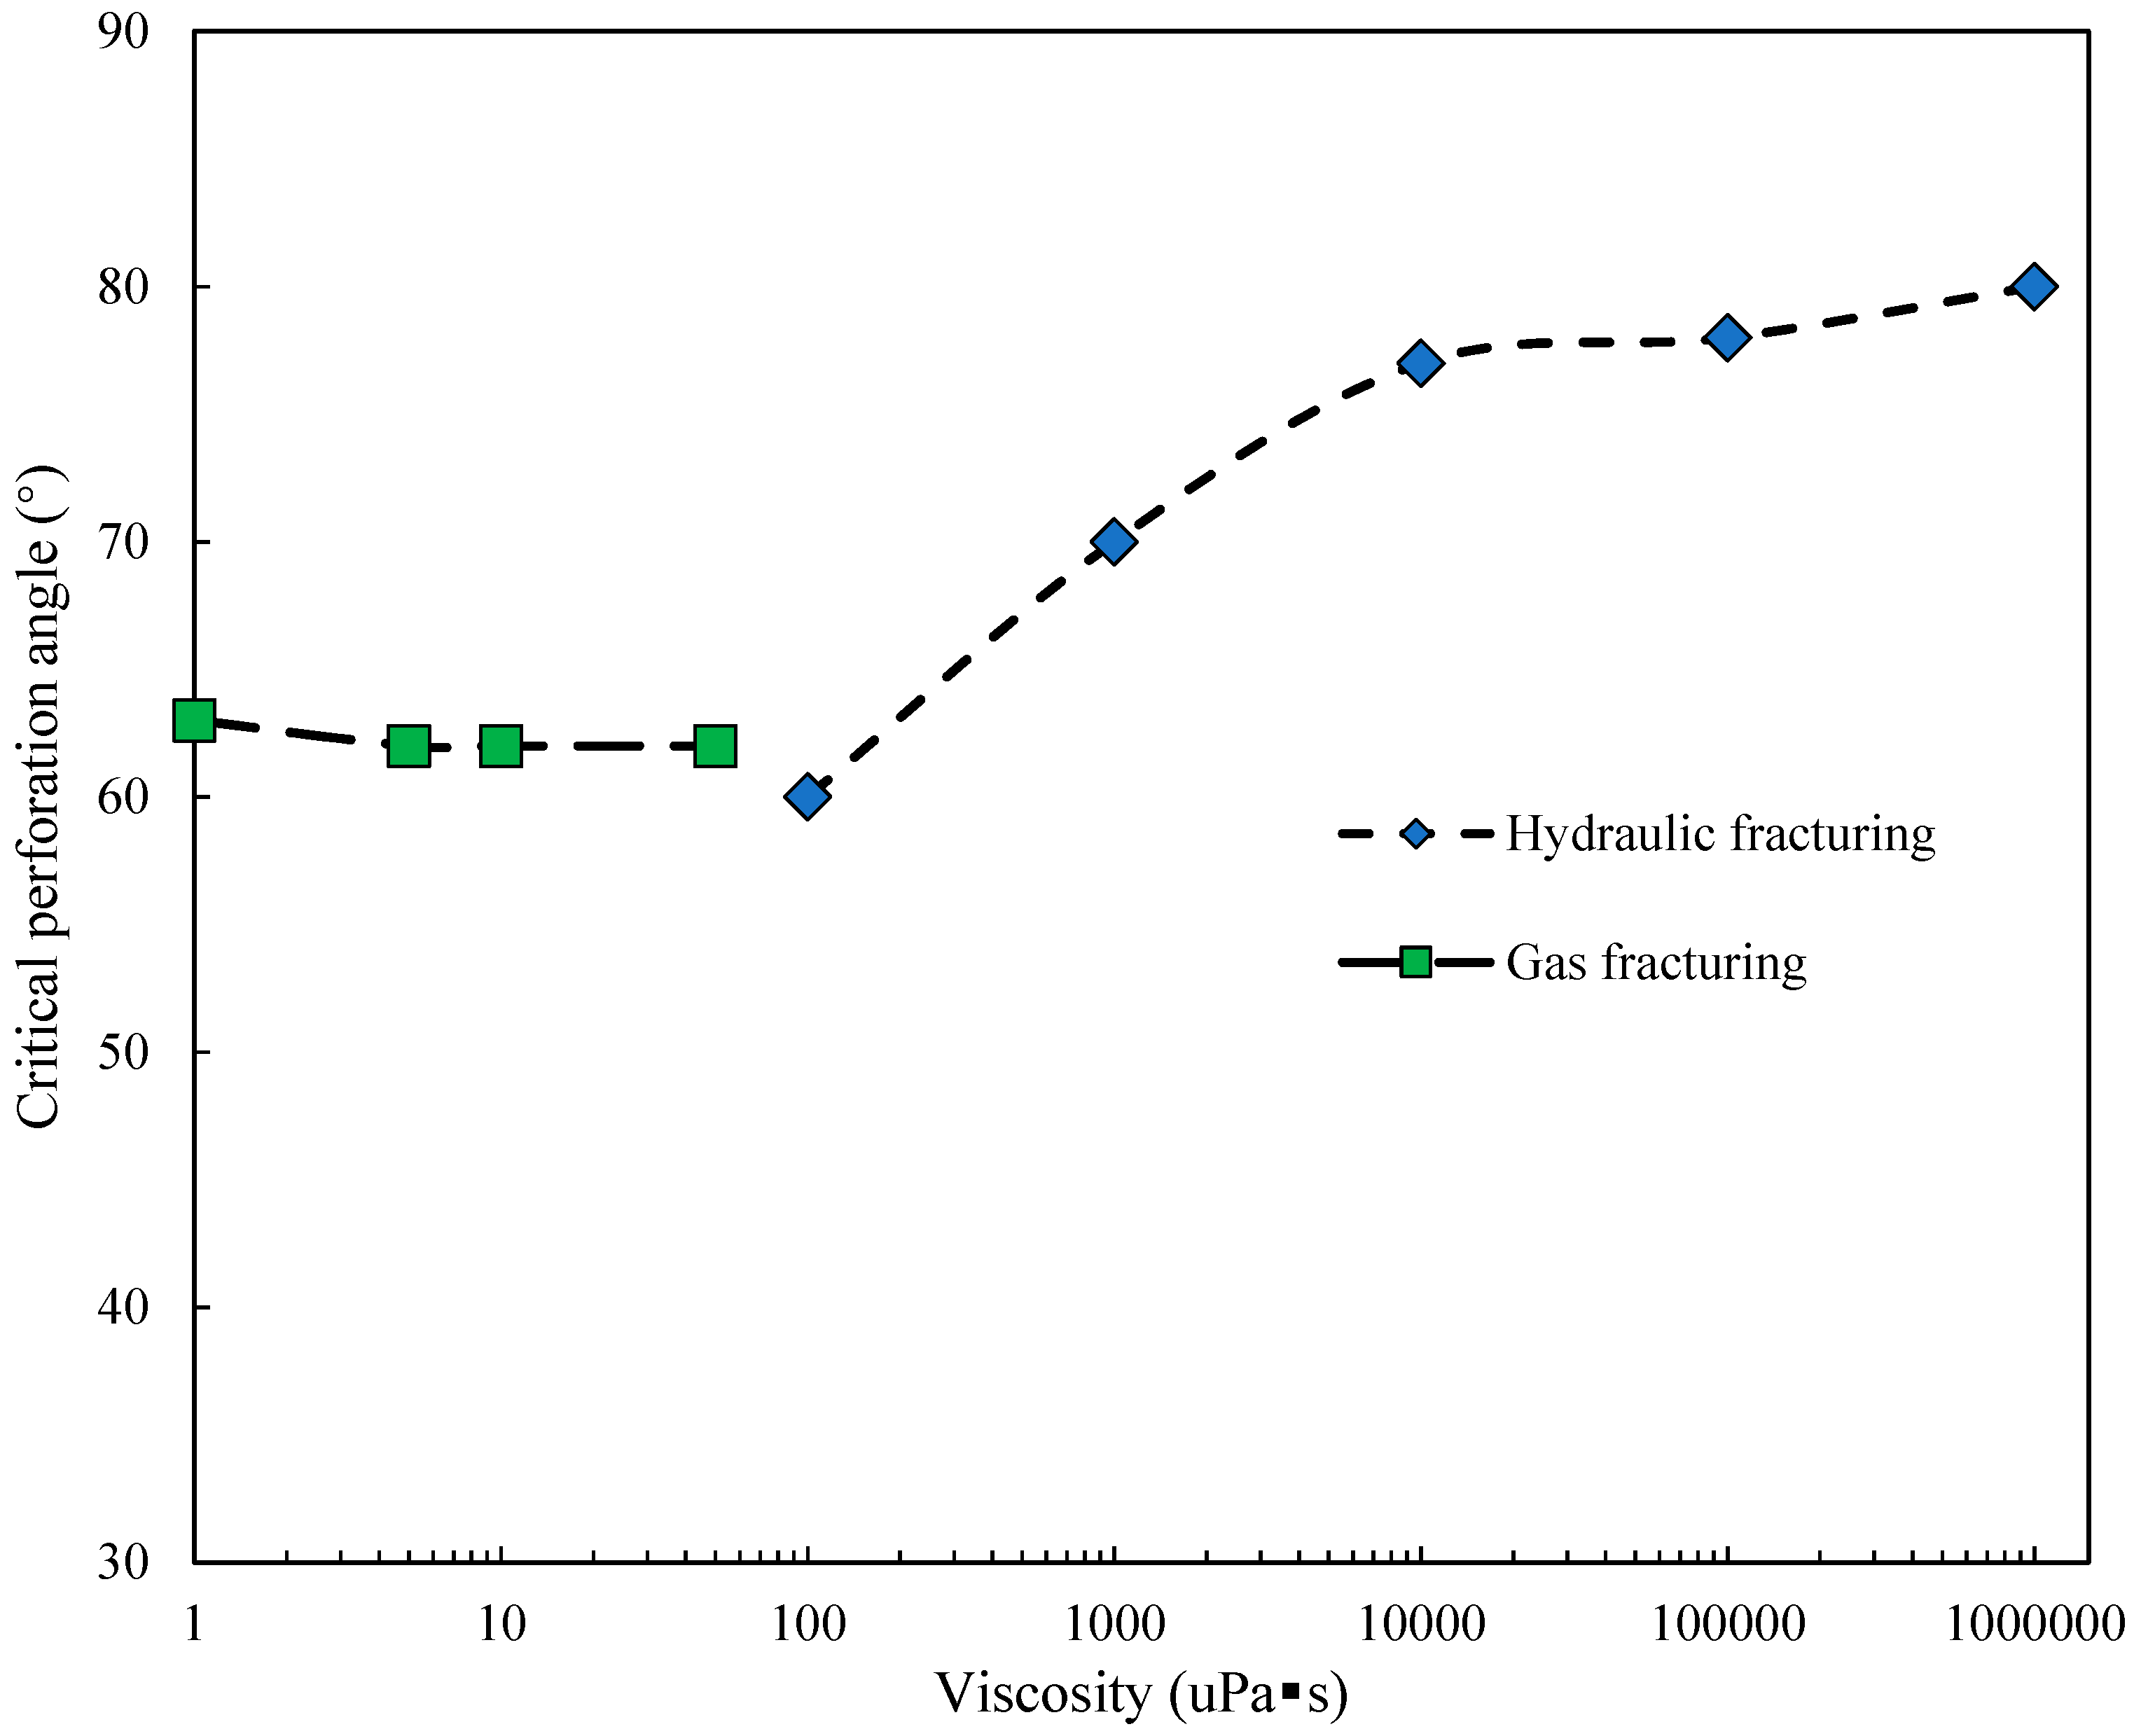
To better understand the interaction between hydraulic fracture and oriented perforation, a fully coupled finite element method (FEM)-based hydraulic-geomechanical fracture model accommodating gas sorption and damage has been developed. Damage conforms to a maximum stress criterion in tension and to Mohr–Coulomb limits in shear with heterogeneity represented by a Weibull distribution. Fracturing fluid flow, rock deformation and damage, and fracture propagation are collectively represented to study the complexity of hydraulic fracture initiation with perforations present in the near-wellbore region. The model is rigorously validated against experimental observations replicating failure stresses and styles during uniaxial compression and then hydraulic fracturing. The influences of perforation angle, in situ stress state, initial pore pressure, and properties of the fracturing fluid are fully explored. The numerical results show good agreement with experimental observations and the main features of the hydraulic fracturing process in heterogeneous rock are successfully captured. A larger perforation azimuth (angle) from the direction of the maximum principal stress induces a relatively larger curvature of the fracture during hydraulic fracture reorientation. Hydraulic fractures do not always initiate at the oriented perforations and the fractures induced in hydraulic fracturing are not always even and regular. Hydraulic fractures would initiate both around the wellbore and the oriented perforations when the perforation angle is >75°. For the liquid-based hydraulic fracturing, the critical perforation angle increases from 70° to 80°, with an increase in liquid viscosity from 10−3 Pa·s to 1 Pa·s. While for the gas fracturing, the critical perforation angle remains 62° to 63°. This study is of great significance in further understanding the near-wellbore impacts on hydraulic fracture propagation and complexity.

1. Introduction

Hydraulic fracturing is commonly used to improve productivity from hydrocarbon reservoirs and has been a key technique in accessing unconventional shale reservoirs. As such, it is recognized as one of the most effective stimulation techniques for enhanced recovery from reservoirs [1,2]. Hydraulic fracturing is used not only to create macro-scale fractures but is also complicit in connecting and reactivating pre-existing fractures at all scales to create transport pathways within reservoirs. The transport linkage between preexisting flaws (i.e., perforations, joints, and natural fractures) are often critical to hydrocarbon production from reservoirs. These natural fractures or other flaws can induce complex fracture geometries and flow pathways resulting from both tensile and shear failure [3,4,5]. Implicit in this is understanding fracture initiation and propagation in the near-wellbore region as of great significance for hydraulic fracture treatment and injectivity test interpretation [6,7,8].
Since most wells are cased and require to be perforated to access the reservoir, the majority of hydraulic fracturing treatments are conducted through perforations. Perforations play a vital role in the origin of complex fracture geometries [6,9,10,11,12]. In fractured reservoirs, perforations are often the sole hydraulic connection between the fractured reservoir and the wellbore. Hydraulic fractures initiated from preexisting perforations will reorient themselves normal to the direction of the minimum far-field stress as they propagate out from the wellbore [2,4,13,14,15,16]. Near the wellbore, multiple sub-parallel fractures may be generated due to fracture initiation processes such as perforations and natural flaws located at the open-hole wellbore wall. Hydraulic fractures commonly initiate either from perforations located at the cased wellbore or from preexisting natural fractures intersecting an uncased wellbore [17]. However, when the perforation angle and the horizontal stress difference are large, dual fractures may be induced along perforations and the maximum stress direction. This means that the fractures formed by hydraulic fracturing from orientated perforations may be very complex. With regard to moving boundary problems in hydraulic fracturing, many model reduction techniques have been proposed to achieve the desired accuracy and computational efficiency [18,19,20]. Recently, several efforts have been made to determine an optimal perforation condition utilizing the integrated reduced-order model [21] and 3D fracture-propagation model [22]. Near-wellbore effects contain the fracture curvature, pressure enhancement in perforation hole and fracture branching, which are crucial issues regarding stimulated reservoir volume thus production. Therefore, in this paper, phenomena on the hydraulic fracture curving and branching near wellbore are focused. Furthermore, a finite element method (FEM)-based damage model is proposed to simulate the complete evolution of hydraulic fractures initiation and propagation. The impacts of oriented perforations on the near-wellbore fracture complexity are examined in terms of fracture trajectory, horizontal differential stress, fracturing fluid viscosity, and wellbore pressure.
Mechanical and transport properties of the reservoir may be significantly altered during stimulation [23,24,25,26,27,28]. In consideration of mentioned above, the impact of perforations and pre-existing features in reservoirs on the evolution of fluid-driven fractures, their interaction with pre-existing features and the resulting complexity of the evolving fracture network are investigated. This response is explored through a novel fully coupled model of rock damage and fluid flow for both slightly compressible and compressible fluids. Damage conforms to a maximum stress criterion in tension and to Mohr–Coulomb limits in shear with heterogeneity represented by a Weibull distribution. Fracturing fluid flow, rock deformation and damage, and fracture propagation are collectively represented to study the complexity of hydraulic fracture initiation with perforations present in the near-wellbore region. Specifically, the main objective of this study is thus to investigate the effects of preexisting perforation angle, horizontal differential stress, fracturing fluid, and initial pore pressure on fracture propagation and complexity. Research findings are applied to optimize perforation design in order to minimize high treatment pressures and to control complexity in the near-wellbore fracture region.

2. Conceptual Model

The near-wellbore fractures initiated from two symmetrically oriented perforations considered in this study are shown in Figure 1. The 2D hydraulic fracture model considers a cross-section through a vertical well with its axis aligned in the direction of maximum or intermediate principal stress. These two perforations are represented by two preexisting fractures (2D perforations rather than tunnels), which serve as initiation sites for the propagation of longitudinal hydraulic fractures. On the condition that the perforated interval is long, or the well is not cemented and cased, these hydraulic fractures and their propagation within the transverse plane are assumed to propagate under plane-strain conditions [17,29]. After initiation, and beyond the influence of the wellbore, the hydraulic fractures will reorient themselves from the perforation to the orientation of the minimum principal stress. However, when the perforation angles are large, more than two hydraulic fractures may initiate in a homogeneous rock instead of just a single zigzag shape fracture, as described in Figure 1.
The in situ stress field is defined in terms of the in-plane maximum horizontal stress σH and minimum horizontal stress σh. The preexisting perforation length L is assumed to be very small relative to the wellbore radius r—therefore the impact of preexisting perforation length on hydraulic fracture path can be neglected. The perforation is defined by its azimuth θ with respect to the orientation of maximum horizontal stress σH (x-axis). If the perforation tunnel is oriented in the direction of the maximum principal stress ( θ = 0 ), the hydraulic fractures would propagate directly in this (x-axis) direction. When the tunnels are oblique to this direction ( θ 0 ) the hydraulic fractures must ultimately reorient themselves parallel to the direction of the maximum horizontal stress when they exit the stress shadows of the near-wellbore region and of the perforation. Beyond such stress-shadows, the hydraulic fractures tend to propagate in the plane of least resistance perpendicular to the minimum horizontal stress.

3. Formulation of the Conceptual Model

During hydraulic fracturing, fluids will penetrate into the porous medium surrounding both the borehole and the perforation tunnel. Thus, the evolution of the fracture(s) then results from this coupled phenomenon of fluid flow, solid deformation, and damage. The governing equations for this fully coupled hydrological-mechanical damage behavior were developed based on conservation of mass, momentum, and energy. The effects of rock damage on the evolving mechanical and transport parameters are also considered.

3.1. Governing Equations for Mechanical Response

The poroelastic constitutive relation for rock deformation is given by Reference [30]:
ε i j = 1 2 G σ i j ( 1 6 G 1 9 K ) σ k k δ i j + α 3 K p δ i j + 1 3 ε s δ i j
where G is the equivalent shear modulus (Pa), K is the bulk modulus (Pa), p is the fluid pressure (Pa), δ i j is the Kronecker delta, α is the Biot coefficient, and ε s is the adsorption strain (m/m).
The gas adsorption strain may be represented by the Langmuir isotherm, as follows [31]:
ε s = ε L p p + P L
where ε L is the Langmuir strain constant (m/m) and P L is the Langmuir pressure constant (Pa).
From this, a modified Navier-type constitutive deformation [32], in terms of displacement ui (m) and fluid pressure p (Pa), can be expressed as:
G u i , k k + G 1 2 v u k , k i α p , i K ε s , i + f , i = ρ s 2 u i t 2
where the effects of fluid pressure and injection rate on the rock deformation are defined as Equation (3).

3.2. Governing Equations for Fluid Flow

For the purpose to study the effect of different fracturing fluids on fracture complexity, fluid flow for both slightly compressible (liquids) and compressible (gases) fluids are presented, respectively.

3.2.1. Slightly Compressible Fluids

In general, the equation of state is defined with regard to the fluid compressibility, cf (Pa−1), as:
c f = 1 ρ ρ p
Assuming that the fluid compressibility cf is constant over a prescribed range of pressure, after integration, Equation (4) can be written as:
ρ = ρ 0 e c f ( p p 0 )
where ρ 0 is the density (kg·m−3) at the reference pressure p0 (Pa). According to Taylor series expansion, this may be expressed as:
ρ = ρ 0 [ 1 + c f ( p p 0 ) + 1 2 c f 2 ( p p 0 ) 2 + ]
with an approximate result given by:
ρ ρ 0 [ 1 + c f ( p p 0 ) ]
Similarly, the rock compressibility may be defined as:
c r = 1 ϕ ϕ p
and again, after integration, this may be written as:
ϕ = ϕ 0 e c r ( p p 0 )
where ϕ 0 is the porosity at p0. Similarly, this may be approximated as:
ϕ ϕ 0 [ 1 + c r ( p p 0 ) ] .
Neglecting the effect of gravity, which will be small in relation to fluid pressure gradients, fluid flow may be defined in terms of Darcy’s law as:
q = k μ f p
where k is the equivalent permeability of the rock (m2) and μ f is the fluid viscosity (Pa·s).
According to the mass conservation equation, the governing equation for fluid transport in a porous medium is defined as:
m t + ( ρ q ) = Q s
where m is fluid mass, ρ is fluid density (kg·m−3), q is the Darcy velocity vector and Q s is the source or sink of the compressible fluid defined in terms of mass rate (kg·m−3·s−1).
Supposing that the rock is fluid-saturated, the fluid content per unit volume can be expressed as m = ρ ϕ , where ϕ is the porosity. For slightly compressible fluids the partial derivative of m with respect to time can be written as:
m t = ϕ ρ t + ρ ϕ t
The total compressibility may be defined as:
c t = c f + ϕ 0 ϕ c r
Combining Equations (4)–(14) yields the governing equation for slightly compressible fluid flow in the fracture network as:
ϕ ρ c t p t + ( ρ k μ f p ) = Q s
enabling solution for evolving flux or pressure boundary conditions and the evolution of permeability with damage.

3.2.2. Compressible Fluids

For compressible fluid (gas) the compressibility cg is both much larger than for a slightly compressible fluid (liquid) and variable with pressure. In such a case, the pressure-volume-temperature (PVT) relation for a non-ideal or real gas can be written as:
ρ = p M Z R T
where M is the molecular weight (kg/mol), Z is the gas compressibility factor (Pa−1), R is the universal gas constant (J·mol−1·K−1), and T is the temperature (K). Assuming that the gas compressibility and viscosity are constant, then the governing relation is defined as:
ϕ M Z R T p t + ( ρ k μ g p ) = Q s
accommodating the pressure dependent compressibility of the fluid.

3.3. Governing Equations Accommodating Rock Heterogeneity and Damage Evolution

To characterize heterogeneity at the mesoscopic-level, mechanical parameters such as strength, Young’s modulus, and Poisson’s ratio may be assigned according to the Weibull distribution. This distribution defines the parameter according to a probability density function as [33]:
f ( u ) = m u 0 ( u u 0 ) m 1 e ( u u 0 ) m
where u is the parameter of interest (such as strength, Young’s modulus, or Poisson’s ratio); the scale parameter u0 is related to the average of the element parameter, and m is the shape parameter of the Weibull distribution function. m is defined as the degree of rock homogeneity and called the homogeneity index. The variations of f ( u ) with respect to m are shown in Figure 2. Obviously, a higher m value represents a more homogeneous rock.
As illustrated in Figure 3, rock damage in tension or shear is initiated when its state of stress (positive for compression) satisfies the maximum tensile stress criterion or the Mohr–Coulomb criterion, respectively as [27,33]:
F 1 = σ 3 f t 0 = 0 ,   F 2 = σ 1 σ 3 1 + sin θ 1 sin θ f c 0 = 0
where ft0 and fc0 are uniaxial tensile and compressive strength (Pa), respectively, σ 1 and σ 3 are first and third principal stresses (Pa), respectively, θ is the internal frictional angle (°), and F1 and F2 are two damage threshold functions (Pa).
Based on the theory of elastic damage, the elastic modulus of the damaged rock is expressed as [33]:
E = ( 1 D ) E 0
where D represents the damage variable, and E and E0 are the Young’s modulus (Pa) of the damaged and the undamaged element, respectively. In the present study, the element, as well as its damage, is assumed isotropic, so the E, E0 and D parameters are all scalars. Under any stress and initial conditions, the tensile stress criterion is applied preferentially. In other words, the maximum tensile stress criterion is first applied to judge whether the elements are first damaged in tension or not. Only elements that survive this test will be checked for damage in shear using the Mohr–Coulomb criterion.
In terms of the damage constitutive law shown in Figure 3, the damage variable for the rock can be calculated as [33]:
D = { 0 F 1 < 0 a n d F 2 < 0 1 | ε t 0 ε 3 | n F 1 = 0 a n d d F 1 > 0 1 | ε c 0 ε 1 | n F 2 = 0 a n d d F 2 > 0
where ε 1 and ε 3 are the major and minor principal strains (m/m), respectively. ε t 0 and ε c 0 are the maximum tensile and maximum compressive principal strains (m/m) when tensile and shear damage occurs, respectively, and n is a constitutive coefficient specified as 2.0. In Equation (19), when F1 < 0 and F2 < 0 the applied stress is insufficient to satisfy the maximum tensile stress criterion and the Mohr–Coulomb failure criterion, respectively. F1 = 0 and dF1 > 0 implies rock damage in the tensile mode when the stress state satisfies the maximum tensile stress criterion and the rock is still under load. F2 = 0 and dF2 > 0 implies rock damage in the shear mode when the stress state satisfies the Mohr–Coulomb failure criterion and the rock remains loaded.
The damage variables of Equation (21) remain in the range from 0 to 1.0 regardless of the form or magnitude of damage. However, negative and positive damage magnitudes are respectively adapted for damage in tension and in shear, merely to allow visualization of the two damage modes in post-processed figures. In this regard, tensile damage is represented as negative numbers (−1 ≤ D < 0), while shear damage is represented as positive numbers (0 < D ≤ 1). In the respect of the irreversibility of damage, the damage variable may only increment monotonically from zero during loading (dF1 > 0 or dF2 > 0) and remain unchanged during unloading (dF1 < 0 or dF2 < 0). In this respect, the damage, defined by Equation (20), reduces the elastic modulus E and the shear modulus G of the rock, via to Equations (20) and (21).

4. Model Validation against Experimental Observations

In this section, the hydraulic fracturing geomechanical model proposed in this study is validated against observed mechanisms of uniaxial compression and hydraulic fracturing [11].

4.1. Comparisons of Breakdown Pressure and Fracture Geometry

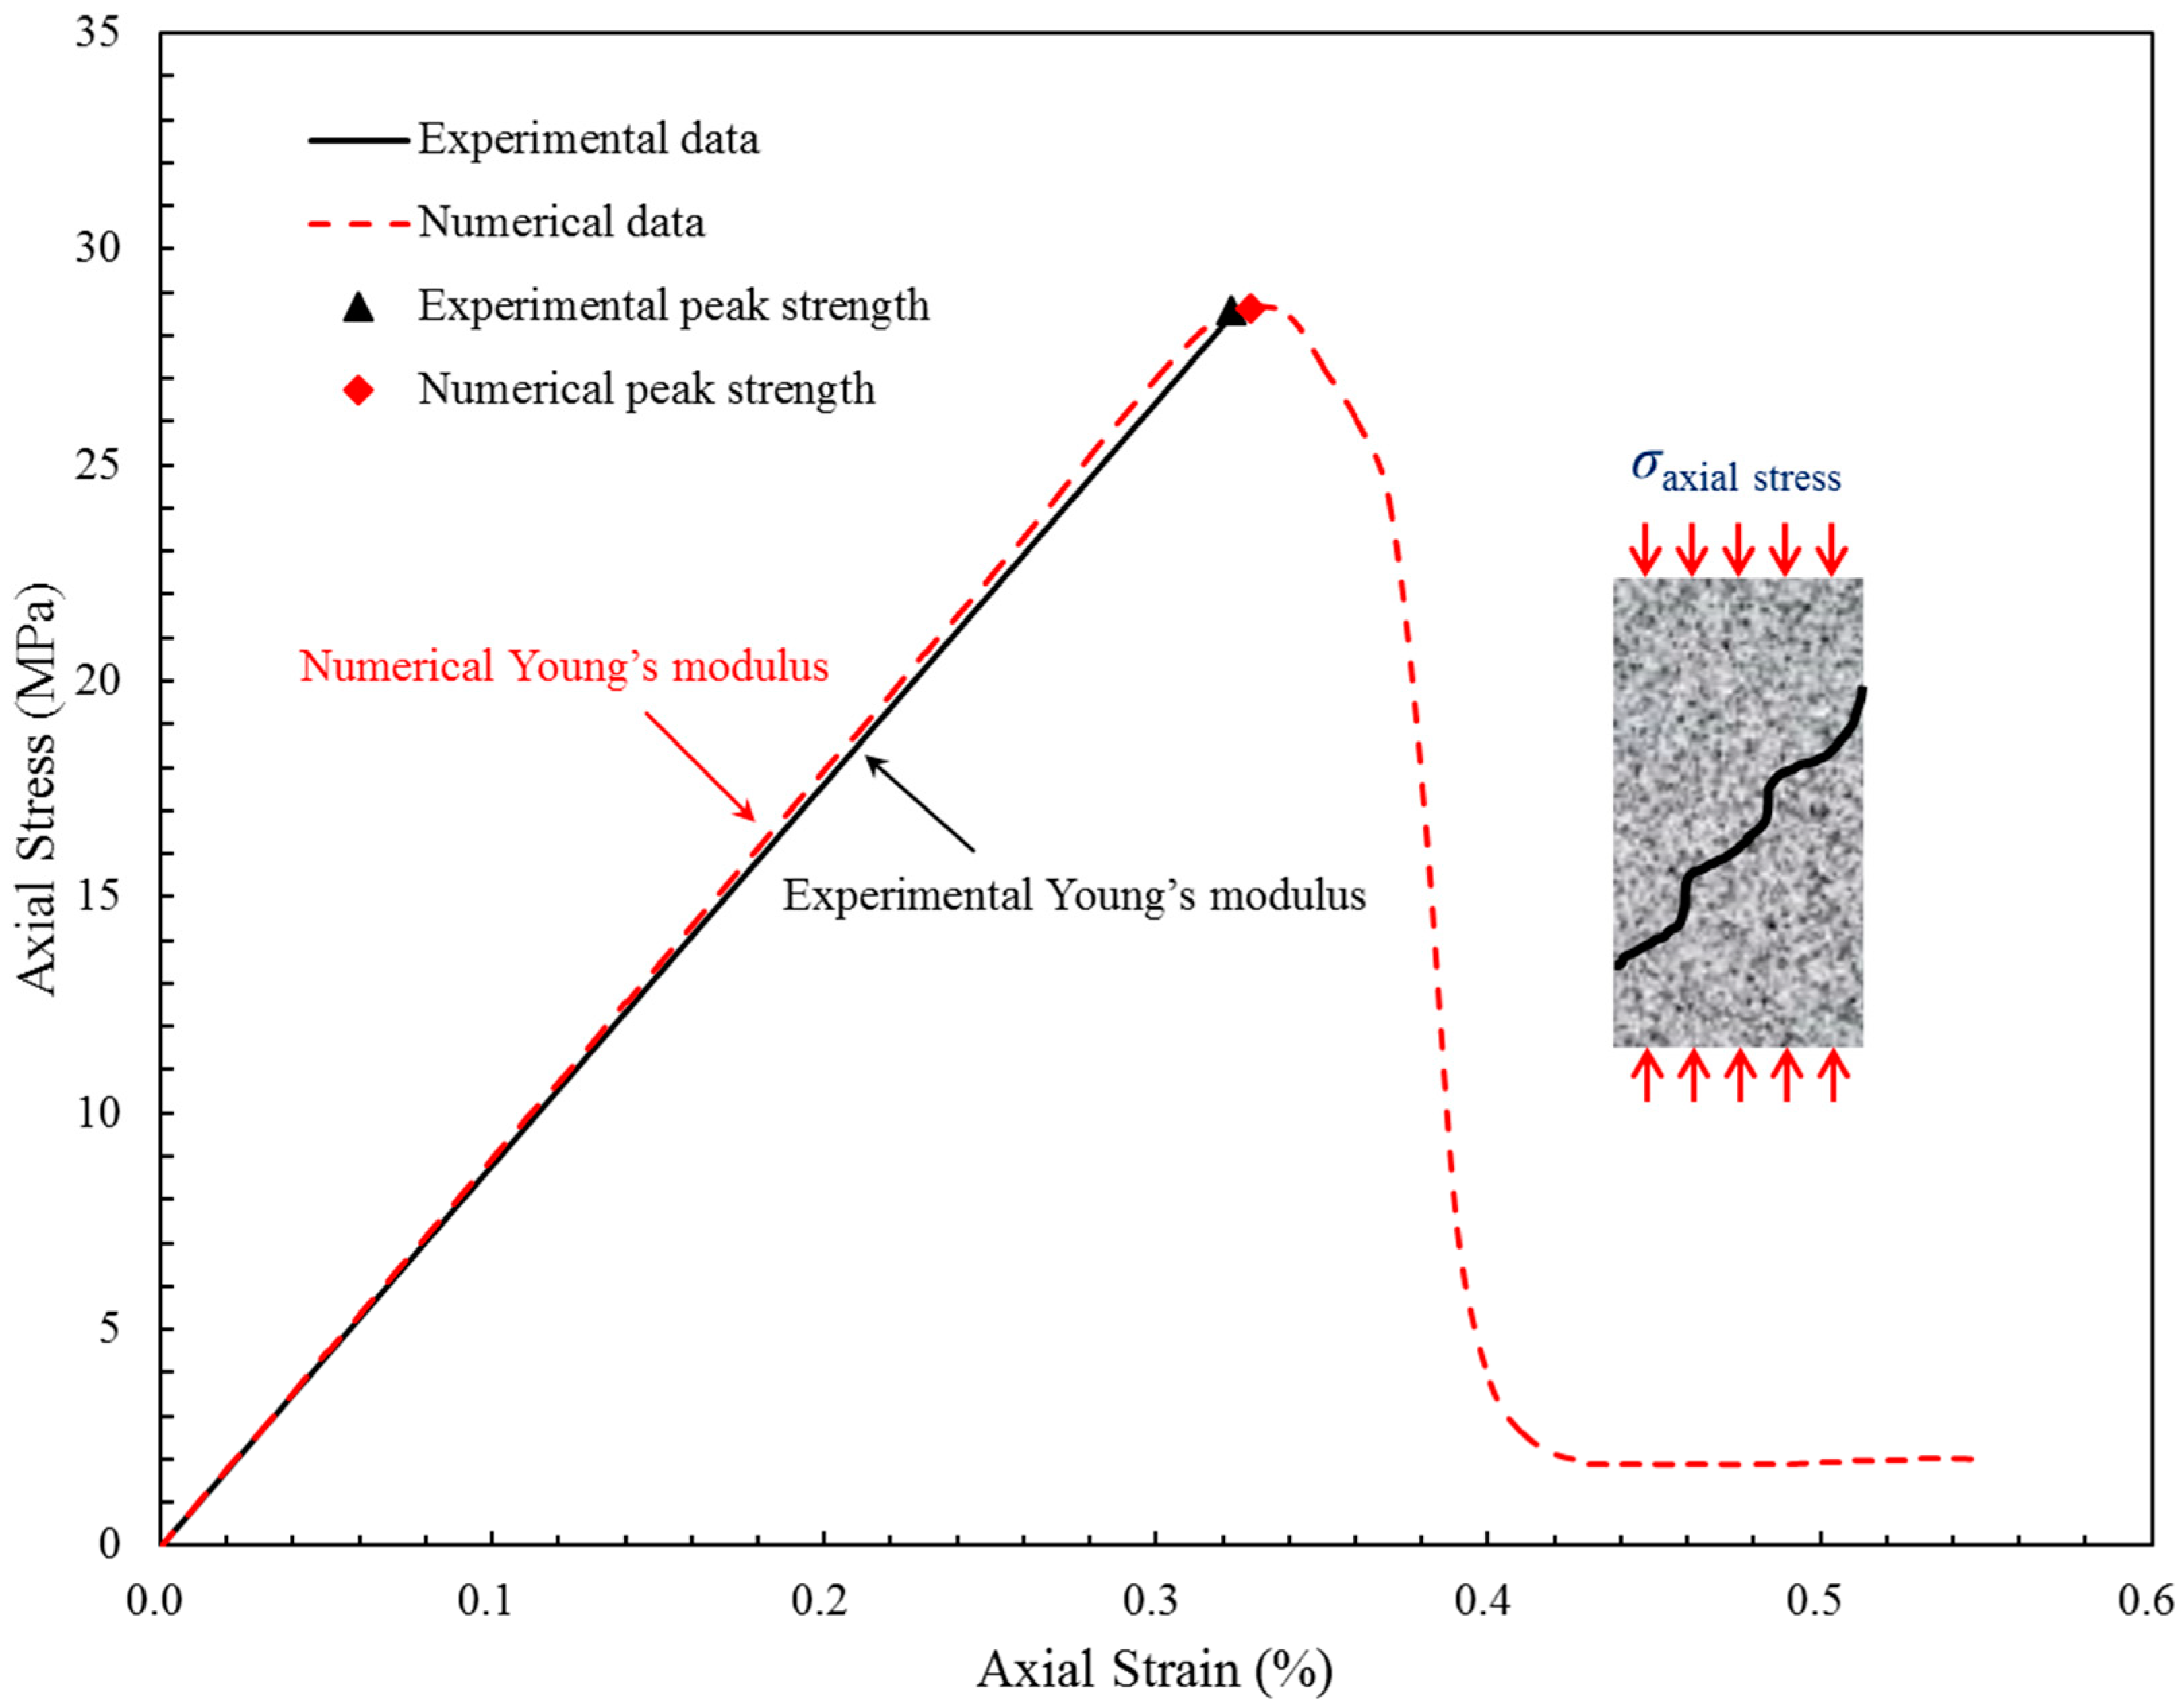
The relationship between axial stress and axial strain during modeled rupture of a uniaxial specimen is shown in Figure 4 relative to the mechanical parameters recovered from experiment [11]. Apparent from Table 1 and Figure 4 is that the experimental data adequately replicate the anticipated stress-strain behavior. Additionally, it should be noted that the simulation of uniaxial compression is conducted to provide basic mechanical properties to inform the numerical simulation of hydraulic fracturing conducted in the same material. A visual comparison between experimental results [11] and the numerical simulations is shown in Figure 5. As can be seen from Figure 5, the fracture pattern recovered from the numerical model is consistent with experimental observations. Hydraulic fractures initiate outward along the perforation and as they propagate away from the near-wellbore towards the region of unaltered in-situ stress they reorient themselves perpendicular to the minimum horizontal stress.

4.2. Geometric Model and Boundary Conditions

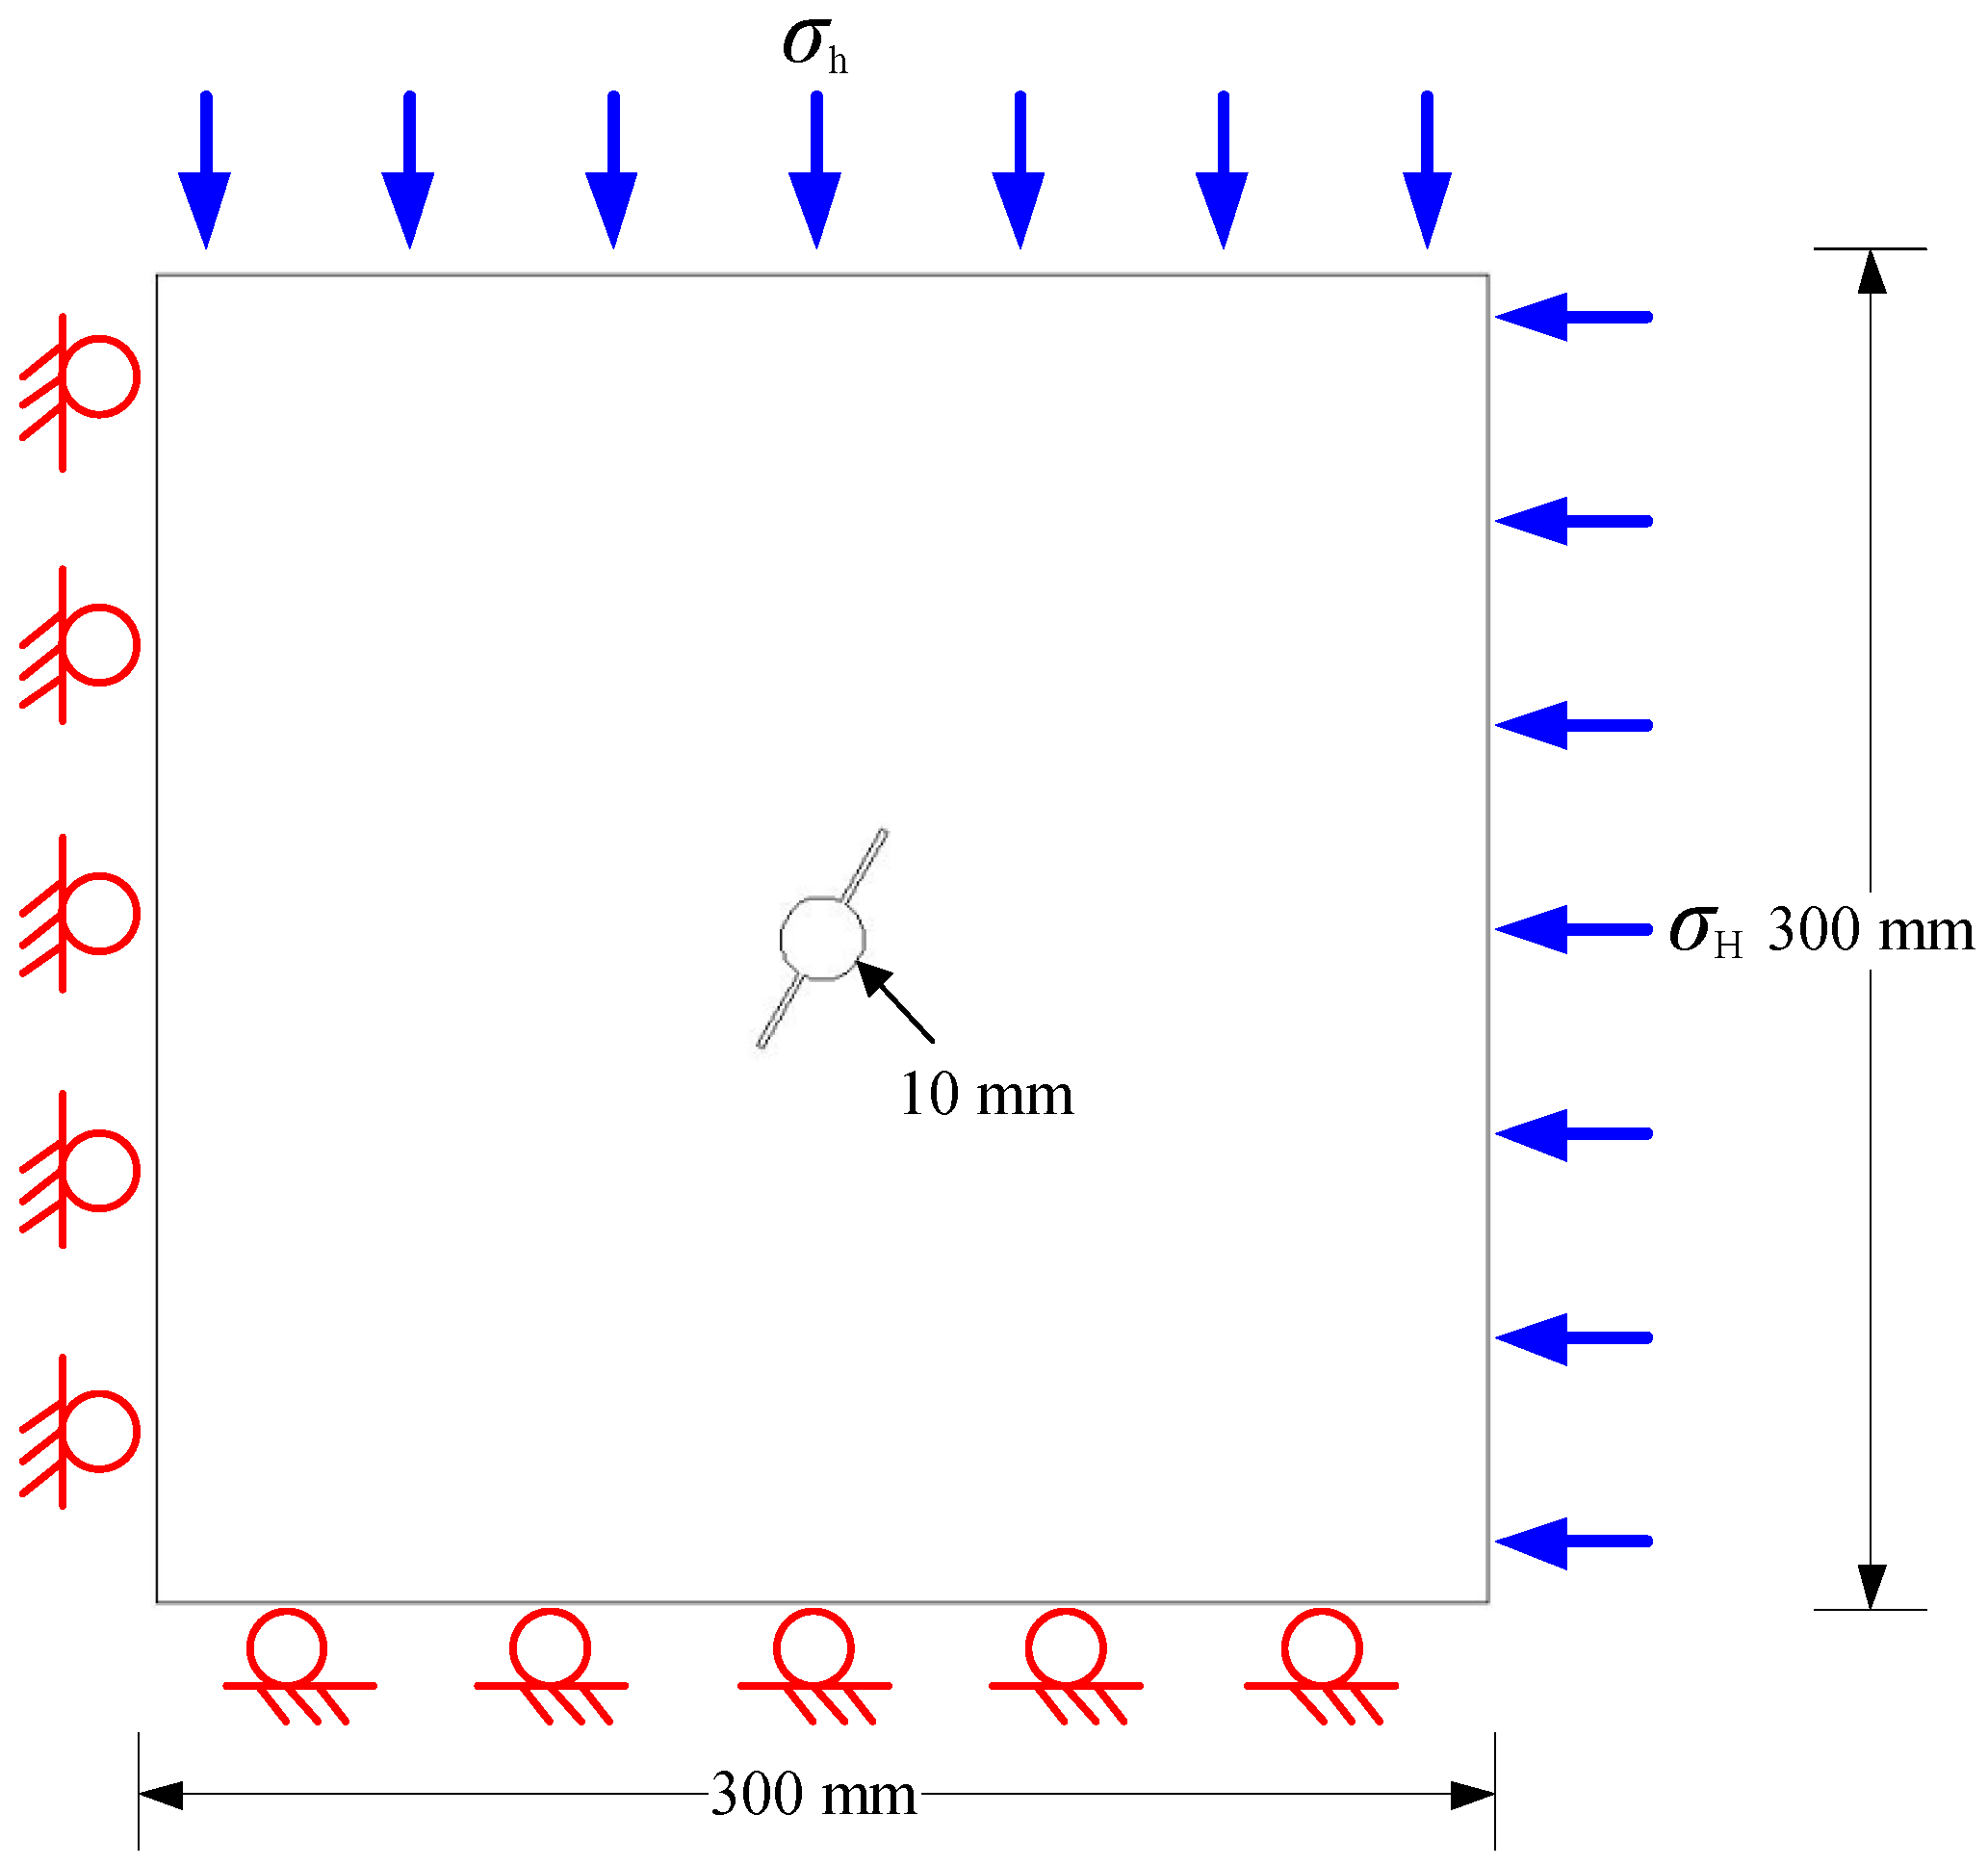
The geometry and boundary conditions of the specimen are simplified as shown in Figure 6. The numerical specimen, 300 mm on edge with a 10 mm diameter borehole at the center is subjected to a biaxial horizontal stress. The boundary conditions correspond to a confining pressure σH applied on the top boundary and σh applied on the right boundary with rollers applied along both the left side and the base. There are no-flux conditions on all boundaries except for the borehole wall into which a constant fluid injection rate is applied. The fluid injection rate in the experiments is 2.1 × 10⁻⁹ m3·s−1. The numerical mechanical properties for the simulation are listed in Table 2.

4.3. Effects of Preexisting Perforation Orientation

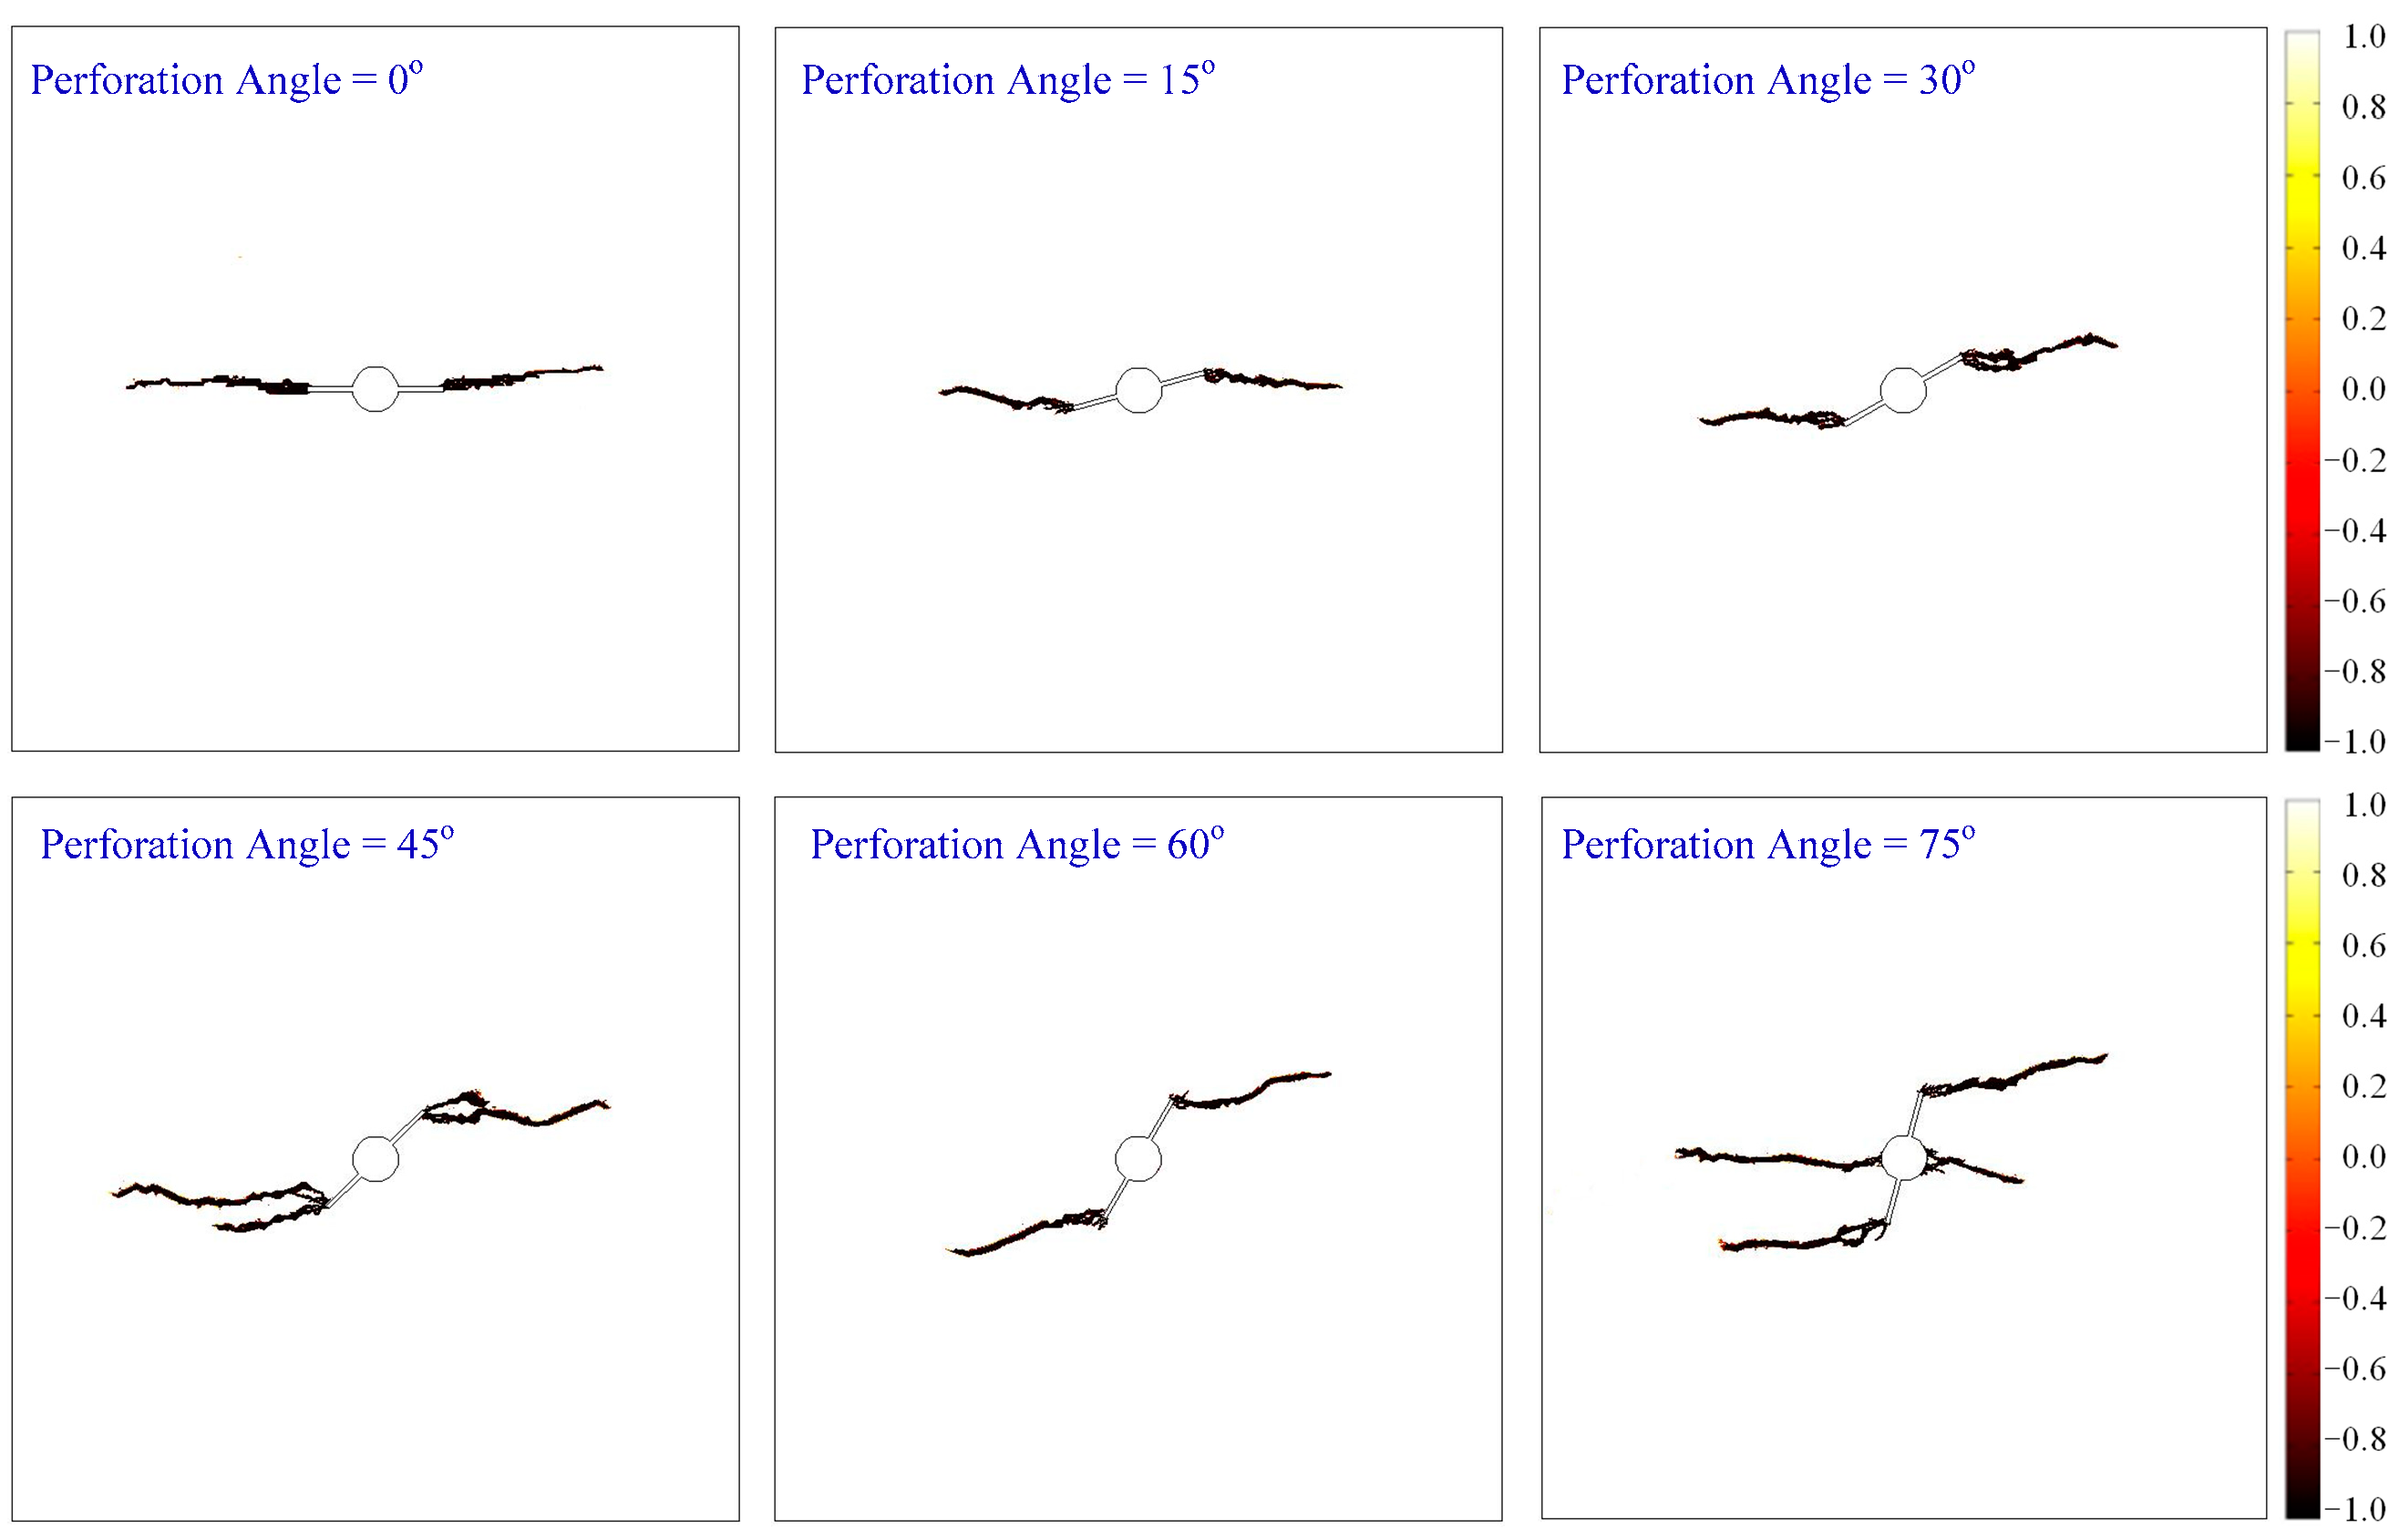
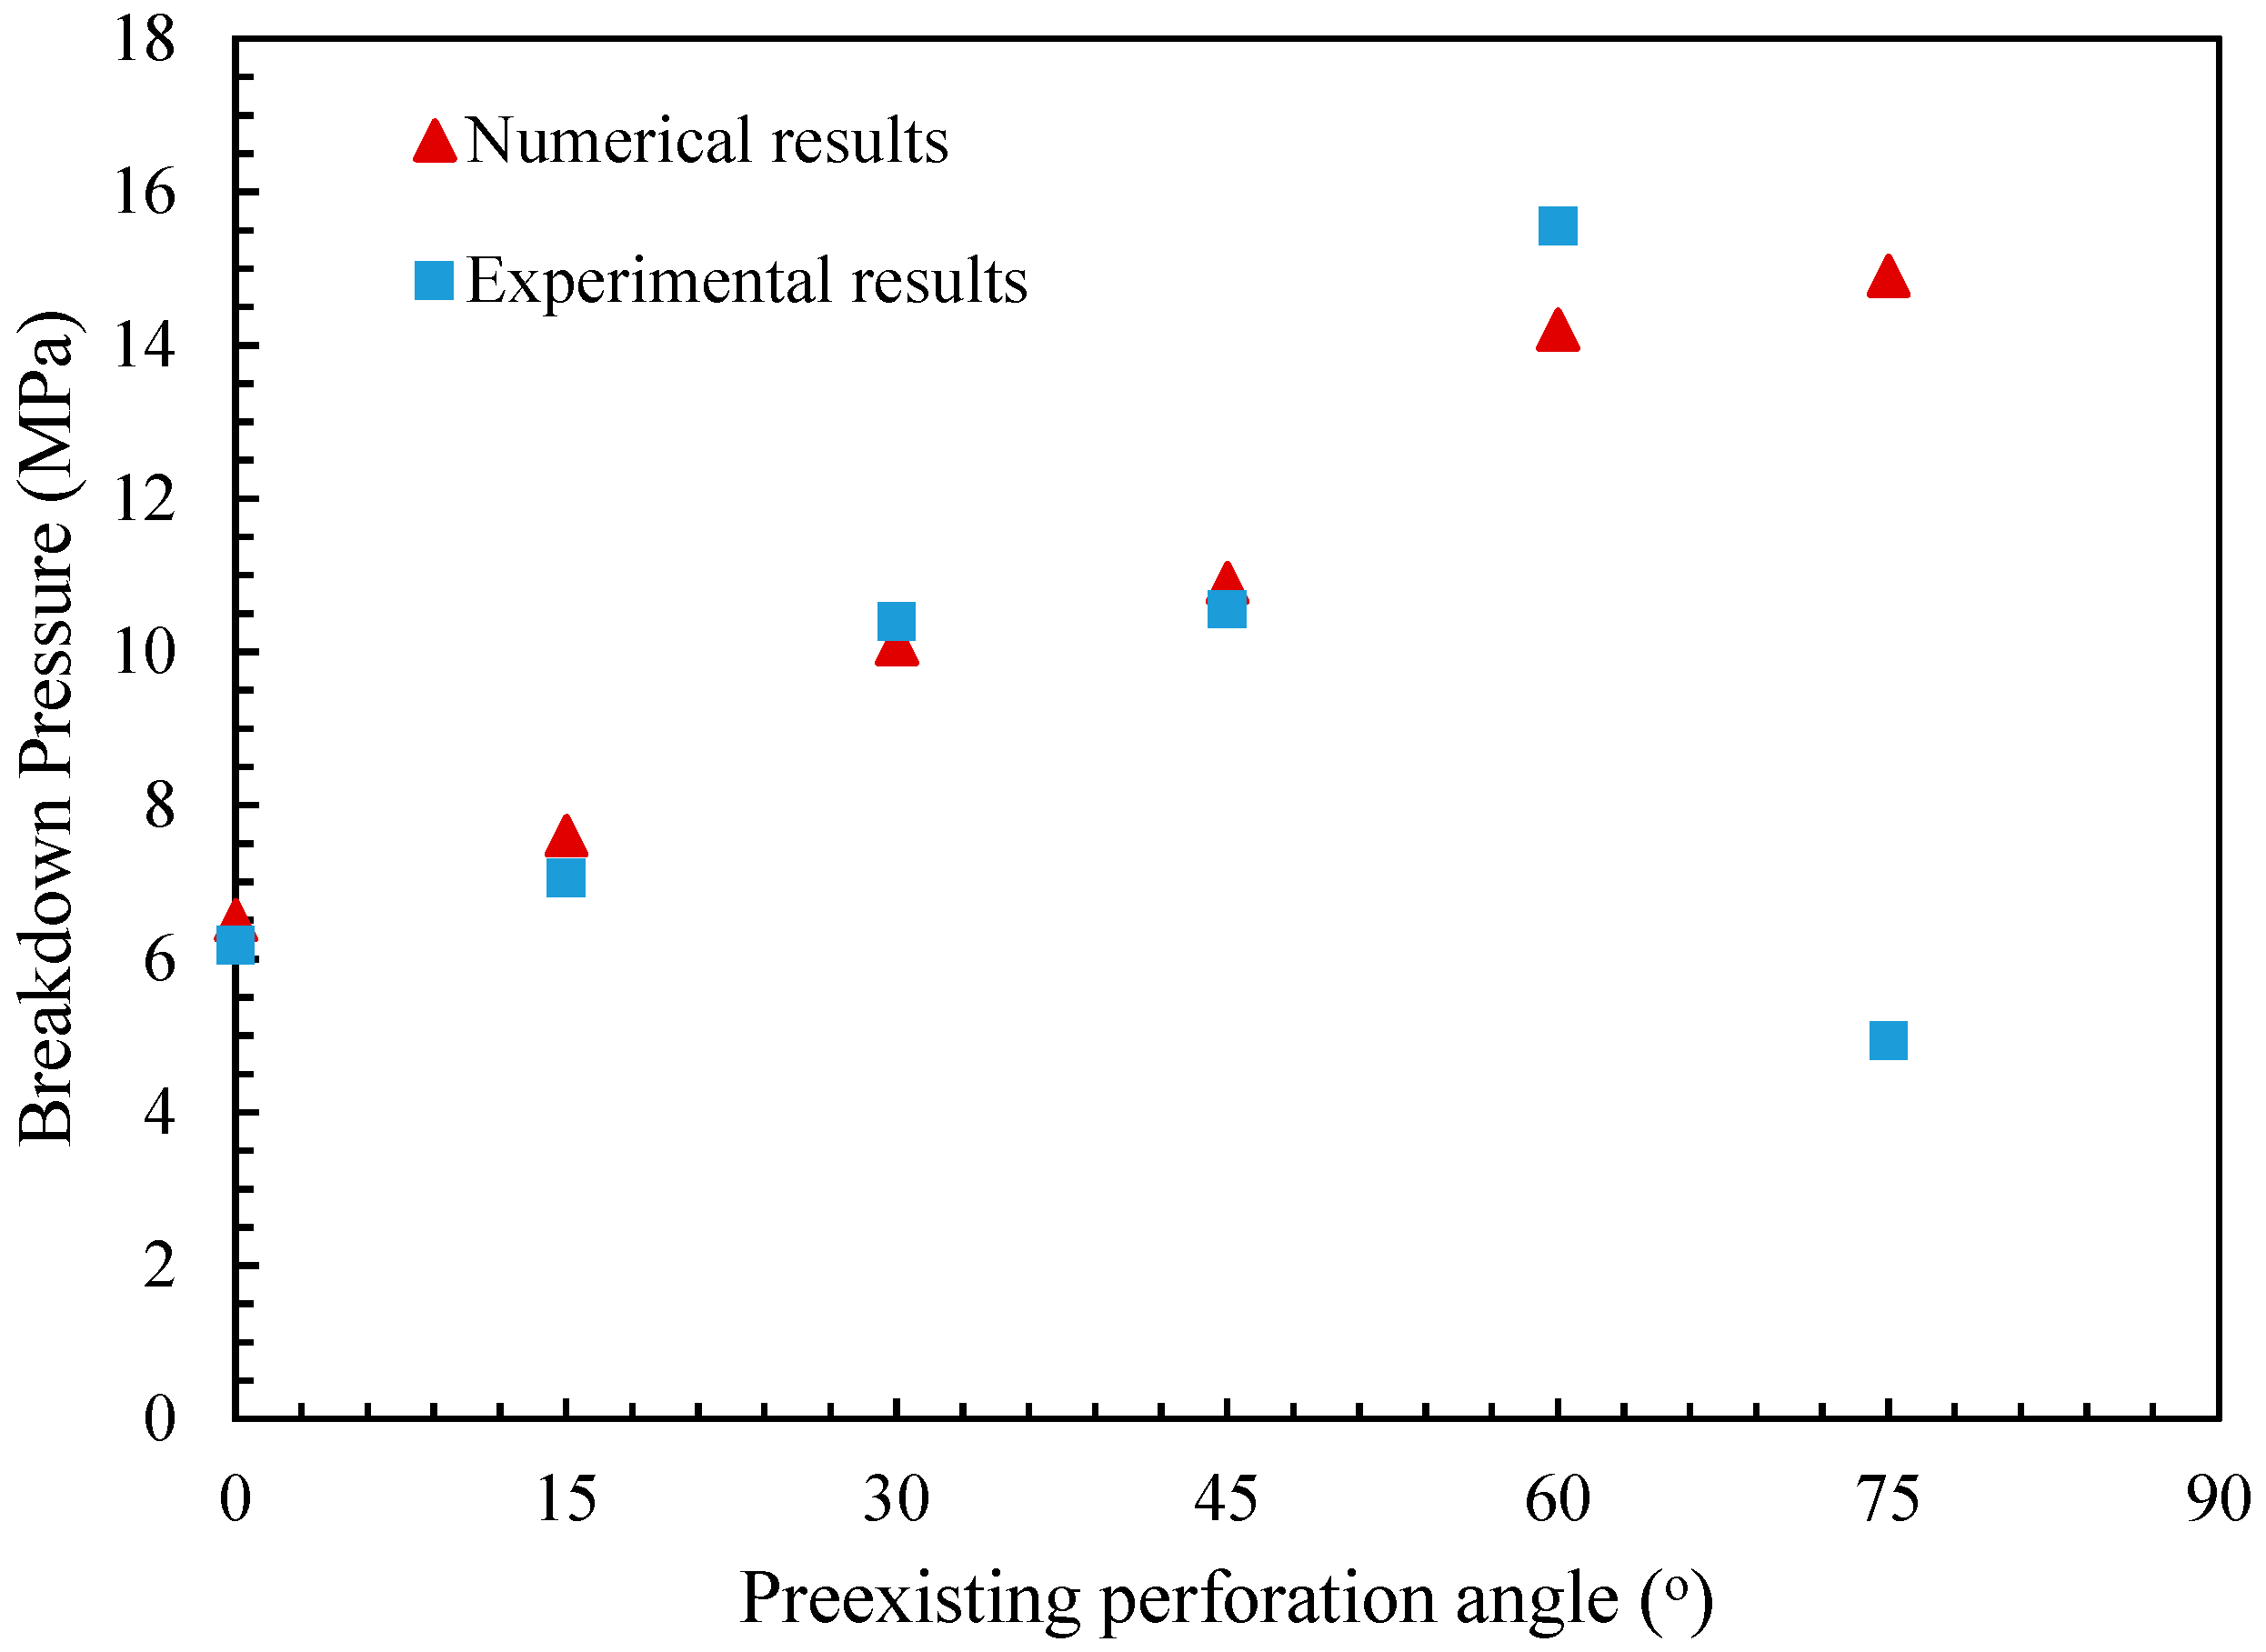
Perforation orientation has a significant effect on the geometry of the hydraulic fracture initiated from the wellbore. The azimuth and length of the preexisting perforation are two important factors that affect hydraulic fracture propagation and pattern. An optimal preexisting perforation should initiate only a single wing fracture with minimum tortuosity at an achievable breakdown pressure [9,34]. Numerical simulations for cases with preexisting perforation angles of 0°, 15°, 30°, 45°, 60°, and 75° are conducted to examine the response. As shown in Figure 7 and Figure 8, a larger perforation angle induces a relatively larger curvature during the reorientation of the hydraulic fractures and takes a long distance for the hydraulic fracture to rotate to the direction completely aligned with the direction of the maximum horizontal stress. A larger perforation angle requires a higher breakdown pressure to initiate the hydraulic fracture. In addition, another observation is that hydraulic fractures are initiated both around the wellbore and preexisting fractures when the perforation angle is 75°. Additionally, hydraulic fractures do not always initiate from preexisting perforations. The fractures formed by hydraulic fracturing with oriented perforations have a complex morphology. Therefore, for perforations in field operations, perforations with a high angle are generally not recommended and should be avoided as much as possible [14]. Specifically, there is a significant difference in breakdown pressure between numerical and experimental results, when the perforation angle is 75°. This may be due to experimental inconsistencies or due to heterogeneity in the sample, since it is expected that the breakdown pressure would increase with an increase of the perforation angle [9,14,17].

5. Analysis of Near-Wellbore Hydraulic Fracture Complexity

In situ stress, initial pore pressure, and fluid viscosity are important factors that affect the tortuosity and extension pressure of near-wellbore hydraulic fractures. In order to fully understand hydraulic fracture behavior in the field, sensitivity studies are conducted to investigate the effects of in situ horizontal differential stress, initial pore pressure, and fracturing fluid viscosity.

5.1. Effects of Horizontal Differential Stress

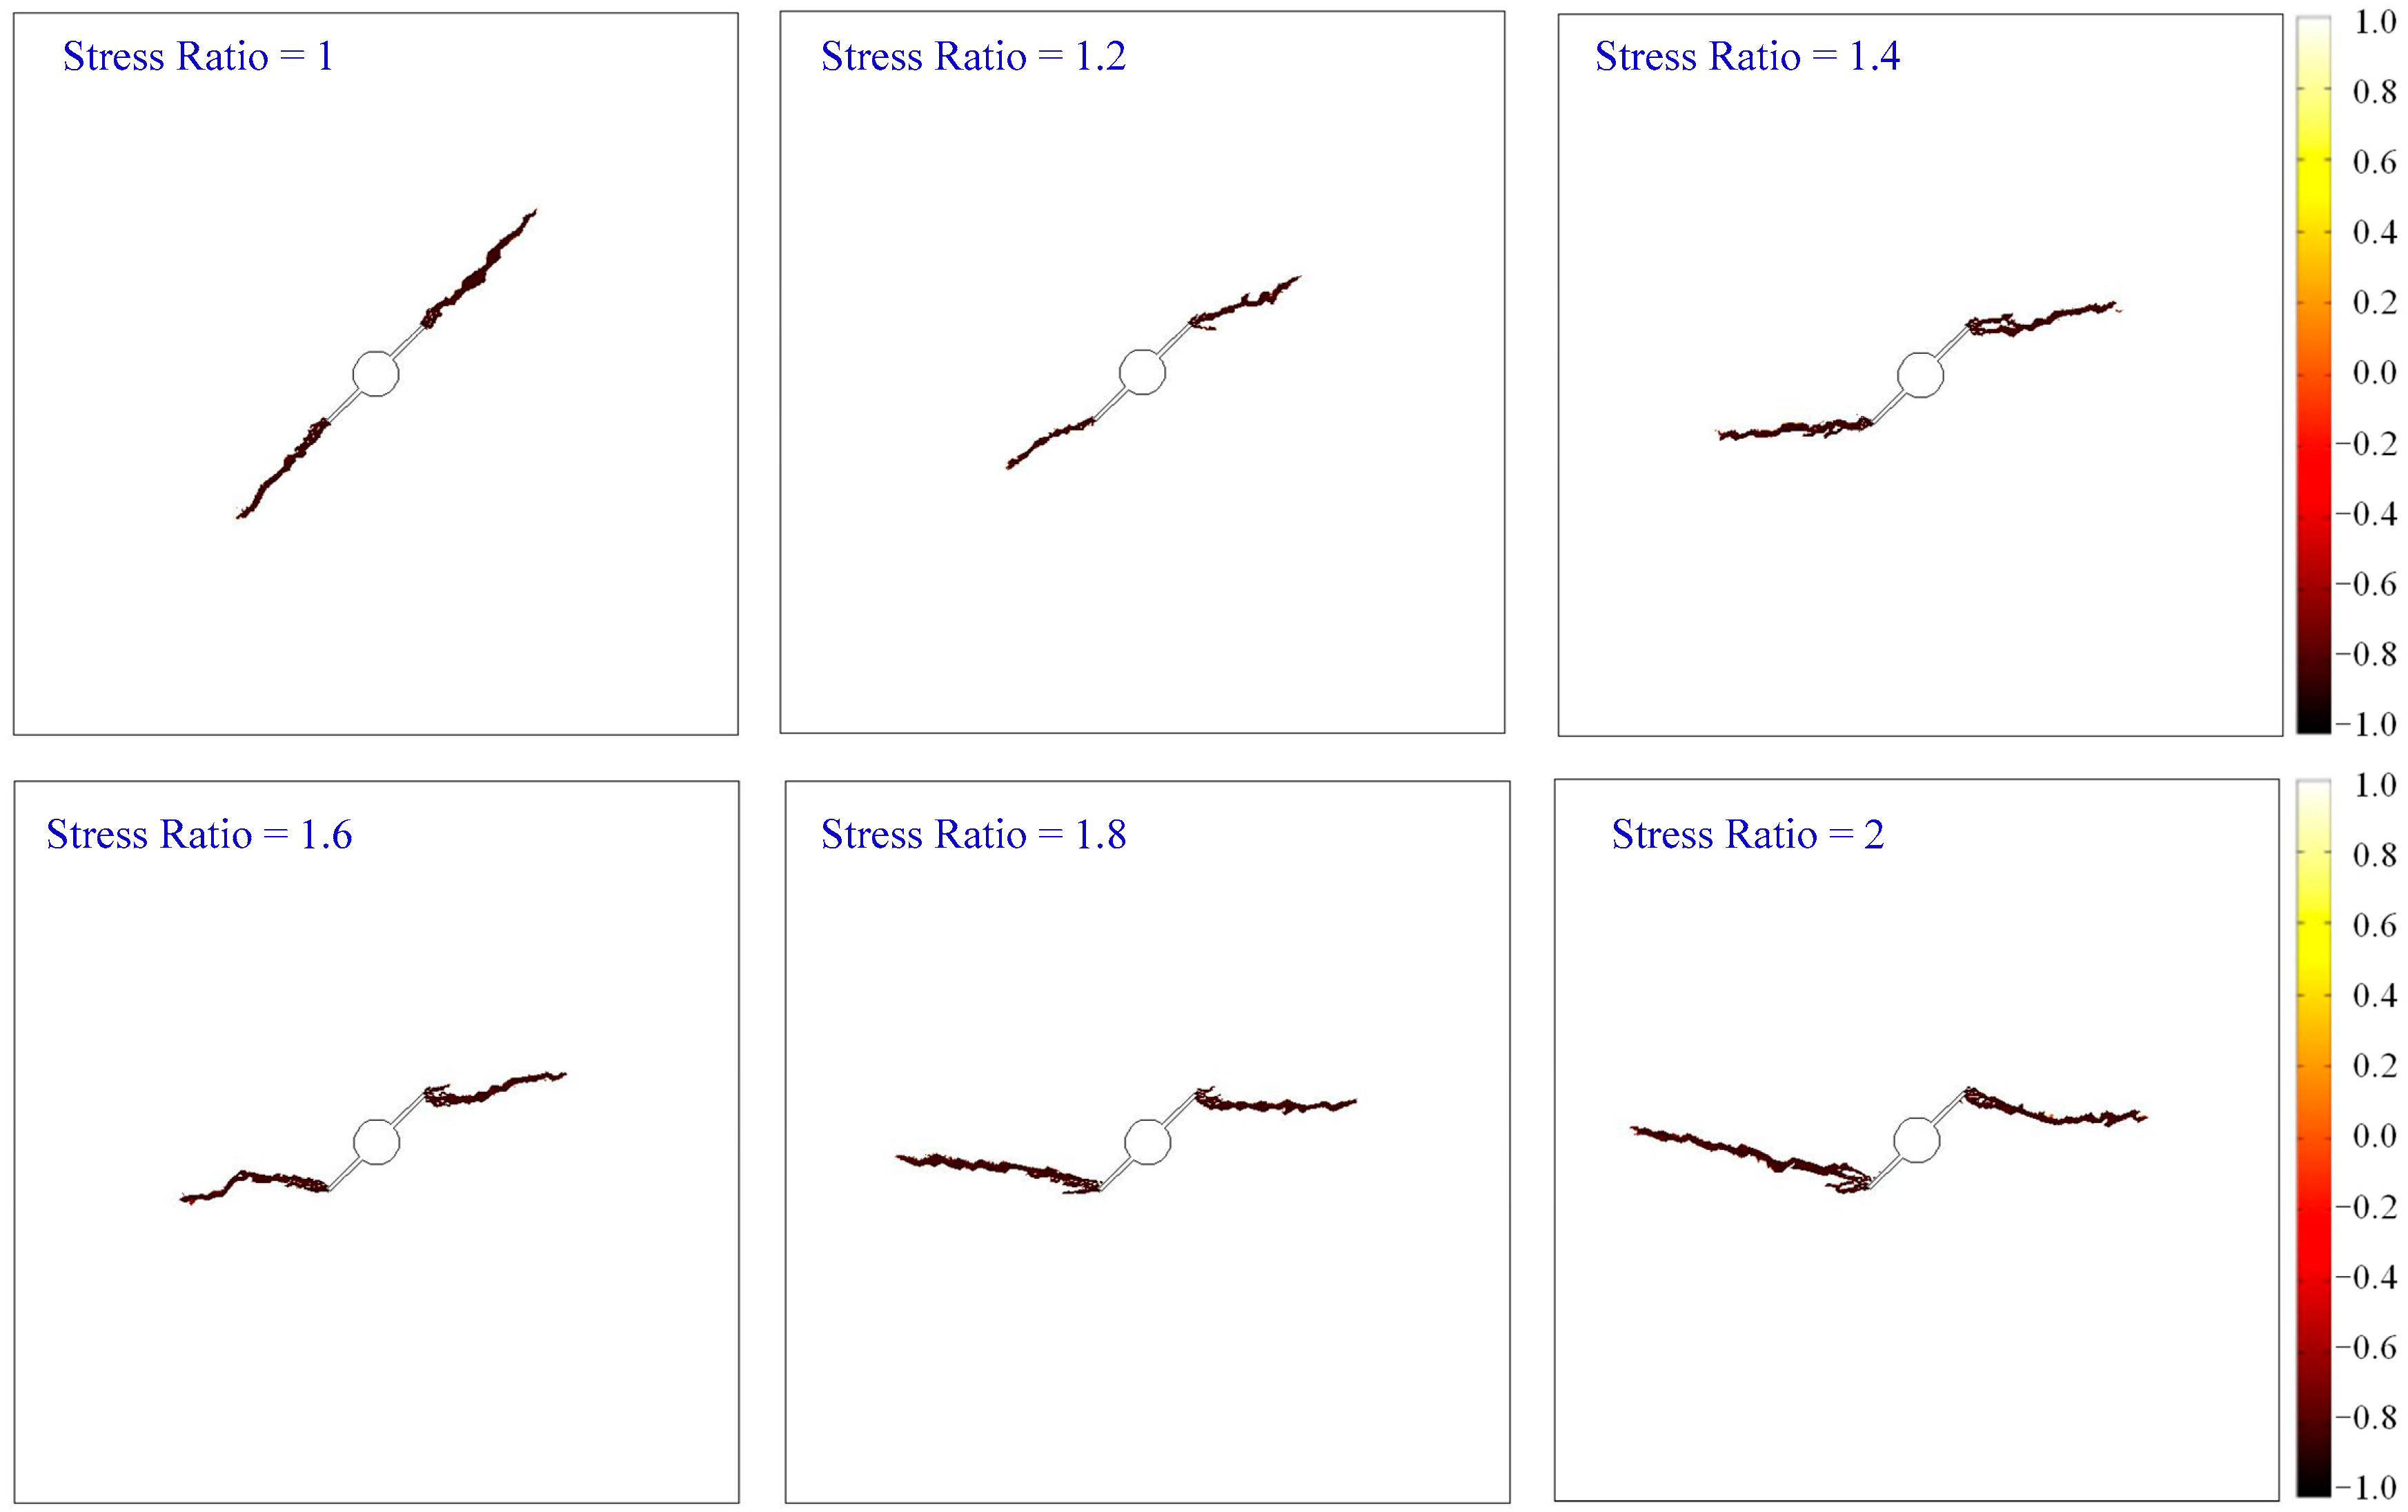
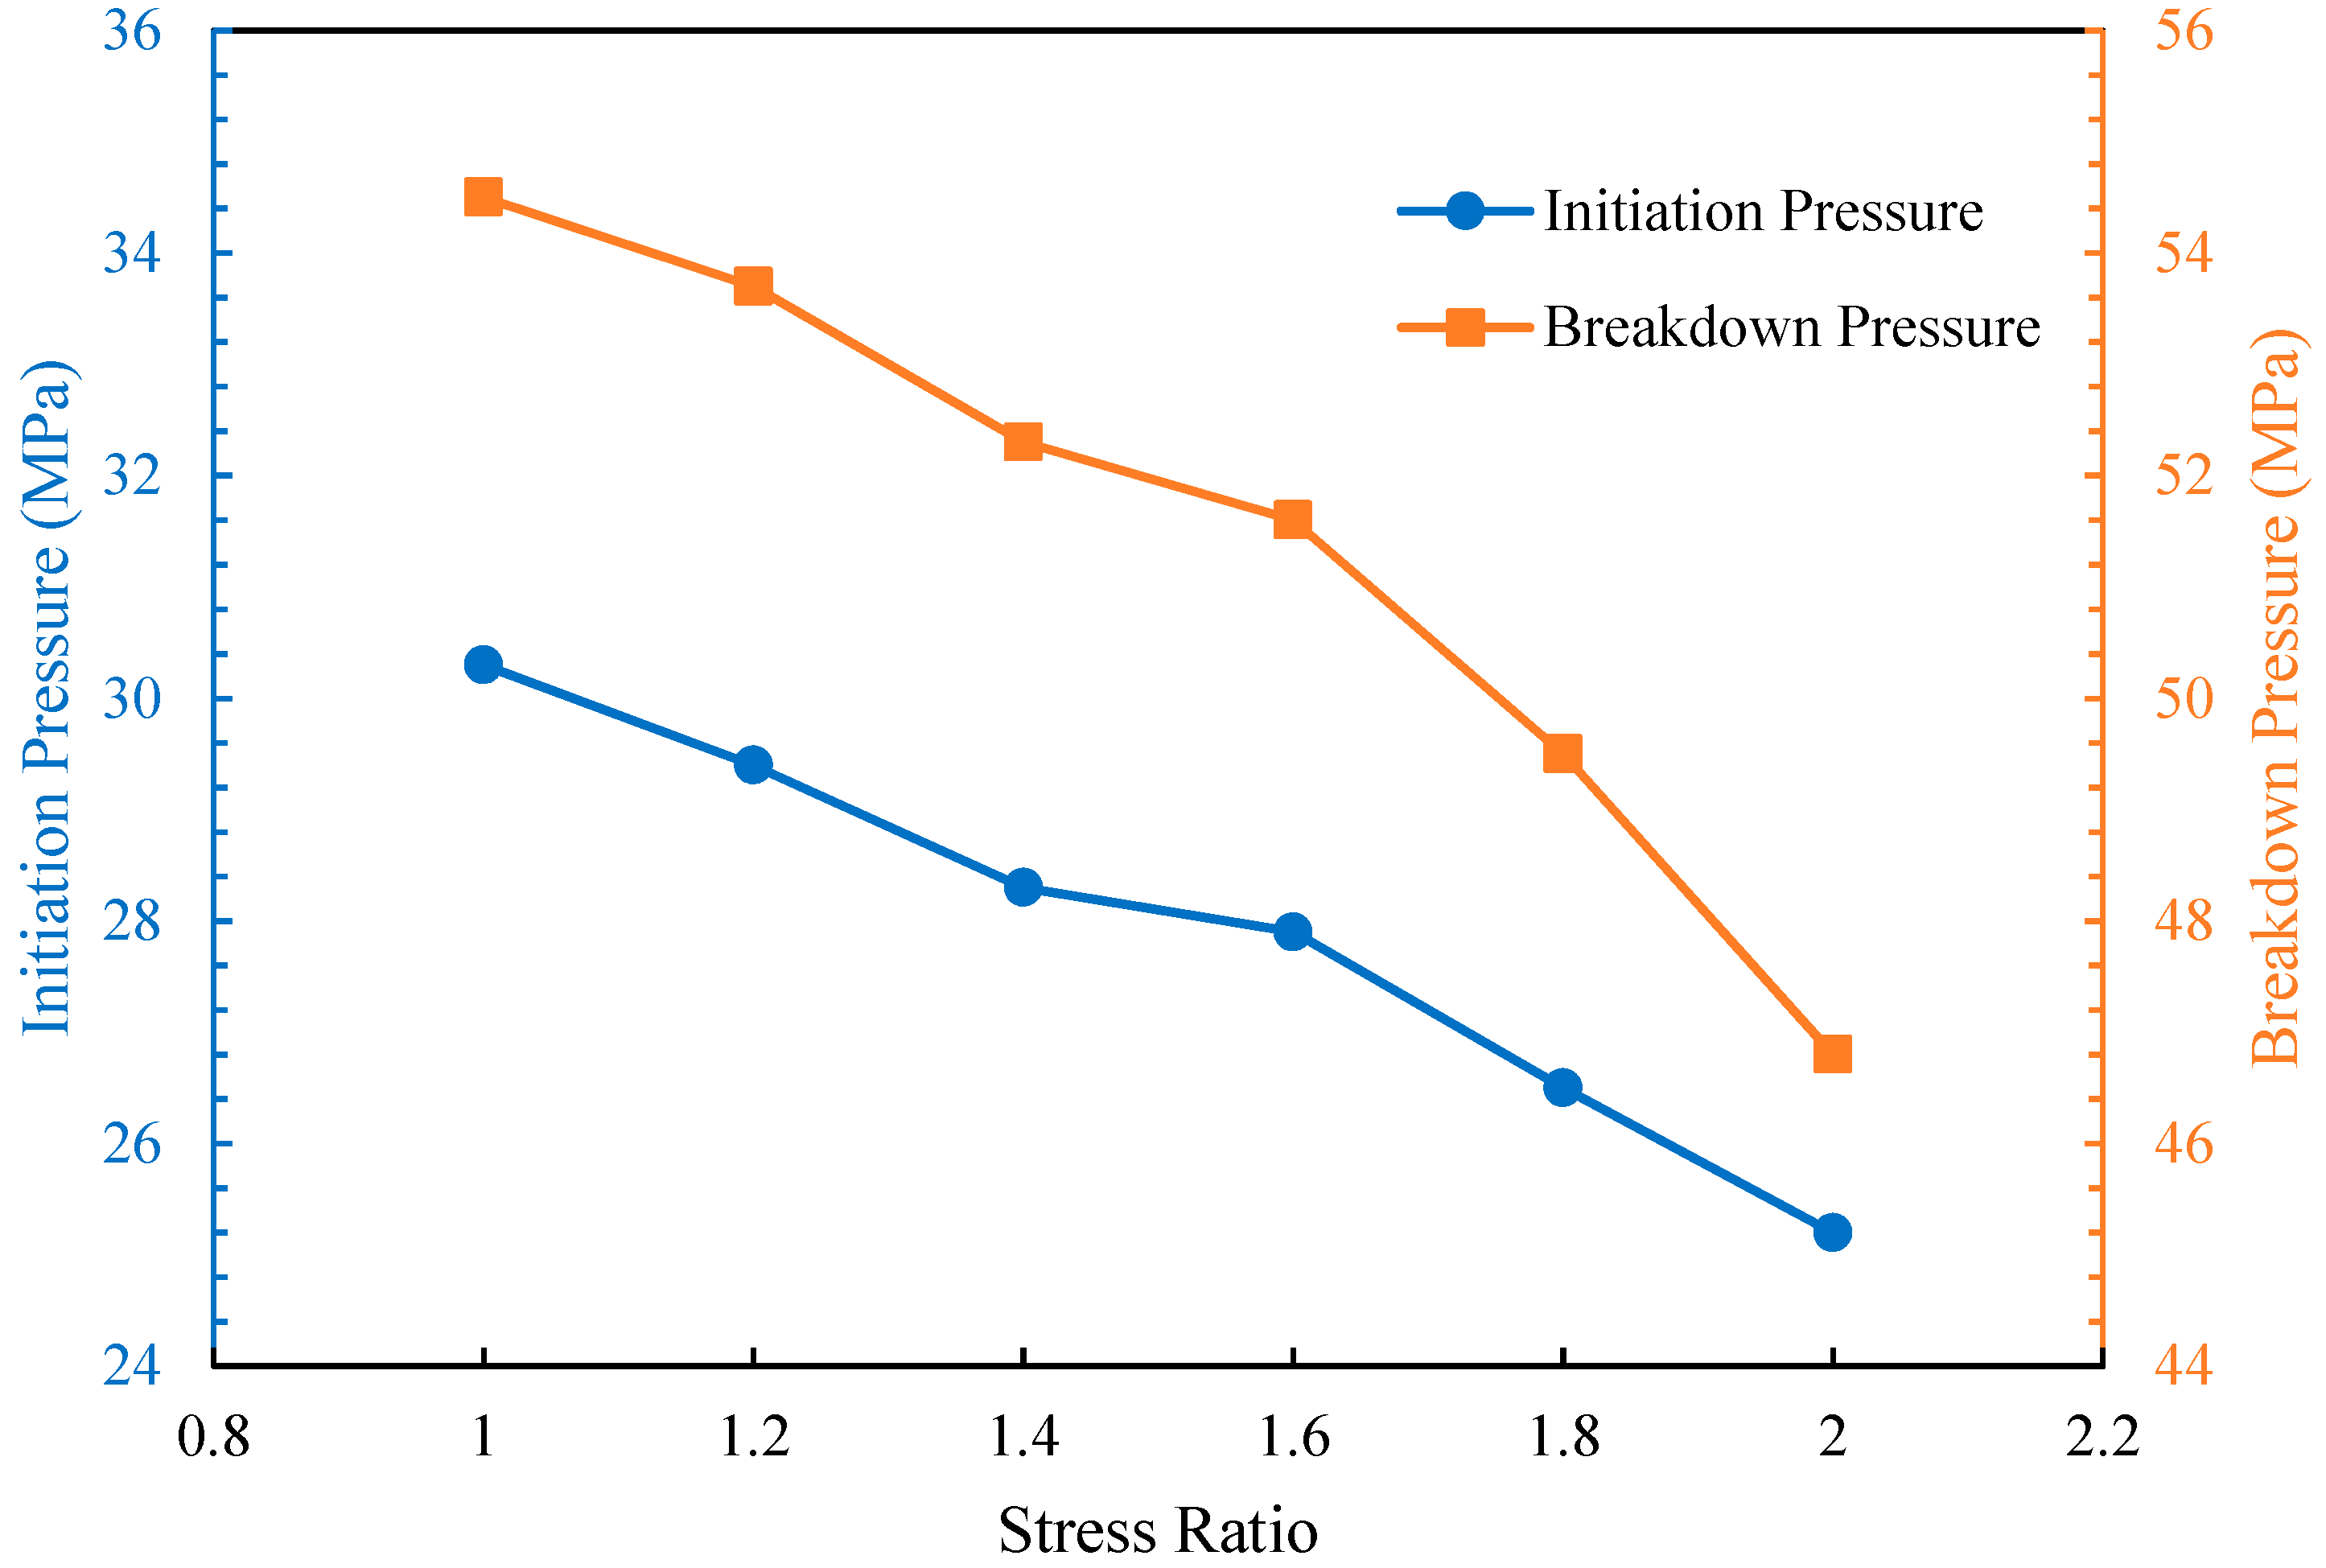
In order to investigate the effects of different in situ stresses on hydraulic fracture behavior, stress ratios λ of 1, 1.2, 1.4, 1.6, 1.8, and 2 are selected (stress ratios define the ratio between maximum horizontal stress and minimum horizontal stress). The magnitude of σh is held constant at 20 MPa. Stress ratio has a significant effect on both hydraulic facture propagation and reorientation, as shown in Figure 9, where different stress ratios correspond to different fracture morphologies. When the stress ratio is equal to unity (hydrostatic) the hydraulic fractures initiate and propagate along the direction of the oriented perforation. As the stress ratio λ is proportional to the difference between σH and σh, the larger this difference, the larger the propensity for the hydraulic fractures to reorient themselves to the maximum horizontal stress direction [35]. A larger stress ratio results in both a smaller curvature during reorientation and occurs at a shorter distance for the fractures to reorient their direction to align with the direction of the maximum horizontal stress. Moreover, based on the results presented in Figure 10 and Table 3, it appears that the stress ratio also has a significant influence on the initiation pressure and breakdown pressure during hydraulic fracturing. It is apparent that there are clear reductions both in the initiation pressure and the breakdown pressure with increasing stress ratio.
As mentioned above, a larger perforation angle results in a complicated fracture morphology, which hydraulic fractures are initiated both from perforations and wellbore, as shown in Figure 7 (perforation angle equals 75°). In order to avoid to forming such complicated fracture morphology, the critical perforation angle is defined, which is used as the minimum perforation angle to form complex fracture morphology. A series of numerical simulations have been conducted to identify the changes of critical perforation angle with stress ratios and fracturing fluids. The results of critical perforation angle against stress ratio are shown in Figure 11. Under the condition of hydrostatic pressure, the hydraulic fractures initiate and propagate along the direction of the oriented perforation, and thus will not form complex fracture morphology. The larger the stress ratio is, the less the critical perforation angle is, and more easily to form complicated fracture morphology. Such complex fracture morphology can result in difficult transportation of proppants and a significant increase in the required injection pressure for propagating hydraulic fractures, which are an undesirable phenomenon that should be avoided as much as possible in field operations [10,14].

5.2. Effects of Initial Pore Pressure

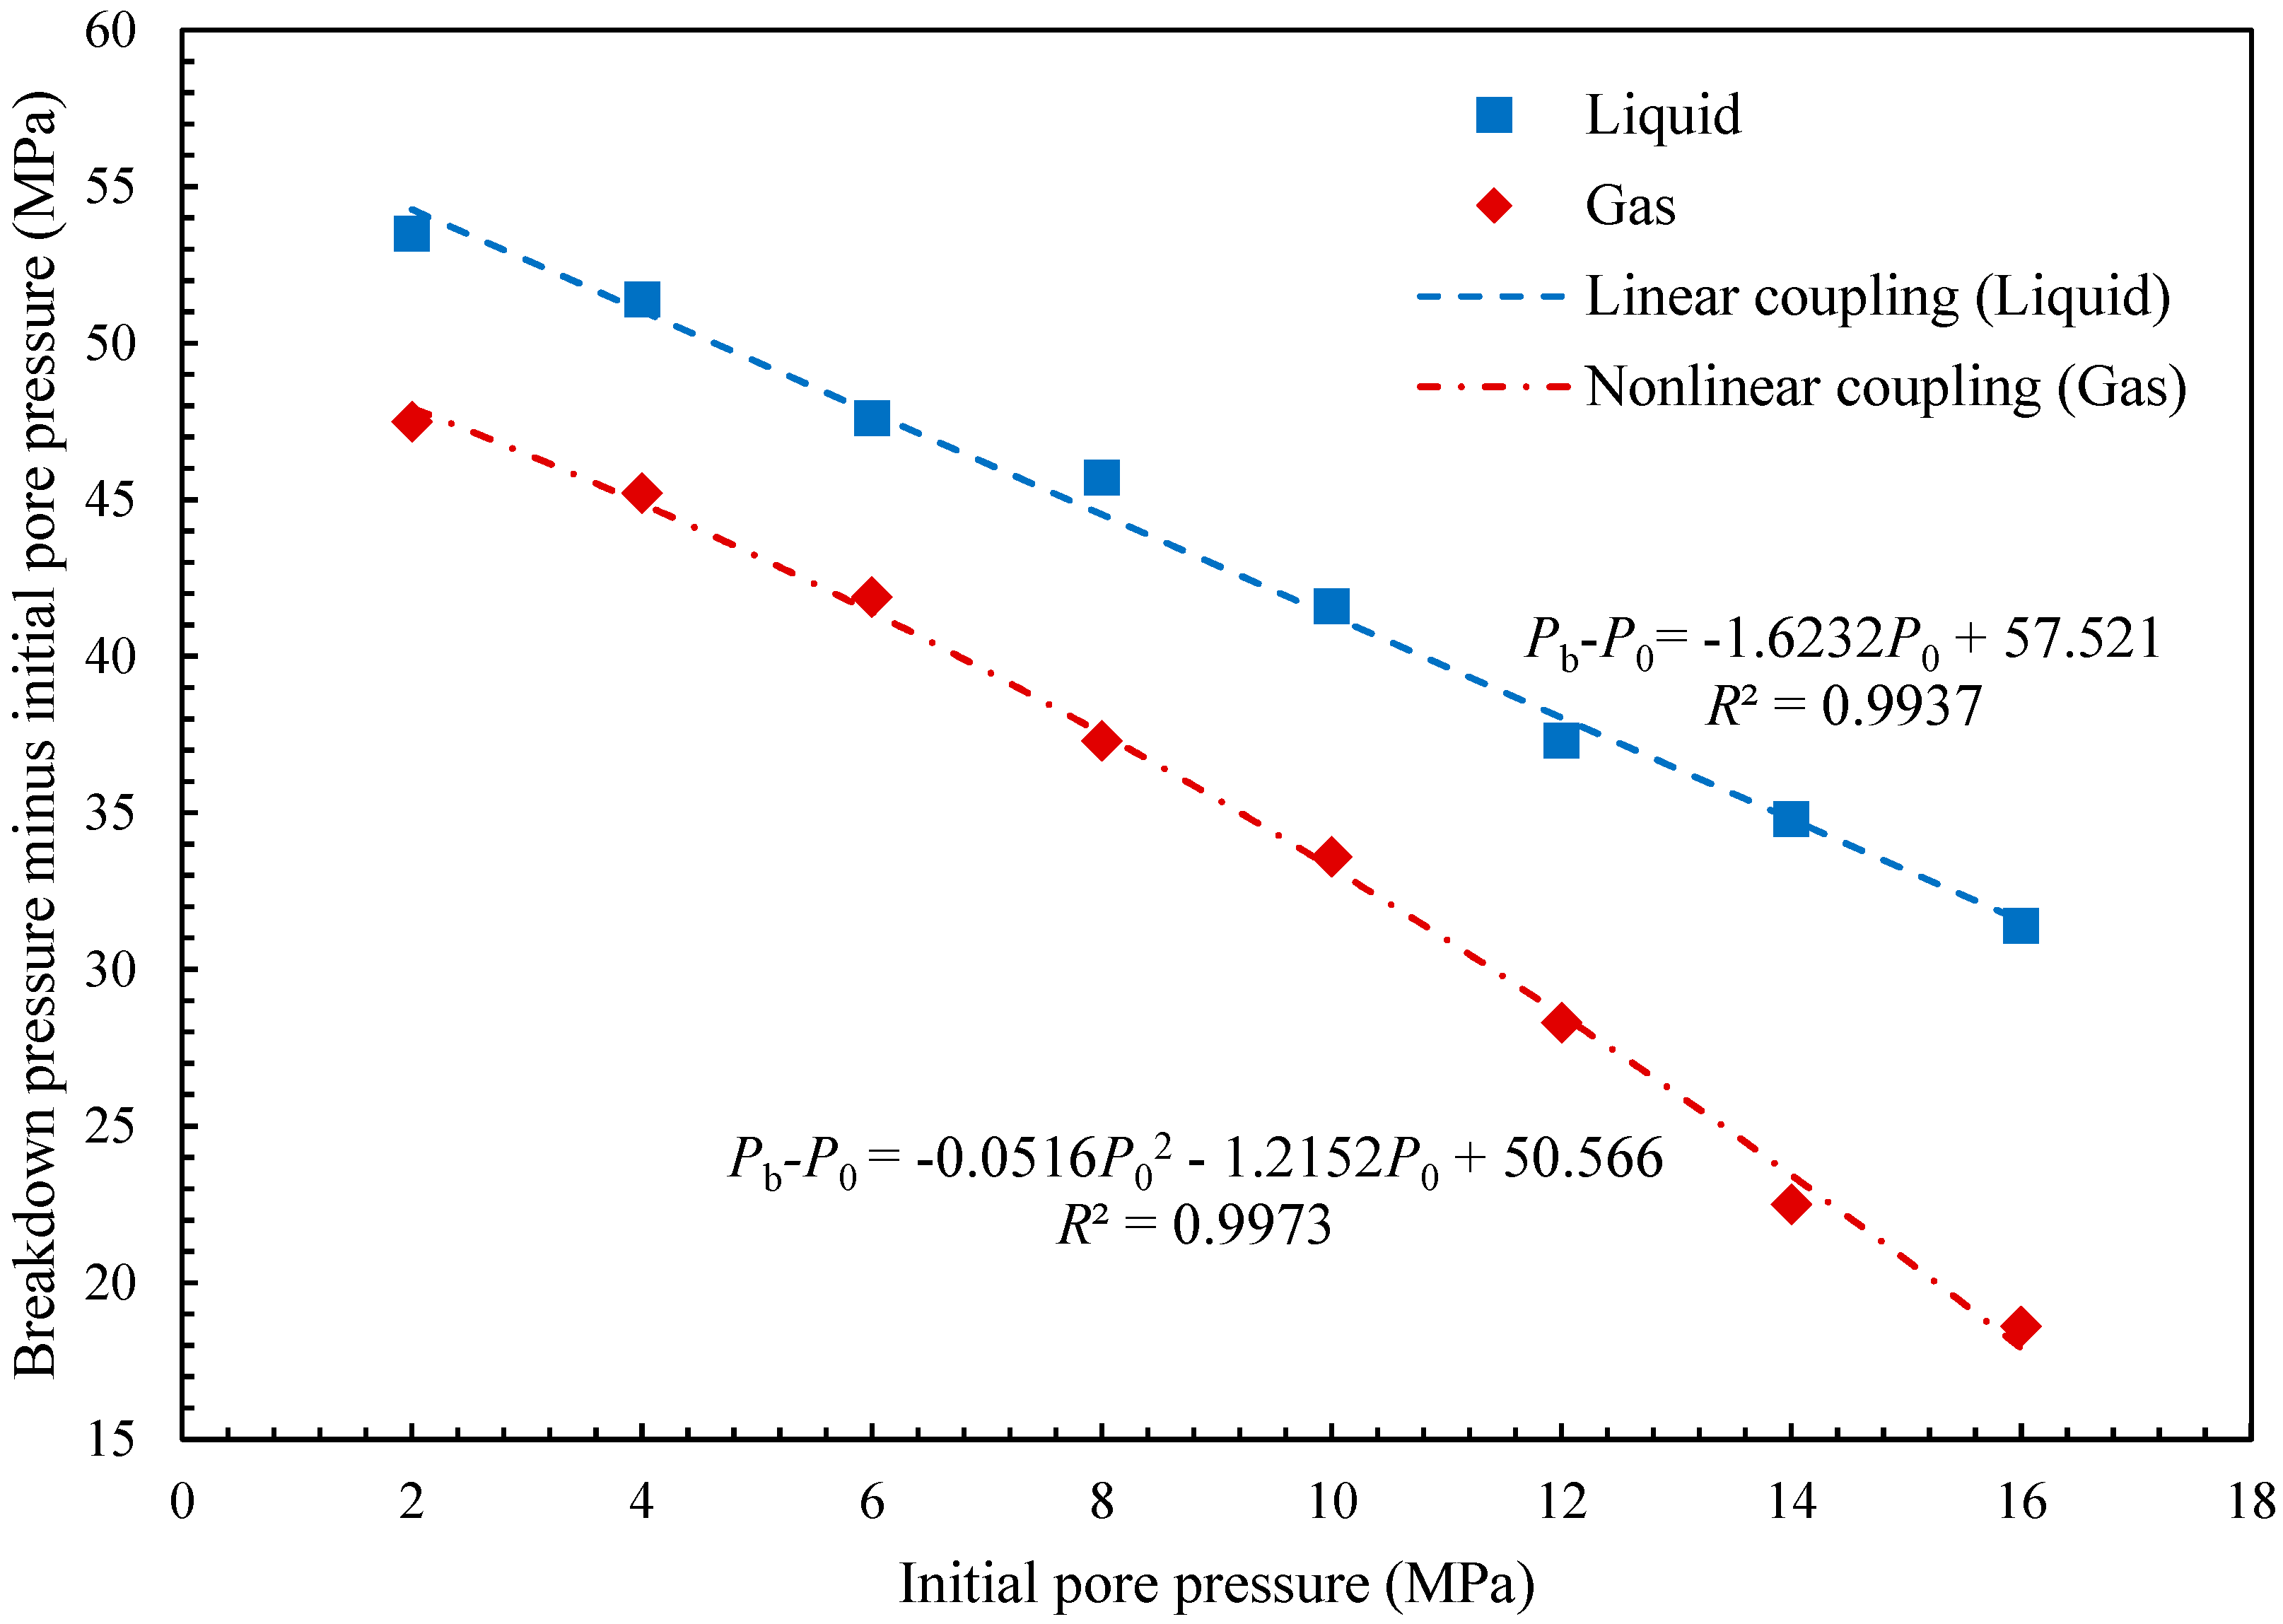
With constant total stresses of σh (20 MPa) and σH (32 MPa), the initial pore pressure is varied from 2 MPa to 16 MPa. The purpose of these numerical simulations is to examine the effects of initial pore pressure on initiation pressure and breakdown pressure. An increase of fluid pore pressure can decrease static friction and thereby facilitate fracture propagation on favorably oriented planes in a deviatoric stress field. As shown in Figure 12 and Figure 13, the resulting differential initiation pressure (Pc-P0) and breakdown pressure (Pb-P0) decrease with an increase in the initial pore pressure. This is consistent with the D–C (Detournay–Cheng) criterion [36]. To incorporate an effective stress law into the D–C criterion, the geomechanical model proposed in this study correctly describes the relationship between breakdown pressure and the far-field stress in hydraulic fracturing [37]. The effects of pore pressure on the initiation pressure are illustrated by the initiation equation based on poroelastic theory [38]. The initiation pressure decreases with an increase in the initial pore pressure [39]. There are two classical approaches to define initiation pressure in terms of far-field stresses [38,40]. These represent behavior for both nonpenetrating injection fluids [40], and for penetrating fluids [38], with initiation pressures given by:
{ P H - W P 0 = T + 3 ( σ h α P 0 ) ( σ H α P 0 ) P H - F P 0 = T + 3 ( σ h α P 0 ) ( σ H α P 0 ) 2 α 1 2 ν 1 ν
where PH-W and PH-F are the initiation pressures related to Hubbert–Willis [40] and Haimson–Fairhurst [38] equations, respectively, T is the tensile strength of the rock, and σh and σH are the far-field principal stresses. As 0 ϕ α 1 ( ϕ is rock porosity) and 0 ν 0.5 ( ν is Poisson’ ratio of rock) for rock, then obtain 0 α ( 1 2 ν ) / ( 1 ν ) 1 . Therefore, the initiation pressure for a penetrating fluid is always smaller than (or equal to) that for a nonpenetrating fluid. It can be seen from Figure 12 that the resulting differential initiation pressure (Pc-P0) during gas fracturing is significantly different from that for liquid fracturing. The obvious effect of gas fracturing is in the reduction of the initiation pressure. This is in good agreement with Equation (22). In addition, as shown in Figure 12 and Figure 13, for water-based fracturing, the resulting Pc-P0 and Pb-P0 decrease linearly with an increase in the initial pore pressure. However, for gas fracturing, the resulting Pc-P0 and Pb-P0 indicate a nonlinear decrease with an increase in initial pore pressure. The influences of gas penetration complicate the mechanism of the fracturing process. The gas penetration not only alters the pore pressure in the reservoir, but also the gas adsorption-induced damage modifies the mechanical properties of the reservoir rock [27,41,42]. According to the Langmuir adsorption isotherm, as shown in Equation (2), with an increase in pore pressure, the sorption capacity and volumetric strain simultaneously increase with the adsorptive strain potentially resulting in additional rock damage. This adsorption-induced damage is fully coupled to the gas fracturing model proposed in this paper. As a consequence, both the initiation pressure and breakdown pressure of gas fracturing show nonlinear decreases with increasing pore pressure.

5.3. Effects of Fracturing Fluids

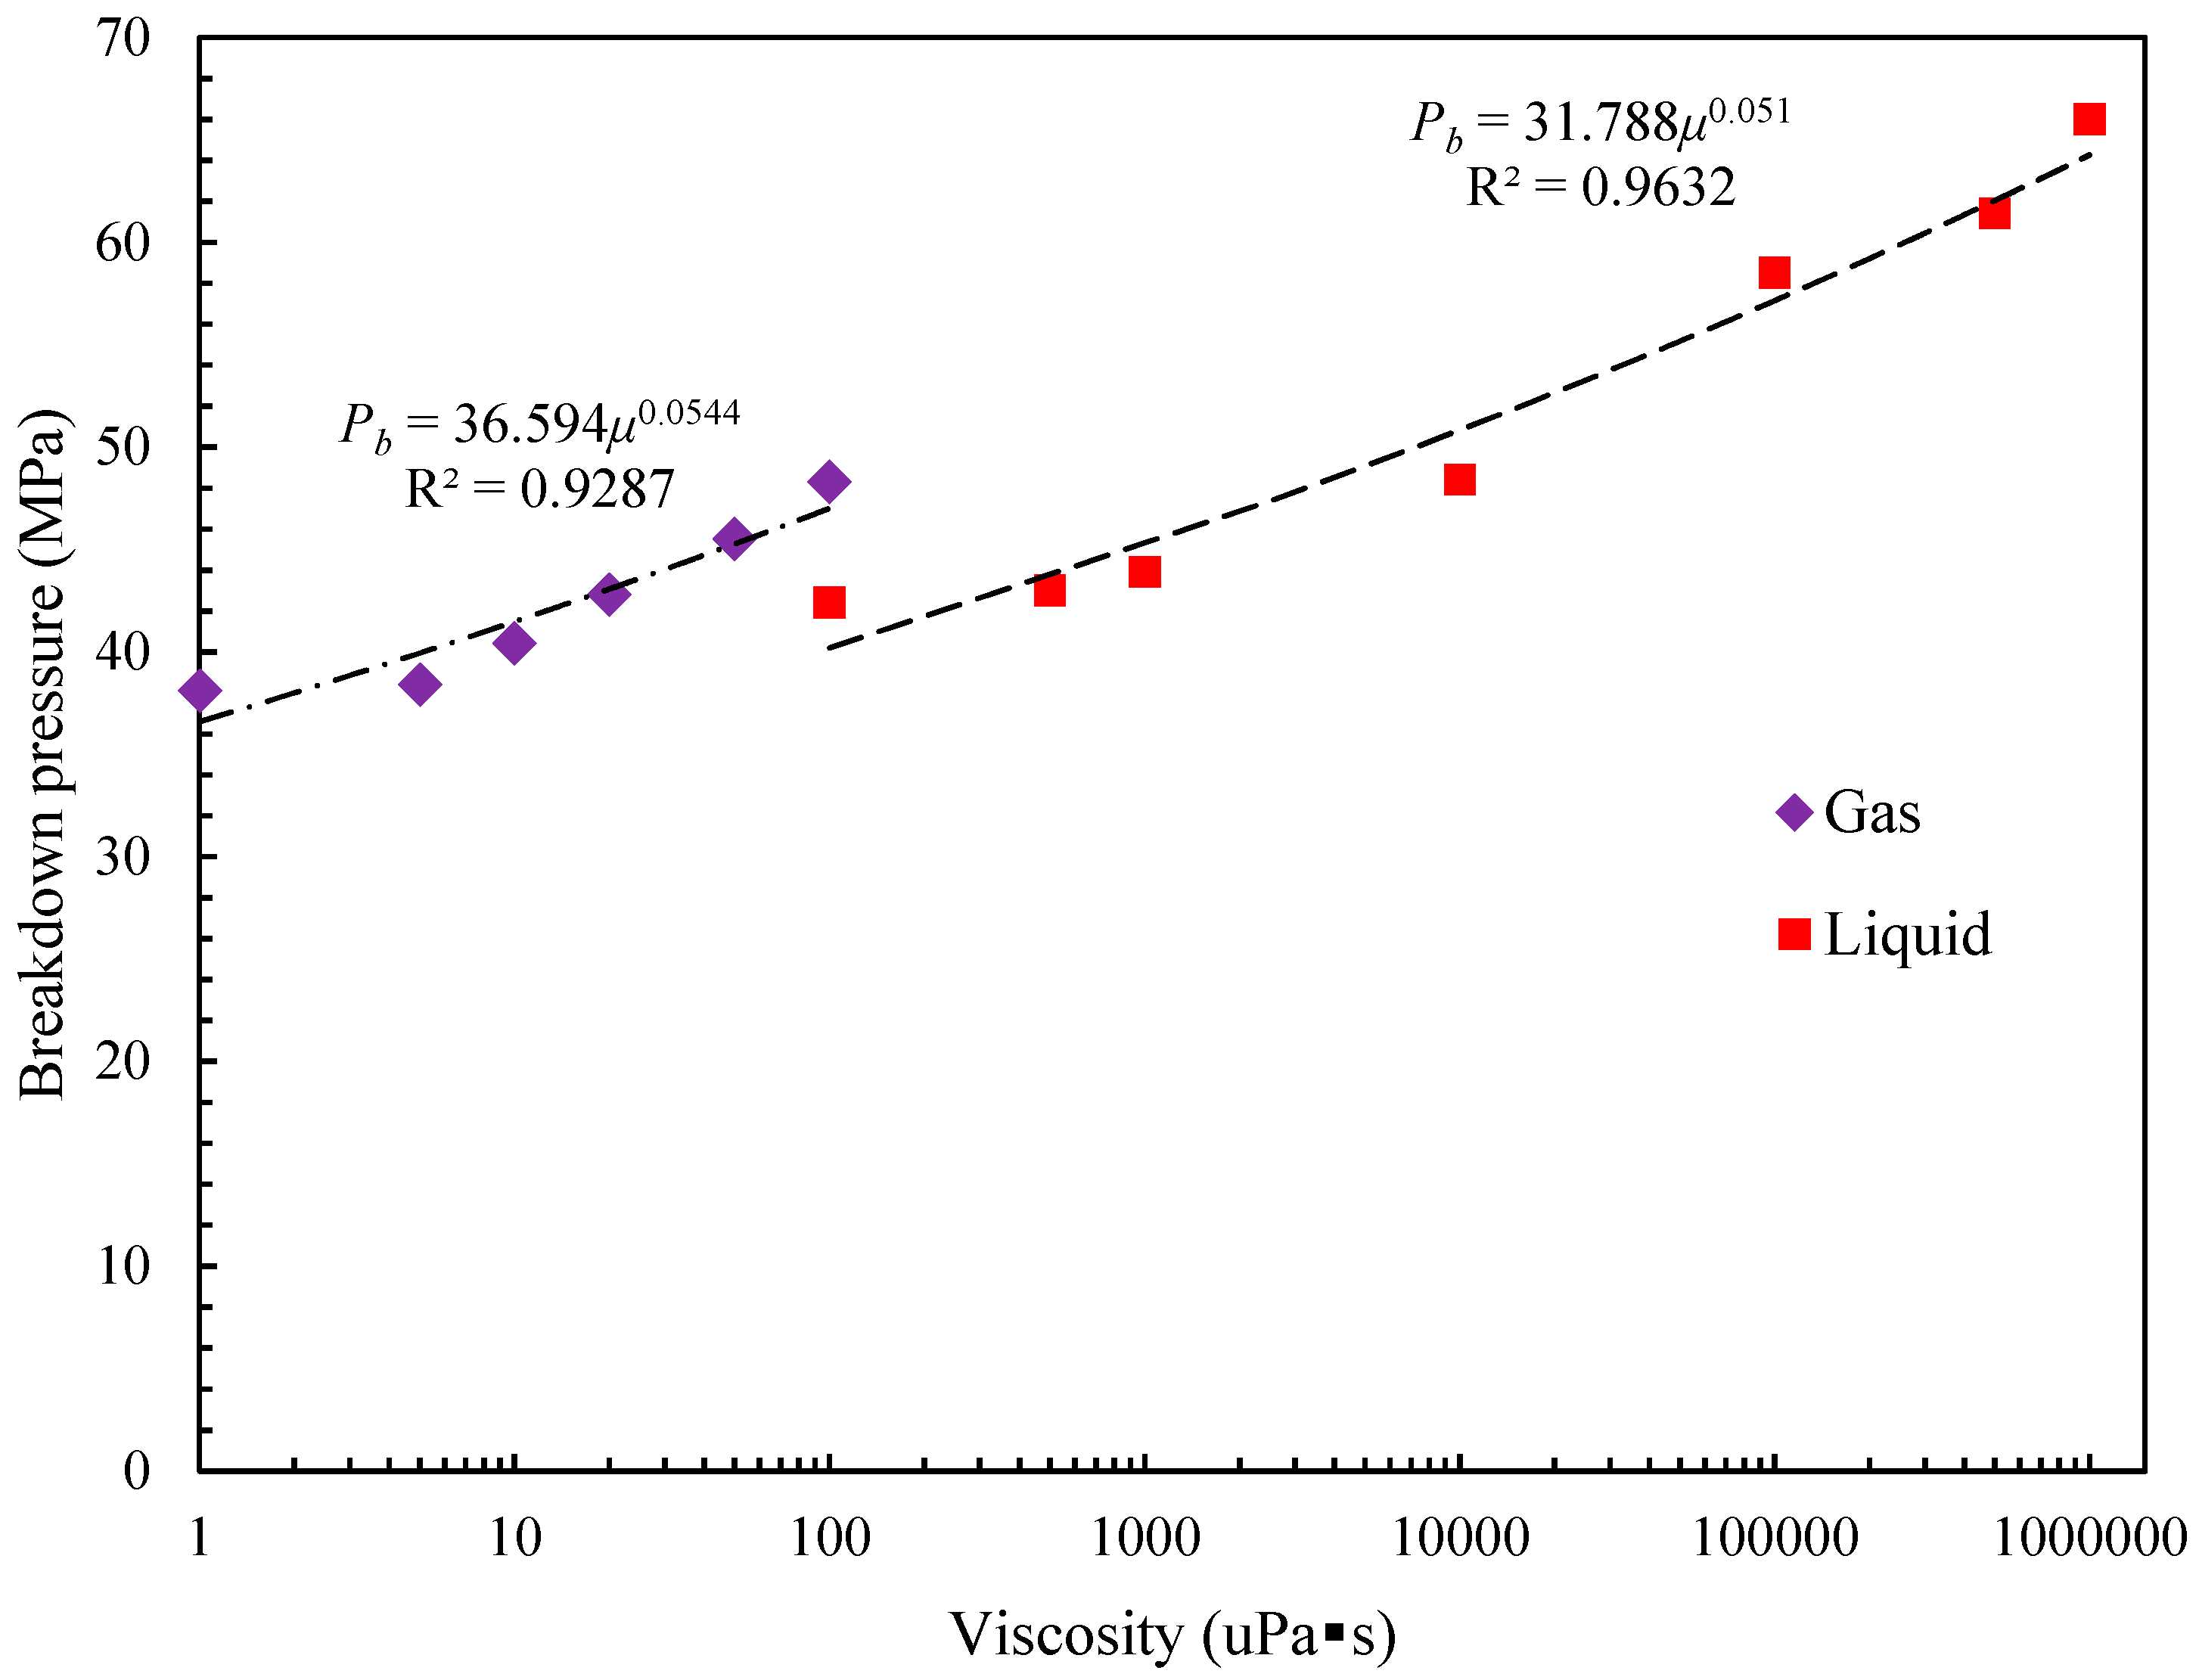
The impacts of both slightly compressible (liquid) and compressible (gas) fluids in fracturing performance were examined to better understand fracture behavior during hydraulic fracturing with liquids or gases. Fluid viscosity is an important variable that influences fracture propagation - the higher the fluid viscosity the slower the local flow rate in the fracture and the higher the fluid pressure under the same injection rate [43,44]. As shown in Figure 14, when the viscosity of the liquid is high the breakdown pressure is large. Conversely, as the gas has a lower viscosity, the breakdown pressure is also smaller. This fact is illustrated in Figure 14, which shows that the relationship between breakdown pressure and fluid viscosity follows a power-law function. In addition, the higher the fracturing fluid viscosity, the more complex the fracture geometry local to the wellbore. This is because a fluid with relatively higher viscosity has a relatively slower flow rate in the near-wellbore region [45]. Figure 15 shows the variations of critical perforation angle with different viscosities of fracturing fluids. For the liquid-based hydraulic fracturing, the critical perforation increases with an increase in liquid viscosity. While for the gas fracturing, the critical perforation angle does not change a lot with the changes of gas viscosity. Although it is essential to create a dominant hydraulic fracture for hydrocarbons recovery, one should carefully design the fracturing fluid to avoid damage to the near-wellbore fracture system.

6. Conclusions

In this study, a fully-coupled geomechanical hydraulic fracture model is proposed under the rubric of FEM-based damage mechanics. This approach accommodates maximum tensile stress theory with shear failure according to Mohr–Coulomb theory and is applied to predict fracture propagation and complexity in heterogeneous rocks. The physical process involves fully coupling fluid flow in the fracture and pressure diffusion into the surrounding porous rock while simultaneously accommodating rock damage, deformation, and fracture propagation. The form of the near-wellbore fractures initiating from two symmetrically-disposed radial perforations are analyzed. The effects of perforation angle, horizontal differential stress, fracturing fluid, and initial pore pressure on hydraulic fracturing are investigated. The following conclusions are derived from the numerical simulations.
A larger perforation angle induces a relatively larger curvature of the fracture during hydraulic fracture reorientation and requires a longer distance for the hydraulic fracture to rotate to the direction that is completely aligned with the direction of the maximum horizontal stress. Hydraulic fractures do not always initiate at the oriented perforations and the fractures induced during hydraulic fracturing are not always even and regular. Hydraulic fractures are initiated both around the wellbore and the oriented perforations when the perforation angle is >75°. A larger perforation angle may cause a more complex fracture morphology. Therefore, perforations at a high angle with respect to the maximum principal stress are generally not recommended.
Stress ratio has a significant influence on fracture initiation pressure, breakdown pressure, and fracture propagation. Under the condition of hydrostatic pressure (λ = 1), the hydraulic fractures initiate and propagate along the direction of the oriented perforation, and thus will not form complex fracture morphology. The resulting fracture propagation does not always follow the directions provided by the perforations but rather reorients to the direction of the maximum horizontal stress. A larger stress ratio results in reduced fracture initiation and breakdown pressures. A larger stress ratio has a smaller critical perforation angle, thus, more easily to form complex fracture morphology.
The resulting differential initiation pressure and breakdown pressure decrease with an increase in the initial pore pressure. Particularly, the initiation pressures of the numerical simulations are in good agreement with the solutions of the Hubbert–Willis [40] and Haimson–Fairhurst [38] equations. In addition, since the adsorption-induced strain is fully coupled to the gas fracturing model, the behavior during gas fracturing is significantly different to that during water-based fracturing. The gas penetration not only alters the pore pressure in the reservoir but the gas adsorption-induced damage also modifies the mechanical properties of the reservoir rock.
The fracturing fluid viscosity influences the initiation pressure, breakdown pressure, and critical perforation angle by affecting the fluid flow behavior and the evolution of the poroelastic stress around the wellbore. The fracture initiation pressure and breakdown pressure increase with an increase in the viscosity. For the liquid-based hydraulic fracturing, breakdown pressure increases 55.6%, and the critical perforation angle increases from 70° to 80°, when the viscosity is increased to 1 Pa·s. While for the gas fracturing, breakdown pressure increases 26.8% when the viscosity is increased to 104 Pa·s. Notably, the critical perforation angle, remaining 62° to 63°, and does not change a lot with the varies of gas viscosity. The critical perforation angle is sensitive to the viscosity of liquid and is insensitive to the viscosity of gas.
The proposed model can be used to determine an optimal perforation condition in various hydraulic fracturing. Research findings are applied to optimize perforation design in order to minimize high treatment pressures and to control complexity in the near-wellbore fracture region. This study is of great significance in further understanding the near-wellbore impacts on hydraulic fracture propagation and complexity.

Author Contributions

L.L. (Liyuan Liu), L.L. (Lianchong Li), S.Z. and Y.Y. conceived and designed the numerical simulations; D.E. contributed analysis methods; L.L. (Liyuan Liu) and D.E. wrote and modified the paper.

Funding

This work was funded by the National Key Research and Development Program of China (Grant No. 2016YFC0801607), National Science Foundation of China (Grant Nos. 51525402, 51374049, and 51761135102), the Fundamental Research Funds for the Central Universities of China (Grant Nos. N170108028 and N170106003), and Science and Technology Major Project of Anhui Province (Grant No. 17030901023). This work also sponsored by China Scholarship Council.

Conflicts of Interest

The authors declare no conflicts of interest.

References

  1. Cherny, S.; Chirkov, D.; Lapin, V.; Muranov, A.; Bannikov, D.; Miller, M.; Willberg, D.; Medvedev, O.; Alekseenko, O. Two-dimensional modeling of the near-wellbore fracture tortuosity effect. Int. J. Rock Mech. Min. 2009, 46, 992–1000. [Google Scholar] [CrossRef]
  2. Abdollahipour, A.; Marji, M.F.; Bafghi, A.Y.; Gholamnejad, J. Simulating the propagation of hydraulic fractures from a circular wellbore using the displacement discontinuity method. Int. J. Rock Mech. Min. 2015, 80, 281–291. [Google Scholar] [CrossRef]
  3. Palmer, I.; Cameran, J.; Moschovidis, Z.; Ponce, J. Natural fractures influence shear stimulation direction. Oil Gas J. 2009, 107, 37–43. [Google Scholar]
  4. Zhou, J.; Chen, M.; Jin, Y.; Zhang, G.Q. Analysis of fracture propagation behavior and fracture geometry using a tri-axial fracturing system in naturally fractured reservoirs. Int. J. Rock Mech. Min. 2008, 45, 1143–1152. [Google Scholar] [CrossRef]
  5. Ye, Z.; Janis, M.; Ghassemi, A.; Riley, S. Laboratory Investigation of fluid flow and permeability evolution through shale fractures. In Proceedings of the Unconventional Resources Technology Conference, Austin, TX, USA, 24–26 July 2017. [Google Scholar]
  6. Hossain, M.M.; Rahman, M.K.; Rahman, S.S. Hydraulic fracture initiation and propagation: Roles of wellbore trajectory, perforation and stress regimes. J. Pet. Sci. Eng. 2000, 27, 129–149. [Google Scholar] [CrossRef]
  7. Fallahzadeh, S.H.; Rasouli, V.; Sarmadivaleh, M. An investigation of hydraulic fracturing initiation and near-wellbore propagation from perforated boreholes in tight formations. Rock Mech. Rock Eng. 2015, 48, 573–584. [Google Scholar] [CrossRef]
  8. Feng, Y.; Gray, K.E. Discussion on field injectivity tests during drilling. Rock Mech. Rock Eng. 2017, 50, 493–498. [Google Scholar] [CrossRef]
  9. Sepehri, J.; Soliman, M.Y.; Morse, S.M. Application of extended finite elementmethod to simulate hydraulic fracture propagation from orientedperforations. In Proceedings of the SPE Hydraulic Fracturing Technology Conference, The Woodlands, TX, USA, 3–5 February 2015. [Google Scholar]
  10. Zhang, G.; Chen, M. Complex fracture shapes in hydraulic fracturing with orientated perforations. Pet. Explor. Dev. 2009, 36, 103–107. [Google Scholar] [CrossRef]
  11. Chen, M.; Jiang, H.; Zhang, G.Q.; Jin, Y. The experimental investigation of fracture propagation behavior and fracture geometry in hydraulic fracturing through oriented perforations. Pet. Sci. Technol. 2010, 28, 1297–1306. [Google Scholar] [CrossRef]
  12. Mahrer, K.D. A review and perspective on far-field hydraulic fracture geometry studies. J. Pet. Sci. Eng. 1999, 24, 13–28. [Google Scholar] [CrossRef]
  13. Haimson, B.C.; Cornet, F.H. ISRM suggested methods for rock stress estimation—Part 3: Hydraulic fracturing (hf) and/or hydraulic testing of pre-existing fractures (HTPF). Int. J. Rock Mech. Min. 2003, 40, 1011–1020. [Google Scholar] [CrossRef]
  14. Feng, Y.; Gray, K.E. Modeling near-wellbore hydraulic fracture complexity using coupled pore pressure extended finite element method. In Proceedings of the 51st US Rock Mechanics/Geomechanics Symposium, San Francisco, CA, USA, 25–28 June 2017; American Rock Mechanics Association: San Francisco, CA, USA, 2017. [Google Scholar]
  15. Daneshy, A.A. A study of inclined hydraulic fractures. Soc. Pet. Eng. J. 1973, 13, 61–68. [Google Scholar] [CrossRef]
  16. Feng, Y.; Gray, K.E. Modeling of curving hydraulic fracture propagation from a wellbore in a poroelastic medium. J. Nat. Gas Sci. Eng. 2018, 53, 83–93. [Google Scholar] [CrossRef]
  17. Zhang, X.; Jeffrey, R.G.; Bunger, A.P.; Thiercelin, M. Initiation and growth of a hydraulic fracture from a circular wellbore. Int. J. Rock Mech. Min. 2011, 48, 984–995. [Google Scholar] [CrossRef]
  18. Narasingam, A.; Siddhamshetty, P.; Kwon, J.S.I. Temporal clustering for order reduction of nonlinear parabolic PDE systems with time-dependent spatial domains: Application to a hydraulic fracturing process. Aiche J. 2017, 63, 3818–3831. [Google Scholar] [CrossRef]
  19. Sidhu, H.S.; Narasingam, A.; Siddhamshetty, P.; Kwon, J.S.I. Model order reduction of nonlinear parabolic PDE systems with moving boundaries using sparse proper orthogonal decomposition: Application to hydraulic fracturing. Comput. Chem. Eng. 2018, 112, 92–100. [Google Scholar] [CrossRef]
  20. Gu, Q.Y.; Hoo, K.A. Model-based closed-loop control of the hydraulic fracturing process. Ind. Eng. Chem. Res. 2015, 54, 1585–1594. [Google Scholar] [CrossRef]
  21. Siddhamshetty, P.; Wu, K.; Kwon, S.I. Optimization of simultaneously propagating multiple fractures in hydraulic fracturing to achieve uniform growth using data-based model reduction. Chem. Eng. Res. Des. 2018, 136, 675–686. [Google Scholar] [CrossRef]
  22. Wu, K.; Olson, J.E. Mechanisms of simultaneous hydraulic-fracture propagation from multiple perforation clusters in horizontal wells. SPE J. 2016, 21, 1000–1008. [Google Scholar] [CrossRef]
  23. Rutqvist, J.; Jeanne, P.; Dobson, P.F.; Garcia, J.; Hartline, C.; Hutchings, L.; Singh, A.; Vasco, D.W.; Walters, M. The northwest geysers EGS demonstration project, California—Part 2: Modeling and interpretation. Geothermics 2016, 63, 120–138. [Google Scholar] [CrossRef]
  24. Wang, H.Y. Numerical modeling of non-planar hydraulic fracture propagation in brittle and ductile rocks using xfem with cohesive zone method. J. Pet. Sci. Eng. 2015, 135, 127–140. [Google Scholar] [CrossRef]
  25. Schmitt, D.R.; Zoback, M.D. Diminished pore pressure in low-porosity crystalline rock under tensional failure: Apparent strengthening by dilatancy. J. Geophys. Res. Solid Earth 1992, 97, 273–288. [Google Scholar] [CrossRef]
  26. Zhu, W.C.; Liu, J.; Tang, C.A.; Zhao, X.D.; Brady, B.H. Simulation of progressive fracturing processes around underground excavations under biaxial compression. Tunn. Undergr. Space Technol. 2005, 20, 231–247. [Google Scholar] [CrossRef]
  27. Liu, L.Y.; Zhu, W.C.; Wei, C.H.; Elsworth, D.; Wang, J.H. Microcrack-based geomechanical modeling of rock-gas interaction during supercritical CO2 fracturing. J. Pet. Sci. Eng. 2018, 164, 91–102. [Google Scholar] [CrossRef]
  28. Li, Z.C.; Li, L.C.; Li, M.; Zhang, L.Y.; Zhang, Z.L.; Huang, B.; Tang, C.A. A numerical investigation on the effects of rock brittleness on the hydraulic fractures in the shale reservoir. J. Nat. Gas Sci. Eng. 2018, 50, 22–32. [Google Scholar] [CrossRef]
  29. Zhang, X.; Jeffrey, R.G. The role of friction and secondary flaws on deflection and re-initiation of hydraulic fractures at orthogonal pre-existing fractures. Geophys. J. Int. 2006, 166, 1454–1465. [Google Scholar] [CrossRef] [Green Version]
  30. Zhang, H.B.; Liu, J.S.; Elsworth, D. How sorption-induced matrix deformation affects gas flow in coal seams: A new Fe model. Int. J. Rock Mech. Min. 2008, 45, 1226–1236. [Google Scholar] [CrossRef]
  31. Robertson, E.P.; Christiansen, R.L. Modeling laboratory permeability in coal using sorption-induced-strain data. SPE Reserv. Eval. Eng. 2007, 10, 260–269. [Google Scholar] [CrossRef]
  32. Detournay, E.; Cheng, A.H.D. 5—Fundamentals of poroelasticity. In Analysis and Design Methods; Fairhurst, C., Ed.; Pergamon: Oxford, UK, 1993; pp. 113–171. [Google Scholar]
  33. Zhu, W.C.; Tang, C.A. Micromechanical model for simulating the fracture process of rock. Rock Mech. Rock Eng. 2004, 37, 25–56. [Google Scholar] [CrossRef]
  34. Behrmann, L.A.; Nolte, K.G. Perforating requirements for fracture stimulations. SPE Drill. Complet. 1998, 14, 228–234. [Google Scholar] [CrossRef]
  35. Li, X.; Wang, J.H.; Elsworth, D. Stress redistribution and fracture propagation during restimulation of gas shale reservoirs. J. Pet. Sci. Eng. 2017, 154, 150–160. [Google Scholar] [CrossRef]
  36. Detournay, E.; Cheng, A. Influence of pressurization rate on the magnitude of the breakdown pressure. In Proceedings of the 33th US Symposium on Rock Mechanics, Santa Fe, NM, USA, 3–5 June 1992; American Rock Mechanics Association: Santa Fe, NM, USA, 1992. [Google Scholar]
  37. Song, I.; Haimson, B. Effect of pressurization rate and initial pore pressure on the magnitude of hydrofracturing breakdown pressure in Tablerock Sandstone. In Proceedings of the 38th U.S. Rock Mechanics Symposium, Washington, DC, USA, 7–10 July 2001; American Rock Mechanics Association: Washington, DC, USA, 2001. [Google Scholar]
  38. Haimson, B.; Fairhurst, C. Initiation and extension of hydraulic fractures in rocks. Soc. Pet. Eng. J. 1967, 7, 310–318. [Google Scholar] [CrossRef]
  39. Guo, F.; Morgenstern, N.R.; Scott, J.D. Interpretation of hydraulic fracturing breakdown pressure. Int. J. Rock Mech. Min. Sci. Geomech. Abstr. 1993, 30, 617–626. [Google Scholar] [CrossRef]
  40. Hubbert, M.K.; Willis, D.G.W. Mechanics of hydraulic fracturing. Trans. Soc. Pet. Eng. AIME 1957, 210, 153–168. [Google Scholar]
  41. Zhu, W.C.; Liu, L.Y.; Liu, J.S.; Wei, C.H.; Peng, Y. Impact of gas adsorption-induced coal damage on the evolution of coal permeability. Int. J. Rock Mech. Min. 2018, 101, 89–97. [Google Scholar] [CrossRef]
  42. Liu, L.Y.; Zhu, W.C.; Wei, C.H.; Ma, X.H. Mechanical model and numerical analysis of mechanical property alterations of coal induced by gas adsorption. Rock Soil Mech. 2018, 39, 1500–1508. (In Chinese) [Google Scholar] [CrossRef]
  43. Detournay, E. Propagation regimes of fluid-driven fractures in impermeable rocks. Int. J. Geomech. 2004, 4, 35–45. [Google Scholar] [CrossRef]
  44. Zhang, X.; Jeffrey, R.G.; Thiercelin, M. Deflection and propagation of fluid-driven fractures at frictional bedding interfaces: A numerical investigation. J. Struct. Geol. 2007, 29, 396–410. [Google Scholar] [CrossRef]
  45. Wang, J.; Elsworth, D.; Wu, Y.; Liu, J.; Zhu, W.; Liu, Y. The influence of fracturing fluids on fracturing processes: A comparison between water, oil and SC-CO2. Rock Mech. Rock Eng. 2017, 51, 299–313. [Google Scholar] [CrossRef]
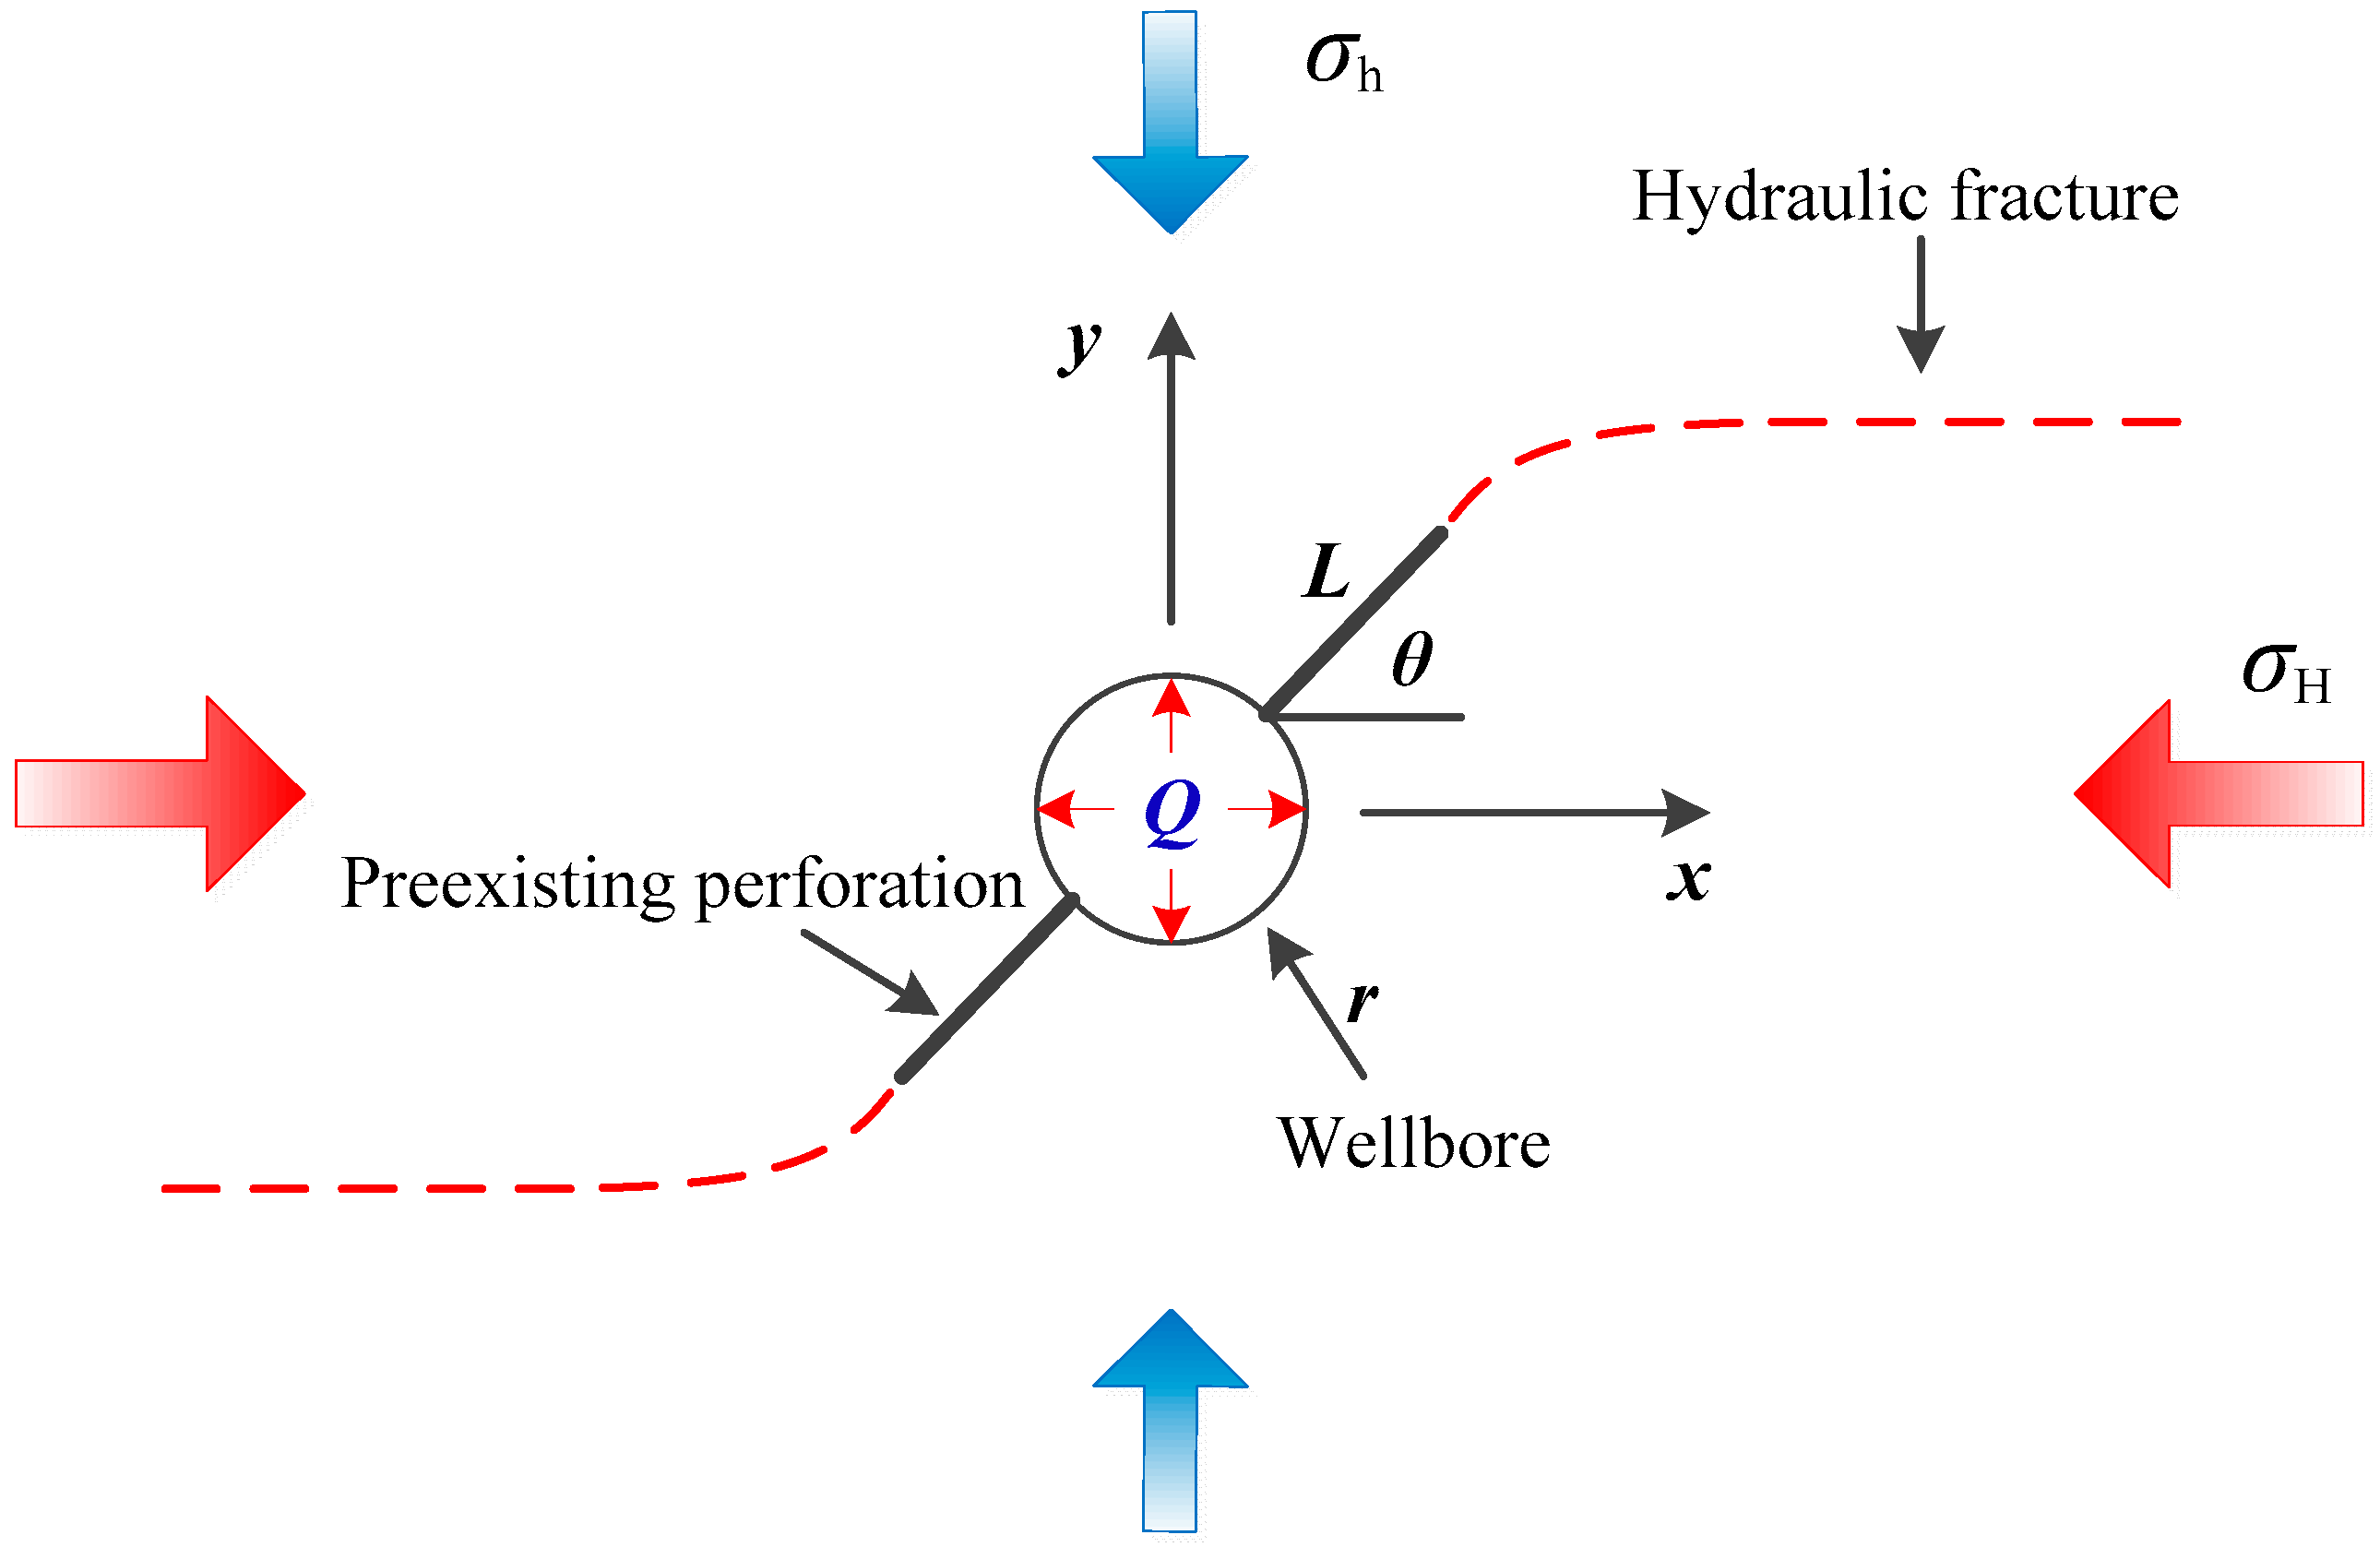
Figure 1. Hydraulic fractures initiate from two symmetrically disposed preexisting perforations.
Processes 06 00213 g001
Figure 2. Distributions of rock properties for different homogeneous indices (Mechanical parameter u 0 is 1).
Processes 06 00213 g002
Figure 3. The damage constitutive law for rock under uniaxial stress condition.
Processes 06 00213 g003
Figure 4. Simulation of uniaxial compression of a sample compared with experimental observations by Chen et al. [11].
Processes 06 00213 g004
Figure 5. Comparison of model simulation results with experimental results. (a) Experimental fracture pattern from Chen et al. [11]. (b) Fracture pattern obtained from numerical simulation.
Processes 06 00213 g005
Figure 6. Geometry of the numerical model used to investigate near-wellbore hydraulic fracturing processes.
Processes 06 00213 g006
Figure 7. Numerical results of near-wellbore fracture patterns for different preexisting perforation angles.
Processes 06 00213 g007
Figure 8. Comparison of experimental results and numerical results for breakdown pressures.
Processes 06 00213 g008
Figure 9. Simulation results of fracture tortuosity/complexity of hydraulic fracturing produced at various stress ratios.
Processes 06 00213 g009
Figure 10. Initiation and breakdown pressures with different stress ratios.
Processes 06 00213 g010
Figure 11. The relationship between critical perforation angle and stress ratio.
Processes 06 00213 g011
Figure 12. Relationship between initiation pressure and initial pore pressure.
Processes 06 00213 g012
Figure 13. Breakdown pressure as a function of initial pore pressure.
Processes 06 00213 g013
Figure 14. Relationship between breakdown pressure and fracturing fluid viscosity.
Processes 06 00213 g014
Figure 15. The relationship between critical perforation angle and stress ratio.
Processes 06 00213 g015
Table 1. Comparison of experimental data and numerical data.
SymbolExperimental DataNumerical Data Δ E / E Δ σ c / σ c Δ σ t / σ t
Young’s modulus, E (GPa)8.4028.511.29%--
Uniaxial compressive strength, σc (MPa)28.3428.57-0.81%-
Tensile strength, σt (MPa)2.592.56--−1.16%
Table 2. Input parameters for the near-wellbore hydraulic fracturing model.
SymbolValueUnit
Homogeneity index, m10-
Mean value of the elasticity modulus, E8.737GPa
Mean value of uniaxial compressive strength, f ¯ c 45.53MPa
Mean value of uniaxial tensile strength, f ¯ t 5.69MPa
Poisson ratio, ν 0.23-
Initial porosity, ϕ 0 1.85%
Initial permeability, k 0 1.0 × 10⁻¹⁶m2
Initial pore pressure, p 0 0.1MPa
Viscosity, μ 133mPa·s
Table 3. Initiation pressure and breakdown pressure for different stress ratios.
Stress RatioPerforation Angle (o)Initiation Pressure (MPa)Breakdown Pressure (MPa)
1.04530.354.5
1.24529.453.7
1.44528.352.3
1.64527.951.6
1.84526.549.5
2.04525.246.8