1. Introduction
Emulsification is the process in which two immiscible fluids (say A and B) are mixed together to create an ensemble of small droplets of fluid A in a matrix of fluid B. When mixing ceases, droplets begin coarsening and coalescing, returning the mixture to its lowest energy state in which only one A rich and one B rich domain remains. As coarsening is driven by the interfacial tension between A and B, surfactants are often used to slow the demixing. Emulsions are used in a range of industries including food, cosmetic, and pharmaceutical. Applications can be as simple as making mayonnaise by emulsification [
1,
2] and stabilizing oil with particles [
3,
4,
5], or as complicated as encapsulating and delivering a specific drug to a specific location within our bodies [
6,
7,
8], and making superhydrophobic surfaces [
9,
10]. Many of these processes use amphiphilic polymers as they form an attractive synthetic system in which responsivity can be engineered (for example to rupture droplets under some stimuli). It is of clear importance for researchers to understand the basic physical properties of emulsions in order to advance their industrial uses.
There are several existing methods for measuring static properties of emulsion droplets such as the pendant drop method [
11,
12] and the micropipette aspiration method [
13,
14]. As useful as these techniques are for measuring emulsion droplets in ideal conditions, there are also some drawbacks. For example, the micropipette aspiration method pulls a droplet into a narrow tube which can cause certain (elastic or viscoelastic) interfaces to rupture. Furthermore, the speed at which the droplet is imbibed will certainly affect the measurement. On the other hand, the pendant drop can only be used with relatively large drops, meaning details affected by surface to volume effects cannot be easily observed. Also, if the surface of a droplet were made elastic through crosslinking, it would only be measureable with a pendent drop if the crosslinking occurs after the drop is created [
12]. We find that many of the drawbacks can be overcome by using the sessile drop technique [
15].
The sessile drop is a simple method which uses the geometry of the droplet itself to measure the interfacial tension. The method can also be used to measure elastic interfaces, although we focus only on fluid interfaces in this work [
16]. Furthermore, the technique can be adapted in order to measure unique dynamic properties related to coalescence, which are not accessible in traditional techniques.
We conduct our measurements under a confocal microscope, for the highest resolution, however the technique is easily adapted to a light microscope enabling a very low cost and easily accessible measurement scheme. The study used a model system of toluene droplets in water (mixed with glycerine to control the density and the viscosity) stabilized by a diblock copolymer, polystyrene-
block-polyethylene oxide (PS-PEO). The amphiphilic nature [
17] of this polymer causes the PS-PEO to self-assemble at the oil-water interface and stabilize the emulsion. Below we give a more detailed description of the sessile drop technique and present both the static properties of PS-PEO covered sessile droplets as well as the dynamic properties related to the emulsion drop’s approach to a flat wall. We focus on altering the viscosity of the surrounding fluid by changing the ratio of glycerine to water and examining its effects on the droplet dynamics. Importantly, we note that the change in outer fluid has profound effects on other macroscopic (and microscopic) features; viscosity is not an independent variable. The observation highlights the importance of measuring several properties simultaneously.
2. Materials and Methods
Polystyrene-block-poly ethylene oxide (PS-PEO) with molecular weights of kg/mol (PS) and kg/mol (PEO) was purchased from Polymer Source (Dorval, Canada). The polymer had a polydispersity index (PDI) of . Organic solvents (glycerine and toluene) were purchased from Fisher Scientific (Pittsburg, PA, USA) and were used as received. Nile red (9-diethylamino-5H-benzo[a]phenoxazine-5-one) compound was bought from MP Biomedicals (Santa Ana, CA, USA), and used to dye the toluene. Deionized water was produced using a Mili-Q Integral 3 purifier (Millipore, Billerica, MA, USA). Ted Pella, Inc. (Redding, CA, USA) supplied the highest-grade mica sheets. Mica was cleaved before each measurement in order to reveal a fresh, atomically flat surface. All other materials were used as received.
A solution of 0.05% PS-PEO in toluene by weight was prepared at least two days prior to taking the measurements, allowing the PS-PEO to be fully dissolved in the toluene. Several concentrations of glycerine to water (by weight) solutions were prepared, ranging from pure water to pure glycerine. A lab-made glass cell was filled with one of the glycerine/water solutions and was capped with a freshly cleaved mica sheet. A micropipette was used to make PS-PEO/toluene emulsion drops inside the glass cell. The micropipette drop formation method allowed us to control the drop size.
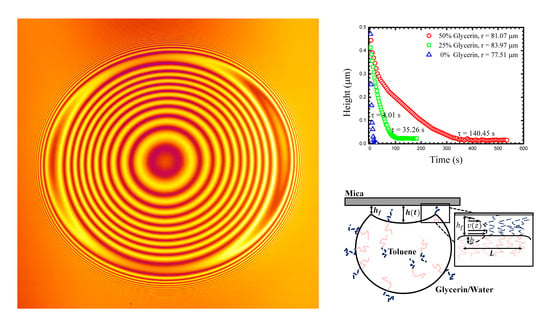
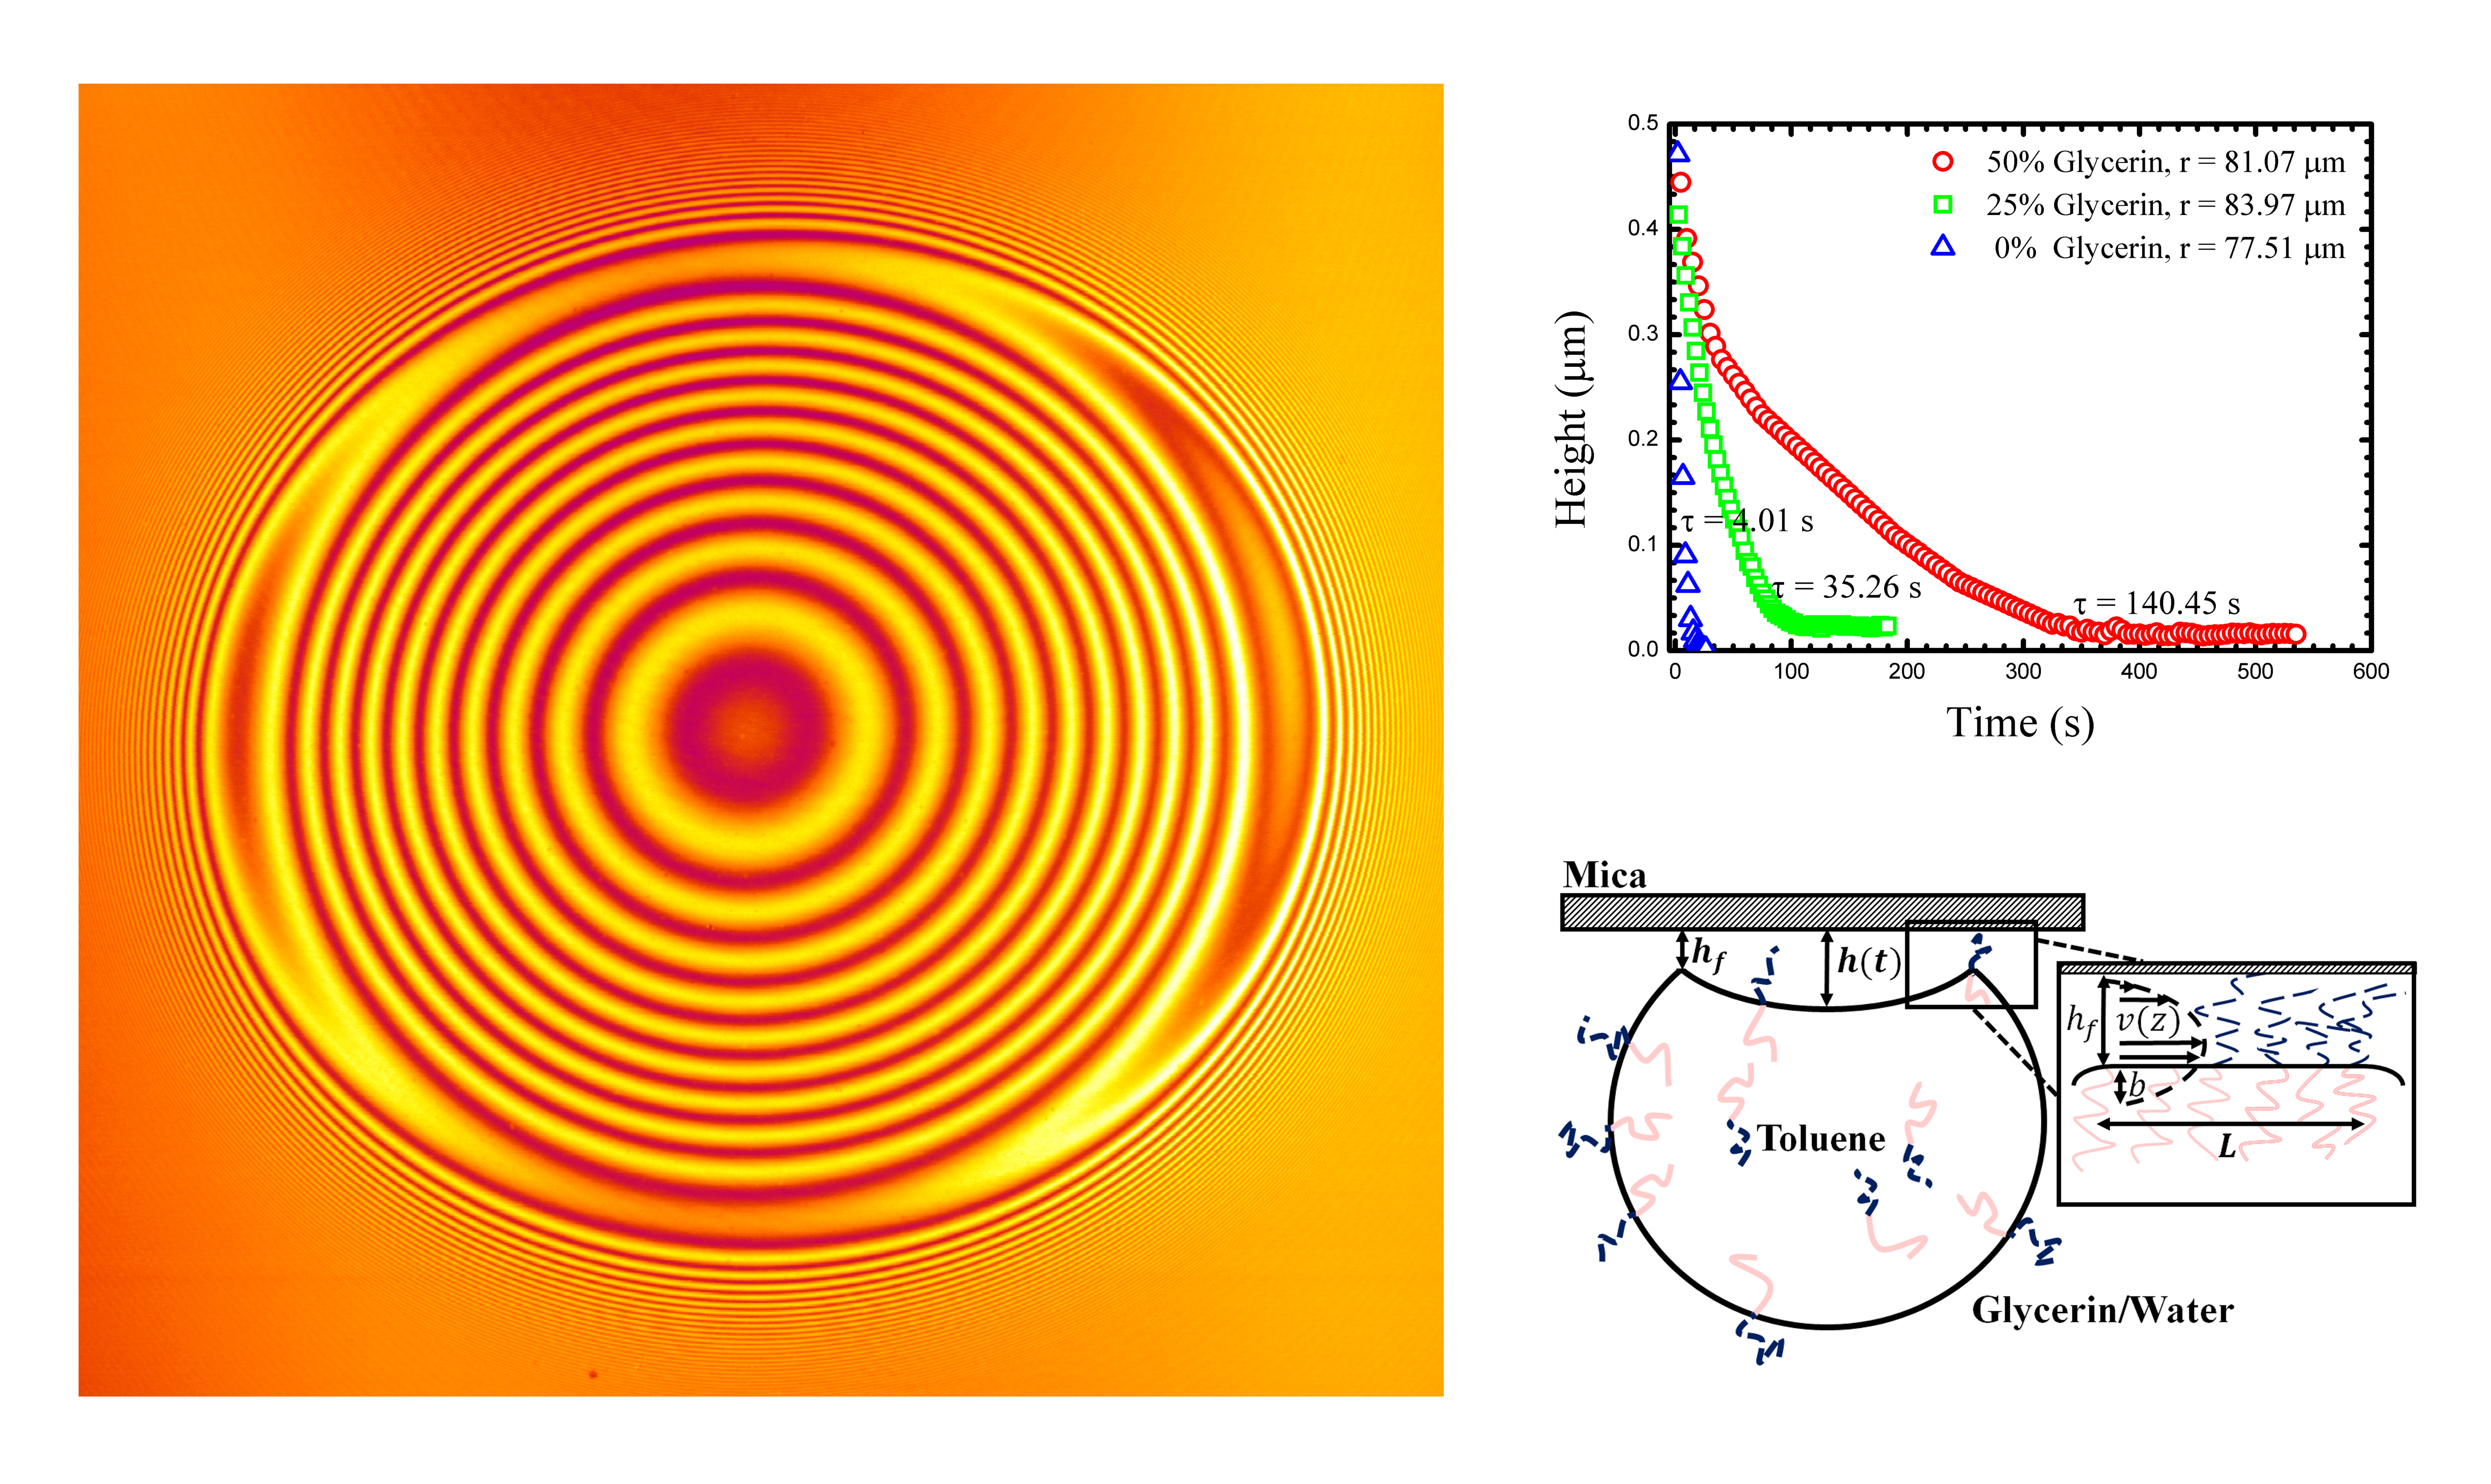
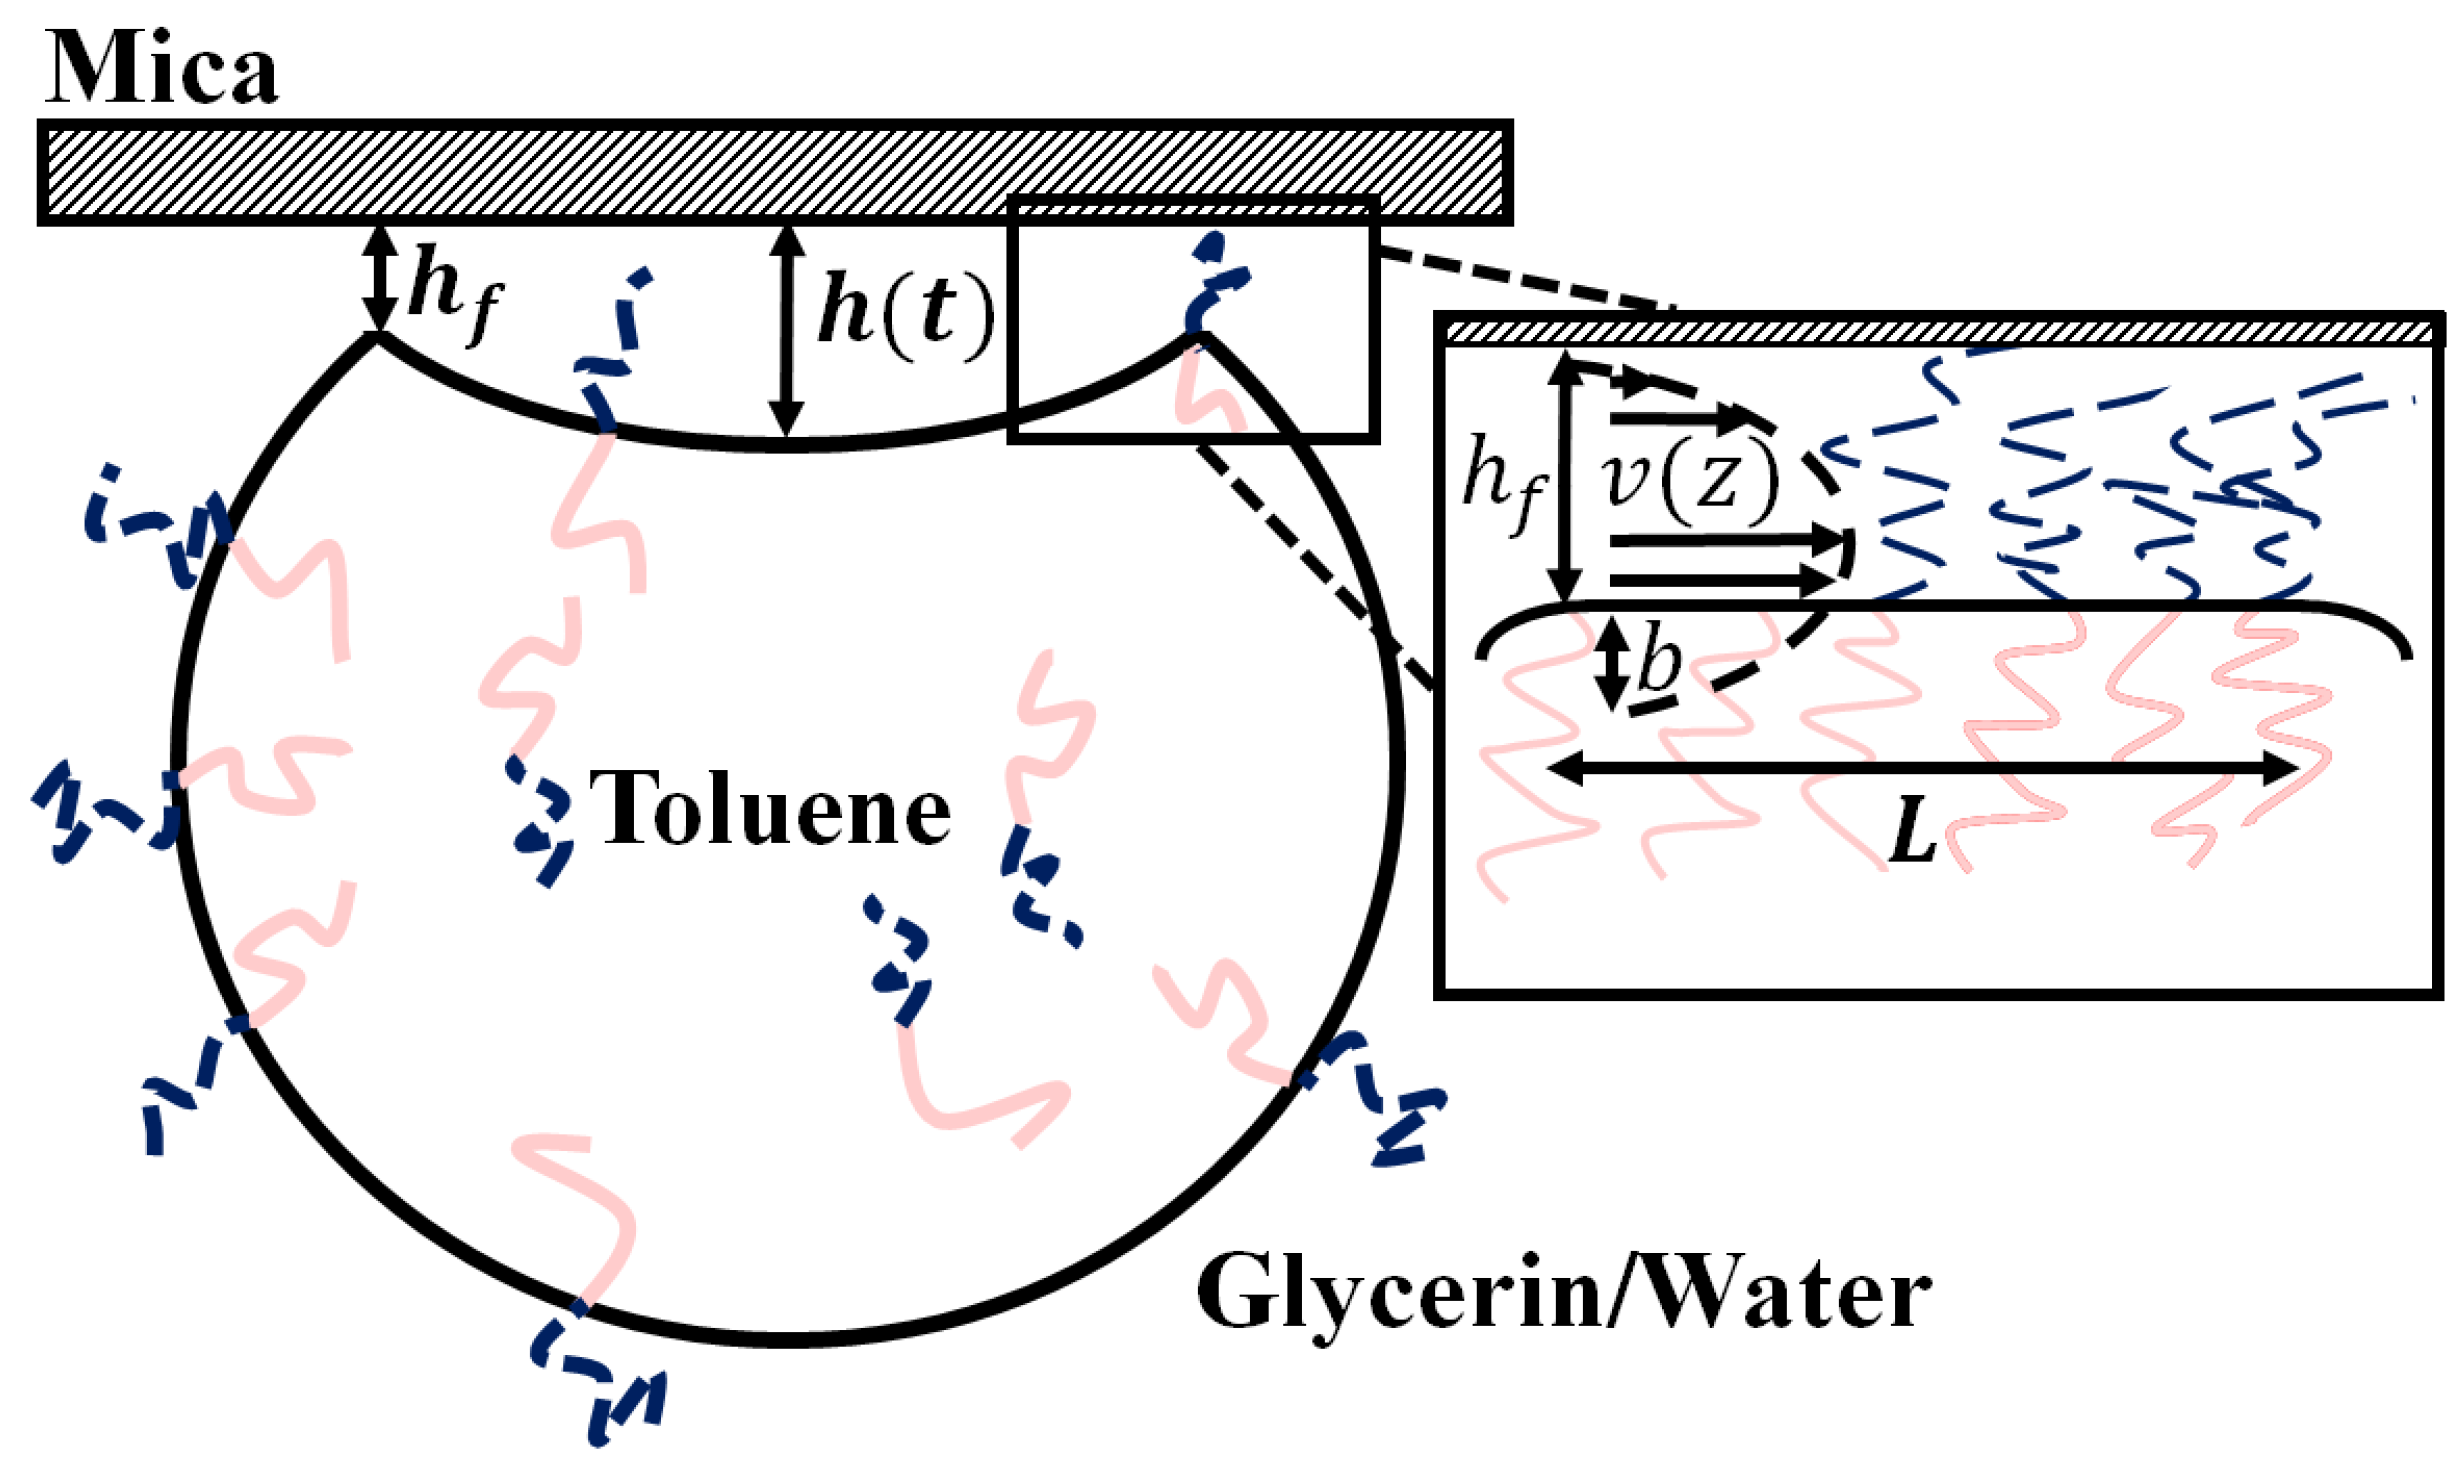
The drops were imaged (in 3D) using Laser Scanning Confocal Microscopy (LSCM, Fluoview 1000; (Olympus, Tokyo, Japan). Images show interference fringes that are generated as the light reflecting from the water/mica surface interferes with light reflecting from the drop/water interface (
Figure 1). The interference is used to measure the droplet shape near the contact patch as we outline below. Briefly, the interference maxima means that the separation between the flat mica surface and the droplet is equal to ½ of the wavelength of the laser illumination (we typically use a HeNe line in this work). One must account for the fluid’s refractive index, and note that any integer multiple of ½ wavelength criteria will also result in a maximum. A full interference calculation can account for all intensities between the maxima and minima resulting in a complete shape measurement.
3. Results
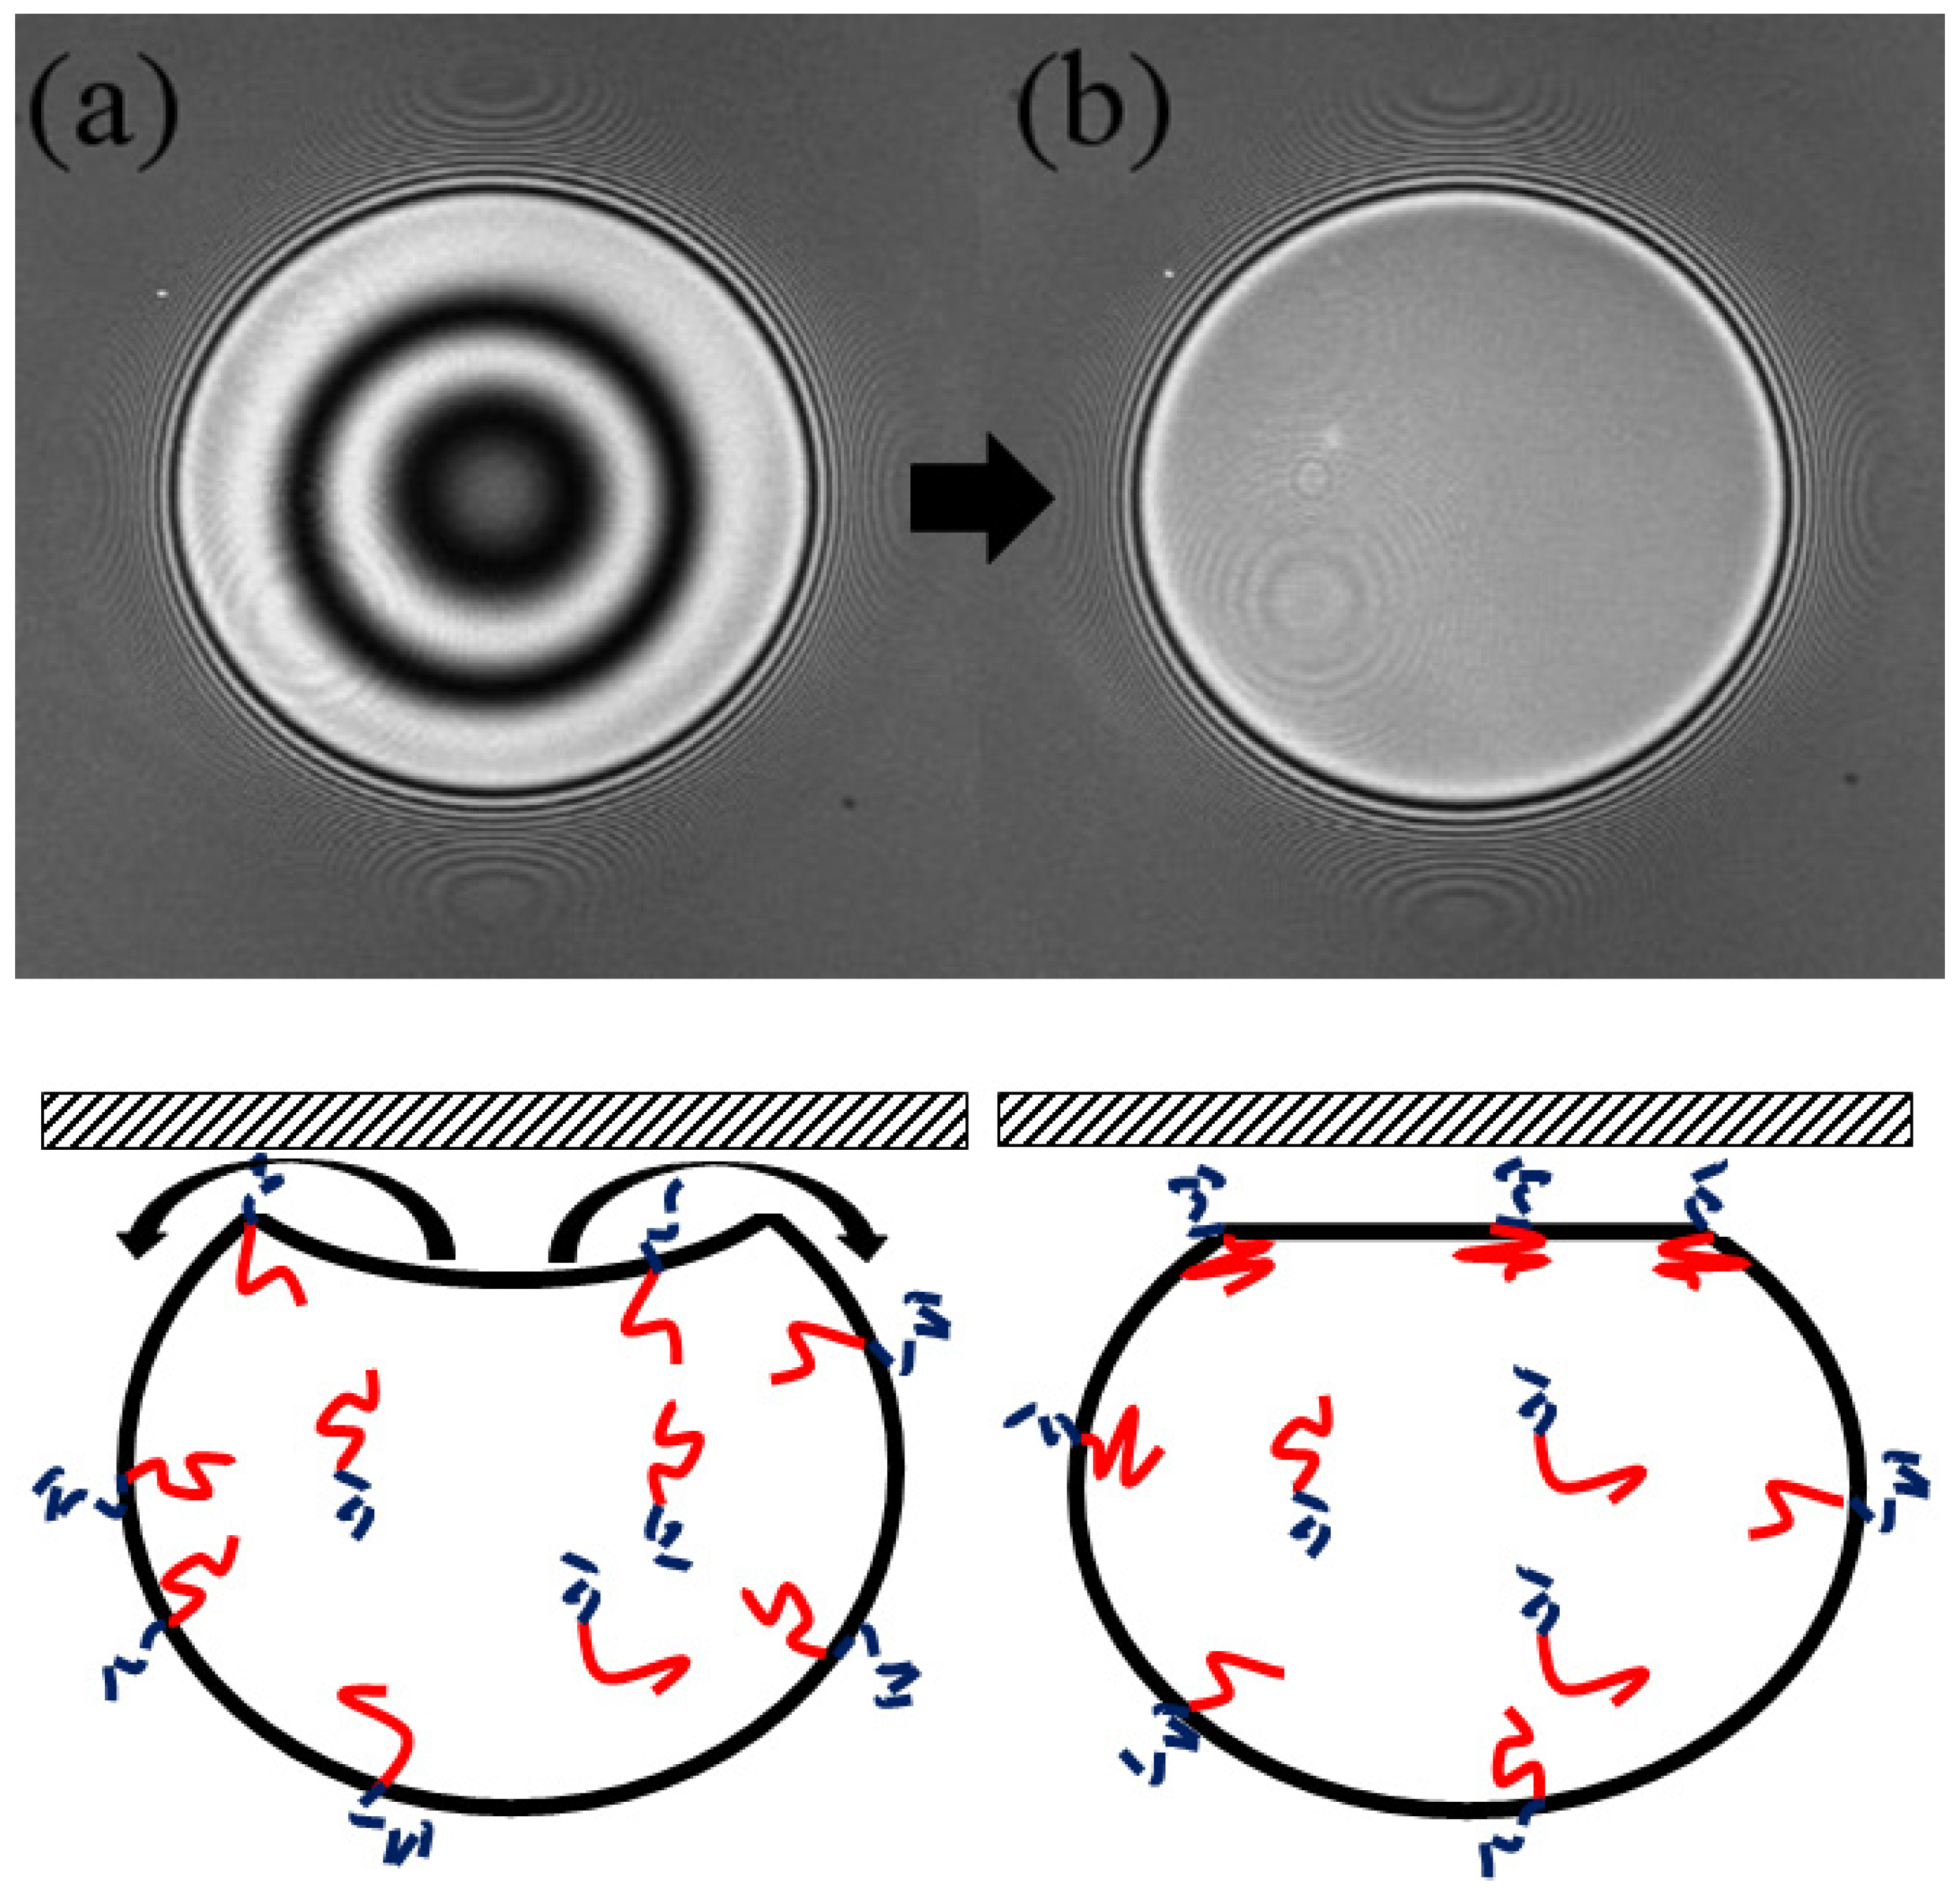
As a toluene droplet is released inside the glycerine/water cell, several processes takes place; (1) the drop floats up due to buoyancy and interacts with the mica surface. As it nears the mica, the drop buckles in and traps an amount of the glycerine/water mixture between the mica and the drop interface. (2) The trapped fluid is then slowly pushed out through the self-assembled PEO brush at the fluid/oil interface along the annular contact region. (3) The drop ultimately reaches equilibrium and rests on a circular contact patch.
Figure 1 shows a typical LSCM image of the second and the third stage of the process along with a corresponding schematic. The first stage, flattening and buckling of the drop, is not captured using LSCM as the drops rise too rapidly, particularly in the lower concentration glycerine mixtures.
Figure 1a shows the buckled drop just after it comes into contact with the mica, the shape clearly shown in its interference.
The droplet shape is imaged over the course of the experiment and from the drop shape a drainage rate (part 2) and an equilibrium contact radius can be determined. Below, we outline the details of how this measurement leads to a measurement of surface tension and the single time constant of the drainage. Experiments were conducted with several different concentrations of glycerine and water outer fluid (leading to different densities and viscosities). Ultimately, we build an understanding of the PS-PEO system and highlight the generality of the scaling argument used to model the drainage process.
3.1. Dynamic Properties
In this section we present the results for the dynamic process in which the fluid is drained out of the buckled region. Specifically, the effects of the viscosity change in the outer fluid on the drainage rate are presented here.
A model of the drainage process has recently been described and validated in an earlier publication and the reader is referred there for the complete derivation [
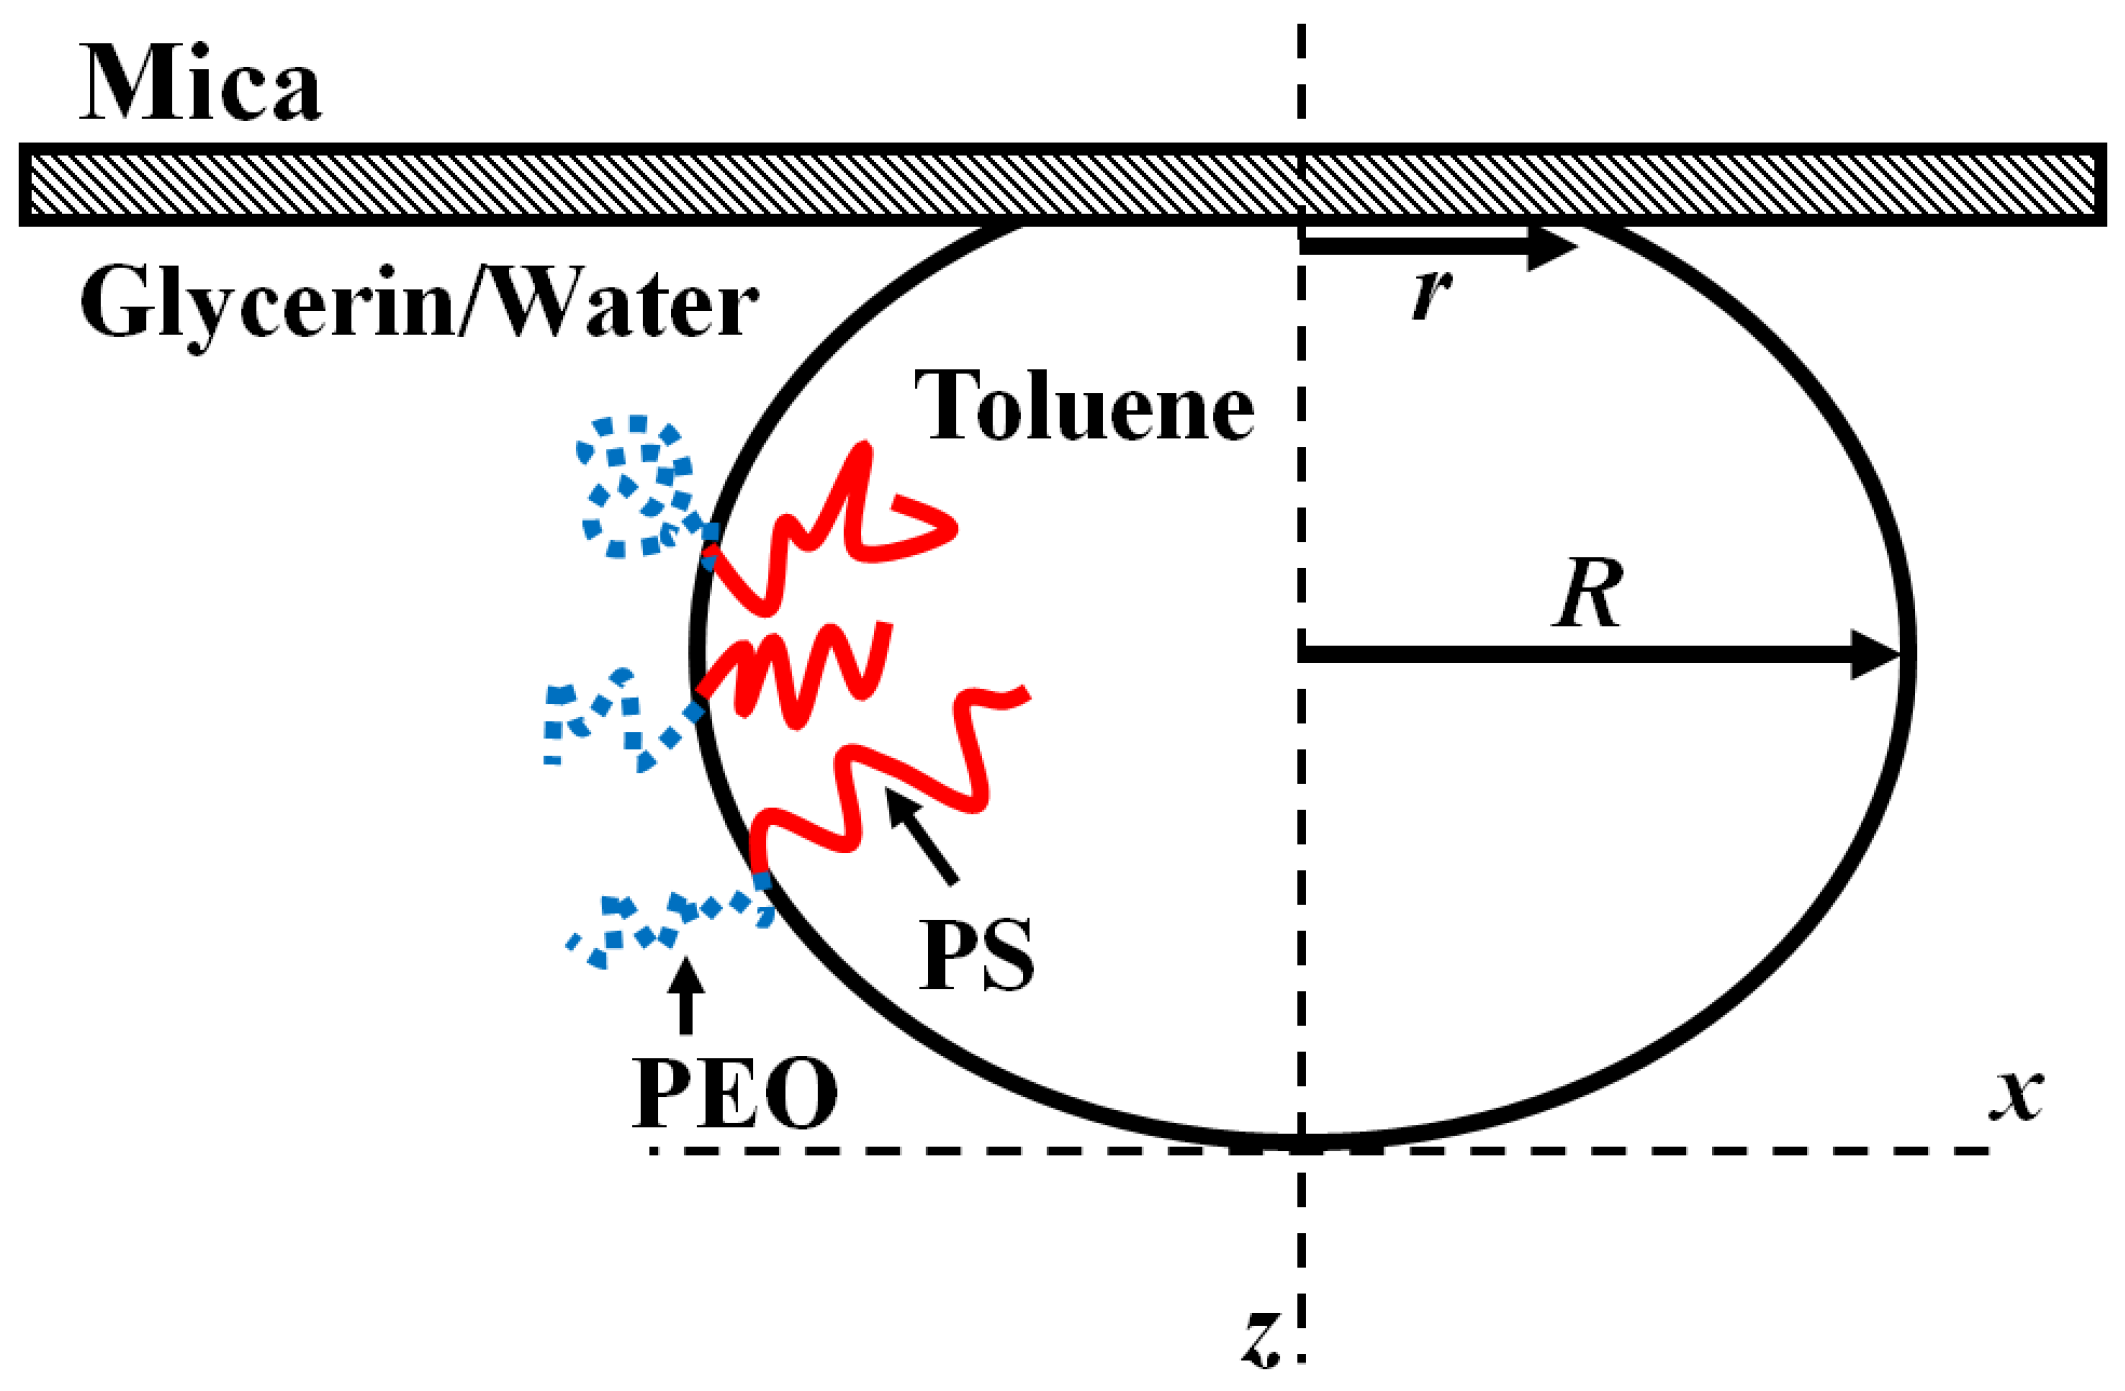
18]. Briefly, we assume a Navier-Stokes flow occurs as the trapped volume of fluid drains through the annular contact region. The boundaries assume a slip length
at the emulsion drop interface and a no slip boundary at the mica surface (see
Figure 2). The flow is driven by the Laplace pressure created by the curvature of the buckled region and the surface tension
of the oil/water interface. Assuming that the buckled region forms a spherical cap, the change in the height of the center of the buckled region as a function of time,
, is expected to take on an exponential form, with a single governing time constant:
where,
Here,
is the contact radius of the drop, and
is the dynamic viscosity.
and
characterize thickness and width of the gap under the annular contact patch through which the fluid drains.
Figure 2 shows a schematic side view of a droplet and highlights the geometric details.
h(t) was measured for each droplet by taking advantage of the interference rings captured in the LSCM images. The fringes are created through the interference of light reflected from the mica interface and the oil/water interface of the droplet, and form an accurate map of the separation of the two interfaces. In fact, when a dye was dissolved in the interior fluid (toluene), the entire shape of the drop can be determined through the interference (near the contact region) and optical sectioning (large scale drop shape). The large scale structure of the drop, characterized by its radius R, is important for determining the droplet’s surface tension, outlined in section 3.2 below.
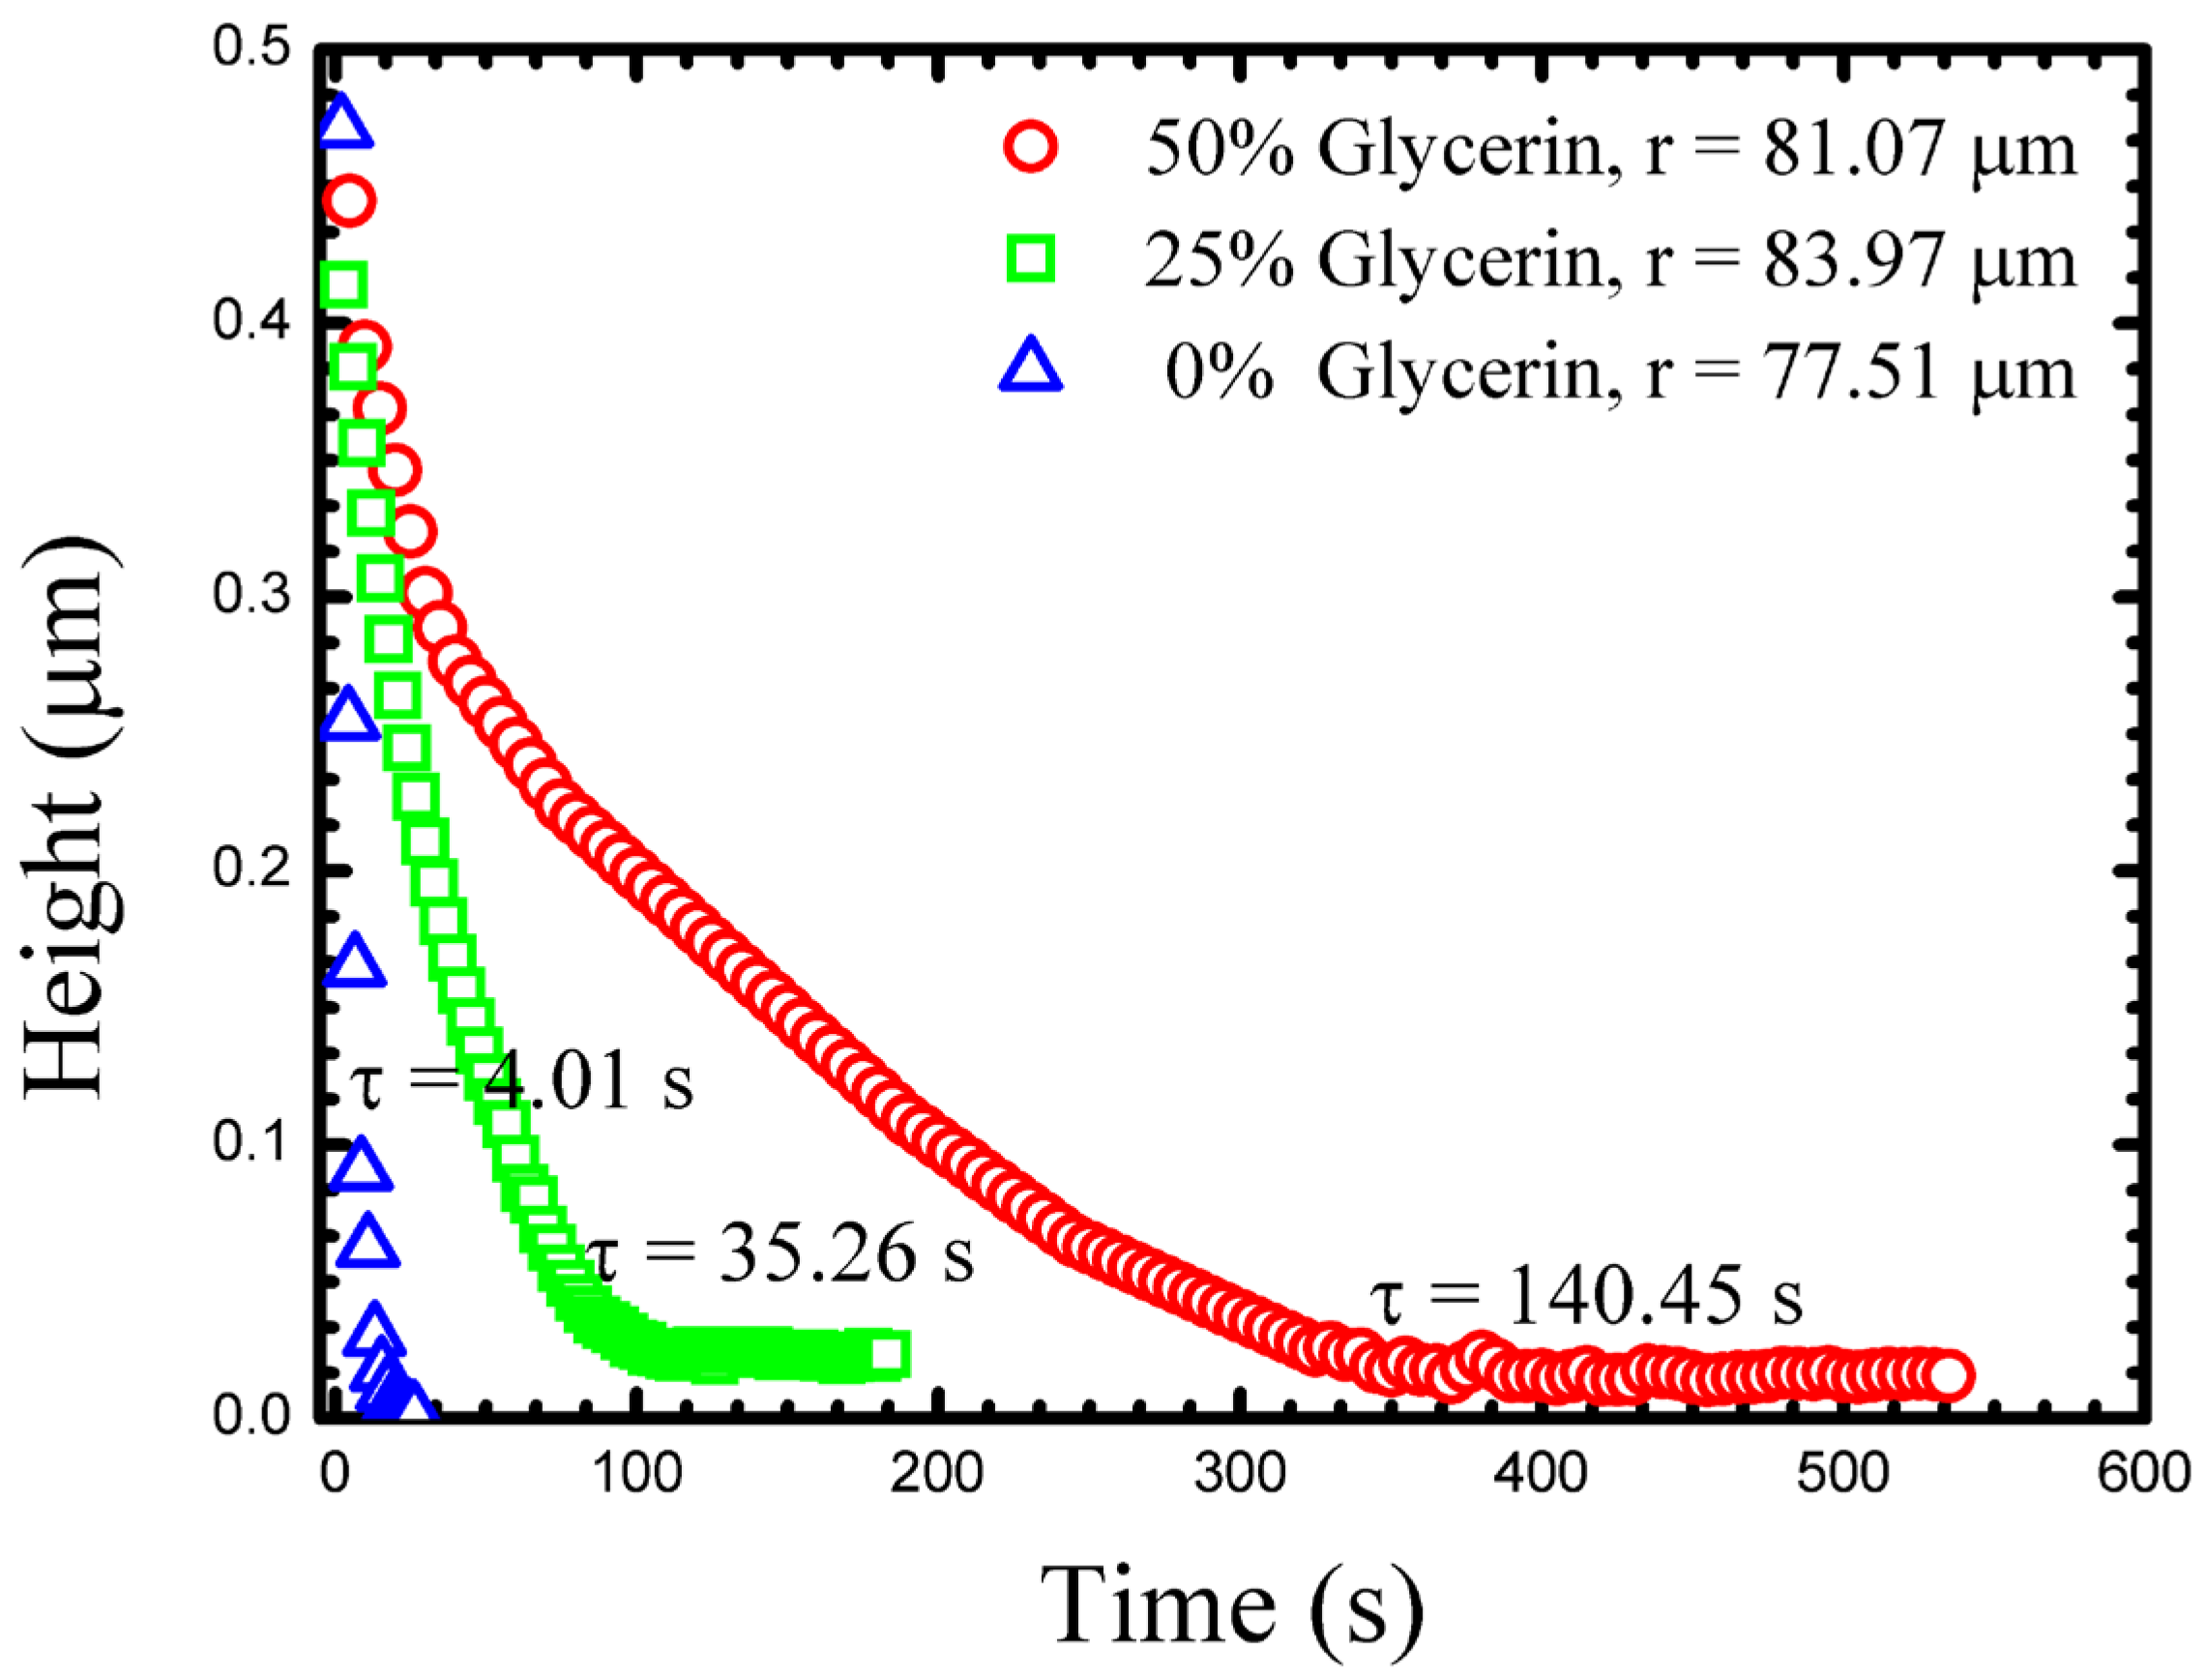
Figure 3 shows typical measurements of the
h(
t) for three drops of similar size in different outer fluids. As might be expected, the drainage slows as the glycerine content of the outer fluid increases. Such a drainage dynamic might be attributed only to viscosity, however, the density of the outer fluid also changes as does its chemistry (interfacial tension). These additional quantities must also be measured in each experiment in order for a true understanding of the drainage dynamics to be possible. Viscosity and density can easily be measured with traditional bulk techniques, and we outline below how interfacial tension can be determined from the drop shape.
At long times
h(
t) approaches a constant, small, but non-zero value. We take this long time thickness to be a measurement of the size of the PEO chain, and representative of the gap size, through which the fluid has drained (
hf) [
18]. At this stage, no further measurable changes in the drops geometry occur, indicating a clear end to the approach dynamics.
3.2. Static Properties
The surface tension of the PS-PEO covered oil-water interface was calculated using a variation of the Bashforth and Adams sessile drop method [
15]. Bashforth and Adams devised a method to measure the surface tension of fluid drops using only the deformation of the drop shape under gravity [
15]. While the method requires a full 3D droplet shape, which we collect with confocal microscopy, this is not necessary if a constitutive equation is known. In a previous paper, we showed how the measurement can be reduced to a scaling argument involving only the size of the contact patch (
r) and the size of the droplet (
R) for an ensemble of drops. The full details of the calculation and the derivation of the theory can be found in [
16]. Below we repeat a brief overview.
The measurement of the surface tension relies on the drops to be deformed from their ideal spherical shape by gravity. Roughly, this is observed in drops larger than the capillary length
, though this is not an exact estimate.
Figure 4 shows a side view schematic of a deformed drop highlighting the relevant geometric details.
The hydrostatic pressure created by the influence of gravity is balanced by the Laplace pressure created by additional curvature of the drop interface near the mica wall. Following Bashforth and Adams, the balance can be formalized in the equation:
Here,
and
are the scaled horizontal and the vertical coordinates respectively (
. The solution to this second order differential equation gives the shape of the deformed drop. Note that there is only one free parameter
in this equation (
is the gravitational acceleration,
is the density difference between the two fluids,
is the surface tension, and
is the radius of the drop at the apex). Simply, the shape of the drop is entirely controlled by the value of
. Equation (3) was originally derived and numerically solved, by paper and pencil, in 1883 [
15]. Here, GNU Octave was used to numerically solve the differential equation. As
is varied, theoretical shapes are generated and compared to measured droplet cross sections resulting in a ‘fit’ for each drop.
In practice, it is more convenient to use the model to predict the function
(the contact radius as a function of the drop radius) with a fixed choice of surface tension. The curve generated in this way can then be fit to an ensemble of drops in which only the contact radius and drop size has been measured. Not only is this approach quicker, but it enables the use of a conventional light microscope, rather than requiring a confocal microscope to collect the full 3D drop shape.
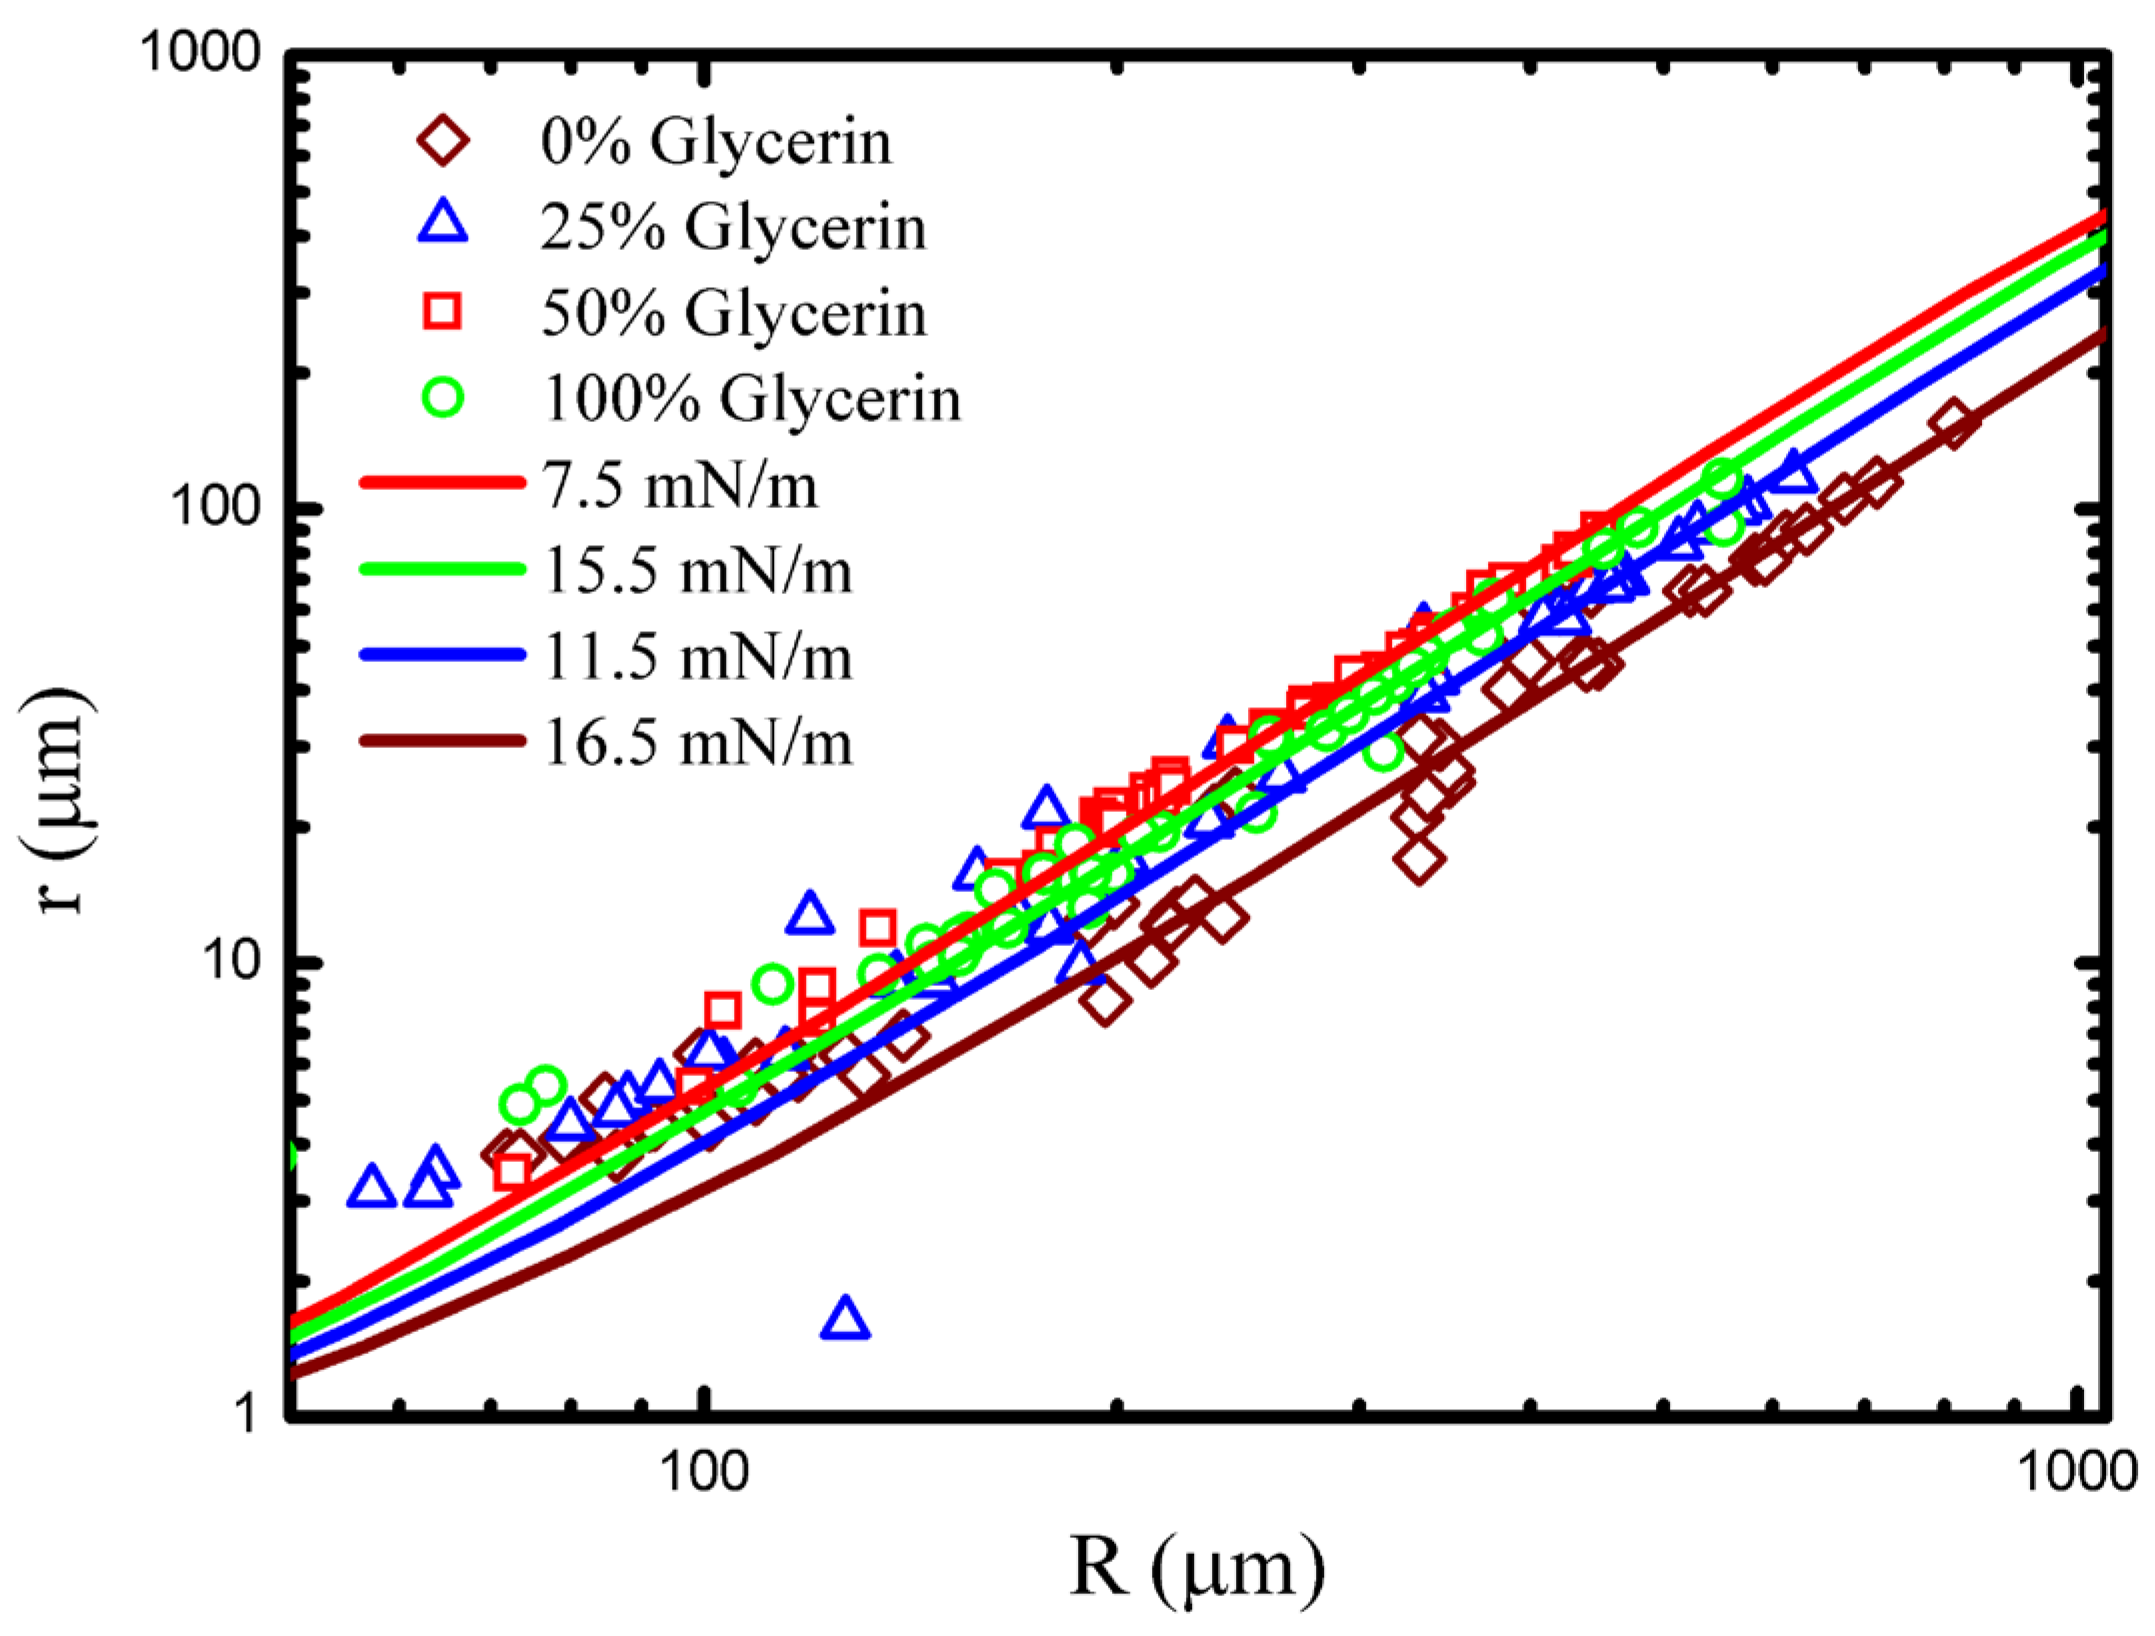
Figure 5 shows data collected in several different concentrations of glycerine/water solution fit to numerical
curves. Data is well fit by the model, and it is clear that the droplet surface tension has changed as the concentration of the outer fluid has been varied. Finally, it is useful to note that the contact radius/drop radius can be shown to scale as
.
Table 1 summarizes the basic experimentally measured quantities, the PEO brush thicknesses (
), and the surface tensions for the range of glycerin concentrations considered. The table also includes the density and viscosity of the glycerine/water solutions for convenience. Notably, the surface tension and the brush thickness reach a somewhat counterintuitive minimum at 50% glycerine.
4. Discussion
That the surface tension varies with the glycerine/water ratio of the outer fluid is not surprising, as there is a difference in solubility of polyethylene oxide (PEO) in water and glycerine. PEO has a higher solubility in water than it has in glycerine, so one would expect fewer molecules to assemble at the interface as the glycerine content rises. As the chain density at the interface is reduced, the interfacial tension is increased.
It is surprising that the surface tension reaches a minimum at an intermediate concentration, however, this also occurs because there are fewer molecules at the interface at low glycerine concentrations. As the concentration decreases, the PEO molecules find themselves in an increasingly attractive solvent. This causes the chains to swell, and once again fewer can fit on the oil water interface. The effect is evident in the PEO brush thickness measurement as well, with stretching occuring at both low and high glycerine content. Competition between the two effects, poor solvent driving chains off the interface, and good solvent swelling chains so fewer can fit on the interface, result in a minimum tension at a concentration of approximately 50%. Without direct measurement, this effect may be easily overlooked, hilighting the utility of measuring material properties in situ.
The drainage of the fluid trapped during the droplet’s approach to the wall also clearly depended on the concentration of the outer fluid (
Figure 3). The accurate surface tension measured at each concentration now allows the drainage model to be more deeply evaluated.
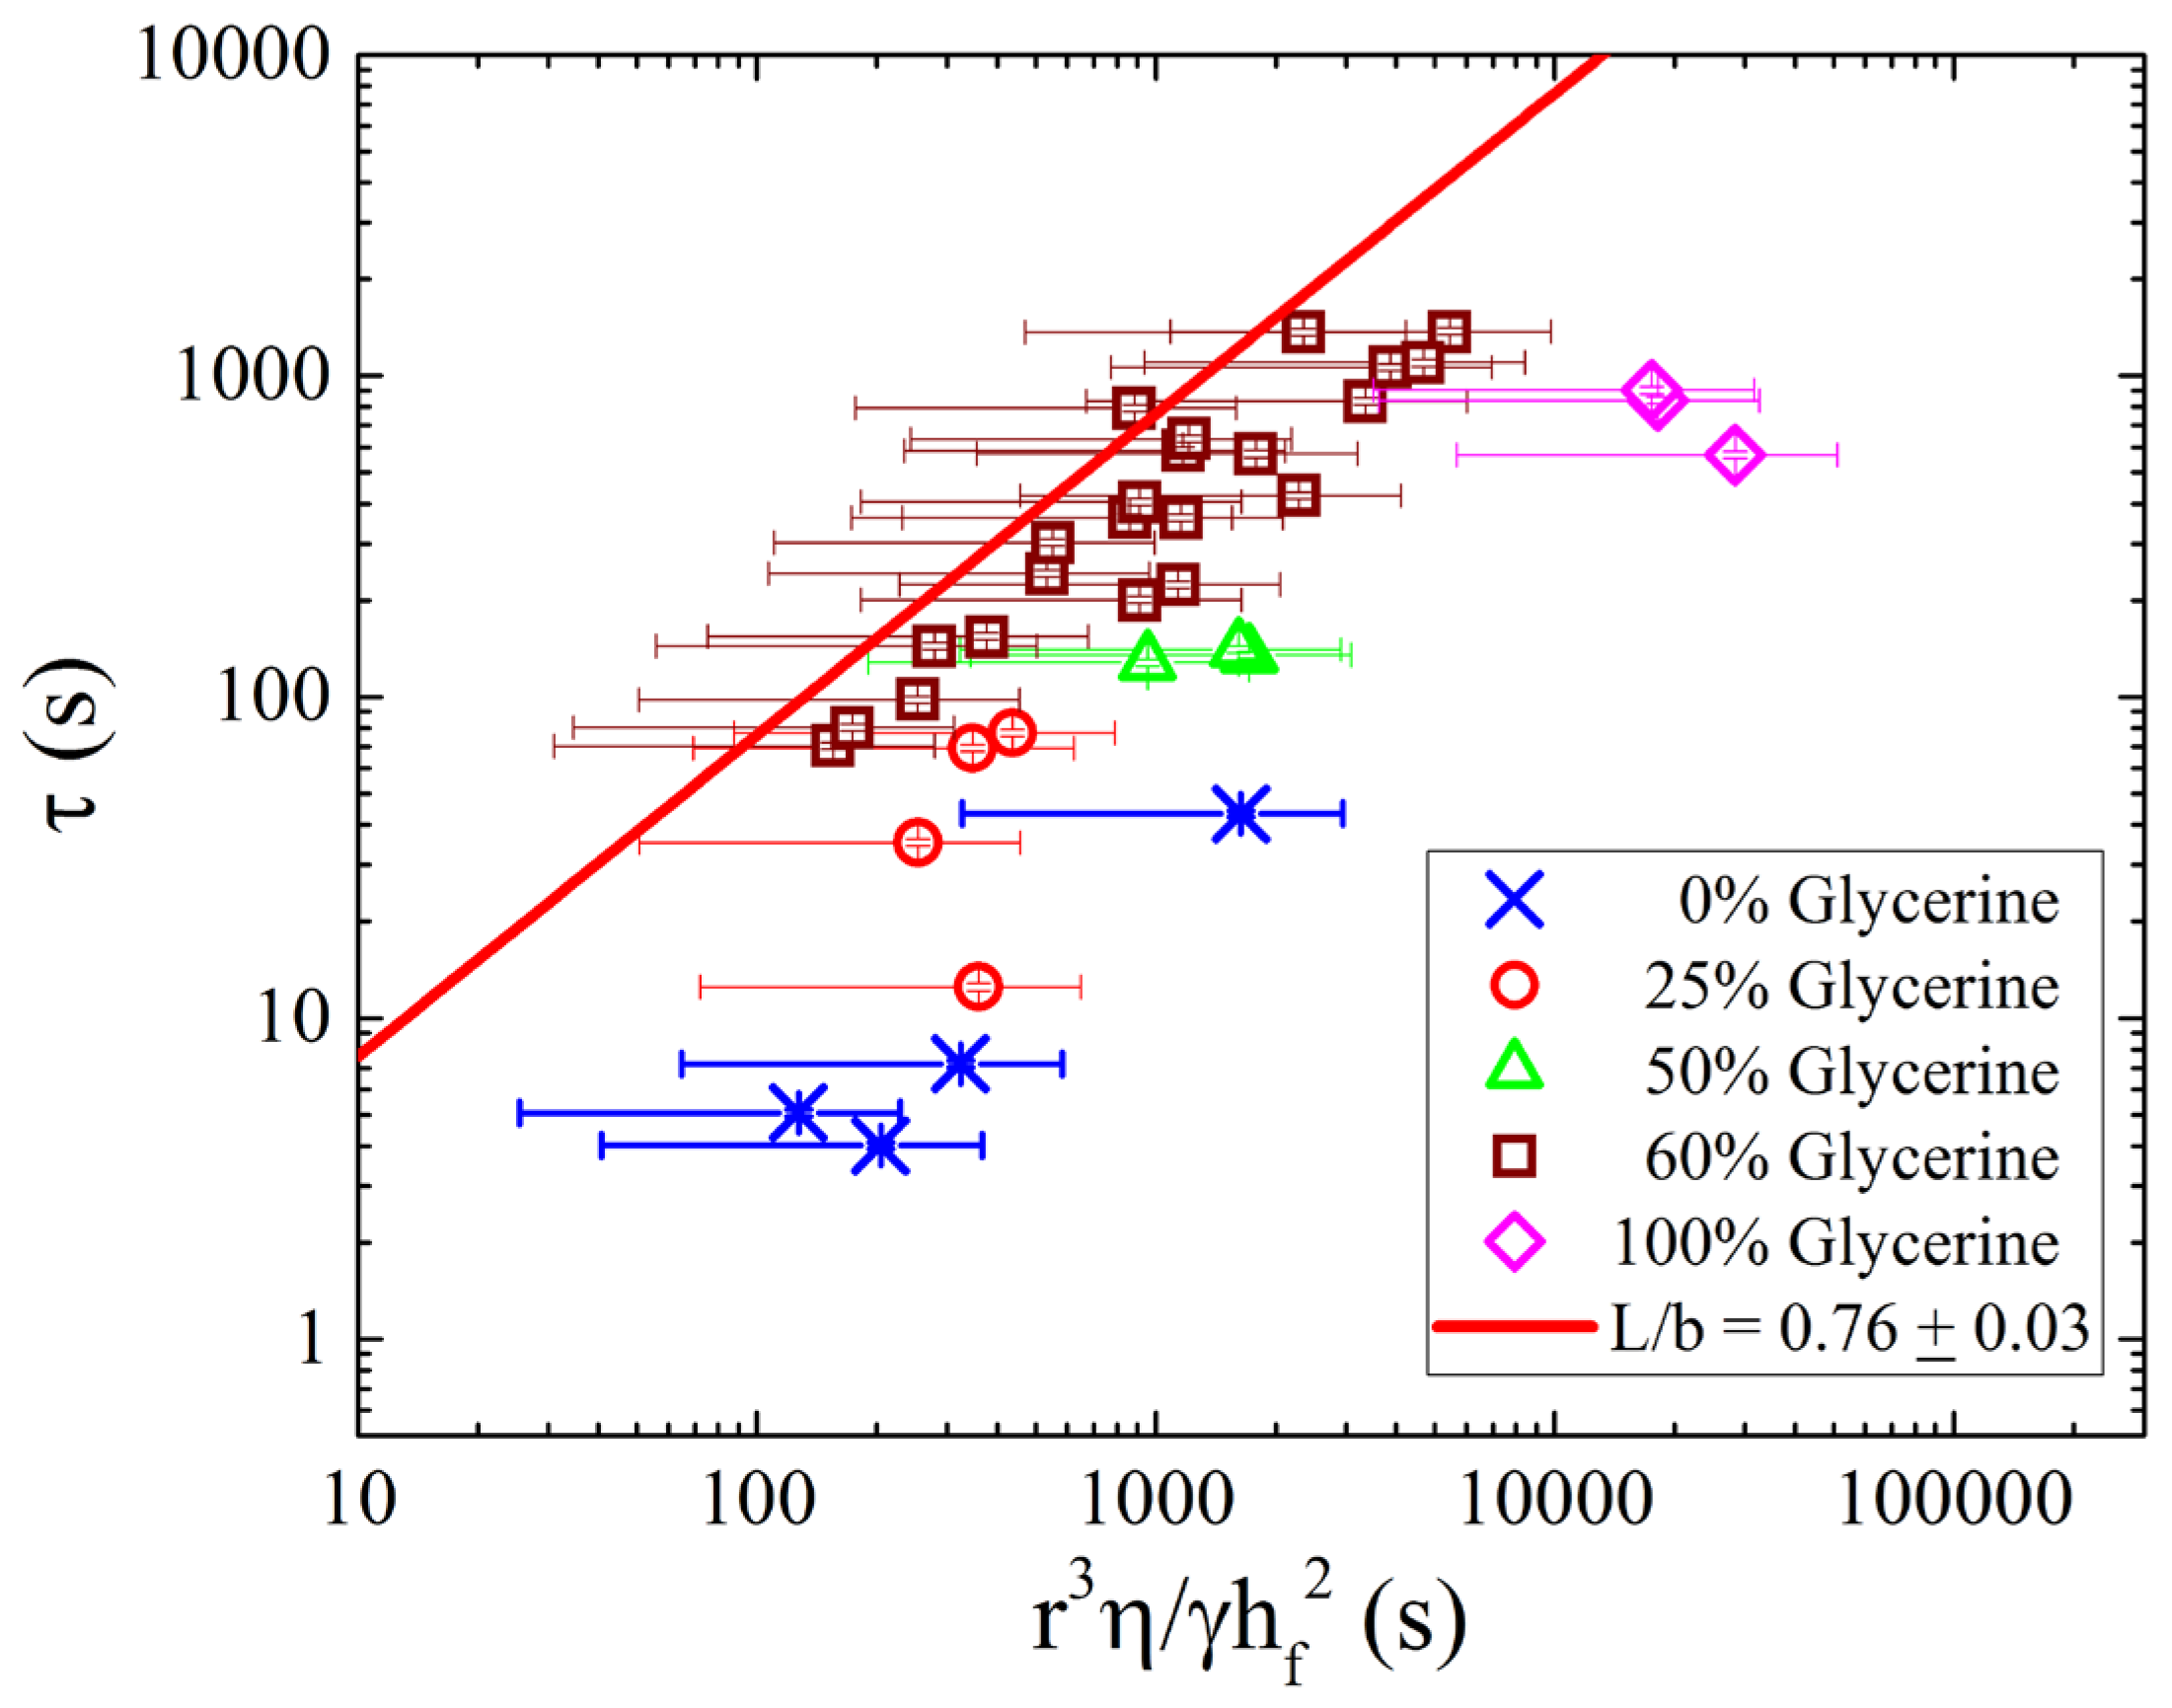
Figure 6 shows the drainage time constant,
, plotted as a function of radius cubed, scaled by viscosity, surface tension, and brush thickness (
). The data for all concentrations now collapses onto a single linear curve as predicted by Equation (2). Plotted in this manner, a linear curve fit to the data yields a measurement for the only free parameter,
, which we find to be
. The fit value is close to
, suggesting the slip length
and the width of the draining region (
) are similar in length scale. It is remarkable that neither quantity depends on the concentration of the outer fluid directly (or at least depends on concentration in an identical way). Such an observation may indicate a more universal relation between the two variables.
5. Conclusions
Emulsion drops of 0.05% PS-PEO in toluene solution were created in a glass cell filled with water. The glass cell was capped with a freshly cleaved mica sheet and drops were observed as buoyancy pushed them against the mica surface. LSCM was used to image the dynamic processes occurring as the drops buckle in and trap a small amount of the outer fluid as they approach the mica surface. Both the drainage process and the equilibrium shape eventually reached by the emulsion drop can be analyzed to yield a surface tension and a drainage time constant.
In this work, the concentration of glycerine/water was varied in order to examine viscosity changes of four orders of magnitude. It was found that the surface tension was also correlated with glycerine concentration, having a nonlinear relation and a minimum around 50%. Time constants were found to be accurately predicted by a recent model of the drainage process, with data for all concentrations collapsing onto a master curve. The data collapse lead to the conclusion that the ratio of the hydrodynamic slip length to the width of the annular contact region was constant over all conditions tested, and nearly equal to one. The stability of the ratio of the slip length to the annulus width hints at a deeper relation between the two quantities.
We conclude by noting that the relative simplicity of the experimental approach used here allows its easy adoption by the broader community of emulsion researchers, and may help address interesting and longstanding physical questions related to emulsion stability.


