Article

Modeling and Optimization of High-Performance Polymer Membrane Reactor Systems for Water–Gas Shift Reaction Applications

by
Andrew J. Radcliffe
1,
Rajinder P. Singh
2,
Kathryn A. Berchtold
2 and
Fernando V. Lima
1,*
1
Department of Chemical Engineering, West Virginia University, Morgantown, WV 26506, USA
2
Carbon Capture and Separations for Energy Applications, Materials Physics and Applications Division, Los Alamos National Laboratory, Los Alamos, NM 87545, USA
*
Author to whom correspondence should be addressed.
Processes 2016, 4(2), 8; https://doi.org/10.3390/pr4020008
Submission received: 2 December 2015 / Accepted: 21 March 2016 / Published: 1 April 2016
(This article belongs to the Special Issue Polymer Modeling, Control and Monitoring)

Abstract

:
In production of electricity from coal, integrated gasification combined cycle plants typically operate with conventional packed bed reactors for the water-gas shift reaction, and a Selexol process for carbon dioxide removal. Implementation of membrane reactors in place of these two process units provides advantages such as increased carbon monoxide conversion, facilitated CO2 removal/sequestration and process intensification. Proposed H2-selective membranes for these reactors are typically of palladium alloy or ceramic due to their outstanding gas separation properties; however, on an industrial scale, the cost of such materials may become exorbitant. High-performance polymeric membranes, such as polybenzimidazoles (PBIs), present themselves as low-cost alternatives with gas separation properties suitable for use in such membrane reactors, given their significant thermal and chemical stability. In this work, the performance of a class of high-performance polymeric membranes is assessed for use in integrated gasification combined cycle (IGCC) units operated with carbon capture, subject to constraints on equipment and process streams. Several systems are considered for use with the polymeric membranes, including membrane reactors and permeative stage reactors. Based upon models developed for each configuration, constrained optimization problems are formulated which seek to more efficiently employ membrane surface area. From the optimization results, the limiting membrane parameter for achieving all carbon capture and H2 production specifications for water–gas shift reactor applications is determined to be the selectivity, α H 2 / C O 2 , and thus a minimum value of this parameter which satisfies all the constraints is identified for each analyzed configuration. For a CO2 capture value of 90%, this value is found to be α = 61 for the membrane reactor and the 3-stage permeative stage reactor and α = 62 for the 2-stage permeative stage reactor. The proposed systems approach has the potential to be employed to identify performance limitations associated with membrane materials to guide the development of future polymeric and other advanced materials with desired membrane characteristics for energy and environmental applications.

1. Introduction and Prior Work

As the world transitions to a more environmentally conscious economy, the importance of hydrogen (H2) production processes is paramount. Hydrocarbons such as petroleum, natural gas, coal and biomass serve as the principal sources of H2, which will see use as a feedstock in myriad clean energy and chemical production processes. As H2 production from hydrocarbons generates carbon dioxide (CO2), processes incorporating carbon capture technologies are necessary to achieve the objective of reduction of CO2 emissions in accordance with protocols that seek to mitigate global climate change. Based upon extrapolation of the rates of consumption and available reserves, projections posit that petroleum resources may be depleted within 50 years and natural gas resources within 100; however, coal resources may exhibit their current availability for a couple hundred years [1]. Consequently, emerging energy technologies that utilize coal as the feedstock, such as integrated gasification combined cycle (IGCC) power plants operated with carbon capture, are particularly promising.
Coal-based IGCC units produce electricity through a synthesis gas (syngas) intermediate, which is subjected to the water-gas shift (WGS) reaction to maximize H2 produced prior to the stream being sent to the gas turbine portion of the unit. An IGCC process scheme with carbon capture typically utilizes packed-bed WGS reactors followed by CO2 removal by a Selexol process [2,3]. An alternative to this method of syngas conversion utilizes membrane reactors (MRs) equipped with H2-selective membranes, which grant advantages such as increased carbon monoxide (CO) conversion, facilitated CO2 removal/sequestration (CO2-rich effluent is produced at high pressure), and process intensification through a reduction to the total number of process units [2,4].
There are challenges inherent to the use of MRs for such an application as the H2-selective membranes must be stable under high-temperature and extreme pressure conditions in the presence of water and contaminants such as hydrogen sulfide (H2S). H2-selective membranes commonly considered for this application are as follows: (i) zeolite-based molecular sieves; (ii) dense metals such as Pd; and (iii) polymeric membranes. Of these potential membrane materials, (i) and (ii) possess highly favorable gas separation properties in terms of selectivity and flux, but the cost for these materials may be prohibitive for industrial-scale application. Only some polymeric membranes can be considered for the WGS application, as the elevated operating temperature of the MR unit is often outside the stability limits of the membrane material or the membrane material exhibits limited gas separation properties at the operating temperatures defined by the WGS-MR. However, if the aforementioned performance and stability challenges are addressed, polymeric membranes possessing suitable gas separation properties offer the potential to greatly reduce the cost of industrial-scale-MR implementation.
Polybenzimidazoles (PBIs) represent one such class of high performance polymers having exceptional chemical and physical characteristics enabling H2/CO2 separation in challenging thermo-chemical environments. These materials exhibit molecular-sieving mechanisms analogous to those observed in zeolite-based membranes, which imbues these materials with attractive H2/CO2 selectivity for syngas separations. High-performance polymeric materials have also been found to exhibit good thermal stability up to 400 °C and chemical stability in the presence of common syngas contaminants [5,6].
One objective of this study is to assess the feasibility of the state-of-the-art high-performance polymeric materials for use in membrane reactor systems with respect to performance constraints set forth by the U.S. Department of Energy (DOE) for pre-combustion CO conversion/CO2 separation processes within IGCC units [3]. In this study, the performance characteristics of PBI-based membranes, as demonstrated by Berchtold and coworkers in [5], are used to develop the benchmark case for the polymer membrane-based MR process schemes investigated and developed herein. These PBI-based membrane materials have demonstrated industrially attractive H2/CO2 separation characteristics including ideal H2 permeabilities between 58 and 78 barrer and H2/CO2 selectivities between 23 and 43 at 250 °C [5,7]. Additionally, this study seeks to determine the minimum membrane characteristics needed to satisfy the DOE’s performance constraints by considering process models for several reactor designs. The performance of the various reactors is assessed in the base case conformations, which are then modified by considering different catalyst/membrane placement about the axial axis. Alternative reactor designs are developed by seeking to maximize reactor performance (H2 recovery) for the minimum reactor cost as determined by the required membrane surface area. As demonstrated previously, an optimization problem is formulated to guide these designs [2].
With regard to the systems analysis, there are several MR models (utilizing H2-selective membranes) related to the WGS reaction available in the literature, encompassing the range from 1-D/isothermal to 2-D/non-isothermal. Also available in the literature are MR models that employ H2-selective membranes relating to widely varied applications (see [2] for a summary for MR models, efforts and applications). A review of literature shows a few computational modeling studies based on membrane reactors employing polymeric membranes [8,9], due in part to the temperature limitations imposed by available polymers. However, the literature suggests a lack of studies on optimization of polymer-based MR configurations. Recent and continued development and demonstration of high performance polymers such as PBIs for potential use in challenging membrane separation environments, such as those encountered in the vicinity of the WGS reaction, presents an opportunity to derive a MR model for a system utilizing such H2-selective polymers and subsequently evaluate their potential in this challenging separations role [5,7,10]. This study is focused on H2-selective membranes due to their advantages over CO2-selective membranes in IGCC process schemes, as discussed by [11].
Moreover, several optimization studies relating to packed-bed MRs and reactor systems employing membrane separators are available in the literature. These studies have utilized H2-selective membranes (ceramic or Pd) to formulate optimization problems that examine staged membrane reactors [12,13,14] and traditional MRs [2]. In the case of the staged membrane reactors, the optimization problems were formulated with the objective of maximizing methane conversion, H2 recovery or H2 yield in a steam methane reforming (SMR) process employing a Pd-based membrane. These studies considered a permeative stage membrane reactor (PSMR) with a fixed number of stages, or a staged membrane reactor (continuous membrane, catalyst packing with inert stages). The decision variables were composed of the catalyst/membrane stage lengths, but the problem was not subject to performance constraints. For the case of the traditional MR performing the WGS reaction, the study formulated an optimization problem in terms of economic variables that maximizes performance (H2 recovery) for the minimum cost (membrane surface area) subject to multiple constraints on reactor effluent streams by considering alternative catalyst/membrane placement about the axial axis of the reactor. With regard to the available literature, it is worth noting that computational studies of SMR or WGS processes that use Pd/micro-porous ceramic membranes have H2 selectivity values that are comparatively larger than those of polymeric membranes.
Thus, the computational study performed here of MR systems employing novel polymeric membrane materials provides insight into their feasibility for WGS reaction applications. Additionally, such a study may be used to identify performance limitations associated with the material, which may be used to guide the development of future polymeric materials with desired membrane characteristics. To this end, mathematical models are developed for traditional MRs and PSMRs using the performance characteristics of PBI membranes; these models are subsequently employed to develop reactor designs that satisfy the set of performance constraints set forth by the U.S. DOE for pre-combustion CO conversion (WGS reaction)/CO2 separation processes within IGCC units. Using these process models for the MR and PSMR cases, constrained optimization problems are formulated that seek to maximize performance (H2 recovery) through minimization of membrane surface area—this is achieved by considering alternate membrane placement about the axial axis of the reactor. Through the formulation of two optimization problems, the performance-limiting membrane parameter is identified and a minimum value that satisfies all equipment/stream constraints is successfully calculated for each configuration. This study contributes insight into identifying and prioritizing the membrane parameters that should be the focus of future polymeric membrane development efforts, and provides a minimum value for key parameters that satisfy the set of six performance constraints; to this end, it is worth noting that the minimum selectivity value (one such key parameter) presented here is unique to the operating temperature and pressure of the process units, and the syngas feed/steam sweep flowrates.

2. Systems Analysis—Process Modeling, Simulation and Optimization Approach

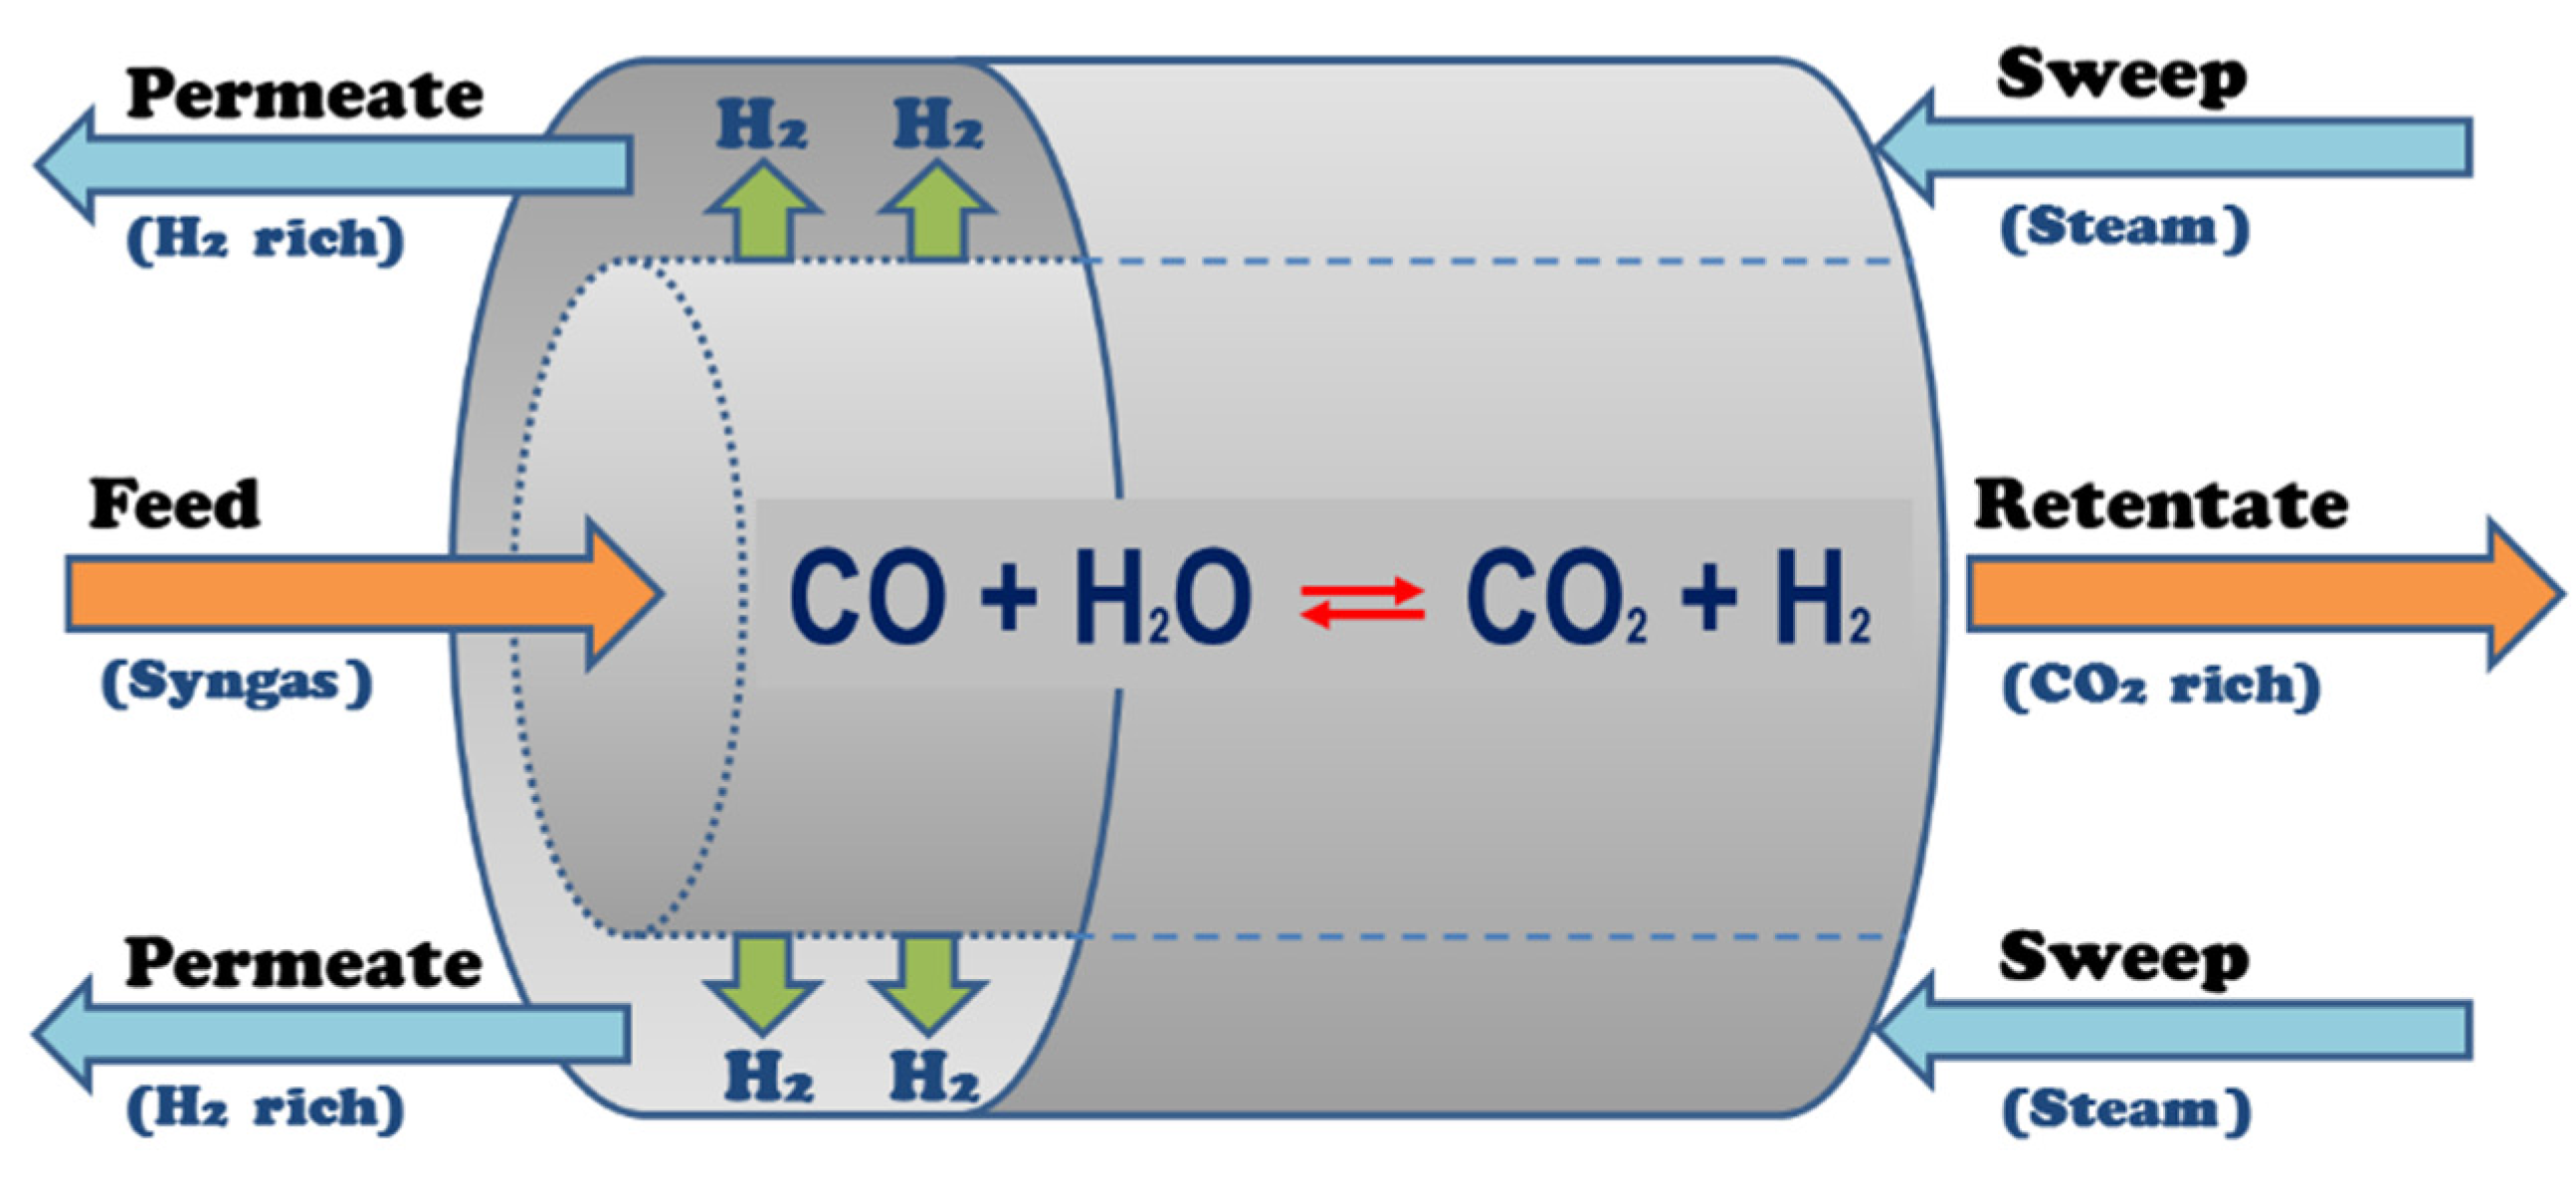
2.1. Membrane Modeling

The membrane reactor model employed for the performance assessment and optimization studies is a one-dimensional, isothermal model in which operation is steady-state and the ideal gas law is assumed to hold. The 1-D and isothermal model assumptions are reasonable for a laboratory-scale membrane reactor [15]. This model was developed based on the WGS-MR model in [2]. A summary of the development is presented below; refer to [2] for additional detail. Assuming plug-flow operation, the membrane reactor model consists of species mole balances for co-current and counter-current cases:
Mole balance, tube:
d F i , t d z = r i A t J i π d t
where Fi,t is the flow rate in the tube, ri is the species reaction rate, At is the cross-sectional area of the tube, Ji is the molar flux across the tube wall, and dt is the tube diameter. Additionally, ri = rCO for i=CO, H2O; ri = -rCO for i = CO2, H2 and ri = 0 for i = N2. The reaction rate, rCO, is the rate associated with the Cu/ZnO/Al2O3 catalyst [16].
Mole balance, shell:
( ± ) d F i , s d z = J i π d t
where Fi,s is the flow rate in the shell. The positive coefficient corresponds to co-current operation and negative to counter-current. For the permeative stage membrane reactor, the only differences in the model are: Ji = 0 in the reactor stages, and ri = 0 in the membrane separator stages. The resulting mathematical model consists of an ODE system corresponding to an initial value problem (co-current) or a boundary value problem (counter-current), both of which may be solved using the MATLAB subroutines ode15s or bvp4c, respectively. A schematic of the counter-current MR design employed here is shown in Figure 1; co-current operation of the unit would align the feed/sweep in the same direction with respect to the axial axis. A comparison using models developed in Aspen Plus considering the scenarios of an IGCC plant with the WGS-MR process against the CO shift followed by physical absorption (e.g., Selexol) technologies for CO2 capture will be analyzed in a future publication.
The flux through the high-performance polymer membrane is assumed to be Fickian activated diffusion, which is proportionate to the component partial pressure difference across the membrane [17]; and is described by:
J i = Q i Δ p i
where Δpi is the partial pressure difference of the component across the membrane. The permeance of a component i, Qi, is determined by the membrane properties that are taken from test systems available in the literature. The permeability (Pi) of a component through polymers is considered to be the product of the diffusion coefficient, Di, and solubility coefficient, Si [18].
Noting that selectivity (α) of species i to j is defined as the ratio of the permeability of species i to j, such that:
α i j = P i P j
and the permeance of a species is:
Q i = P i δ m e m
where δmem is the membrane thickness.
In this paper, we focus on a class of high-performance PBI-based H2-selective polymeric membranes utilizing their demonstrated separation performance characteristics in multiple platforms including flat sheet, tubular, and hollow fiber [5,7,10] for an assumed industrially relevant selective layer thickness range of 100-200 nm. Thus, the following membrane characteristics are used in this study:
  • QH2 = 250 GPU
  • αH2/CO2 = 20–28
Also, for this study we assume that at high temperatures, these membranes have high permeability to water (αH2/H2O = 0.33) and low permeability to the other species considered here. The H2/CO selectivity in this study was assumed to be 99, similar to experimentally measured H2/N2 selectivity of 99. However, based on the size difference between CO (kinetic diameter = 3.76 Å) and N2 (3.64 Å), a H2/CO selectivity greater than 99 would be possible. In particular, both H2/CO2 and H2/CO permselectivities must be high for this application as one desires to produce a purified CO2 effluent from the reactor side.

2.2. Simulation Set Up

The reactor feed composition/molar flow rate and sweep composition/molar flow rate are drawn from [2]; the feed corresponds to a syngas stream from the gasifier after steam injection (it is assumed that sulfurous compounds and other impurities have been removed) while the sweep composition is pure steam. The feed/sweep compositions are summarized in Table 1.
The performance of each reactor system is evaluated in terms of the three performance goals set forth by the U.S. DOE for CO conversion, H2 recovery and CO2 capture in addition to three constraints on the reactor effluent streams as defined [2]:
  • CO conversion (XCO)
    X CO = CO   converted CO   in   feed = F CO , f ( F CO , r + F CO , p ) F CO , f 98 %
  • H2 recovery (RH2)
    R H 2 = H 2 in   permeate ( H 2 + CO ) in   feed = F H 2 , p F H 2 , f + F CO , f 95 %
  • CO2 Capture (CCO2)
    C CO 2 = carbon   in   retentate carbon   in   feed = F CO , r + F CO 2 , r F CO , f + F CO 2 , f 90 %
  • CO2 + H2O purity in the retentate
    p u r i t y CO 2 + H 2 O , r 95 %
  • H2 mole fraction in the retentate
    y H 2 , r 4 %
  • H2 purity in the permeate
    p u r i t y H 2 , p 44 %
The reactor designs considered in the performance assessment and the optimization problems (as the initial guess) are a 2-stage PSMR, 3-stage PSMR and a conventional MR. Reactor feed/sweep molar flow rate, composition and flow arrangement (counter-current) are kept constant across all simulations, as are all other reactor operating conditions such as temperature (constant at 300 °C), tube/shell pressure (47.63 atm/25.86 atm, respectively), mass of catalyst (20 mg), and tube/shell diameter (1.02 cm/6.12 cm, respectively). Flow arrangement was fixed as counter-current as co-current results were consistently unable to satisfy any constraint other than CO conversion; this result was observed in [2] and was verified in the co-current simulations performed as part of this study. With regard to the membrane properties, maintenance of constant temperature, and fixed permeance (and selectivity) values for the analyzed polymer material are considered. For base case performance studies, total reactor length is kept constant at 300 cm (thereby making membrane surface area a constant) for MRs, and for the PSMRs the catalyst/membrane are divided into their components and arranged in equally sized pieces such that the total length (L) of the 2/3-stage PSMRs are 600 cm—this corresponds to catalyst/membrane lengths of 150 cm per stage in the 2-stage PSMR and 100 cm per stage in the 3-stage PSMR.

2.3. Optimization Problem Formulations

The first of the two formulated optimization problems seeks to maximize reactor performance, expressed by H2 production, subject to the six performance constraints, by considering alternative catalyst/membrane placement while minimizing the total membrane surface area (Sm) required. To this end, cost parameters were associated with RH2 and Sm in accordance with the method set forth by [2]. The main difference in this analysis is the cost of the high-performance polymer membrane. The polymer membrane cost is estimated to range between $5–200/m2 depending on the membrane module platform [19], where an all polymeric hollow fiber platform typically provides the best economics, i.e., lowest cost, and a porous inorganic supported composite tubular membrane platform is typically the highest cost option. The application of robust stainless steel porous supports with weldability and correspondingly perceived lower risk for incorporation into MR configuration can further increase the cost of the resulting polymer/inorganic tubular membranes [20]. For the purposes of this work, we have chosen the highly robust tubular membrane platform as our benchmark. As such, a cost of $m = $500/m2 has been assumed as an upper bound estimate for the cost of the polymer membrane selective layer on a tubular stainless steel support (the platform utilized by [5] in their year plus evaluations of this membrane in elevated temperature separation environments).
The objective function formulated for this optimization problem is defined as:
φ = min x [ c o s t m c r e d i t H 2 ]
In which:
c r e d i t H 2 = F H 2 , p HHV H 2 $ H 2 Op
c o s t m , 2 stage   PSMR = $ m π d t ( l 2 l 1 + l 4 l 3 )
c o s t m , 3 stage   PSMR = $ m π d t ( l 2 l 1 + l 4 l 3 + l 6 l 5 )
c o s t m , MR = $ m π d t ( l 6 l 5 + l 8 l 7 + L l 9 )
where FH2,p(mol/s) is the molar flow rate of H2 in the permeate, HHVH2 (BTU/mol) is the higher heating value of H2, $H2 ($/BTU) is the monetary credit associated with the heating value, and Op is the 1-year operating period in seconds.
In particular, for the 2-stage PSMR design depicted in Figure 2, the vector of decision variables is as follows:
x 2 stage PSMR = [ l 1   l 2   l 3   l 4 ] T
Subject to the dimensional constraints on the catalyst stage lengths:
l 1 > 0 ,   l 3 l 2
and for the membrane stage lengths:
l 2 l 1 ,   l 4 l 3 ,   l 4 L
The initial guess for the 2-stage PSMR optimization problem corresponds to four equally sized stages (two catalyst, two membrane) consisting of the same membrane surface area and catalyst mass as the conventional MR, given by:
x 2 stage   PSMR , initial = [ 150   300   450   600 ] T
The vector of decision variables for the 3-stage PSMR design shown in Figure 3 is as follows:
x 3 s t a g e   P S M R = [ l 1   l 2   l 3   l 4   l 5   l 6 ] T
Subject to the dimensional constraints on the catalyst stage lengths:
l 1 > 0 ,   l 3 l 2 ,   l 5 l 4
and for the membrane stage lengths:
l 2 l 1 ,   l 4 l 3 ,   l 6 l 5 ,   l 6 L
The initial guess for the 3-stage PSMR corresponds to six equally sized stages of catalyst/membrane, using the same membrane surface area and catalyst mass as the 2-stage PSMR, is as follows:
x 3 stage PSMR , initial = [ 100   200   300   400   500   600 ] T
The vector of decision variables corresponding to the MR design presented in Figure 4 is as follows:
x MR = [ l 1   l 2   l 3   l 4   l 5   l 6   l 7   l 8   l 9 ] T
Subject to the dimensional constraints on the reaction zone:
l 1 > 0 ,   l 2 l 1 ,   l 3 l 2 ,   l 4 l 3 ,   l 4 L
and in the permeation zone:
l 5 0 ,   l 6 l 5 ,   l 7 l 6 ,   l 8 l 7 ,   l 9 l 8 ,   l 9 L
The initial guess for the MR is a conventional case in which catalyst/membrane are present along the whole axial length, the vector for which is:
x MR , initial = [ 100   100   200   200   0   100   100   200   200 ] T
A second optimization problem is formulated to verify the hypothesis that minimization of membrane surface area also corresponds to maximization of the limiting performance parameter (CCO2), using the five remaining nonlinear constraints on reactor performance with the same linear constraints as the cost optimization problem described above. The difference in this case is in the formulation of the objective function, which is defined as:
φ = min x [ C CO 2 ]
As both optimization problems possess nonlinear objective functions subject to a set of nonlinear constraints, solutions may be obtained through the MATLAB fmincon subroutine employing the “active-set” algorithm.

3. Systems Analysis Results

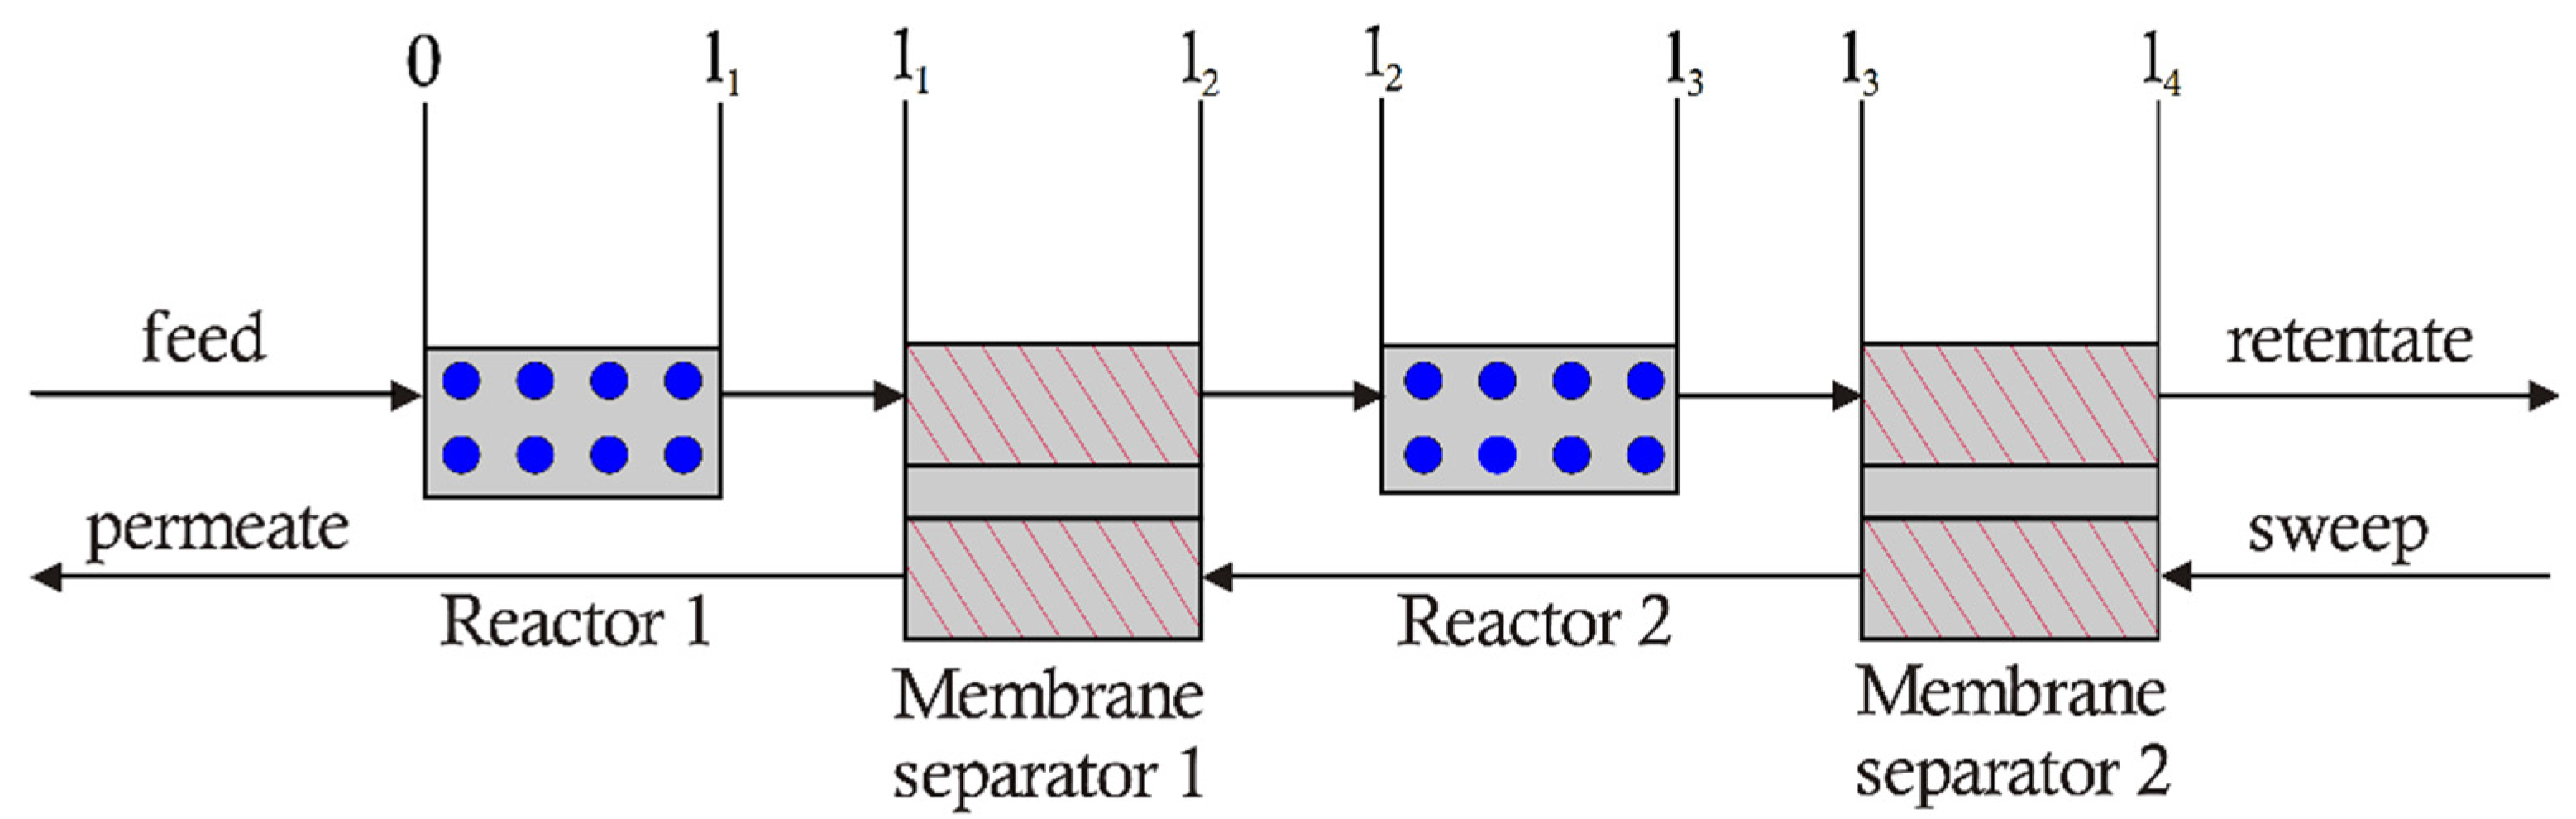
3.1. 2-Stage Permeative Stage Membrane Reactor Performance, Optimization

The performance of the high-performance polymeric membrane is first assessed as part of a 2-stage PSMR, using permeance (QH2 = 250 GPU) and H2/CO2 selectivity (αH2/CO2 = 28) values. The results of this simulation are summarized in Table 2, which employs the feed/sweep flow rate, flow composition, flow arrangement (counter-current), temperature and pressure conditions as defined above. The placement of catalyst/membrane correspond to x 2 stage PSMR , initial or the base case design.
Thus, two stages for this base case satisfies all but carbon capture and H2 purity constraints for this reactor configuration. Also through simulations, the limiting membrane characteristic for these performance parameters is identified as the H2/CO2 selectivity (though reduction to total membrane surface area improves carbon capture, sufficient reductions cannot be performed should one desire to satisfy the remaining five performance constraints). Thus, an incremental variation of H2/CO2 selectivity is performed for the range of α = 25–75 with the objective of determining the minimum H2/CO2 selectivity that would satisfy the carbon capture and permeate hydrogen purity constraints in an optimized (minimum membrane surface area) 2-stage PSMR. Utilizing an α increment of 5, eleven optimization problems were formulated and solved using the technique described above. Designs employing values of αH2/CO2 greater than 30 satisfy all but the carbon capture constraint; the first design to satisfy all six constraints in a 2-stage PSMR falls within the range αH2/CO2 = 60–65, and occurs at a H2/CO2 selectivity value of approximately 62. As the solutions represent a maximization of carbon capture attainable in a 2-stage PSMR, while satisfying the other five performance constraints, the results may be used to determine the minimum H2/CO2 selectivity needed to satisfy a given carbon capture constraint. The carbon capture resulting from varying selectivity on the range of 25–75 in an optimized 2-stage PSMR employing the minimum membrane area is shown in Figure 5.
The solution vector for the case corresponding to αH2/CO2 = 60 is shown below; this case is closest to satisfying CCO2 ≥ 0.90 in the 2-stage PSMR.
x 2 stage   PSMR , final , α H 2 CO 2 = 60 = [ 156.28   295.85   454.85   579.93 ] T
Upon examination of the optimization results representing a minimization of membrane surface area, a pattern is noted in the optimal 2-stage PSMR catalyst/membrane placement. In each design, there is an approximately equal distribution of catalyst mass across the two stages; the membrane stages are unevenly distributed, with the first membrane stage slightly larger than the second for all cases. The membrane placement likely results from the relatively high partial pressure of H2 in the stream exiting the first reactor stage (see Figure 6), thus, placement of more membrane directly after the first reactor allows for greater utilization of the permeation driving force and consequently greater H2 recovery in this region (relative to the second membrane separator stage). Figure 7 shows the profiles for the H2 reaction and diffusion rates as function of axial axis for this optimized 2-stage PSMR.

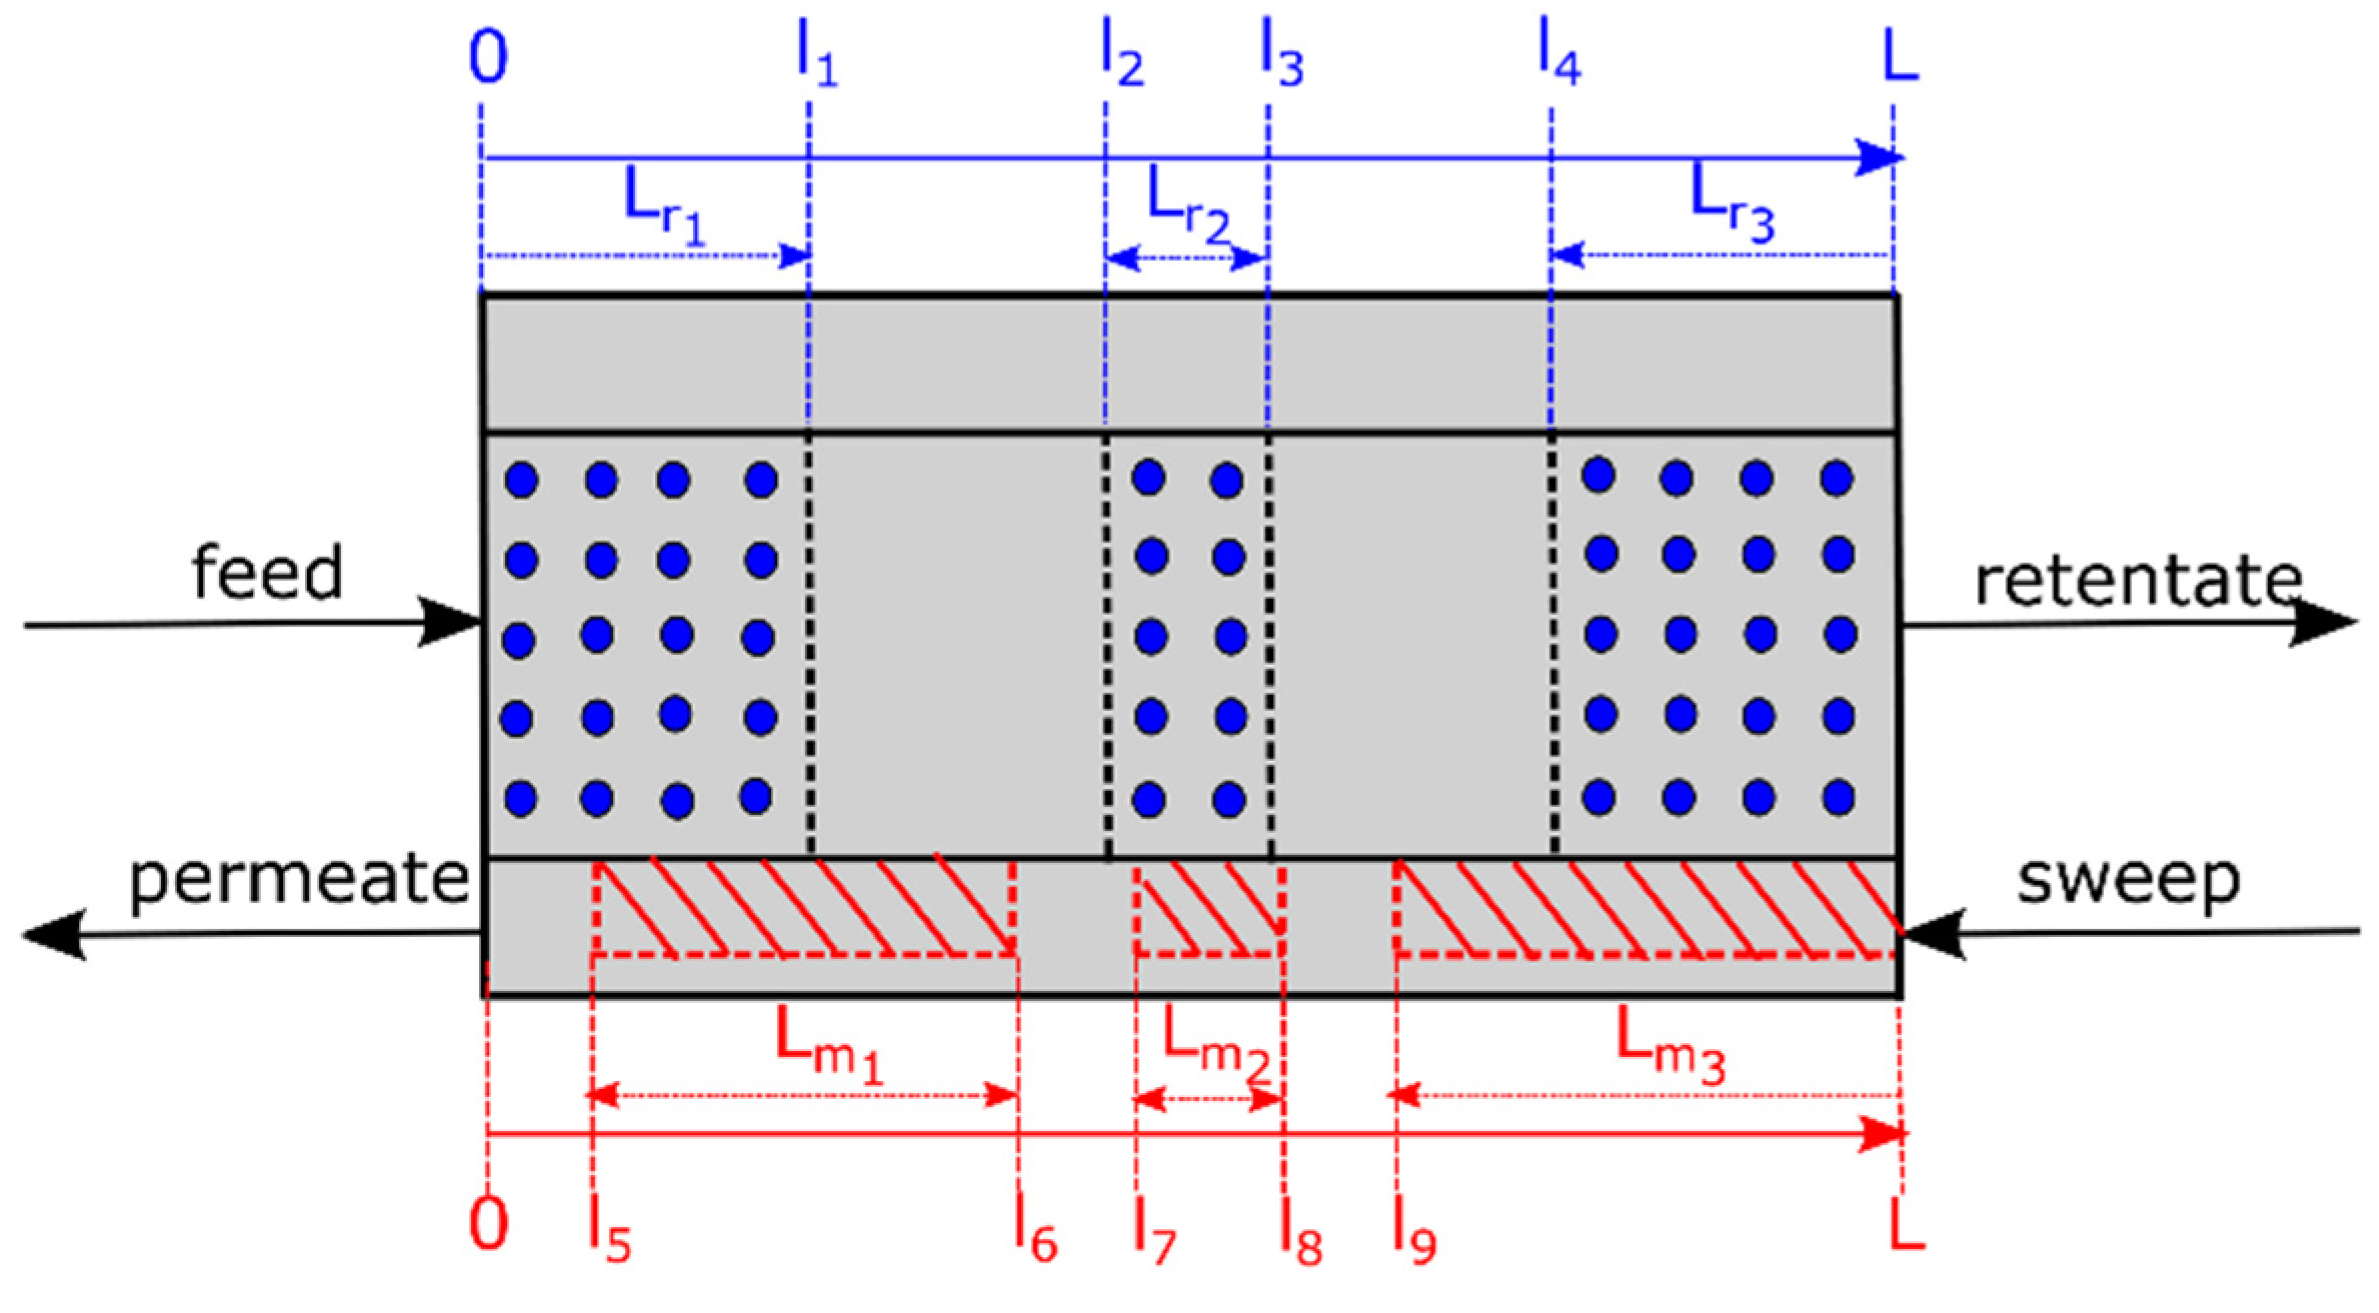
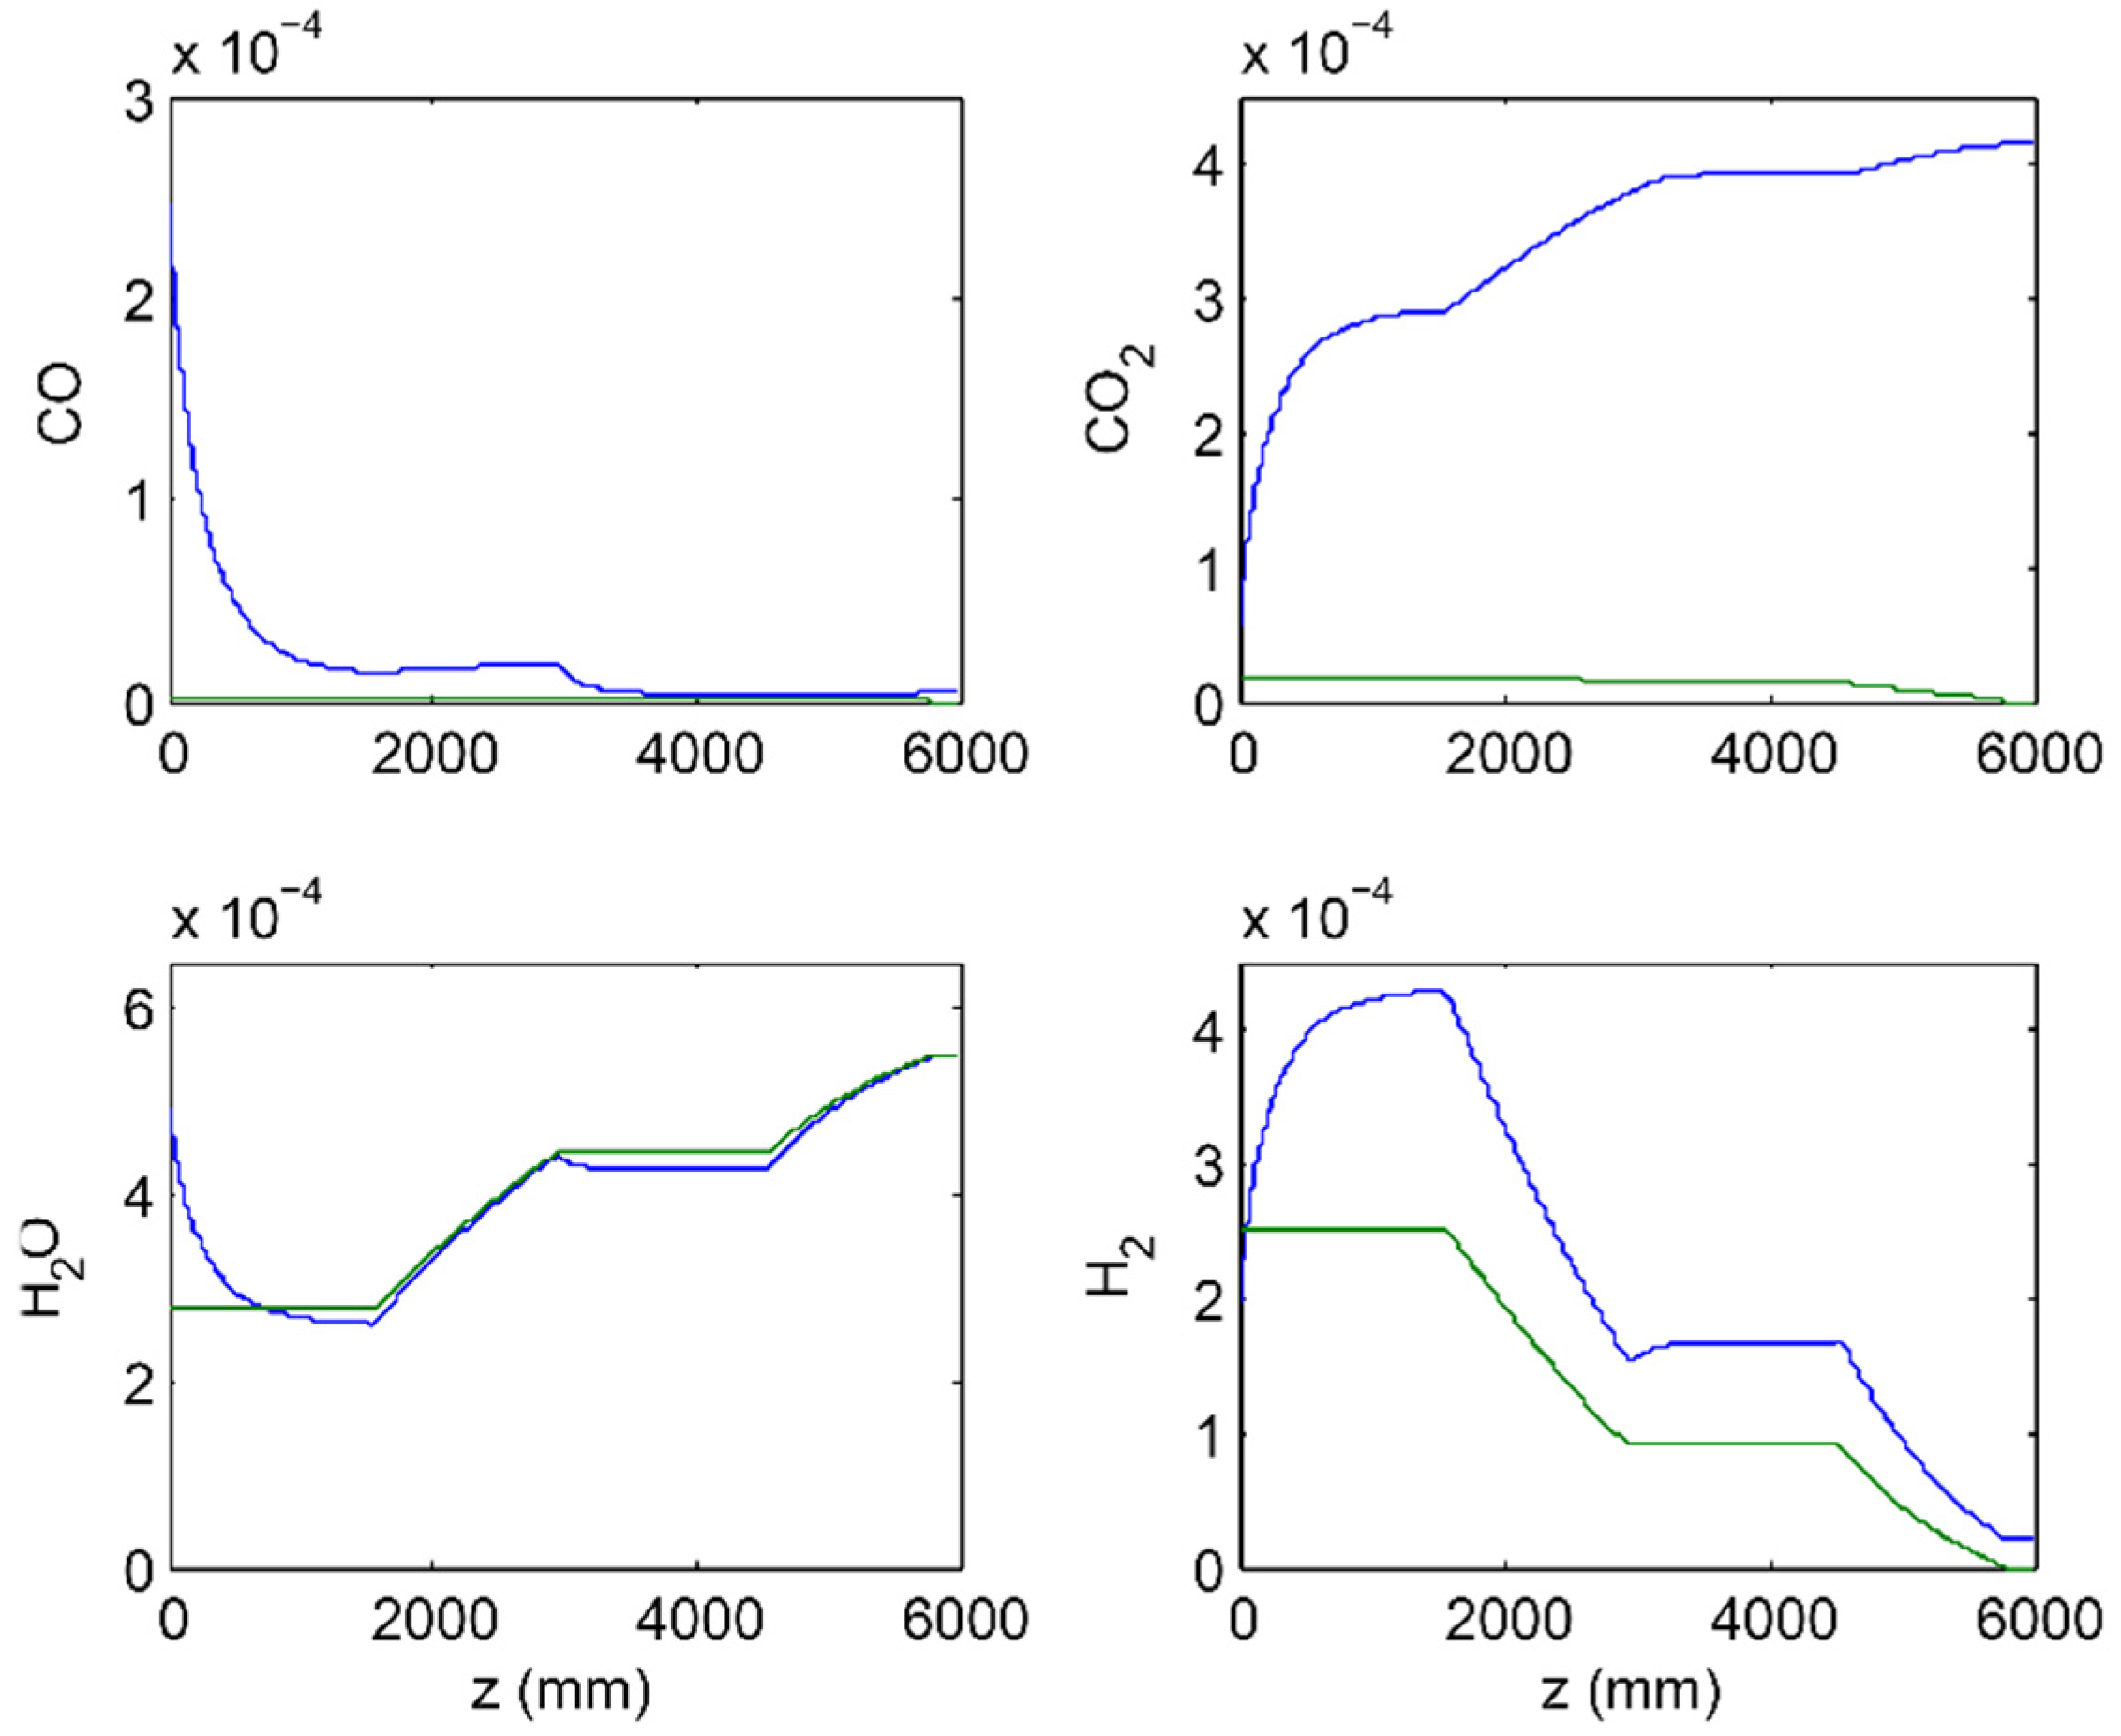
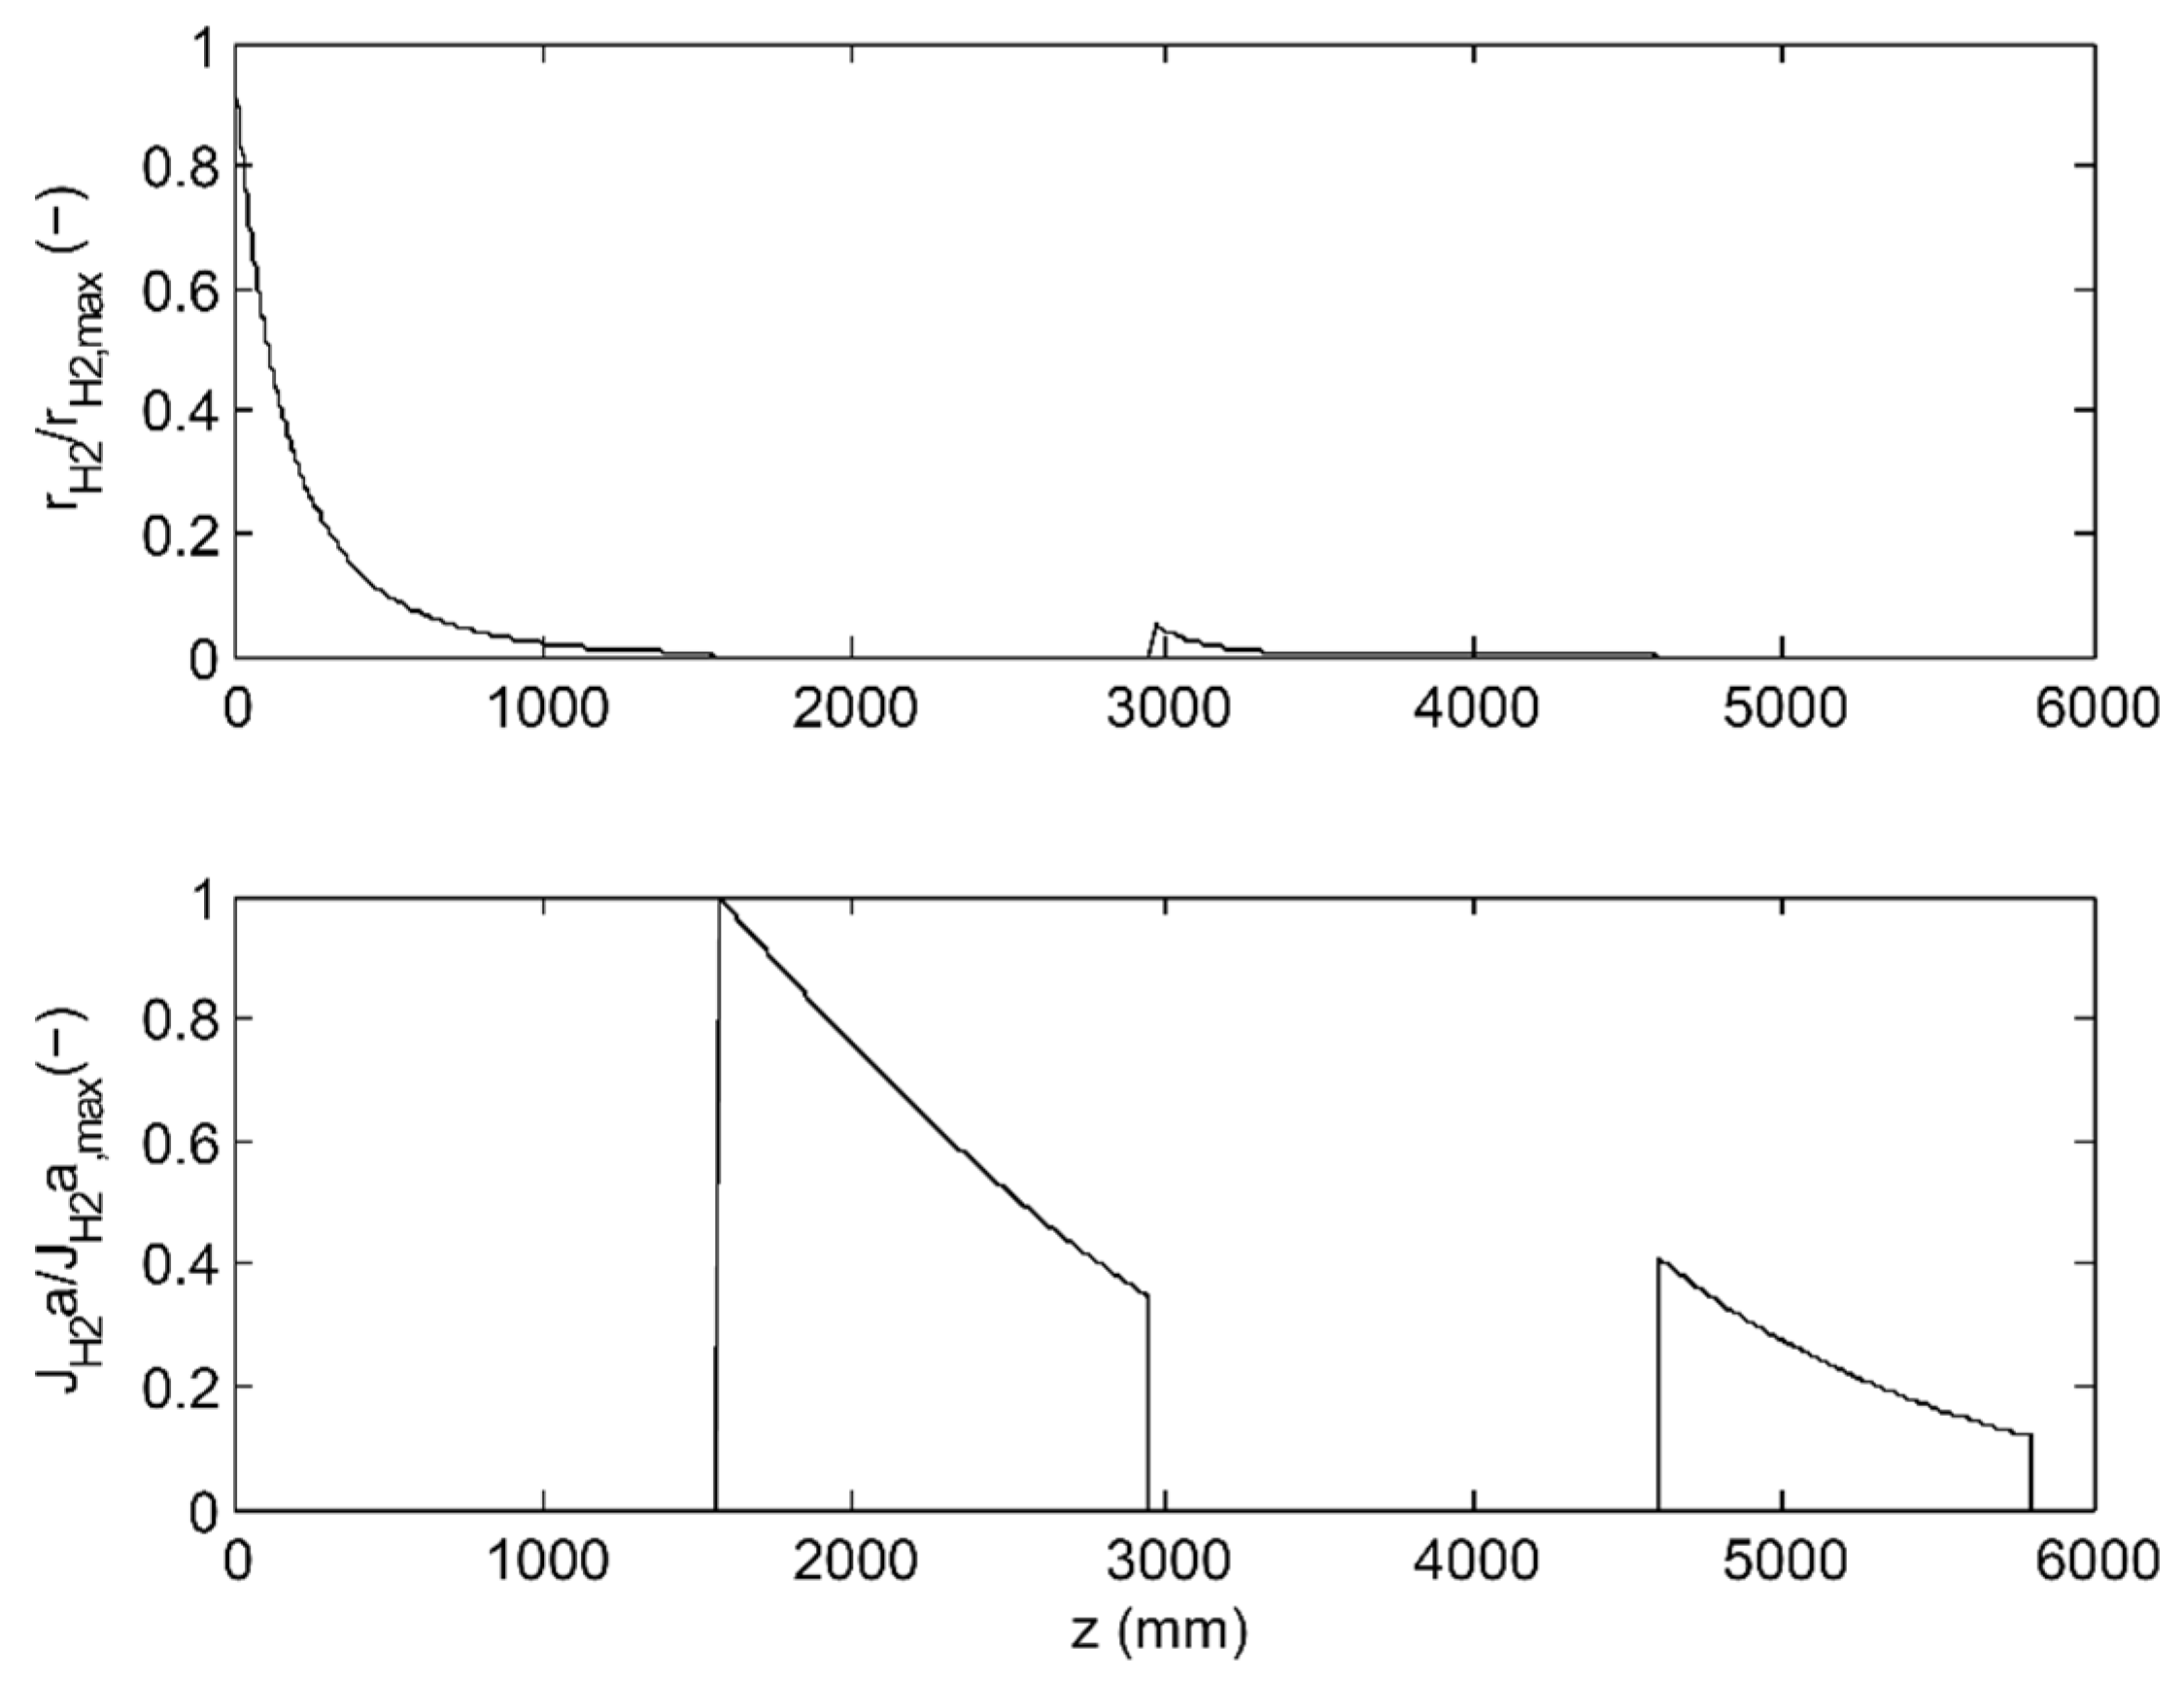
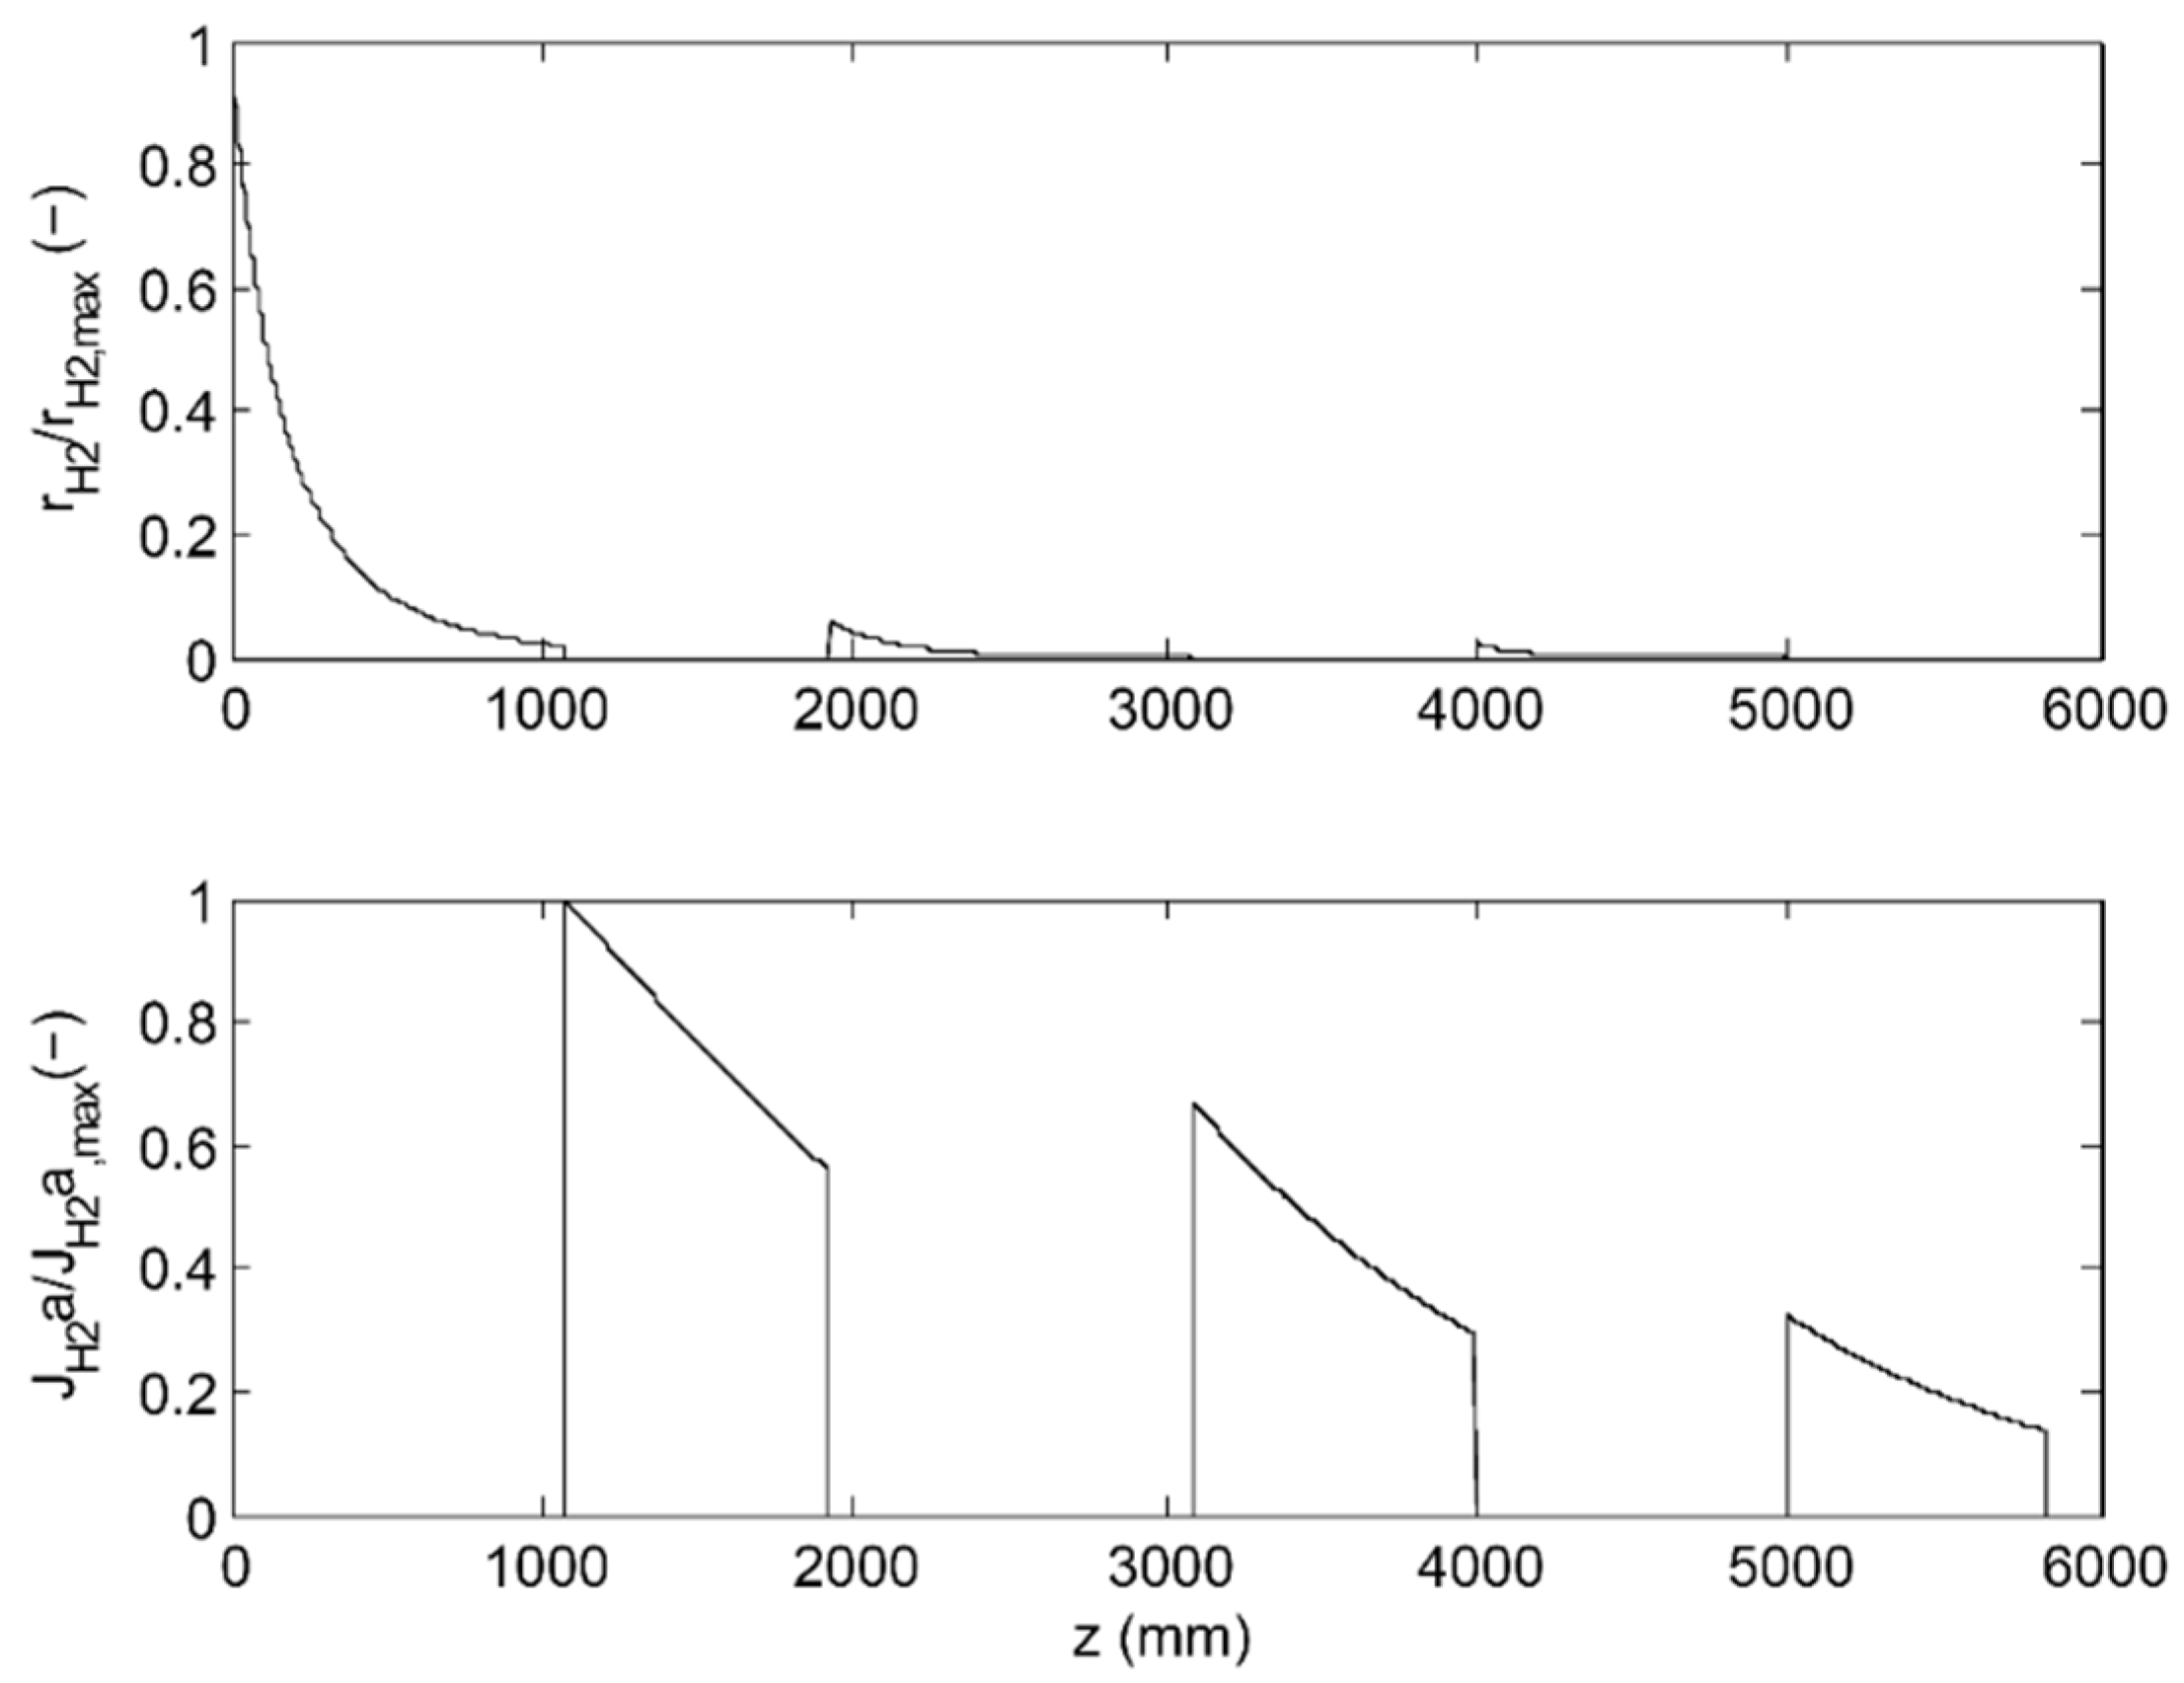
3.2. 3-Stage Permeative Stage Membrane Reactor Performance, Optimization

The performance of the polymeric membrane is assessed next as a 3-stage PSMR, using QH2 = 250 GPU, and αH2/CO2 = 28 once again as base case. The results of this simulation, which uses precisely the same process conditions as the 2-stage PSMR, are summarized in Table 3; the placement of catalyst/membrane in the 3-stage PSMR correspond to x 3 s t a g e   P S M R , i n i t i a l .
Once more, given the membrane properties, the material did not to satisfy the carbon capture/permeate hydrogen purity constraint while satisfying the other four performance constraints. Similar to the previous case, an incremental variation of H2/CO2 selectivity was performed for the range of α = 25–75 so as to determine the minimum H2/CO2 selectivity that would satisfy the carbon capture and permeate hydrogen purity constraints in an optimized 3-stage PSMR. These simulations indicate that designs employing H2/CO2 selectivity values greater than 30 satisfy all but the carbon capture constraint, with the first design satisfying all six constraints falling in the αH2/CO2 range of 60–65 with the minimum H2/CO2 selectivity that satisfies all constraints of approximately 61. The carbon capture resulting from varying selectivity on the range of 25–75 in an optimized 3-stage PSMR employing the minimum membrane area is shown in Figure 8, along with the previously obtained result for the 2-stage reactor.
The solution vector for the case corresponding to αH2/CO2 = 60 is shown below; this case is closest to satisfying CCO2 ≥ 0.90 in the 3-stage PSMR.
x 3 stage   PSMR , final , α H 2 CO 2 = 60 = [ 107.26   192.26   309.39   399.86   499.83   583.20 ] T
From the optimization results corresponding to a minimization of membrane area for the given range of selectivity, the designs conformed to a general pattern (as viewed from left to right in Figure 3): an uneven catalyst distribution that preferentially placed the most catalyst in the second reactor stage, and slightly more catalyst in the first reactor stage than the third reactor stage (in this case differences in catalyst amount corresponded to less than 10% of the total catalyst mass). As for the membrane area placement, a pattern was also observed across the range of selectivity values in which more membrane was utilized in the second stage than the first/third stages; however, the difference in total membrane area between each stage was small (the second membrane separator stage utilized 5%–15% more membrane than the first/third stages). The difference in membrane placement is likely due to the relatively large difference in partial pressure presented in the second membrane stage (see Figure 9); at this point, the sweep gas has a relatively low H2 mole fraction while the reactor stream has a relatively larger H2 mole fraction (having passed over approximately ⅔ of the total catalyst mass (two reactor stages), but only one membrane separator stage). When comparing the performance of the 2-stage PSMR to that of the 3-stage PSMR, it is worth noting that the use of three reaction/permeation stages allowed for increased CO conversion and H2 recovery by relieving equilibrium limitations on the WGS reaction (the first membrane separator is implemented after the reactor feed sees approximately ⅓ of the total catalyst, rather than ½ the total catalyst as in the 2-stage PSMR). Additionally, the 3-stage design permitted increases to carbon capture through more efficient membrane utilization (optimized 3-stage PSMRs employed slightly less membrane area than optimized 2-stage PSMRs). Figure 10 depicts the profiles for the H2 reaction and diffusion rates as function of axial axis for this optimized 3-stage PSMR.

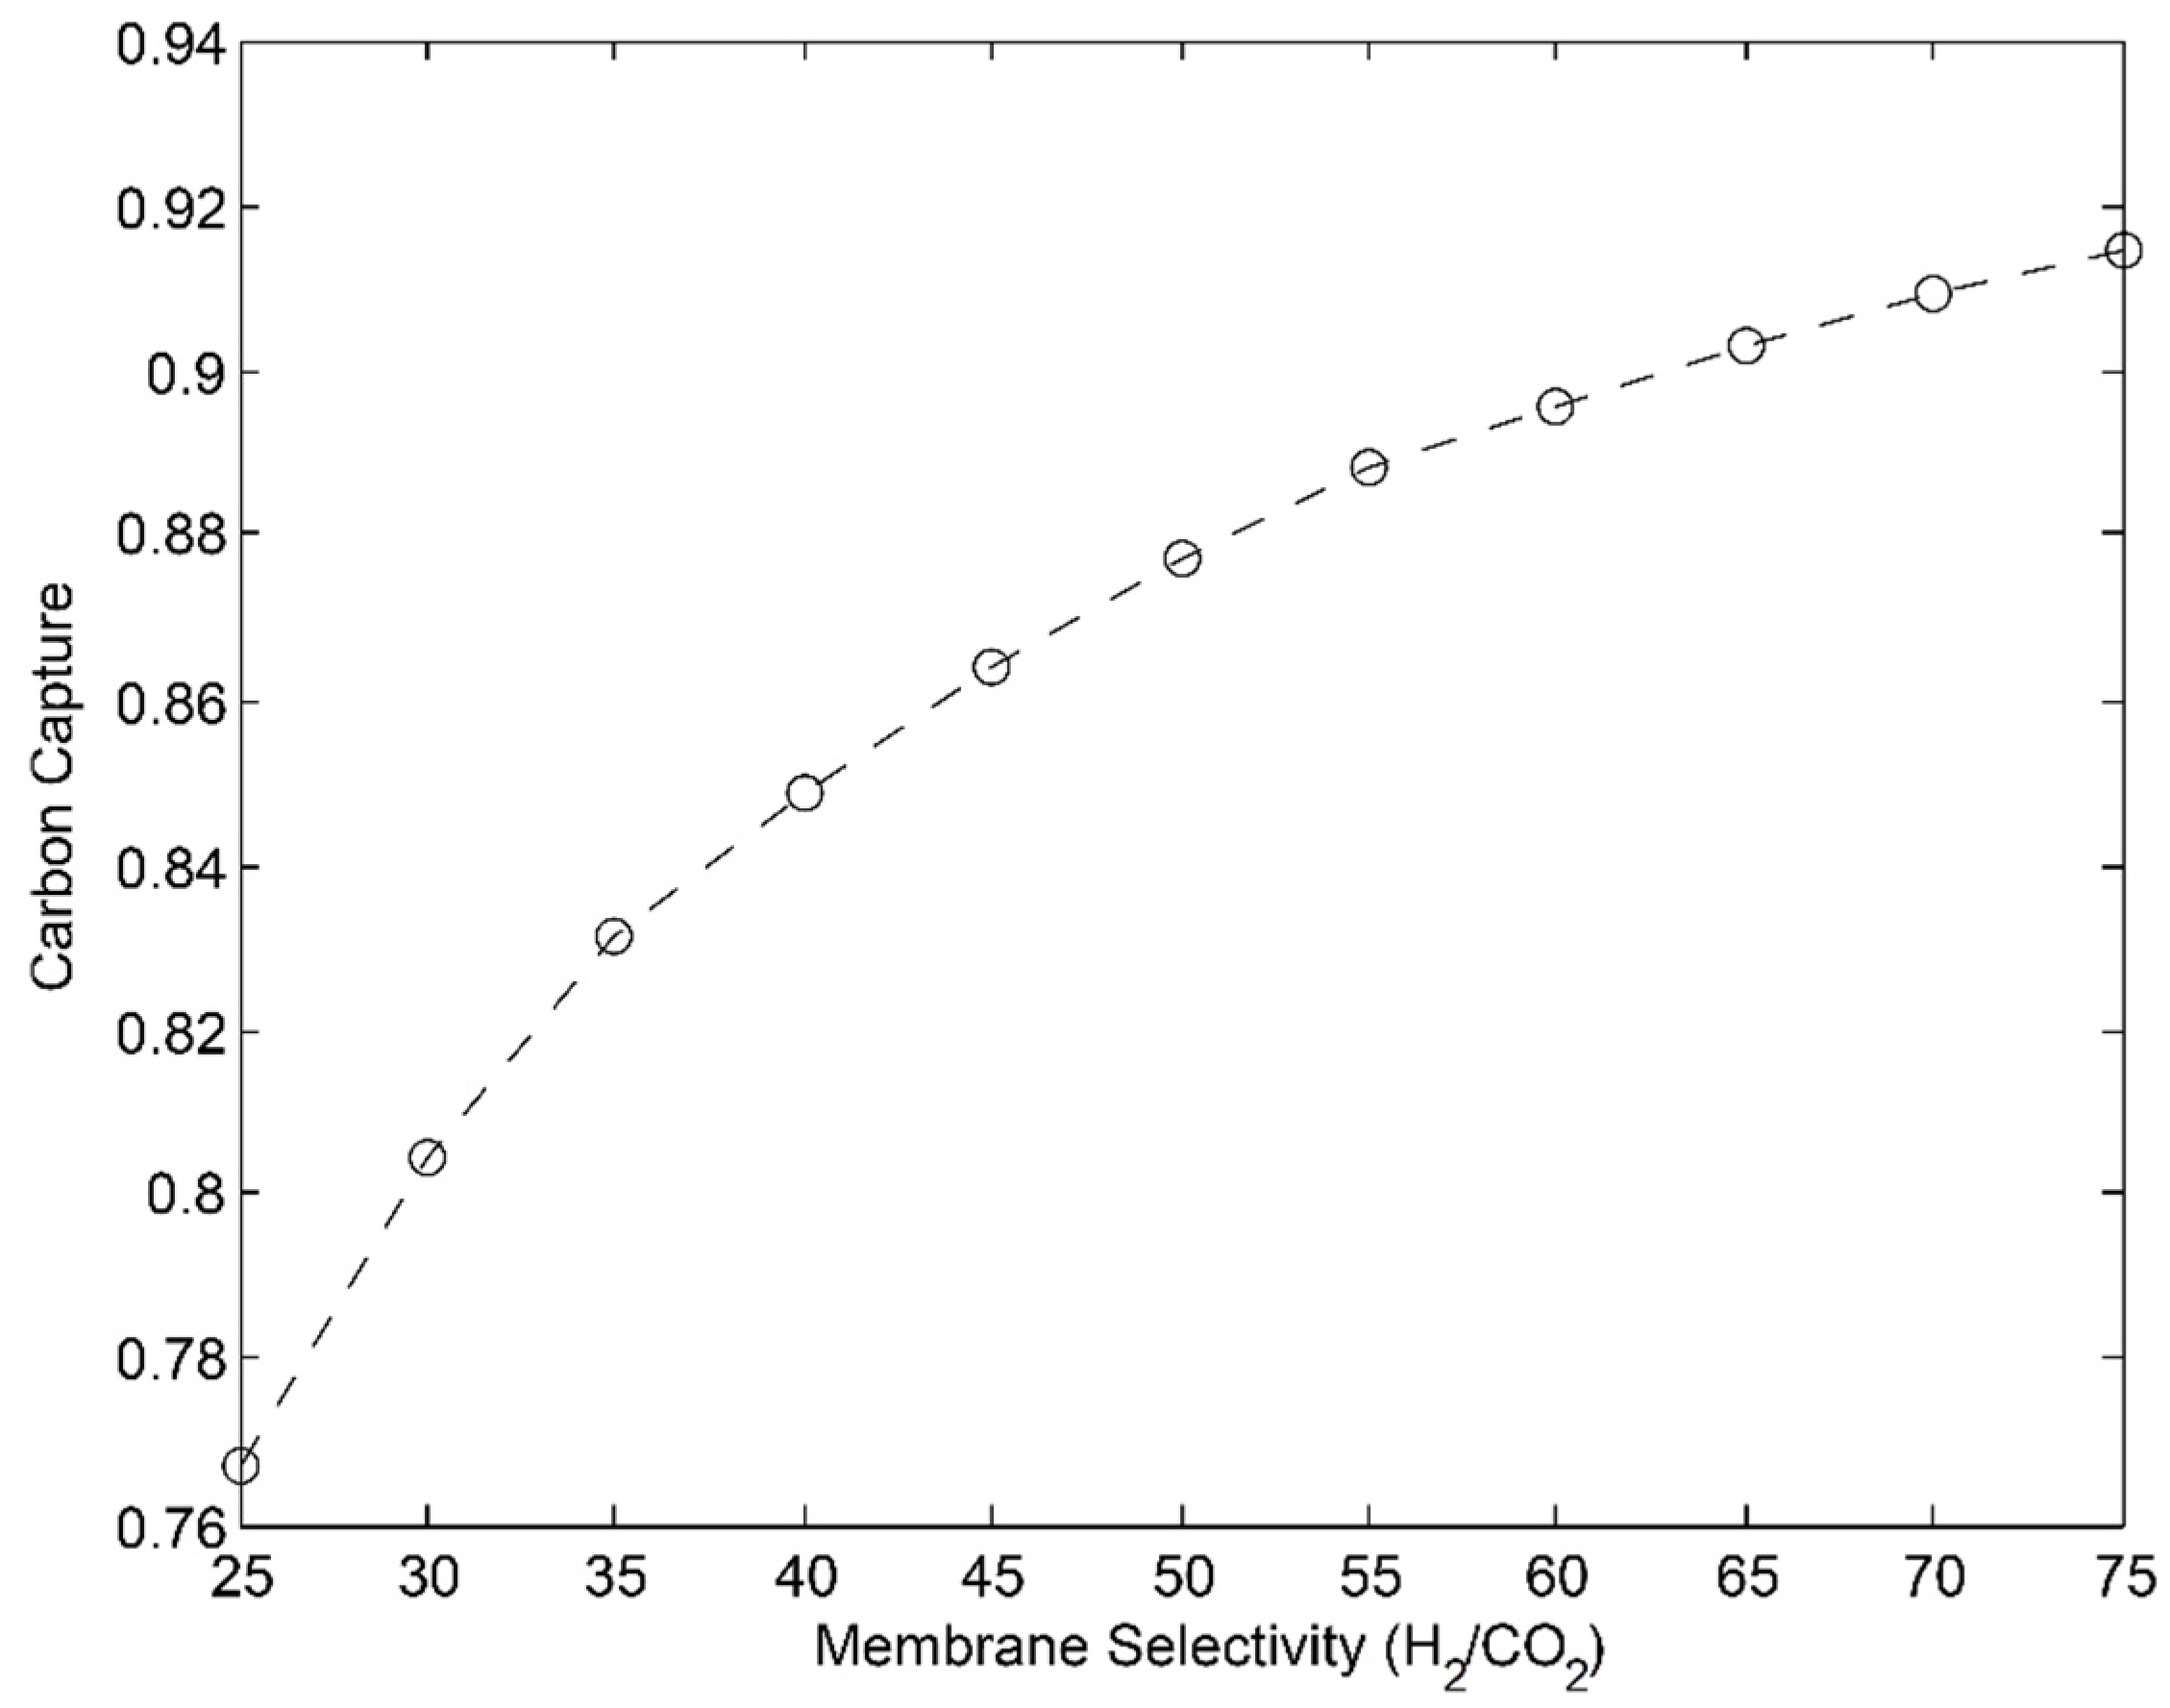
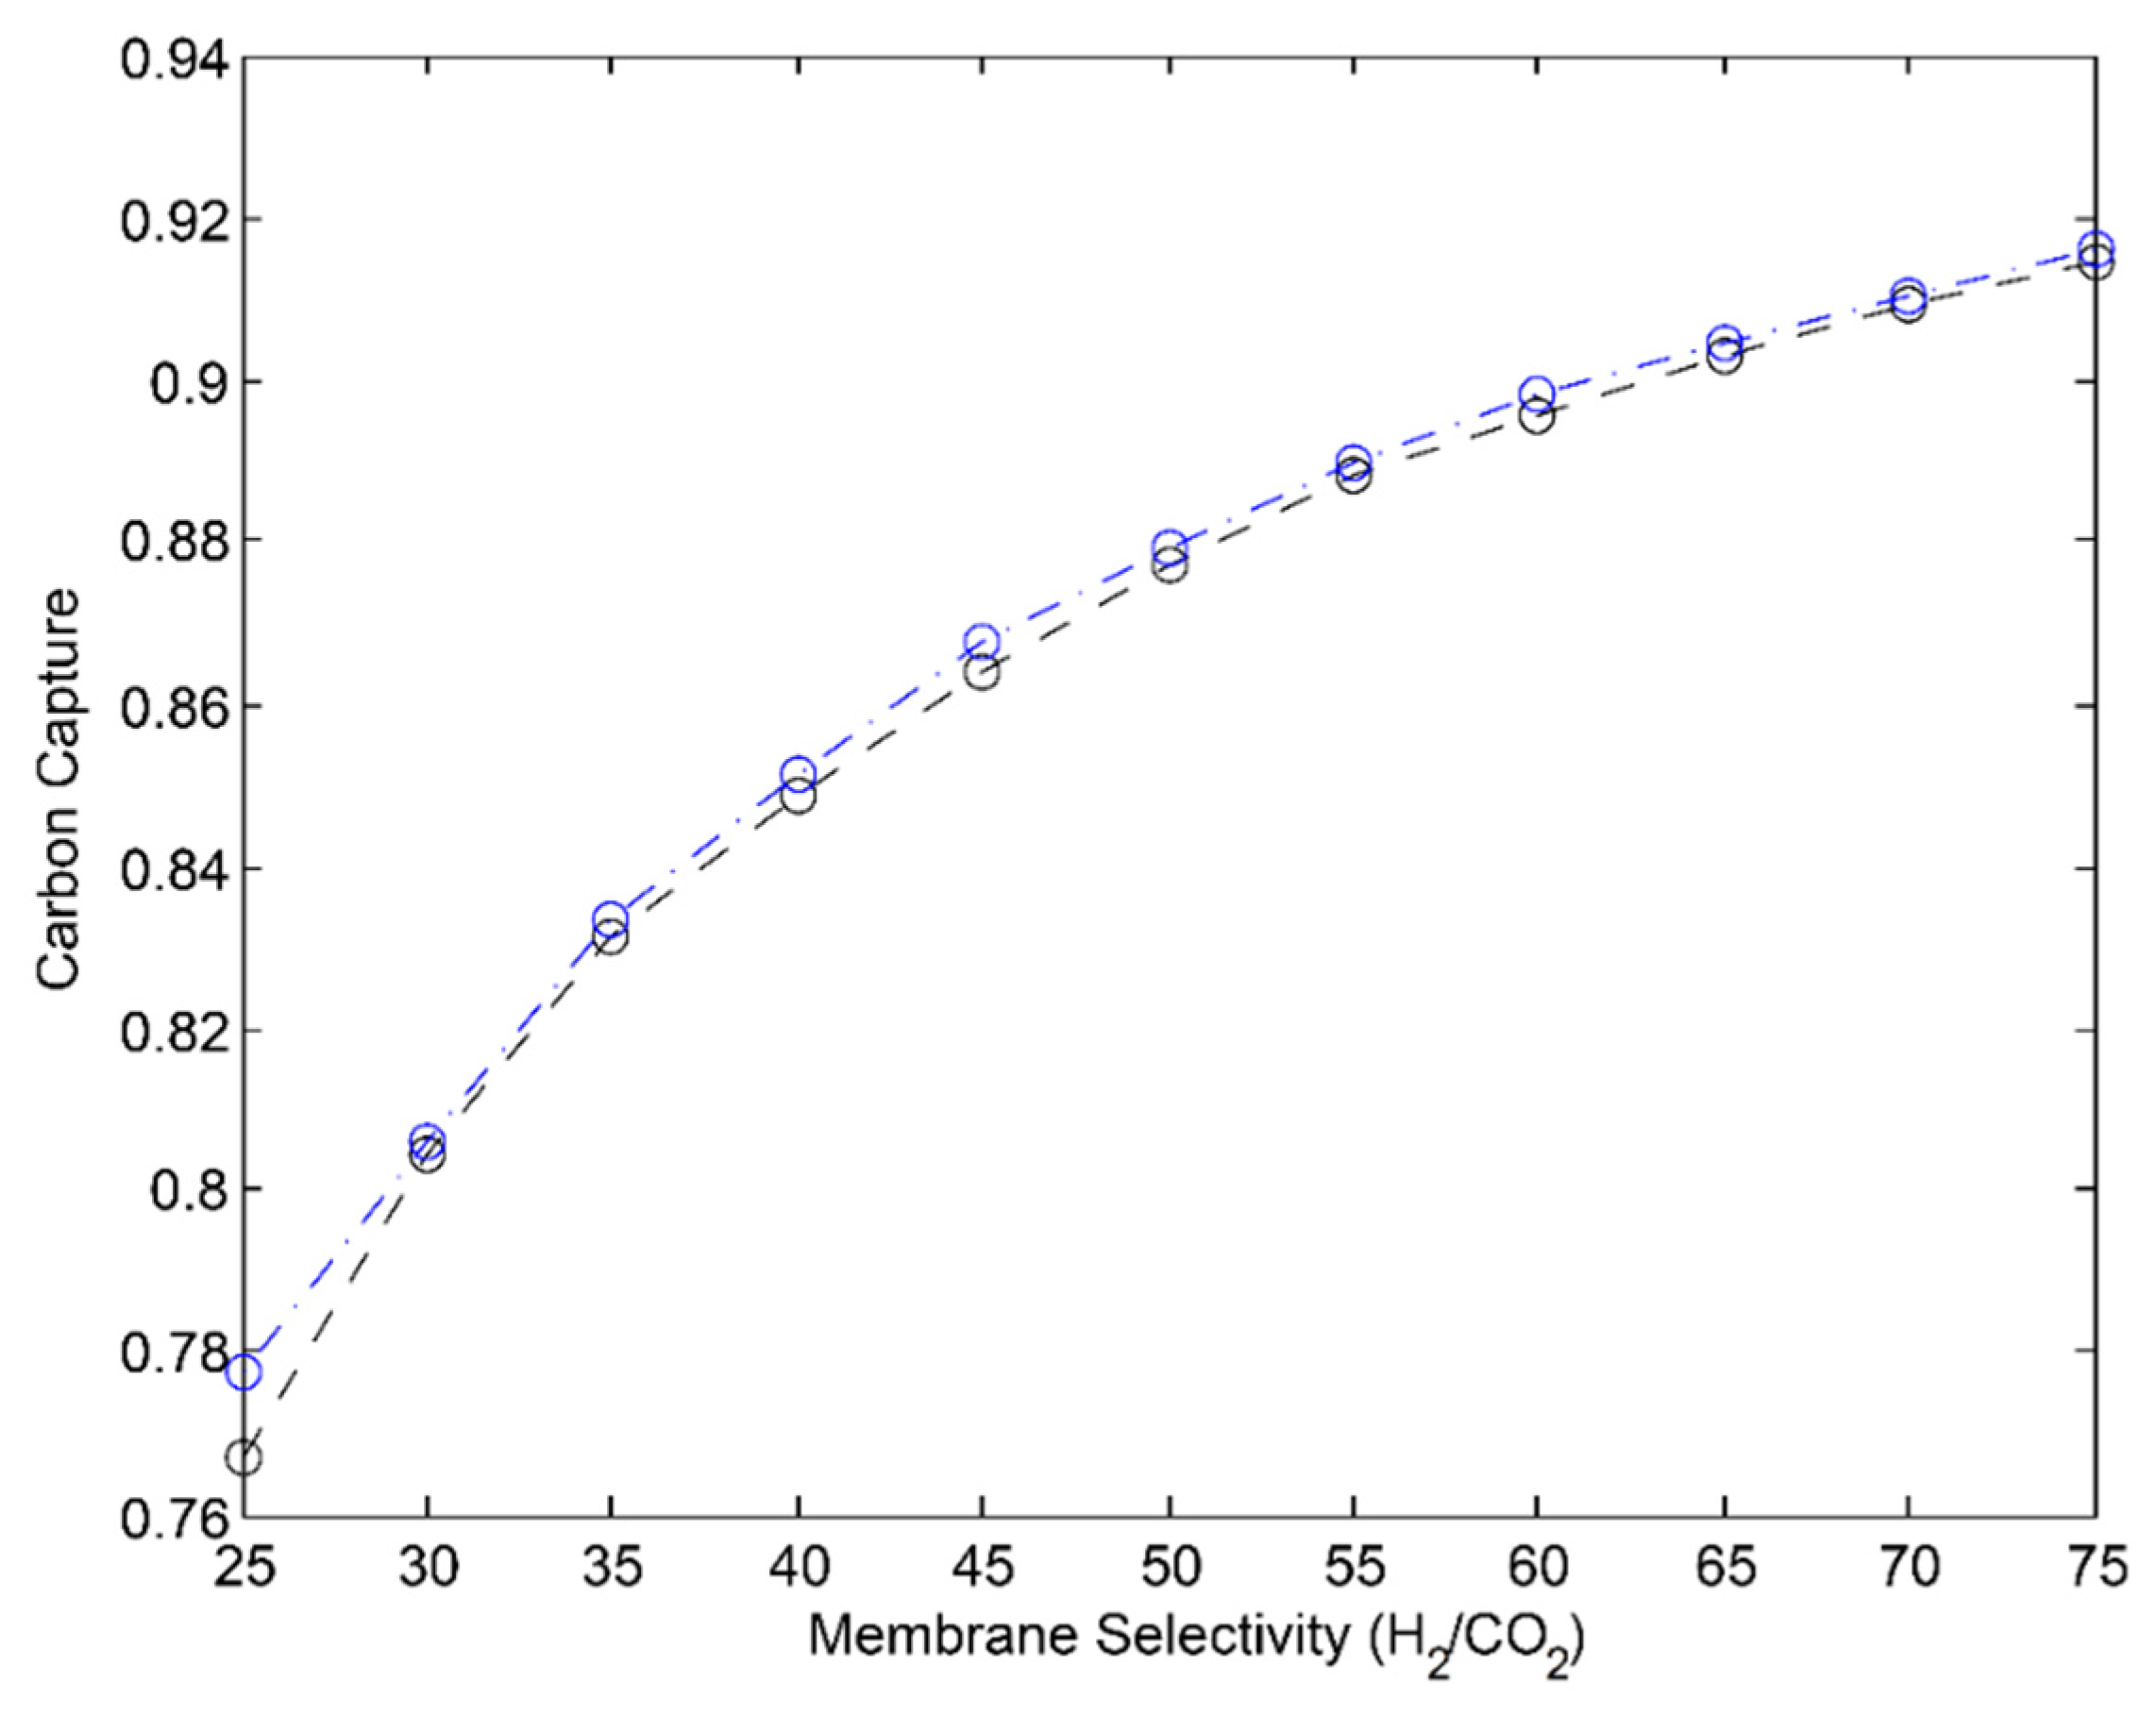
3.3. Membrane Reactor Performance, Optimization

Finally, the performance of the polymeric membrane (QH2 = 250 GPU, αH2/CO2 = 28) is assessed as a traditional membrane reactor. The results of this simulation, which uses the same process conditions as the 2,3-stage PSMRs, are summarized in Table 4; the reactor design is that of a conventional MR, which corresponds to x M R , i n i t i a l .
Noting that the material did not satisfy the carbon capture and hydrogen purity constraints, the same procedure outlined above for the 2-stage and 3-stage PSMRs was performed for the MR; that is: incremental variation of H2/CO2 selectivity was performed for the range of α = 25–75 so as to determine the minimum H2/CO2 selectivity that would satisfy the carbon capture and permeate hydrogen purity constraints in an optimized MR. All values of αH2/CO2 greater than 30 satisfied the permeate hydrogen purity constraint, and the carbon capture constraint is satisfied in the range of αH2/CO2 = 60–65, occurring at a value of approximately 61. The carbon capture resulting from varying selectivity on the range of 25–75 in an optimized MR utilizing the minimum membrane area is shown in Figure 11.
As for the arrangement of the membrane about the axial axis of the reactor, the optimal solutions (representing a minimization of membrane surface area) were all of the same general form as shown in Figure 12 The cause for variation in total membrane surface area was due to differences in selectivity, with lower values of αH2/CO2 allowing for dilution of the permeate with CO2, which improved H2 recovery by lowering H2 partial pressure in the shell.
The solution vector for the case corresponding to αH2/CO2 = 60 is shown below; this case is closest to satisfying CCO2 ≥ 0.90 in the MR (see Figure 13 for concentration profiles and Figure 14 for reaction/diffusion rate profiles associated with this case).
x MR , final , α H 2 CO 2 = 60 = [ 98.43   98.43   142.53   257.30   15.22   90.54   96.88   185.21   200.20 ] T
Each optimal design consisted of a short pre-shift zone lacking membrane; following the pre-shift zone, a region resembling a conventional MR exists until approximately 150 cm. From 150 cm to 250 cm, catalyst is absent and only membrane is placed so as to remove the reaction H2 product from the tube side (though, there is a small section of membrane removed between 180 and 200 cm). From 250 cm to 300 cm, the design is once more that of the conventional MR, indicating that further CO conversion is best achieved after removal of a significant portion of the reaction products. The resulting design can be explained by the more efficient membrane area utilization resulting from increased H2 partial pressure in the tube side achieved through use of a pre-shift followed by a conventional MR. In essence, the use of the combined pre-shift zone and conventional MR increases H2 partial pressure in the reaction side, but as products build up the thermodynamic limitation associated with the WGS is increases. At this point, membrane is added to remove products and alleviate this limitation. Following the pre-shift zone in which product concentration is not sufficiently high, nearly continuous removal of product through the membrane permits increased CO conversion with respect to the staged reactors.
The optimized MRs exhibited slightly higher CO conversions than were obtained in the 2,3-stage PSMRs, as well as attained slightly higher H2 recovery values; these results for αH2/CO2 = 60 are summarized in Table 5.
The increase in CO conversion is due to the continuous removal of products (CO2, H2) in portions of the MR, which constitutively relieves equilibrium limitations on the WGS reaction; the increase in H2 recovery is due to the higher H2 partial pressure differences between reactor/sweep streams achieved through selective placement of membrane in a reactor in which reaction/diffusion occur simultaneously. With regard to carbon capture, the MR achieves higher values at lower selectivity (αH2/CO2 ≤ 50) due to lower CO2 partial pressure differences between the tube/shell (a positive factor for carbon capture, but this works against the operator for H2 recovery); at higher values of selectivity, the 3-stage PSMR and MR produce nearly the same values for carbon capture, with the MR exceeding the 3-stage PSMR for αH2/CO2 = 55–75 by a very small margin.
From the 2-stage and 3-stage results, improved performance is the result of increasing the stage number, which allows for implementation of membrane stages at increased H2 partial pressures (see Figure 6 vs. Figure 9 and Figure 7 vs. Figure 10 for such configurations) As the stage number increases dramatically to the point at which the number of stages bring the reactor design to the limiting case (infinitesimally small stage lengths), the design equation associated with plug-flow becomes that associated with a continuous-flow stirred tank reactor (CSTR). As each stage operates as a CSTR and an infinite sequence of algebraic stages (infinite stage number reactor) may be taken to represent the differential reactor (the MR), large stage numbers cause the PSMR design to approach that of the MR, where the MR represents the maximum achievable performance for a given set of conditions. The trend for increasing stage number in PSMRs leading to operation resembling that of an MR is present as early as 2/3 stages for the case considered herein (Figure 8 and Figure 11); four or more stages should yield results that increasingly resemble the MR. The ratio of reaction to diffusion rate in the membrane reactor configuration (see Figure 14) suggests that for cases in which minimization of membrane area is desired at fixed catalyst mass, more densely packing the catalyst (compared to spreading the fixed mass across the entire reactor length, as in the base case) can achieve this aim, provided temperature limitations are not present; alternatively for cases in which there is unlimited catalyst, dense packing throughout the entire reactor may serve to improve reactor performance.
In general, the supported tubular membrane platform benchmarked here is a desirable platform for the MR configuration as it allows efficient catalyst packing and the mechanical strength required to contain catalyst material. However, based on the results of this study, the performance of an optimized 3-staged PSMR can be comparable to that of a MR. This result presents an exciting opportunity for lower cost high performance hollow fiber membranes in this application. Given the high surface area to volume ratio of hollow fiber membrane modules and their resulting dramatically reduced containment vessel/module size, their cost per m2 is estimated to be an order of magnitude lower than the tubular platform benchmarked here. As the optimization results presented here are sensitive to membrane cost, the influence of such membrane cost reduction opportunities on the process optimization will be explored in future studies.

4. Conclusions

One-dimensional isothermal models were developed for traditional MRs and PSMRs, and used to assess high-performance polymeric membrane reactor systems. Constrained cost optimization problems were formulated so as to systematically determine optimal reactor designs through more efficient membrane placement. As the solutions to these optimization problems also corresponded to a maximization of the limiting performance parameter, C CO 2 , an incremental search of H2/CO2 selectivity was then performed with the intent of determining C CO 2 as a function of αH2/CO2 at constant permeance. These designs were generated through the cost minimization optimization problem and the result that the economic optimum corresponds to maximization of carbon capture was verified by way of the second optimization problem formulation (utilizing identical decision variables), which sought to maximize C CO 2 subject to the other five performance constraints. This analysis was successfully completed for the three reactor designs considered (2-stage PSMR, 3-stage PSMR, MR). Graphs of carbon capture as a function of selectivity for fixed conditions were produced, which can guide the development of polymeric membrane materials to achieve all the desired specifications for their implementation in IGCC WGS environments.
Using the unit design framework considered herein, one may generalize from the process conditions of feed/sweep molar flow rate, flow composition/arrangement, reactor operating conditions (temperature, pressure), catalyst mass, tube dimensions and membrane properties to grant insight into future membrane material development by identifying the limiting parameter and determining a minimum value that satisfies all imposed constraints. Having identified a minimum value for a given parameter (αH2/CO2 in this case), a clear goal can be set for researchers in material development (should it be desired to use the process designs considered here). As the optimization results presented here are sensitive to membrane cost, it is desirable to investigate membranes with varied cost (i.e., hollow fibers) to further understand the resulting outcomes in terms of required performance characteristics and optimized PSMR design. To that end, the presented modeling framework can be extended to evaluate performance of membrane materials in a systematic manner by considering several process designs in which material placement (catalyst, membrane) is guided by economic considerations and/or satisfaction of a set of performance constraints. The formulated optimization problem can also be extended to consider different operating conditions (temperature, pressure) for each reaction/separation module.

Acknowledgments

The authors (Andrew J. Radcliffe and Fernando V. Lima) would like to acknowledge West Virginia University for their financial assistance on this work. The authors (Rajinder P. Singh and Kathryn A. Berchtold) gratefully acknowledge the U.S. DOE/NETL-Strategic Center for Coal: Carbon Capture Program for financial support of the project under contract LANL-FE-308-13. Los Alamos National Laboratory is operated by Los Alamos National Security, LLC for DOE/NNSA under Contract DE-AC52-06NA25396. Additionally, the authors would like to thank Juan Carlos Carrasco for his assistance on illustrations.

Author Contributions

This paper is a collaborative work among the authors. A.J.R. performed all simulations and wrote the paper. F.V.L. helped with the paper writing and supervised all the technical aspects of the work. R.P.S. and K.A.B. assisted in manuscript preparation and provided technical guidance for the performed work.

Conflicts of Interest

The authors declare no conflict of interest.

References

  1. Marbán, G.; Valdés-Solís, T. Towards the hydrogen economy? Int. J. Hydrogen Energy 2007, 32, 1625–1637. [Google Scholar] [CrossRef]
  2. Lima, F.V.; Daoutidis, P.; Tsapatsis, M.; Marano, J.J. Modeling and optimization of membrane reactors for carbon capture in integrated gasification combined cycle units. Ind. Eng. Chem. Res. 2012, 51, 5480–5489. [Google Scholar] [CrossRef]
  3. Woods, M.C.; Capicotto, P.J.; Haslbeck, J.L.; Kuehn, N.J.; Matuszewski, M.; Pinkerton, L.L.; Rutkowski, M.D.; Schoff, R.L.; Vaysman, V. Cost and Performance Baseline for Fossil Energy Plants. Volume 1: Bituminous Coal and Natural Gas to Electricity; Final Report, Technical Report Revision 1, DOE/NETL-2007/1281; U.S. Department of Energy: Washington, DC, USA, 2007.
  4. Lima, F.V.; Daoutidis, P.; Tsapatsis, M. Modeling, optimization, and cost analysis of an IGCC plant with a membrane reactor for carbon capture. AIChE J. 2016. [Google Scholar] [CrossRef]
  5. Berchtold, K.A.; Singh, R.P.; Young, J.S.; Dudeck, K.W. Polybenzimidazole composite membranes for high temperature synthesis gas separations. J. Membr. Sci. 2012, 415–416, 265–270. [Google Scholar] [CrossRef]
  6. Singh, R.P.; Berchtold, K.A. Chapter 6—H2 Selective Membranes for Precombustion Carbon Capture. In Novel Materials for Carbon Dioxide Mitigation Technology; Morreale, F.S., Ed.; Elsevier: Amsterdam, The Netherlands, 2015; pp. 177–206. [Google Scholar]
  7. Li, X.; Singh, R.P.; Dudeck, K.W.; Berchtold, K.A.; Benicewicz, B.C. Influence of polybenzimidazole main chain structure on H2/CO2 separation at elevated temperatures. J. Membr. Sci. 2014, 461, 59–68. [Google Scholar] [CrossRef]
  8. Zou, J.; Ho, W.S.W. Hydrogen purification for fuel cells by carbon dioxide removal membrane followed by water gas shift reaction. J. Chem. Eng. Japan 2007, 40, 1011–1020. [Google Scholar] [CrossRef]
  9. Huang, J.; El-Azzami, L.; Ho, W.S.W. Modeling of CO2-selective water-gas-shift membrane reactor for fuel cell. J. Membr. Sci. 2005, 261, 67–75. [Google Scholar] [CrossRef]
  10. Singh, R.P.; Dahe, G.J.; Dudeck, K.W.; Welch, C.F.; Berchtold, K.A. High temperature polybenzimidazole hollow fiber membranes for hydrogen separation and carbon dioxide capture from synthesis gas. Energy Procedia 2014, 63, 153–159. [Google Scholar] [CrossRef]
  11. Merkel, T.C.; Zhou, M.; Baker, R.W. Carbon dioxide capture with membranes at an IGCC power plant. J. Membr. Sci. 2012, 389, 441–450. [Google Scholar] [CrossRef]
  12. Caravella, A.; di Maio, F.P.; di Renzo, A. Optimization of membrane area and catalyst distribution in a permeative-stage membrane reactor for methane steam reforming. J. Membr. Sci. 2008, 321, 209–221. [Google Scholar] [CrossRef]
  13. Caravella, A.; di Maio, F.P.; di Renzo, A. Computation study of staged membrane reactor configurations for methane steam reforming. I. Optimization of stage lengths. AIChE J. 2010, 56, 248–258. [Google Scholar] [CrossRef]
  14. Caravella, A.; di Maio, F.P.; di Renzo, A. Computation study of staged membrane reactor configurations for methane steam reforming. II. Effect of number of stages and catalyst amount. AIChE J. 2010, 56, 259–267. [Google Scholar] [CrossRef]
  15. Adrover, M.E.; López, E.; Borio, D.O.; Pedernera, M.N. Theoretical study of a membrane reactor for the water gas shift reaction under nonisothermal conditions. AIChE J. 2009, 55, 3206–3213. [Google Scholar] [CrossRef]
  16. Choi, Y.; Stenger, H.G. Water gas shift reaction kinetics and reactor modeling for fuel cell grade hydrogen. J. Power Sources 2003, 124, 432–439. [Google Scholar] [CrossRef]
  17. Kärger, J.; Ruthven, D.M. Diffusion in Zeolites and Other Microporous Solids; Wiley-Interscience: New York, NY, USA, 1992. [Google Scholar]
  18. Ghosal, K.; Freeman, B.D. Gas separation using polymer membranes: An overview. Polym. Adv. Technol. 1994, 5, 673–697. [Google Scholar] [CrossRef]
  19. Baker, R.W. Membrane Technology and Applications; John Wiley & Sons: Hoboken, NJ, USA, 2012; p. 152. [Google Scholar]
  20. Vora, S.; Brickett, L. DOE/NETL Advanced Carbon Dioxide Capture R & D Program: Technology Update; U.S. Department of Energy/National Energy Technology Laboratory: Washington, DC, USA, 2013.
  21. Marano, J.J. Integration of H2 Separation Membranes with CO2 Capture and Compression; Report to DoE, Contract No. DE-AC2605NT41816, DOE/NETL-401/113009; U.S. Department of Energy/National Energy Technology Laboratory: Washington, DC, USA, 2009.
Figure 1. The membrane reactor consists of a shell and tube setup in which the tube is packed with catalyst and the membrane is fixed to the tube wall; reaction/permeation occur simultaneously.
Processes 04 00008 g001
Figure 2. Arrangement of decision variables about the axial axis of the 2-stage permeative stage membrane reactor (PSMR).
Processes 04 00008 g002
Figure 3. Arrangement of decision variables about the axial axis of a 3-stage PSMR.
Processes 04 00008 g003
Figure 4. Arrangement of decision variables about the axial axis of the MR.
Processes 04 00008 g004
Figure 5. Maximization of carbon capture in an optimized 2-stage PSMR; only the design corresponding to αH2/CO2 = 25 fails to satisfy p u r i t y H 2 , p otherwise the remaining five constraints are satisfied for all cases; CCO2 ≥ 90% corresponds to the target value used in this study.
Processes 04 00008 g005
Figure 6. Species concentration (mol/cm3) as function of axial length for optimized 2-stage PSMR for αH2/CO2 = 60, corresponding to the solution vector shown above; solid blue and solid green lines denote feed and sweep streams, respectively.
Processes 04 00008 g006
Figure 7. H2 reaction (rH2) and diffusion (JH2a, a ≡ 4/dt) rates as function of axial axis for the optimized 2-stage PSMR (αH2/CO2 = 60); dimensionless quantities scaled by the maximum H2 reaction and diffusion rates, respectively.
Processes 04 00008 g007
Figure 8. Maximization of carbon capture in an optimized 3-stage PSMR (blue) as well as optimized 2-stage PSMR (black); only the designs corresponding to αH2/CO2 = 25 fail to satisfy p u r i t y H 2 , p , otherwise the remaining five constraints are satisfied for all cases; CCO2 ≥ 90% corresponds to the target value used in this study.
Processes 04 00008 g008
Figure 9. Species concentration (mol/cm3) profiles in the optimized 3-stage PSMR for αH2/CO2 = 60, corresponding to the solution vector shown above; solid blue and solid green lines denote feed and sweep streams, respectively.
Processes 04 00008 g009
Figure 10. H2 reaction (rH2) and diffusion (JH2a, a ≡ 4/dt) rates for the optimized 3-stage PSMR (αH2/CO2 = 60); dimensionless quantities scaled by the maximum H2 reaction and diffusion rates, respectively.
Processes 04 00008 g010
Figure 11. Maximization of carbon capture in an optimized MR (red) as well as 3-stage PSMR (blue); only the design corresponding to αH2/CO2 = 25 fails to satisfy p u r i t y H 2 , p , otherwise the remaining five constraints are satisfied for all cases; CCO2 ≥ 90% corresponds to the target value used in this study.
Processes 04 00008 g011
Figure 12. General optimized MR design; the solution specific to each H2/CO2 selectivity (on range 25–75) value falls within the range presented.
Processes 04 00008 g012
Figure 13. Species concentration (mol/cm3) profiles as function of axial length in tube (solid blue line) and shell (solid green line) for the solution vector shown above (optimized MR with αH2/CO2 = 60).
Processes 04 00008 g013
Figure 14. H2 reaction (rH2) and diffusion (JH2a, a ≡ 4/dt) rates, dimensionless quantities scaled by their maximum rates, for optimized MR (αH2/CO2 = 60); the ratio of reaction to diffusion rate (rH2/JH2a, defined only where both catalyst and membrane are present) provides insight into the catalyst packing near the end of the reactor.
Processes 04 00008 g014
Table 1. Molar composition of reactor inlet streams, given in mole fraction.
ComponentSyngas FeedSteam Sweep
H20.19330
CO20.05680
H2O0.48861
CO0.24430
N20.0170
Table 2. Performance of polymer membrane in a 2-stage PSMR (QH2 = 250 GPU, αH2/CO2 = 28).
ParameterValue (%)Target (%)
X CO 98.9598
R H 2 98.6095
C CO 2 74.7190
purity CO 2 + H 2 O , r   95.9895
purity H 2 , p 41.7144
y H 2 , r 0.77≤4
Table 3. Performance of polymeric membrane in a 3-stage PSMR (QH2 = 250 GPU, αH2/CO2 = 28).
ParameterValue (%)Target (%)
X CO 99.4498
R H 2 98.8295
C CO 2 74.7390
purity CO 2 + H 2 O , r 96.1795
purity H 2 , p 41.8244
y H 2 , r 0.71≤4
Table 4. Performance of polymeric membrane (QH2 = 250 GPU, αH2/CO2 = 28) in a conventional MR for the same conditions of the PSMR.
ParameterValue (%)Target (%)
X CO 99.3698
R H 2 98.3895
C CO 2 75.7790
p u r i t y CO 2 + H 2 O , r 96.0595
p u r i t y H 2 , p 42.0544
y H 2 , r 1.01≤4
Table 5. CO conversion and H2 recovery values for optimized MR, 2-stage PSMR and 3-stage PSMR at αH2/CO2 = 60.
Reactor ConfigurationXCO (%)RH2 (%)
2-stage PSMR98.6896.17
3-stage PSMR99.1696.07
MR99.6296.21

