Article

A Combined Feed-Forward/Feed-Back Control System for a QbD-Based Continuous Tablet Manufacturing Process

by
Ravendra Singh
*,
Fernando J. Muzzio
,
Marianthi Ierapetritou
and
Rohit Ramachandran
*
Engineering Research Center for Structured Organic Particulate Systems (C-SOPS), Department of Chemical and Biochemical Engineering, Rutgers, The State University of New Jersey, Piscataway, NJ 08854, USA
*
Authors to whom correspondence should be addressed.
Processes 2015, 3(2), 339-356; https://doi.org/10.3390/pr3020339
Submission received: 10 December 2014 / Revised: 20 March 2015 / Accepted: 20 April 2015 / Published: 6 May 2015

Abstract

:
Continuous pharmaceutical manufacturing together with PAT (Process Analytical Technology) provides a suitable platform for automatic control of the end product quality as desired by QbD (quality by design)-based efficient manufacturing. The precise control of the quality of the pharmaceutical product requires corrective actions in the process/raw material variability before product quality can be influenced. In this manuscript, a combined feed-forward/feed-back control system has been developed for a direct compaction continuous tablet manufacturing process. The feed-forward controller takes into account the effect of process disturbances proactively while the feed-back control system ensures the end product quality consistently. The coupled feed-forward/feed-back control system ensures the minimum variability in the final product quality irrespective of process and raw material variations. The performance of the combined control strategy has been evaluated through process simulation and is found to be more effective in comparison with a feed-back only control strategy and, therefore, demonstrates potential to further improve pharmaceutical tablet manufacturing operations.

1. Introduction

Pharmaceutical companies are one of the most strictly regulated companies where precise control of the end product quality is highly desired to satisfy the high standard set by regulatory authorities to ensure the efficiency and efficacy of the drug products [1,2]. Continuous pharmaceutical manufacturing enables the implementation of efficient automatic real time monitoring and control of the critical process parameters (CPP’s) and critical quality attributes (CQA’s) as desired for quality by design (QbD)—rather than quality by testing (QbT)—based manufacturing [3,4]. There are many factors that can affect the end product quality of the pharmaceutical products involving solid dosage forms. For example, the raw materials and process variability and any other measurable and non-measurable process disturbances can upset the process and thereby can affect the product quality. An automatic feed-back control system, though essential to ensure the end product quality in real time, can take action only after the disturbances affect the product quality. Therefore, a feed-back standalone strategy is insufficient to provide near perfect control of the process which is often needed for the manufacture of pharmaceutical products. A feed-forward control strategy takes actions before process disturbances can affect the product quality. However, a feed-forward only control strategy does not take into account the feed-back signal of the control variables and, as a result of other unmeasured process disturbances, the control variables or end product quality can deviate from the desired values. Therefore, a combined feed-forward/feed-back control strategy is needed in which the measured process disturbances (feed-forward signals) can be taken into account before it affects the end product quality and the feed-back signal of the control variables can be utilized to ensure the consistent predefined end product quality.
In the last few years, extensive work has been done to study the continuous tablet manufacturing process [3,4,5,6]. The main focus, however, has been on powder blend uniformity, drug concentration and final end product qualities. For example, Vanarase et al. (2010) have applied NIR for inline monitoring of powder blend homogeneity [7]. Singh et al. have demonstrated the advanced model predictive control (MPC) as well as classical PID (proportional integral derivative) based real time automatic feed-back control of the drug concentration [3]. Much less attention, however, has been paid to the development of PAT and control methods for physical properties of blends. Some physical properties (e.g., blend bulk density, shear) have significant effects on the end product quality (e.g., weight, hardness, dissolution) of the pharmaceutical tablets. Blend physical properties such as bulk density can vary during processing because of many factors. For example, variations in raw material properties (e.g., particle size), feeder hopper level, amounts of lubrication, milling and blending action, applied shear in different processing stages can affect the blend bulk density significantly and thereby tablet weight, hardness and dissolution. Therefore, the inline real time monitoring of the physical properties of the blend (e.g., bulk density) and its incorporation into the control system so that it does not affect the end product quality is highly desired [8]. However, due to the different levels of complexity associated with powder handling and the unavailability of the PAT and control methods, the integration of the physical properties to the control system is still a challenging task.
Feed-forward control systems have been very successful in various manufacturing industries to take proactive actions on process variations/disturbances. Using both feed-forward and feed-back control to respond in real time to disturbances throughout the multiple unit operations is a hallmark of continuous manufacturing [9]. However, to date, no attempts have been made to design a feed-forward control system for a pharmaceutical manufacturing process. Moreover, feed-back control strategy of presently available tablet press also needs to be improved because these control logics are based on empirical law rather than real control algorithm (e.g., PID, MPC); all three control loops in these tablet press can not be activated at the same time meaning that tablet weight and hardness are not really controlled in real time, and the tablet weight and hardness control-loops are not decoupled. Therefore, new feedback control logic has been developed in this manuscript to address these issues as well.
In the last few years, very few attempts have been made toward the control of a tablet manufacturing process utilizing feed-back control algorithm. Hsu et al. (2010) have suggested a feed-back control system for a roller compactor, an important unit operation used for a dry granulated continuous tablet manufacturing process [10,11]. A detailed review on the feed-back control of a fluid bed granulation process has been performed by Burggraeve et al. (2012), and discussion has been provided by Bardin et al. (2004) on the control aspects for efficient operation of a high shear mixer [12,13]. Sanders et al. (2009) have performed extensive feed-back control studies using PID and model predictive control (MPC) methods on an experimentally validated fluidized bed granulation model [14]. Recently, Singh et al. (2014) have implemented a MPC based feed-back control system into the direct compaction tablet manufacturing process with focus on drug concentration control at blending unit operation [3]. However, no attempt has been made to design a combined feed-forward/feed-back control system for an integrated continuous tablet manufacturing process. Moreover, the simultaneous control of tablet weight and hardness, which are two important control variables in tablet press, is still a challenging task.
In this study, for the first time, a combined feed-forward/feed-back control system has been developed for an integrated continuous direct compaction pharmaceutical tablet manufacturing process. The tablet weight and hardness control loops have been decoupled so that these variables can be controlled simultaneously. The powder blend bulk density has been used as the feed-forward variable of a tablet press control system consisting of loops to control the tablet weight and hardness. The performance of the proposed control system has been evaluated for set point tracking and disturbances rejection ability through process simulation. The systematic application of the feed-forward/feed-back control can take proactive action on a process disturbance and therefore will enable the industrial practitioners to achieve a predefined end product quality more consistently.

2. Continuous Tablet Manufacturing Process

2.1. Process Description

A continuous direct compaction tablet manufacturing process has been previously reported in Singh et al., 2014 [15]. The process includes feeders, co-mill, blender and tablet press. There are three gravimetric feeders with the capability of adding more that feed the various formulation components (active pharmaceutical ingredient (API), excipient etc.). A co-mill is also integrated after the feeder hopper, primarily for de-lumping the powders and creating contact between components. The co-mill eliminates any large, soft lumps within the powder. The lubricant feeder is added after the co-mill to prevent over lubrication of the formulation in the co-mill. These feed streams are then connected to a continuous blender within which a homogeneous powder mixture of all the ingredients is generated. Subsequently, the outlet from the blender is fed to the tablet press via a rotary feed frame. The powder blend fills a die and is subsequently compressed to create a tablet. The NIR sensor for inline monitoring of blend uniformity, blend composition and blend bulk density has been integrated through a chute placed in between tablet press and blender.

2.2. Control Relevant Process Model

The control relevant process model involving transfer functions has been developed through step change response analysis in the system identification toolbox of Matlab (Mathworks, Natick, MA, USA). The integrated flowsheet model for direct compaction continuous tablet manufacturing process has been previously reported [6,16]. The mathematical model for powder blending, an important but complex unit operation, has been previously developed as described in [5]. The model for the tablet compression process is previously reported in Singh et al. (2013) [16]. This model is based on the Kawakita powder compression model and Kuentz-Leuenberger tablet hardness model [17,18]. The dissolution model was adapted from Kimber et al. (2011) [19]. The models for the different unit operations have been developed and included in gPROMS (Process Systems Enterprise, PSE, London, UK) to facilitate the integrated flowsheet modeling.
Input and output variables considered in the process identification stage are listed in Table 1. The output variables are main compression force, tablet weight and hardness. The process inputs with which these control variables have been related using transfer function modelling methodology are fill depth, punch displacement, and powder blend bulk density. The tablet weight and hardness have been also related with the main compression force using transfer function model. The transfer function model has been simulated in Simulink (Mathworks). The transfer function model has been widely used to design and evaluate the control system and it has been observed that the considered system can be modelled through the transfer function approach.
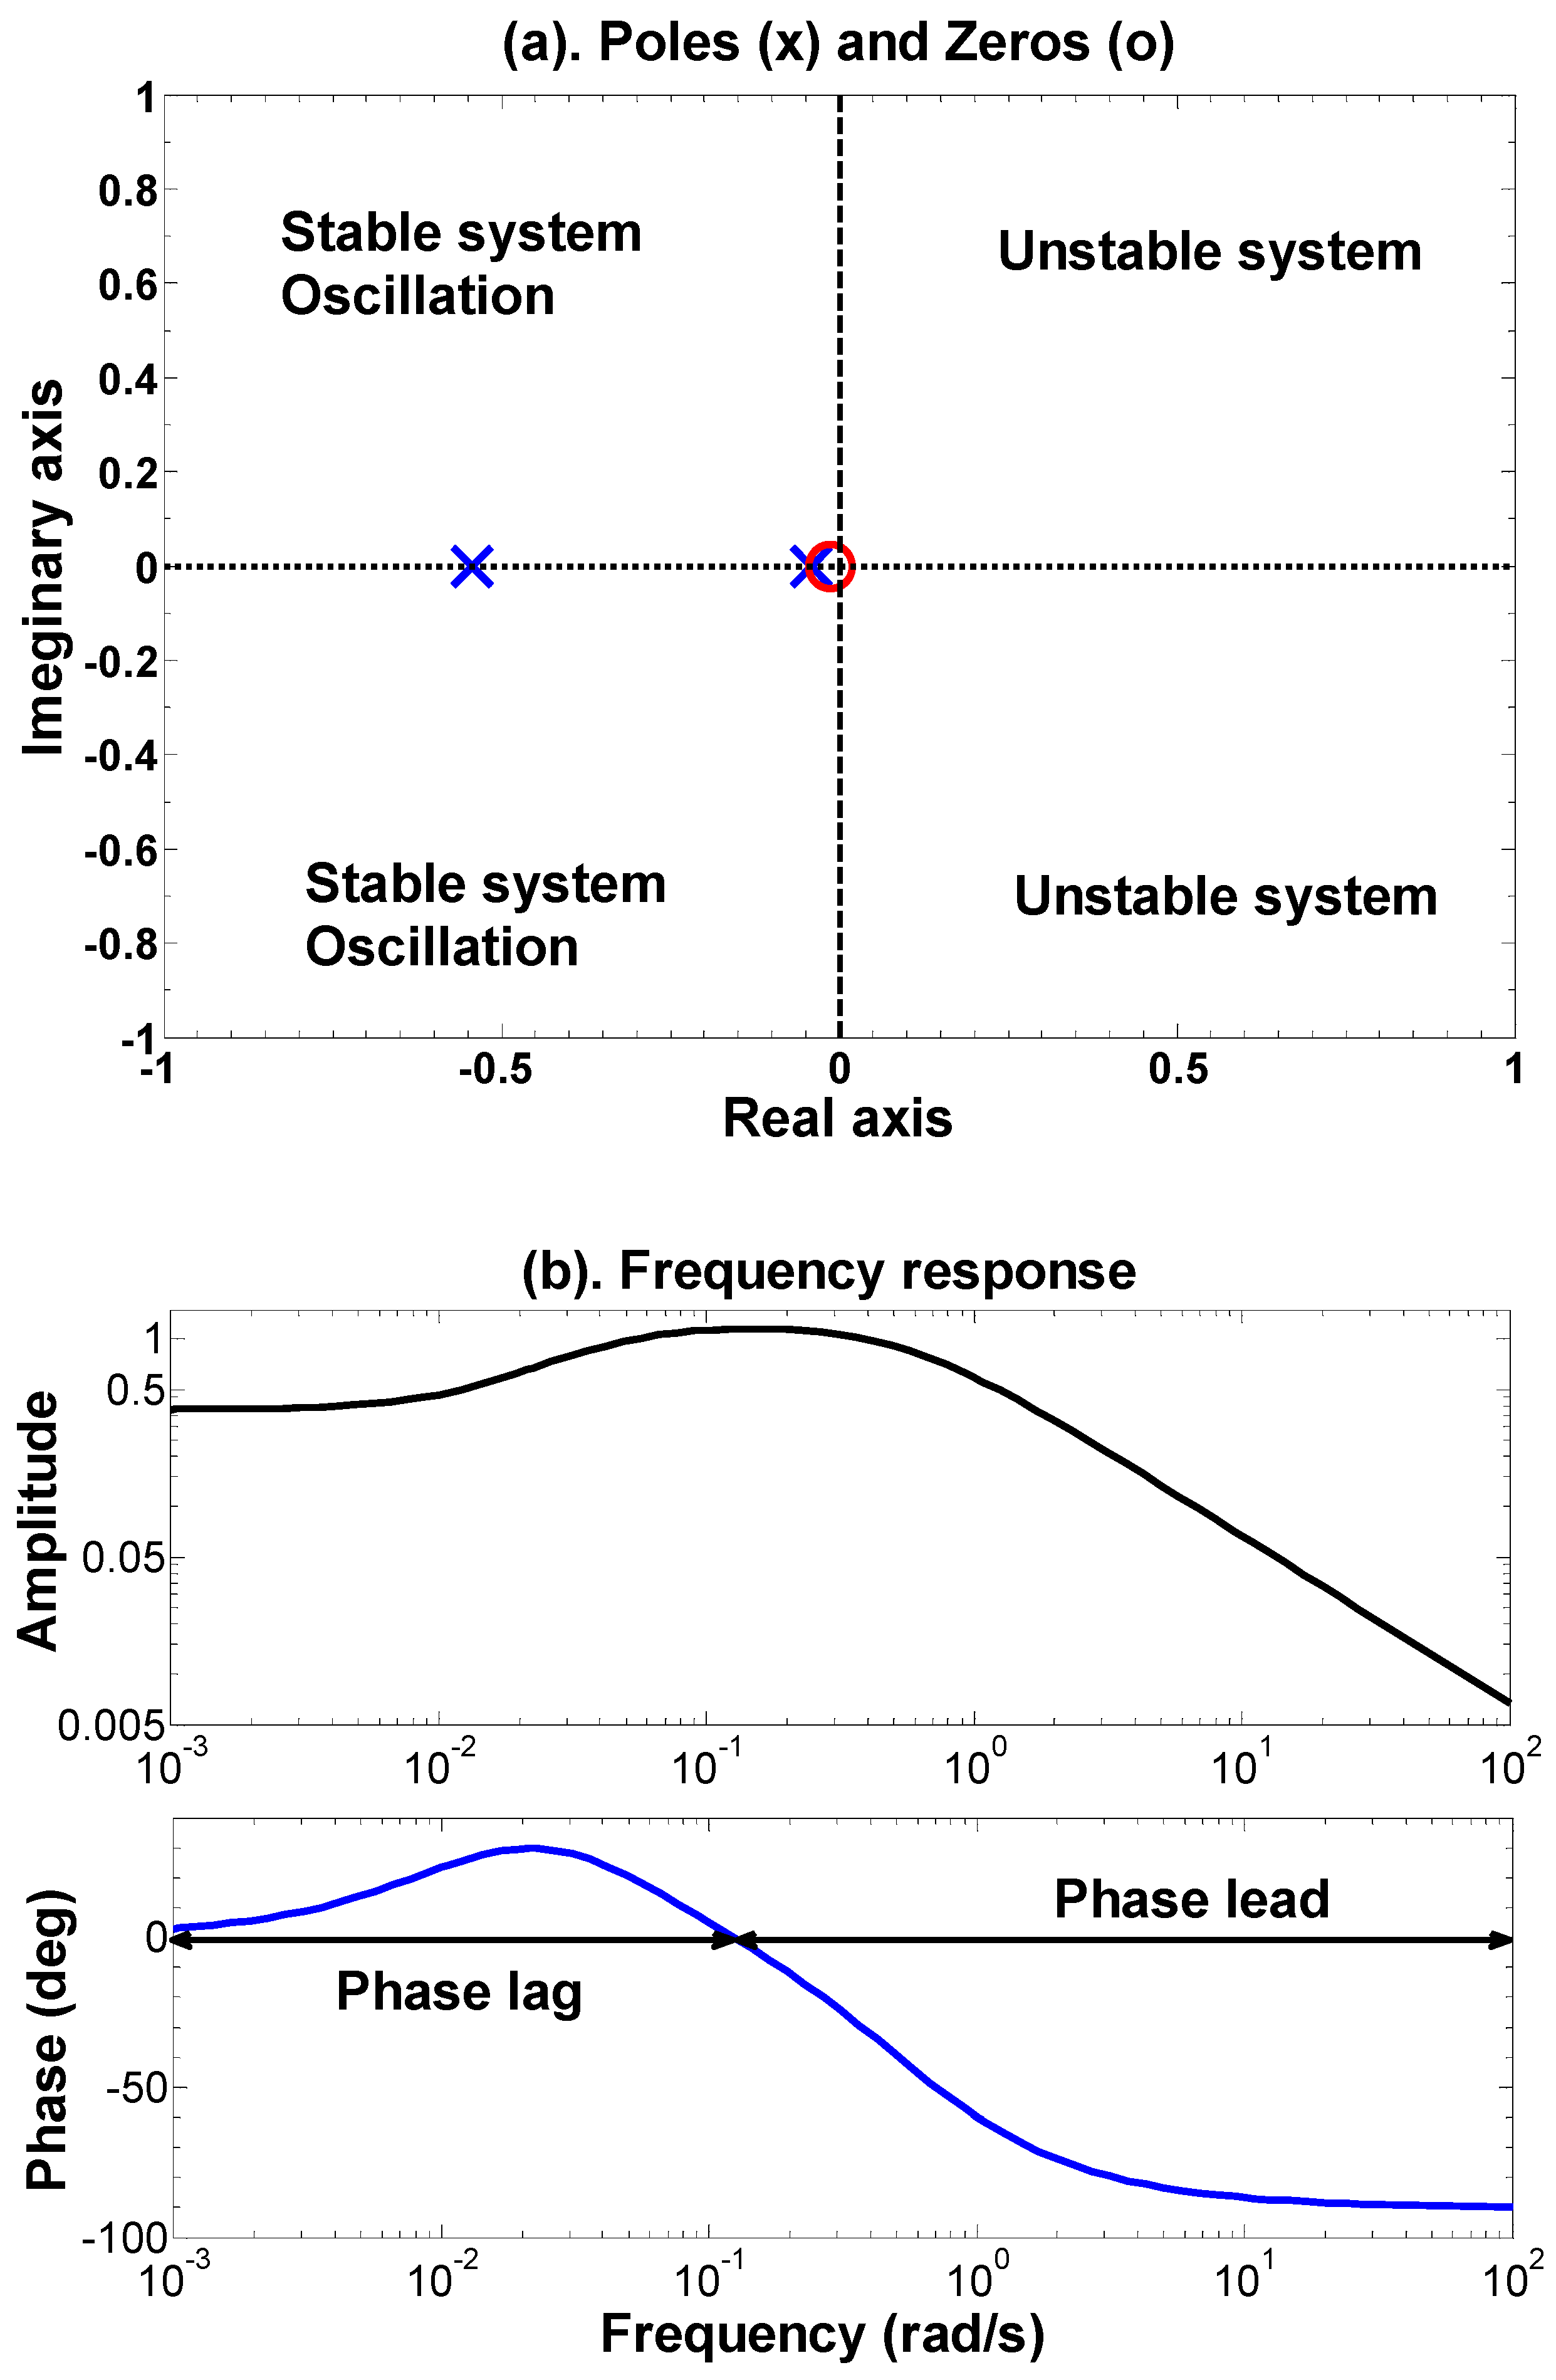
The developed transfer function model along with inputs and outputs variables are given in Table 1. Fill depth has been related with the main compression force through a second order transfer function represented by one zero and two poles. The poles and zeros plot is shown in Figure 1a. Figure shows that the process is stable and non-oscillatory. The values of one pole and zero are very small indicating that the process behavior is closer to a first order system. The phase diagram is shown in Figure 1b. Phase lag and phase lead reasons have been highlighted in the figure. From the phase diagram, the stability margin can be obtained. For a marginal stability, the gain margin should be more than 2.5 and phase margin (180°—Phase angle) should be more than 30 [20]. Note that, both a good gain margin and a good phase margin are needed but neither is sufficient by itself. The delay time for this process depends on tablet press operating conditions.
Table 1. Process transfer function model.
Transfer FunctionsModelsInputsOutputs
Gp1(S) 0.3782 ( 77.3204 S + 1 ) 43.6110 S 2 + 25.5342 S + 1 Fill depthMain compression force
Gp2(S) 1.4459 ( 19.4813 S + 1 ) 13.1562 S + 1 Main compression forceTablet hardness
Gp3(S) 10.1868 ( 0.2595 S + 1 ) 10.9218 S 2 + 0.07510 S + 1 Main compression forceTablet weight
Gp4(S) 1.1701 106.6667 S 2 + 4.8672 S + 1 Punch displacementMain compression force
Gd(S) 34.6667 ( 247.1219 S + 1 ) 453.5147 S 2 + 86.4399 S + 1 Powder bulk densityMain compression force
Figure 1. Poles-zeros plot and phase diagram of transfer function model relating fill depth with main compression force. (a) Poles-zeros plot; (b) Frequency response.
Processes 03 00339 g001
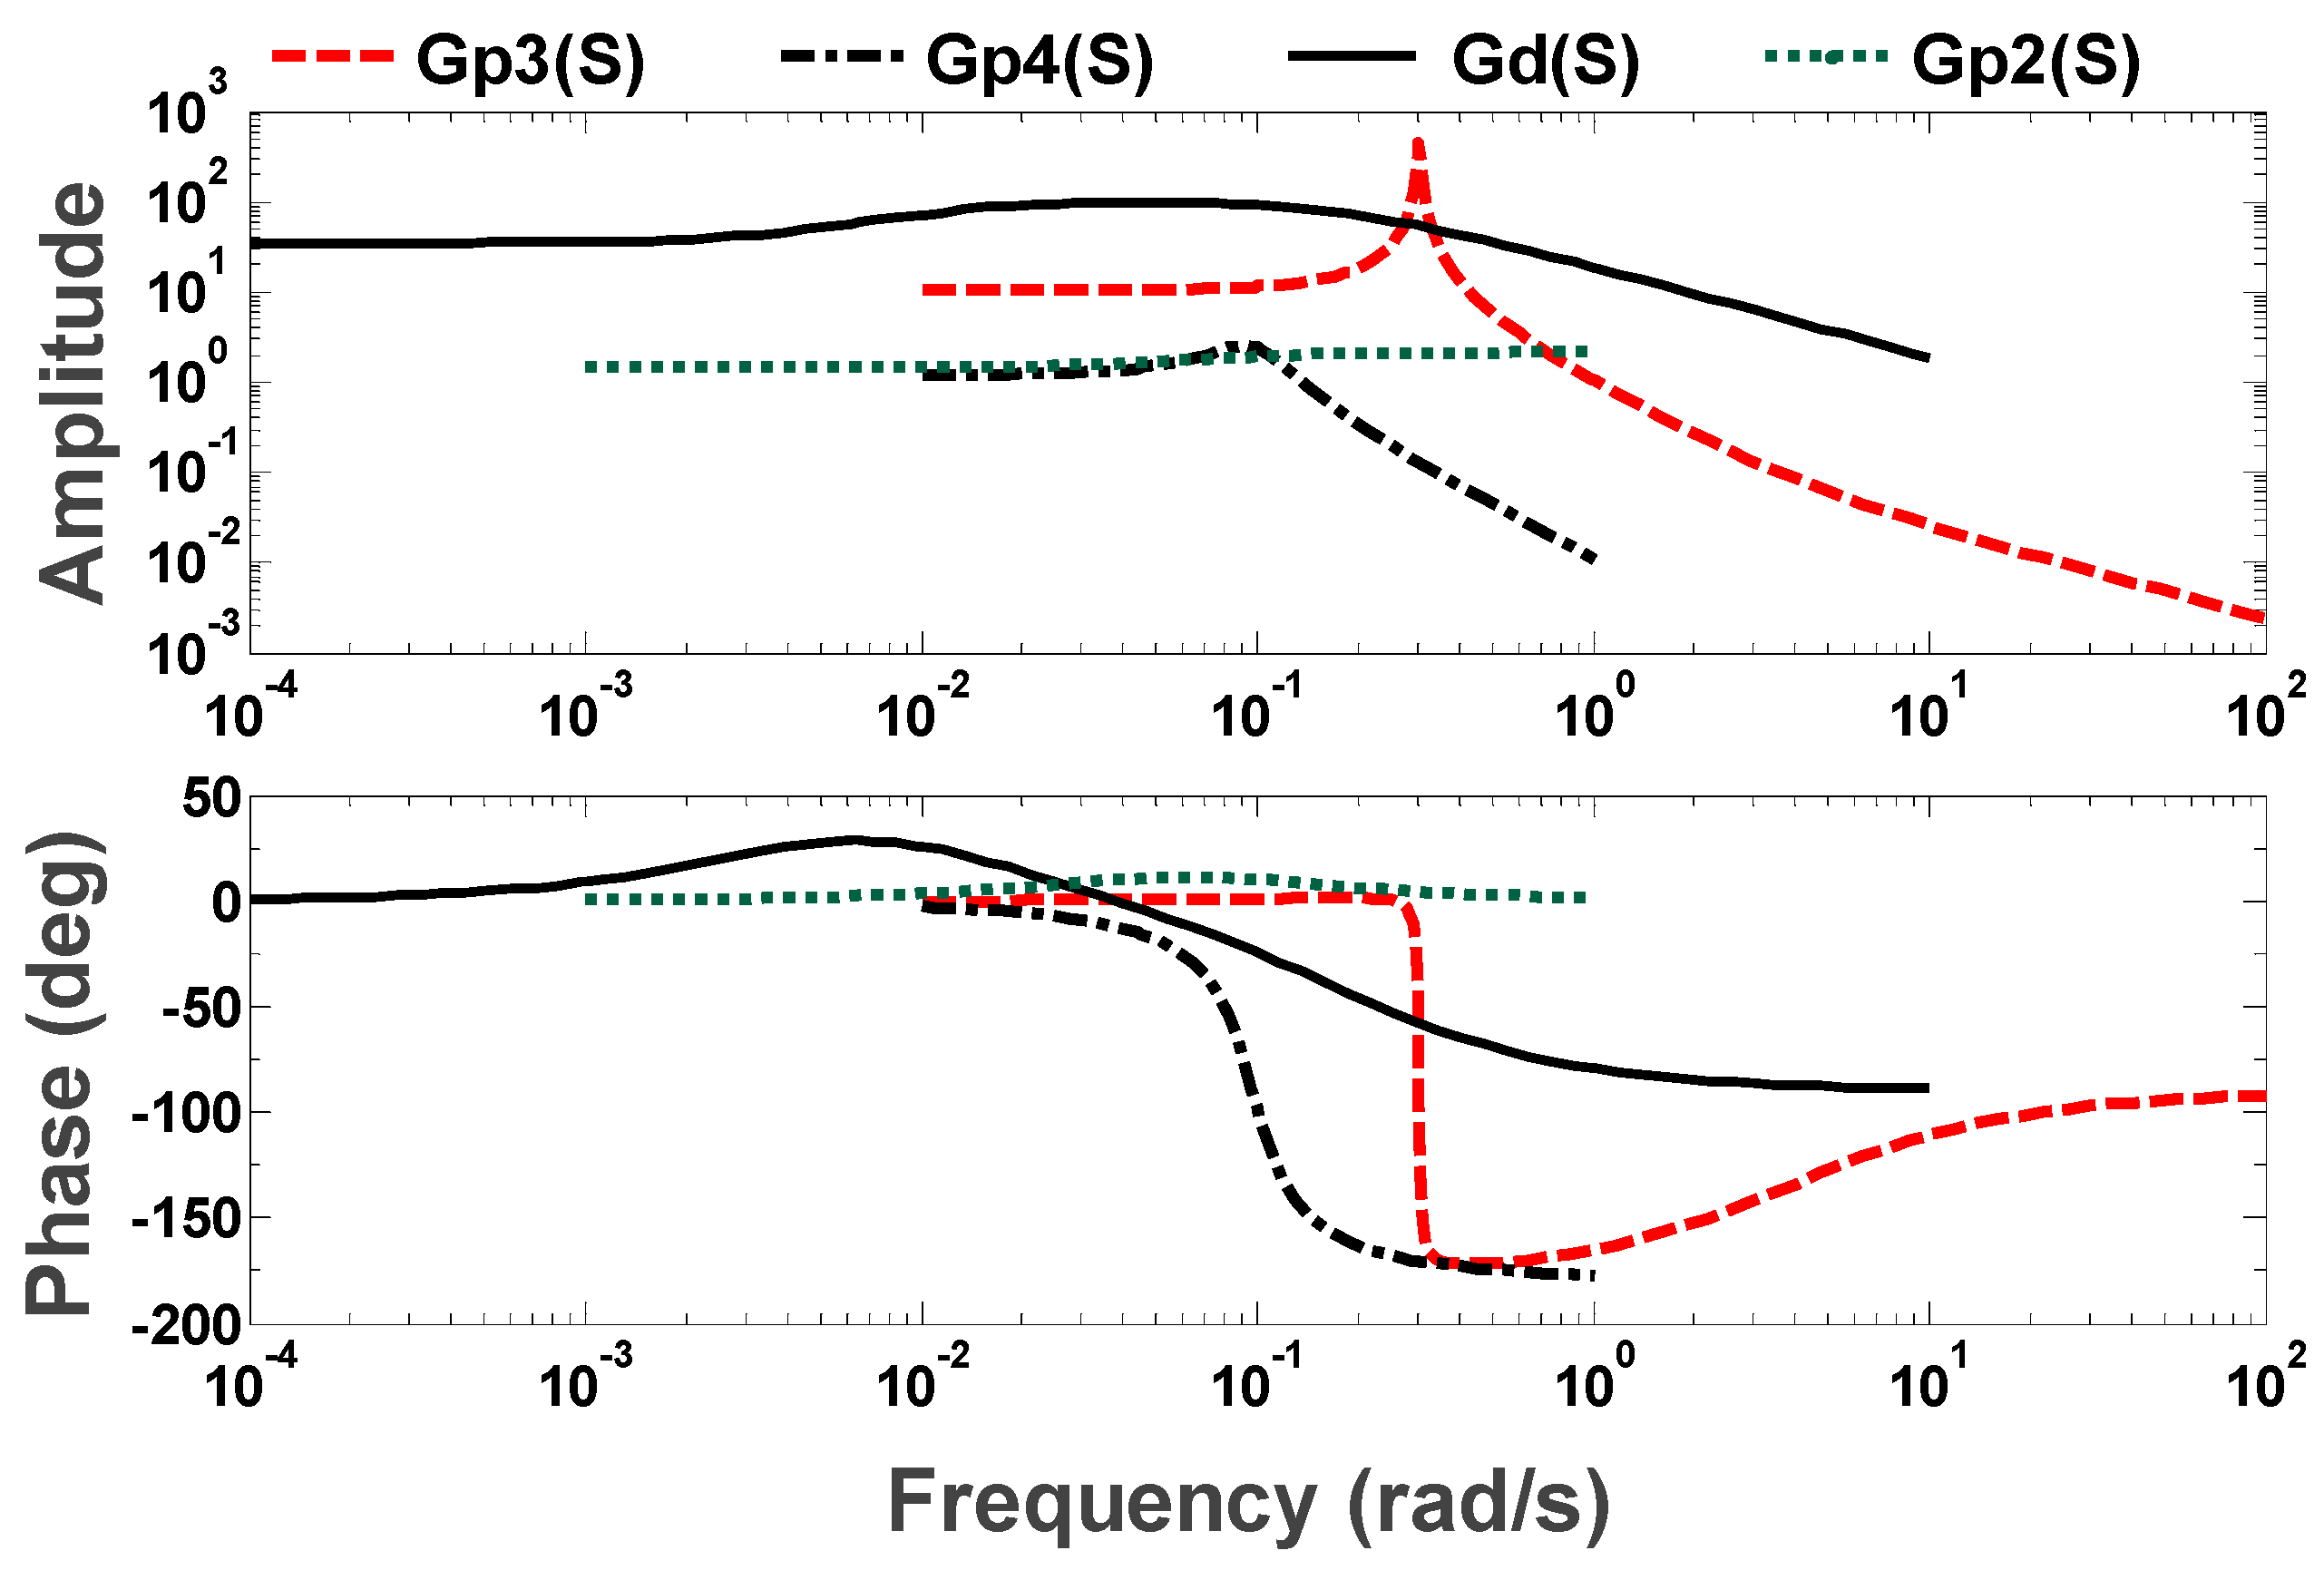
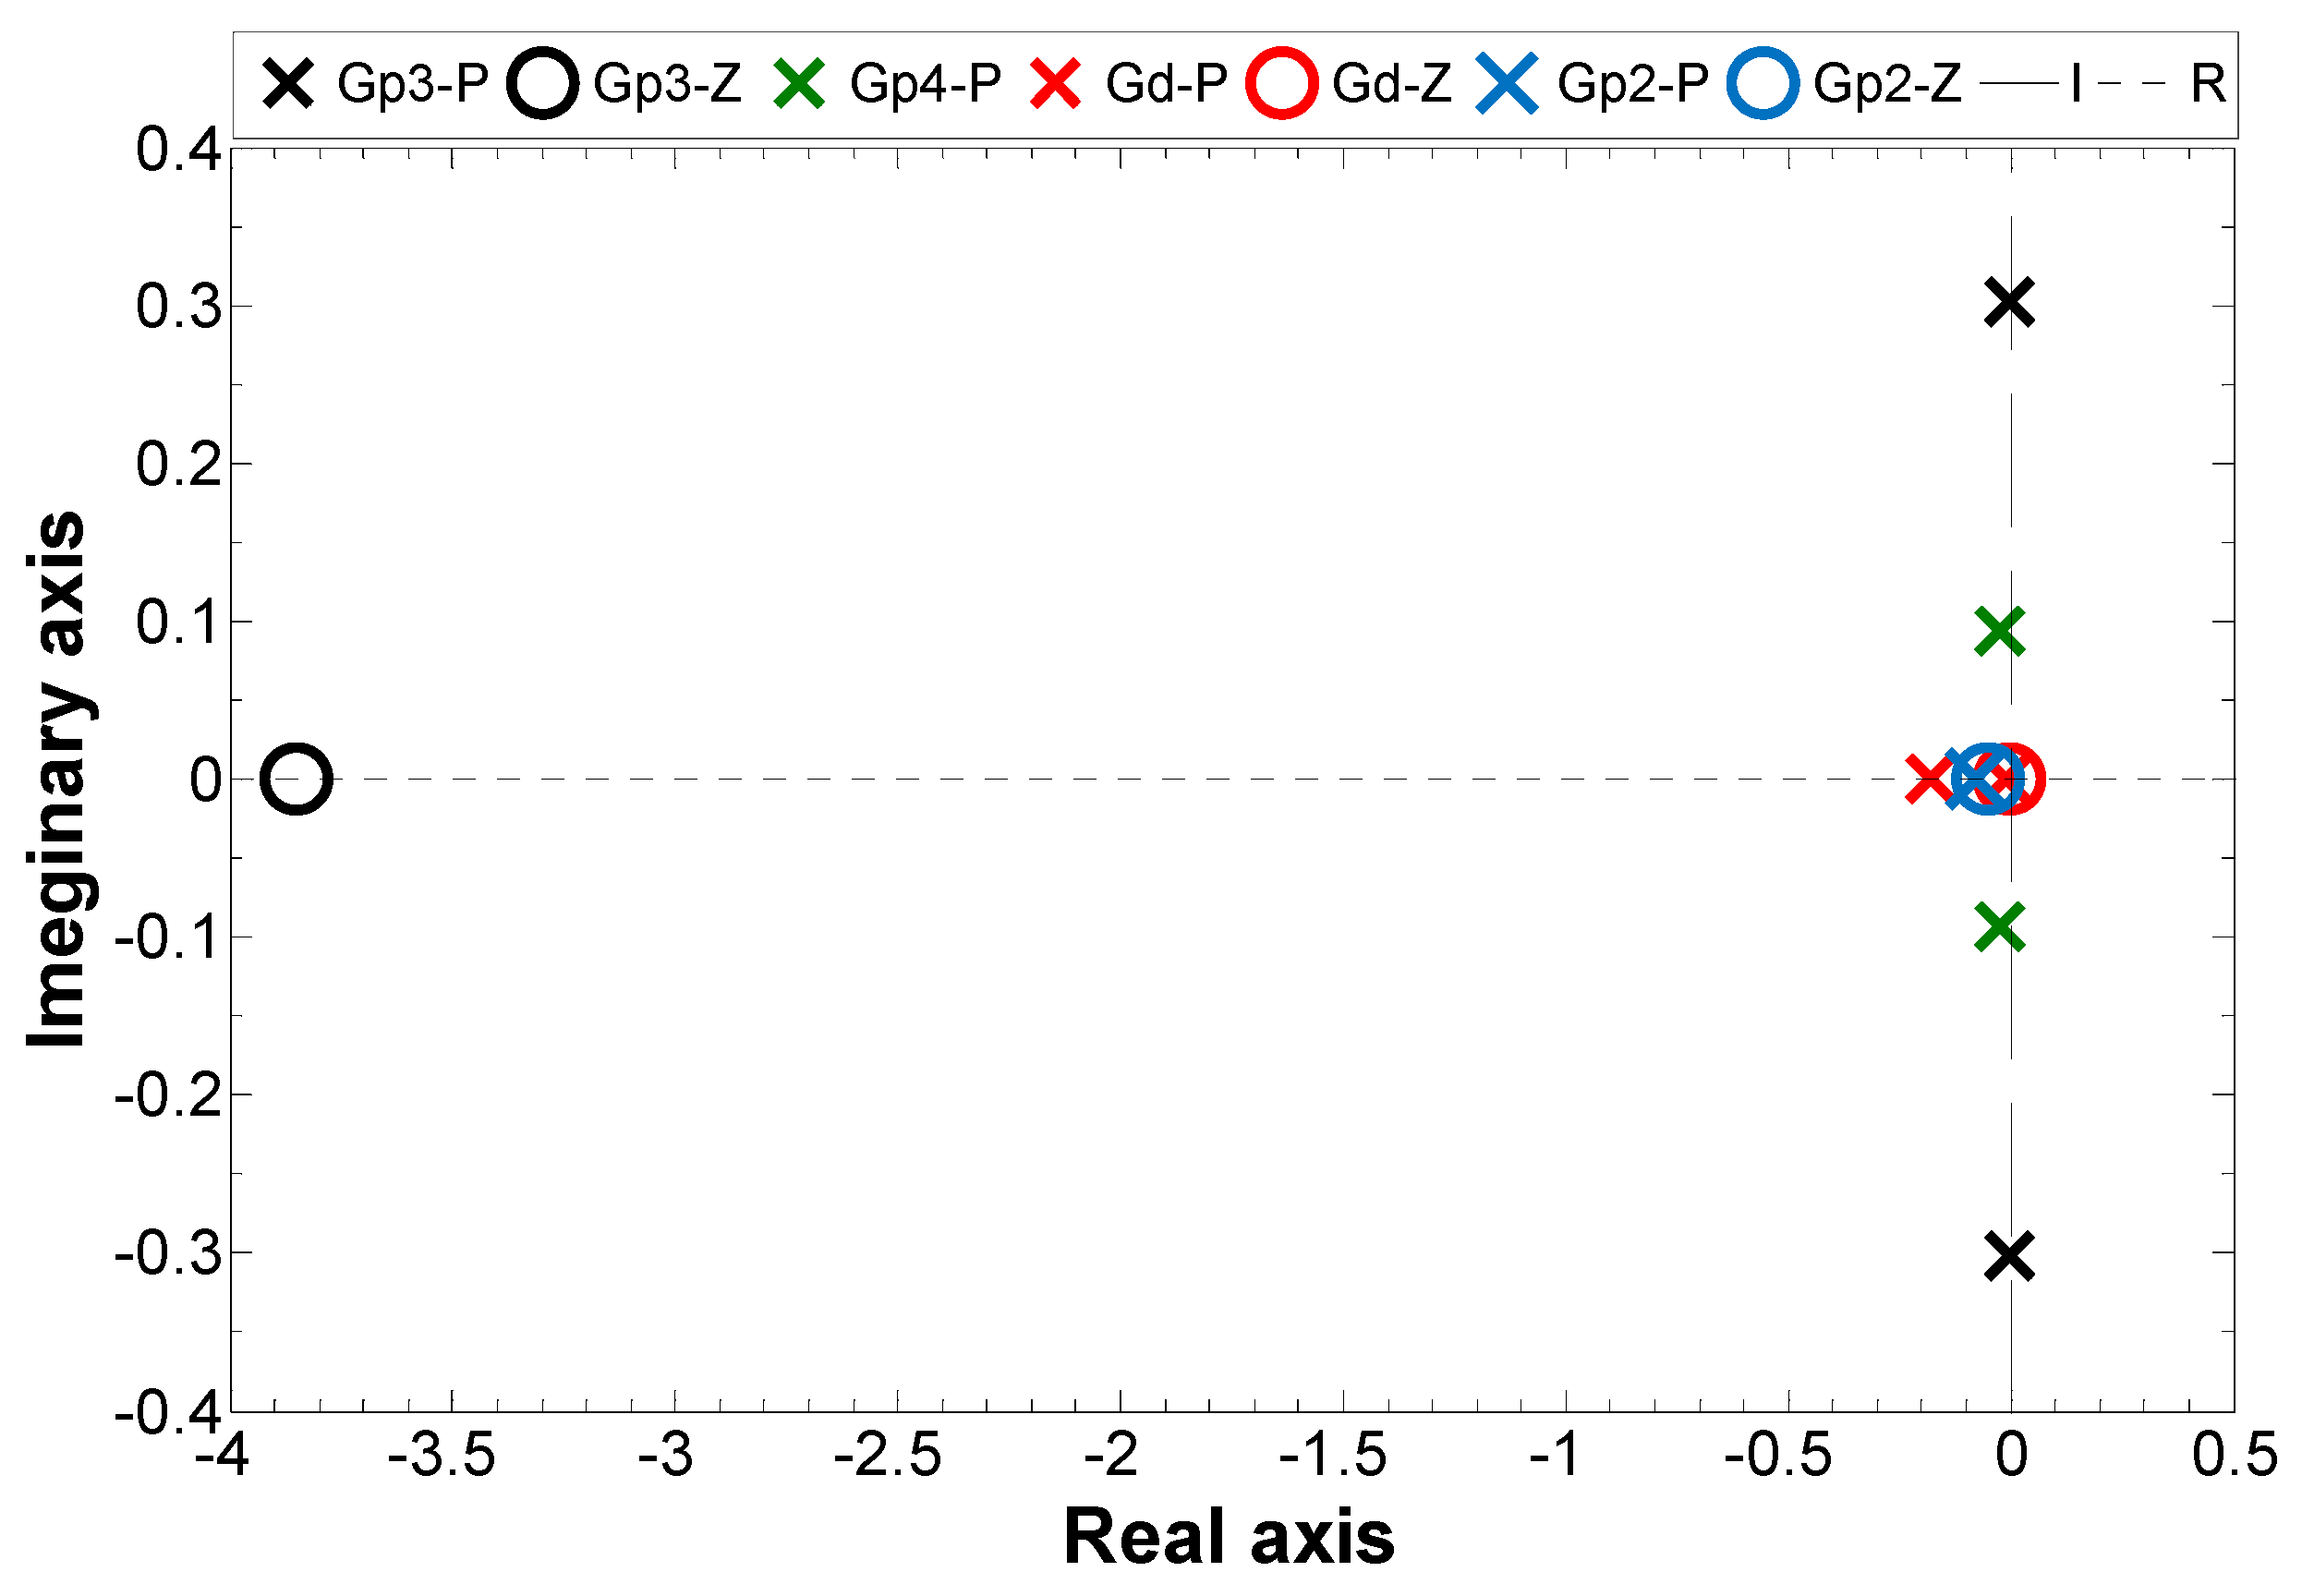
The main compression force has been related with the tablet hardness through a first order transfer function represented by one pole and one zero. The pole and zero plots are shown in Figure 2 (see Gp2-P and Gp2-Z). As shown in the figure, the process is stable and non-oscillatory. The phase diagram is shown in Figure 3 (see Gp2(S)). Main compression force has been also related with the tablet weight through a second order transfer function model with one zero and two poles (see Table 1). Poles and zeros plots shown in Figure 2 (see Gp3-P and Gp3-Z) indicate that the process is stable and oscillatory. Phase diagram is shown in Figure 3 (see Gp3(S)). The dead time for this process is 2 s. Punch displacement has been related with the main compression force through a second order system with one zero and two imaginary poles. The poles and zeros plot shown in Figure 2 (Gp4-P) indicate that the response is stable but oscillatory. The phase diagram for this transfer function is shown in Figure 3 (see Gp4(S)). Similarly, the relationship between powder bulk density and main compression force has been modelled using second order transfer function. One zero and two real poles are involved in the model. Figure 2 shows that the system is stable and non-oscillatory (see Gd-P and Gd-Z). Figure 3 shows the phase diagram and marginal stability for this process (see Gd(s)). Note that, for each system identification case, the transfer function models have been identified for a range of numbers of zeros, and poles and the best fitted models are given in Table 2.
Table 2. Controller inputs and outputs.
Control LoopsControllersControl VariablesInputsOutputs
1: Feed-backGc1(S)Main compression force (y1)Deviation of main compression force from set pointFill depth (u11)
2: Feed-forwardGc2(S)-Powder bulk densityFill depth (u12)
3: Feed-backGc3(S)Tablet weight (y2)Deviation of tablet weight from set pointMain compression force set point
4: Feed-backGc4(S)Tablet hardness (y3)Deviation of tablet hardness from set pointPunch displacement (u2)
“-” means there is no control variable associated with feed-forward controller.
Figure 2. Poles (P)-zeros (Z) plot of transfer function models.
Processes 03 00339 g002
Figure 3. Phase diagram (frequency response) of process models.
Processes 03 00339 g003

3. Combined Feed-Forward/Feed-Back Control of Tablet Press

A combined feed-forward/feed-back control system has been designed for a tablet press used in continuous tablet manufacturing process, using a standard approach. The final product specifications include tablet weight, tablet hardness, and tablet dissolution. The unit operations for considered process are feeders, co-mill, blender and tablet press. API, excipient and lubricant are important feeds to the process.

3.1. Architecture of the Combined Feed-Forward/Feed-Back Control System

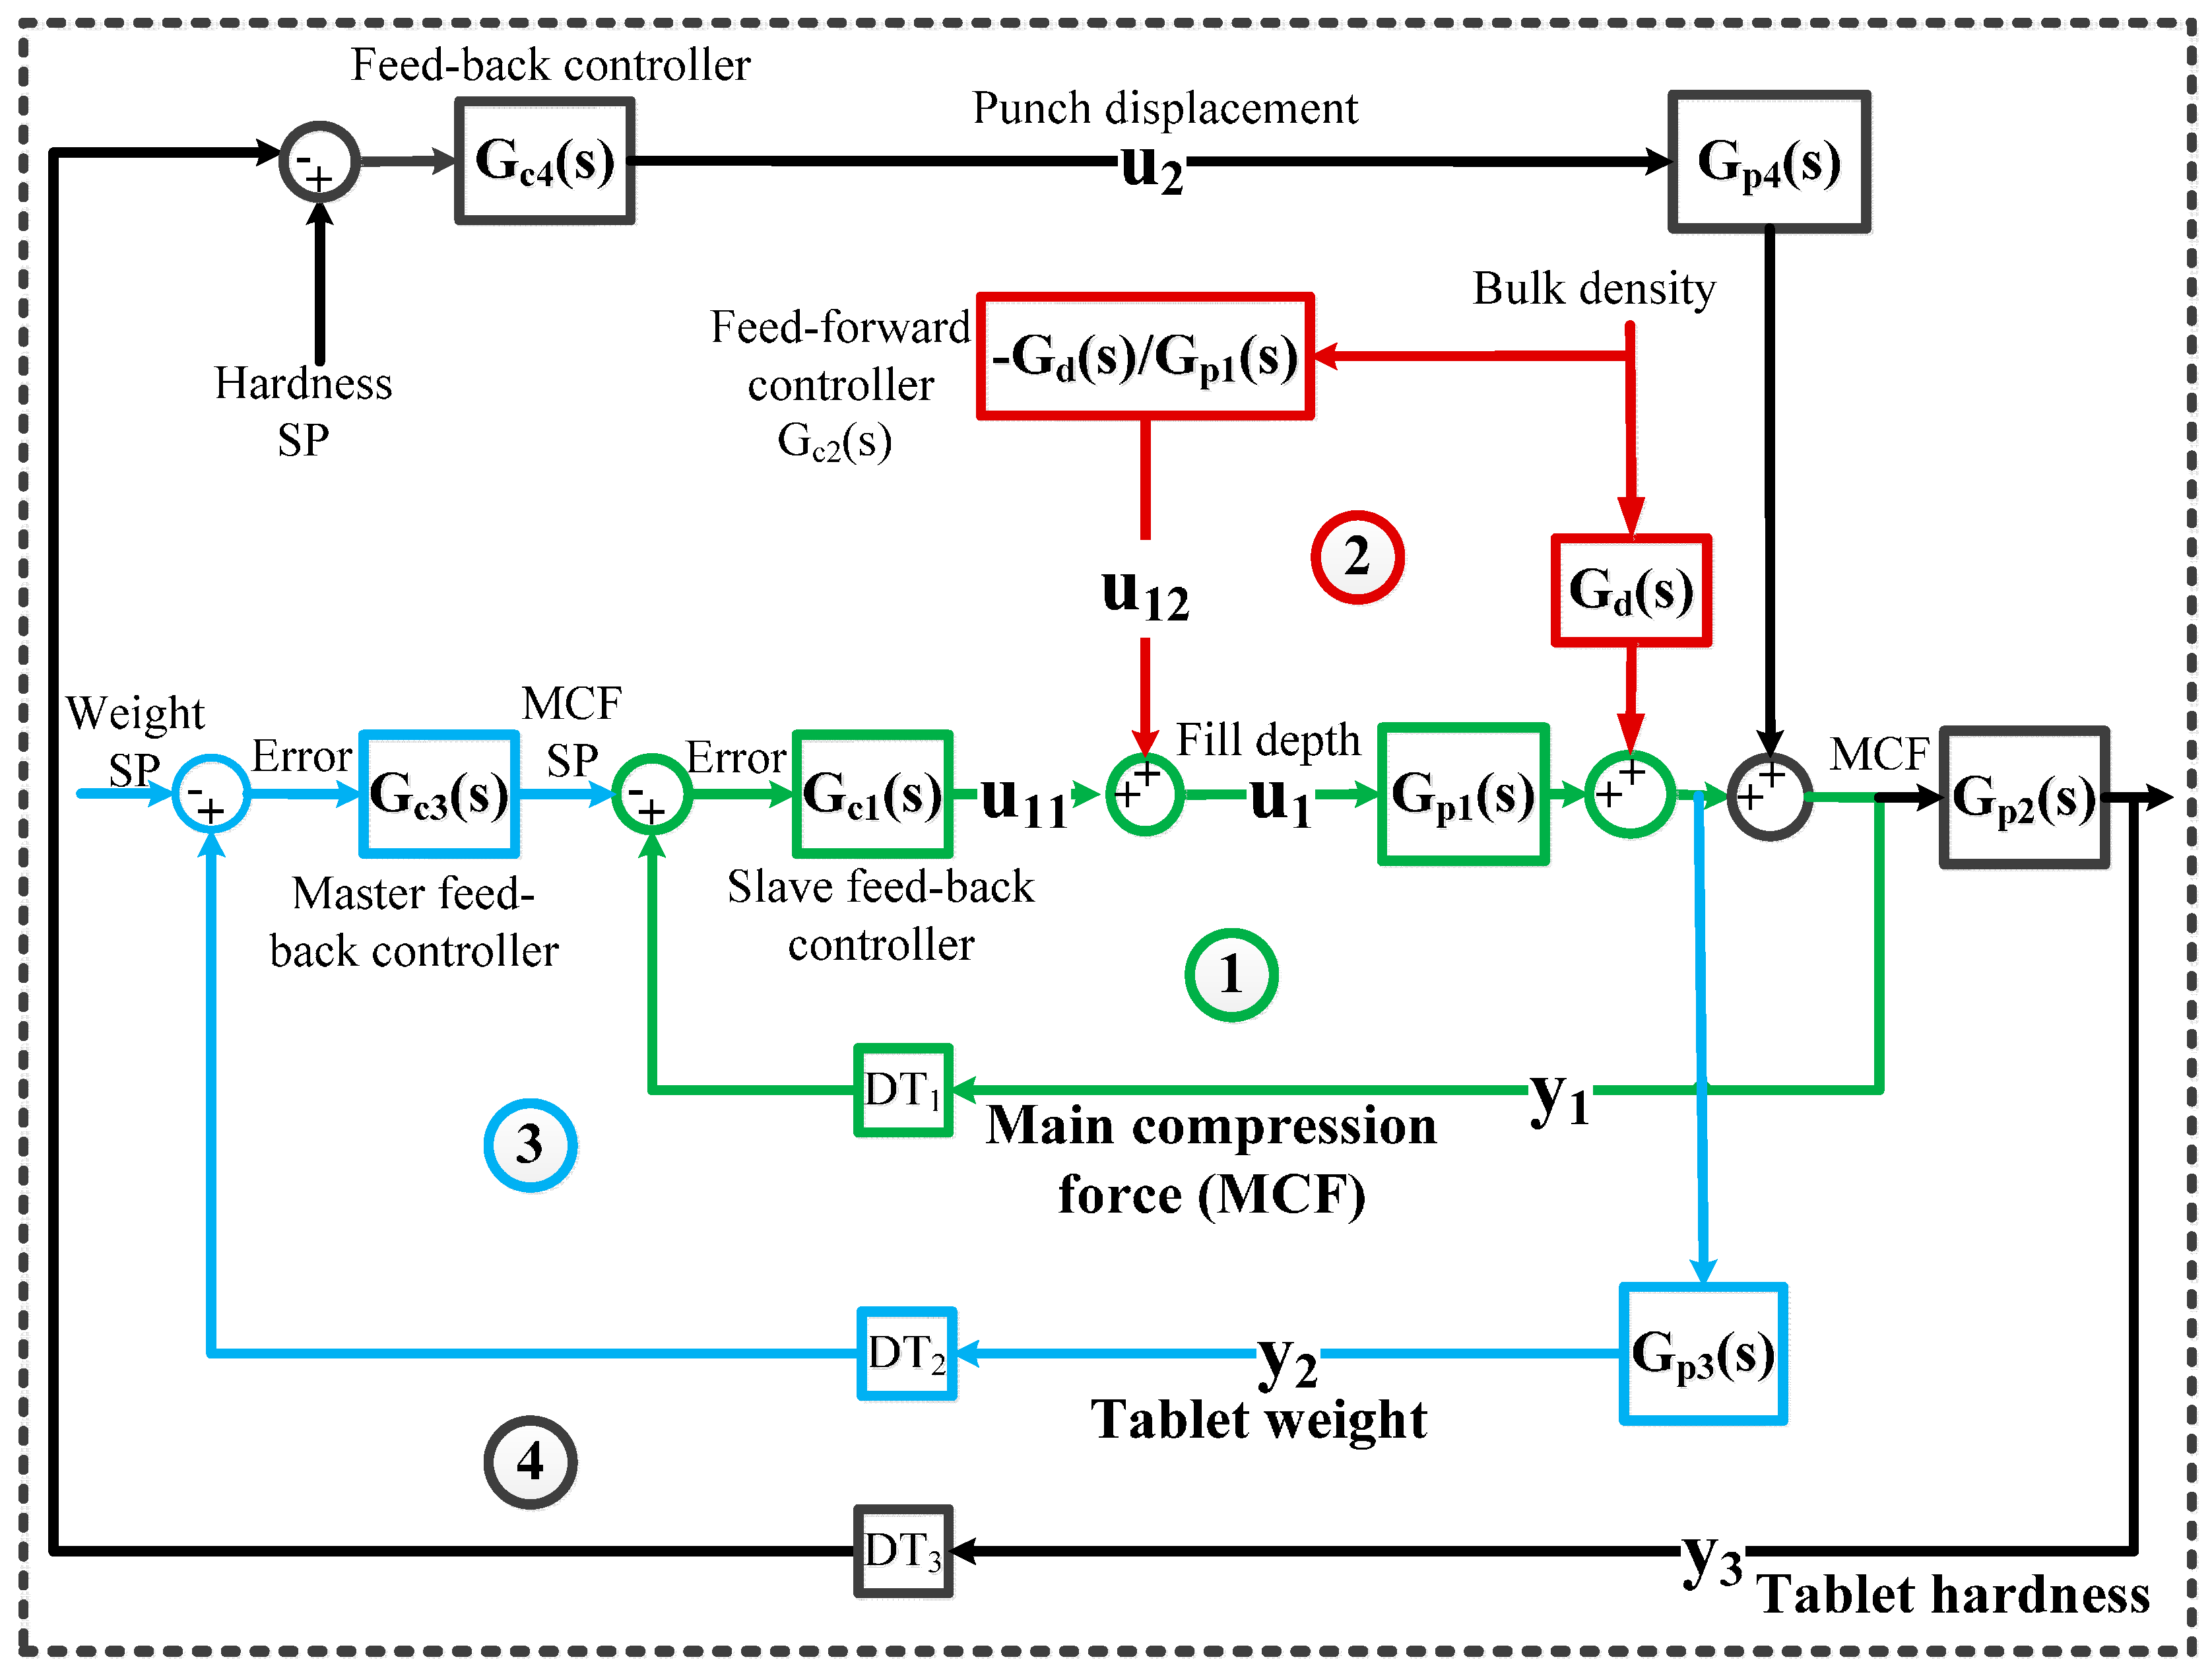
The architecture of the combined feed-forward/feed-back control system for the tablet press is shown in Figure 4 and consists of four control loops. All controllers and corresponding inputs and outputs are listed in Table 2. Control loop 1 is a slave feed-back control loop for real time control of main compression force. This loop is based on real time measurement of the main compression force and maintains the main compression force at the specified set point. As shown in Figure 4, the powder bulk density, fill cam level and the distance between punch tips under maximum compression can affect the main compression force. The slave loop 1 is significantly faster than the master loop. Control loop 2 is a feed-forward loop. This loop is based on the real time measurement of the powder blend density. This loop compensates for disturbances in powder bulk density before it can affect the final end product quality and therefore minimizes the rejections. Similar to powder blend density, any other process variables can be fed-forward to the control system. Loop 3 is a master feed-back loop for tablet weight control. It provides the set point for control loop 1 (i.e., set point of main compression force). This loop ensures consistent tablet weight throughput the operation. This loop should only be activated if the achieved tablet weight violates the specific tolerance limit. Loop 4 is a feed-back loop specifically designed for tablet hardness control. This loop is also only activated when the achieved tablet hardness violates the specified control limits. This loop also affects the set point of main compression force. This loop controls the hardness by adjusting the punch displacement. This loop ensures the consistent tablet hardness throughout the continuous plant operation. The control variables have been paired with appropriate actuators using knowledge of the physics of the system combined with relative gain array (RGA) analysis and dynamic sensitivity analysis. The studies on control variable and actuator pairing have been previously reported [16].
It can be seen in Figure 4 that the tablet weight and hardness control loops have been decoupled meaning that both variables can be controlled simultaneously. For example, on changing the tablet weight set point, the main compression force set point will change and control loop 1 will then track the new set point by manipulating the fill cam level. Similarly, if tablet hardness set point has been changed then control loop 4 will adjust the distance between punch tips and that will lead to a change in the main compression force. Loop 4 then will try to maintain the consistent tablet weight by not allowing the change in the fill cam level and, thereby, the set point of the main compression force will change. In this control mechanism, the loop 1 (designed to control the main compression force) is a shared slave loop for tablet weight and hardness control loops. Therefore, changing the tablet weight and/or hardness set point will lead to a change in the set point of the main compression force. A single slave loop has been shared by two master control loops in such a way that both control variables can be controlled simultaneously.
Figure 4. Architecture of the feed-forward/feed-back control system and decoupled tablet weight and hardness control loops. SP: Set point; MCF: Main compression force.
Processes 03 00339 g004
The spectroscopic technique is the most commonly used method to monitor the pharmaceutical tablet manufacturing process. NIR sensor has been proposed to measure the powder bulk density in real time. Some other methods based on load cell are available as well for real time measurement of powder bulk density [21]. The most desired measurement point for powder bulk density is the feed frame of the tableting press if that is possible for a given tablet press design and configuration. Previously, we have experimentally verified that the NIR sensor is fast enough to be used for real time process control [3]. It has been observed that the sensing delay for NIR sensor (micro NIR from JDSU, Milpitas, CA, USA) is around 1 s which is considered to be reasonable for real time control. Strain gauge or load cell are commonly used for measurement of the main compression force. The measurement time for strain gauge or load cell is in milliseconds and it has been used for real time control of the tablet press. Very limited number of methods is currently available for the inline/online measurement of tablet weight and hardness. For example, Checkmaster (Fette, Schwarzenbek, Germany) can be used for inline measurement of tablet weight and hardness. Within our research center (C-SOPS), the efforts are being made to develop the feed-back control relevant faster sensors for hardness and weight measurement that can be used. The sensing delay has been added into the process model to analyze its effect. The NIR sensor has been integrated within the plant and the control platform (DeltaV, Round Rock, TX, USA) through OPC (object linked and embedding [OLE] for process control) communication protocol. OPC is the standard system for the real-time plant data communication between control devices from different manufactures. The NIR sensor has been used for the real time monitoring of the API composition and blend RSD (relative standard deviation) along with monitoring of powder bulk density. The application of NIR based API composition measurement system for feed-back control has been experimentally previously demonstrated [3,15]. This system has been adapted to demonstrate the application of a NIR based powder blend density measurement system for feed-forward/feed-back control system. The process and disturbances time delays are reasonably small making the feed-forward controller realizable.
The process and controller models are represented through a transfer function. The process transfer functions involved in Figure 4 are given in Table 1. In order to obtain the transfer function for feed-forward controller, first a process model (Gd(s)) relating the input variable (or disturbances) to the control variable has been developed. Then, a process model (Gp1(s)) relating the actuator with the control variable has been identified. Subsequently, the characteristic equation for the feed-forward control loop has been derived. For a perfect controller, the characteristic equation can be equated to zero and thereby the model (-Gd(s)/Gp1(s)) for feed-forward controller can be generated.

3.2. Controller Parameters Tuning

Classical PID based feed-back controllers which are easier to implement into the manufacturing plant have been used to control the main compression force, tablet weight and hardness. There are three controllers involved in the process that consist of maximum nine tuning parameters. There are several methods and rules for PID controller parameter tuning [20,22]. In this work, these tuning parameters (gain, integral time constant, derivative time constant) have been tuned using the inbuilt tuning methodology in Simulink (Mathworks, Natick, MA, USA). Simulink has been widely used to design and implement the controller for manufacturing process and therefore it has been used for this study. MathWorks® (Natick, MA, USA) algorithm for tuning PID controllers is based on insuring the closed-loop stability, adequate performance and adequate robustness. This algorithm meets these objectives by tuning the PID parameters to achieve a good balance between performance and robustness. The algorithm designs an initial controller by choosing a bandwidth to achieve that balance, based upon the open-loop frequency response of linearized model. Upon interactively changing the response time, bandwidth, transient response, or phase margin using the PID Tuner interface, the algorithm computes new PID gains. The controller tuning ensures that the closed-loop system tracks reference changes and suppresses disturbances as rapidly as possible. The tuning method uses the rise time, settling time, overshoot, gain margin phase margin and closed-loop stability as an index to assess the performance of the controller parameters tuning. The process flowsheet model simulated in Simulink has been utilized to tune the controller parameters. The anti-windup reset algorithm, which ensures that the controller output lies within the specified upper and lower bounds, has been included [23]. Because of anti-windup, if the bounds are violated, the time derivative of the integral error is set to zero, and the controller output is clipped to the bounds. Once the controller output is back in the range of the bounds, the integral error will change according to the current error. The controllers need to be re-tuned if there are any changes in the control architecture and/or process. The tuned controller parameters are given in Table 3. The parameters reported in Table 3 correspond to the PID controller form given in Equation 1. A standard PID form, inbuilt in Simulink (Mathworks) has been adapted to represent in terms of controller gain, integral and derivative time constants, as given in Equation 1. Controller gain (KC), Integral time constant ( τ I ), derivative time constant ( τ D ) and filter coefficient (N) are the parameters of Equation 1. The filter coefficient sets the location of the poles in the derivative filter. Loop 1 is slave controller and loop 3 is master controller. As given in Table 3, the reset time of loops 3 is 3.52 times that of loop 1 meaning that loop 1 (slave) is faster than loop 3 (master). Note that in a cascade arrangement, the slave loop dynamics needs to be faster than the master loop dynamics. The derivative action has been found to be zero for all loops; therefore, the controller actions are based on proportional and integral actions only.
Table 3. Controller tuning parameters.
ControllersControl VariablesController Gain (KC)Integral Time Constant ( τ I )Derivative Time Constant ( τ D )
Gc1Main compression force0.06224 cm/KN0.361027 s0 s
Gc3Tablet weight0.010000 KN/g1.272265 s0 s
Gc4Tablet hardness0.000010 cm/Kp0.029412 s0 s
For this study, it was assumed that the process model is perfect and, therefore, the feed-forward controller did not require any tuning. However, if process/model mismatch is present, then the feed-forward controller would also require tuning (e.g., tuning the lead time and the lag time, if the controller is implemented as a lead/lag element). More details of the feed-forward control law, tuning and the impact of process/model mismatch can be found in scientific literatures (e.g., Marlin, 2000 [24]). It should be noted that for implementation of the control system, whole process model is not needed and only the models involved in feed-forward control algorithm are required. For a best feed-forward controller performance, the models involved in feed-forward control logic are desired to be as accurate as possible. The pharmaceutical manufacturing processes are normally very well designed (as required by regulator); therefore, through a set of experiments it is possible to obtain the accurate models to be used in the feed-forward controller. Note that for implementation of proposed control system into plant, only feed-forward controller model is needed and complete process models are not required. Feed-forward controller model needs to be re-developed if there are any changes in plant and materials involved.
G c ( S ) = K C [ 1 + 1 τ i ( 1 S ) + τ D ( N S S + N ) ]

4. Results and Discussion

Prior to the implementation of the control system to the continuous tablet manufacturing pilot-plant, the performance of the designed feed-forward/feed-back control system is evaluated using process simulation as described in this section. The model-based performance evaluation of the control system reduces the time and resources needed for the implementation of the control system into the pilot-plant and increases the chance of success during implementation. In this section, the ability of the control system to track the set point and reject the disturbances is evaluated. For set point tracking, the step changes in the set point are applied, and the controller is allowed to track those changes. For disturbance rejection, structural disturbances (e.g., sinusoidal) and random disturbances are introduced during closed-loop operation.
A step change in the hardness set point has been introduced while keeping the tablet weight set point at a constant value. The blend density acts as the disturbance and can affect the tablet weight and hardness significantly. The blend density can change because of many factors. For example, the particle size of the powder, lubrication level and shear applied in blender can change the blend density. Since the powder is filled in the tablet press die by volume (not by weight), different blend densities can lead to different tablet weight and hardness. Random disturbances have been added to the blend density throughout the operation. A step change in the blend density has been also introduced at t = 2500 s in order to analyze its effects.
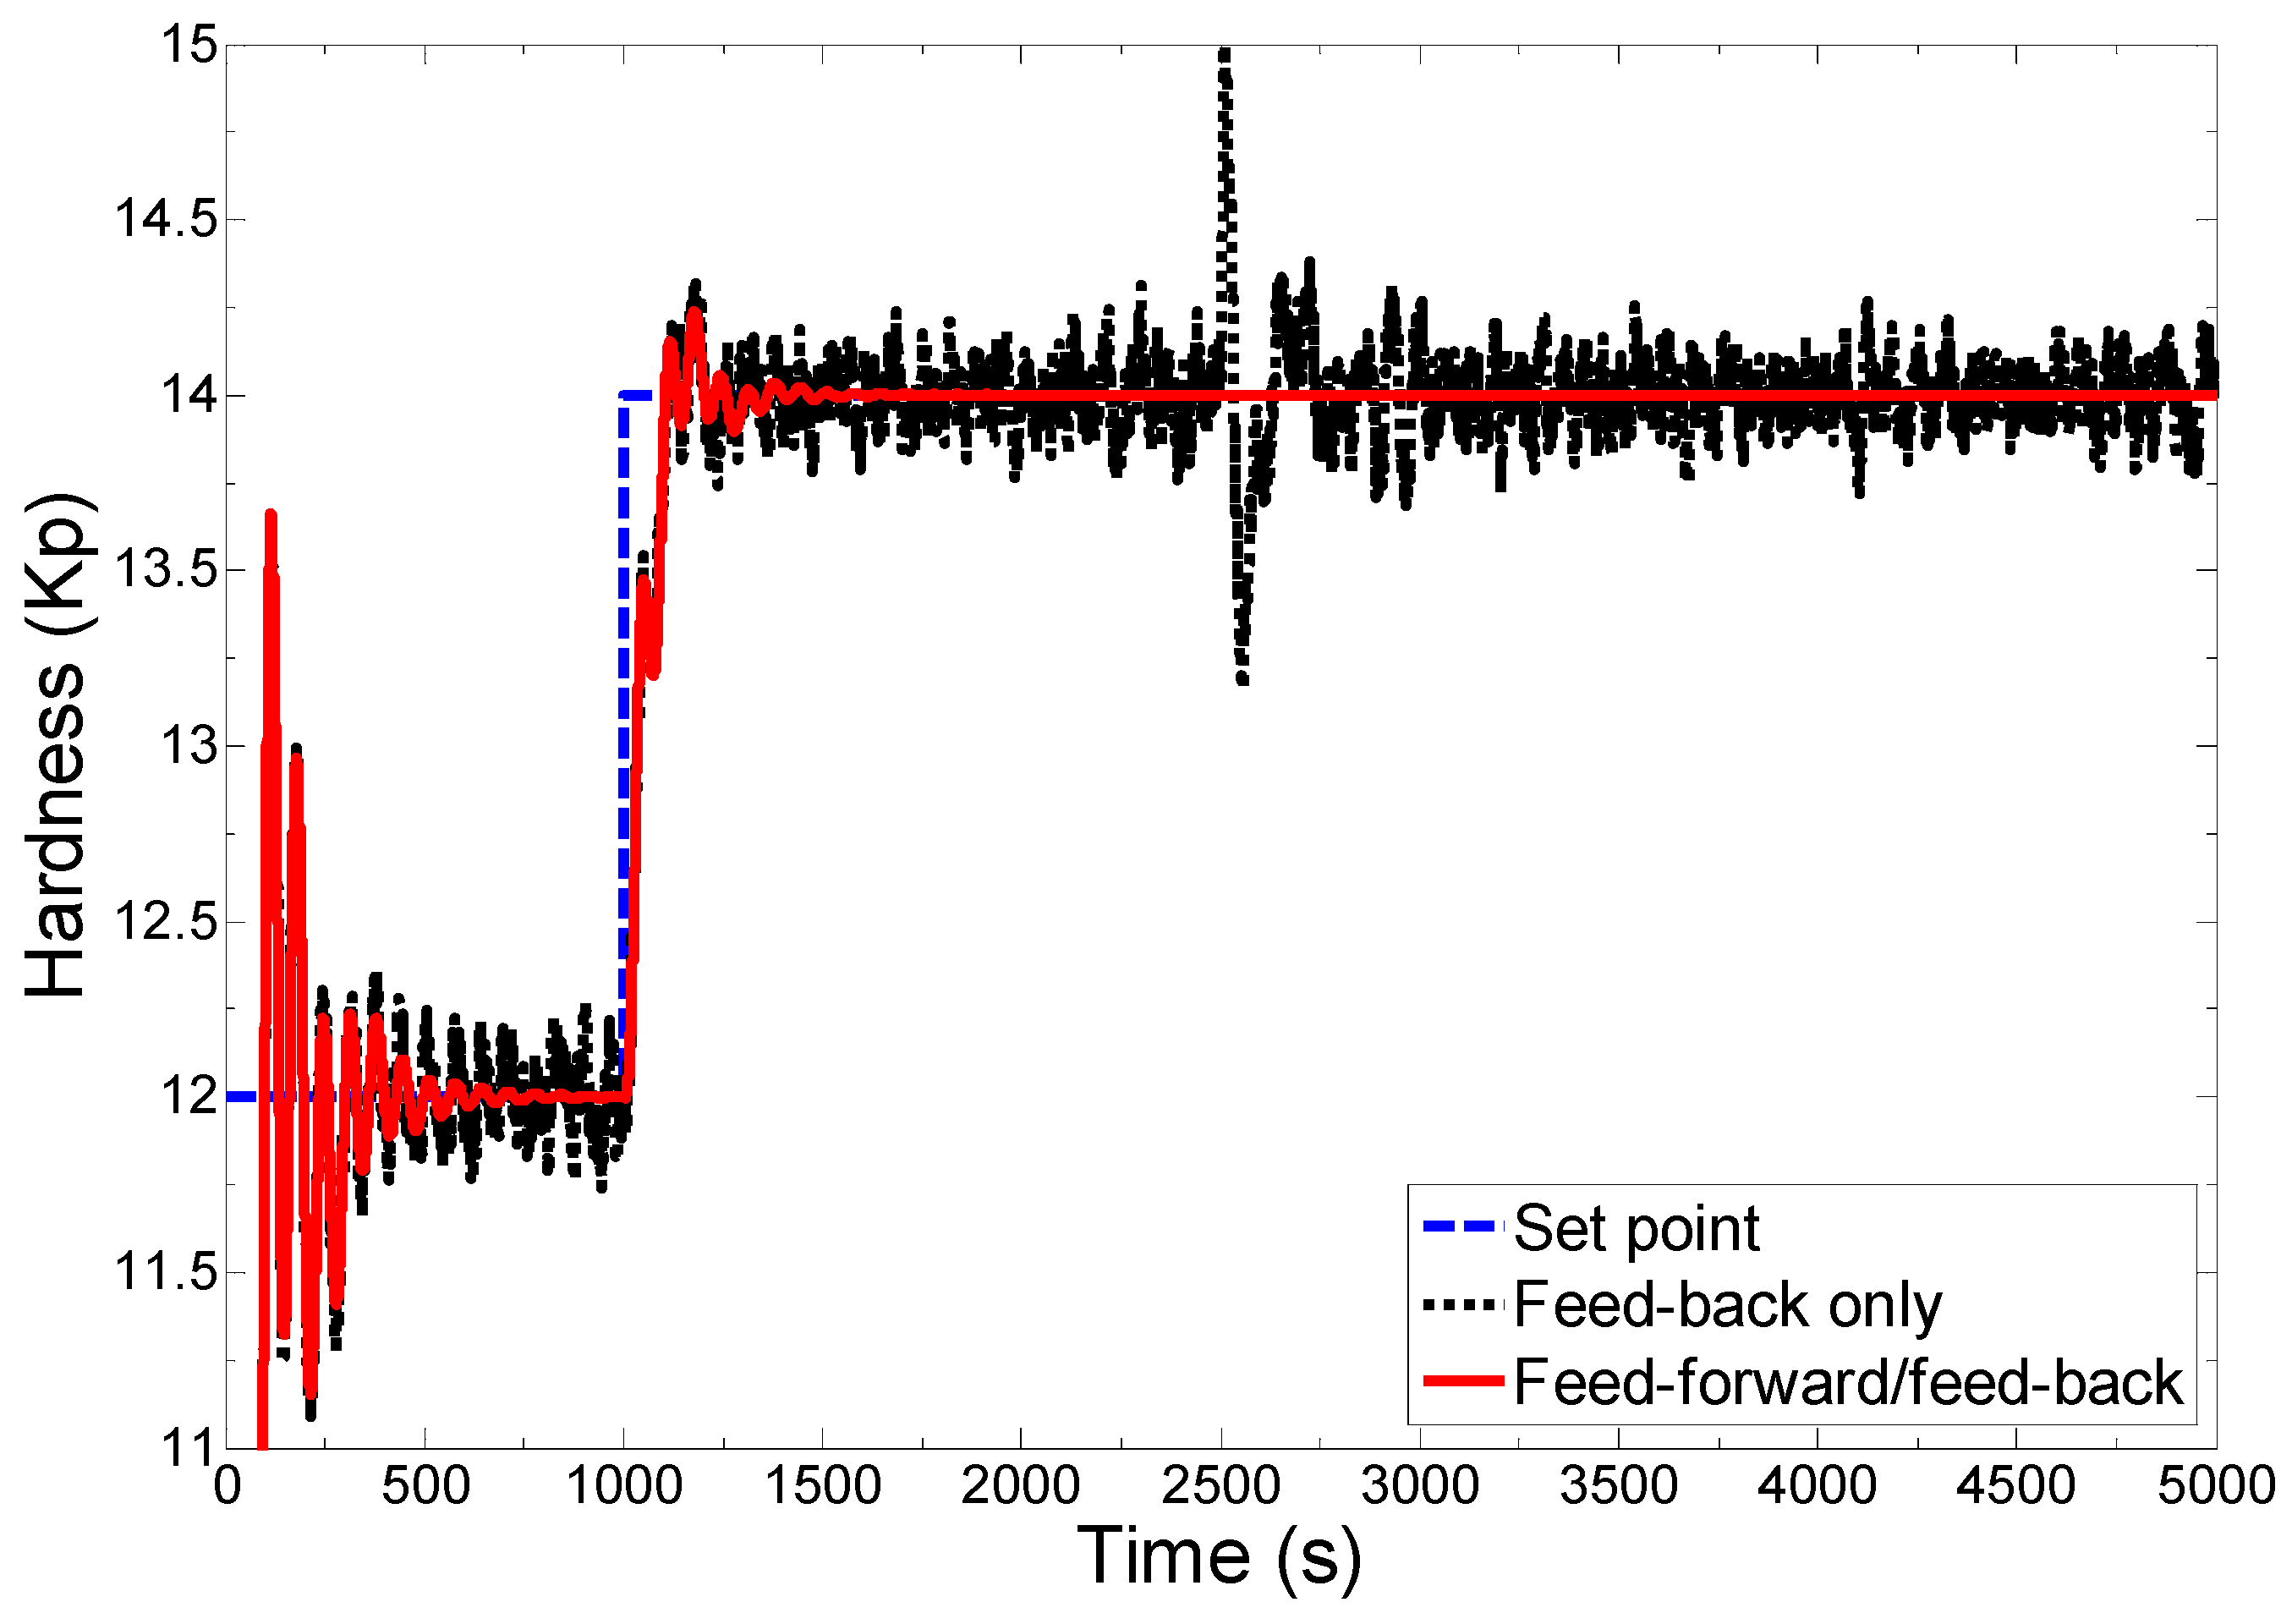
Figure 5 shows a closed-loop response of the tablet hardness under the combined feed-forward/feed-back control strategy and feed-back only control strategy. As shown in the figure, under the combined control strategy, the feed-forward controller rejects the variation in the blend density before it can affect the hardness. Therefore, under the combined control scheme, the tablet hardness has been controlled more effectively. A small oscillation can be seen at process startup and at the point where the step change in the hardness set point has been made, which is acceptable. As desired for a good controller, the rise time is less and decay ratio is high. A significant variation in the achieved hardness can be seen in case of only feed-back control scheme (see Figure 5). This variation is because of random variation in the blend density. It should be noted that the hardness variation is more at t = 2500 s where the step change in the blend density has been introduced. The results shown in Figure 5 demonstrate the advantages of coupling feed-forward controller with the feed-back control system. It should be noted that only feed-forward control is practically insignificant because there may always be some unknown disturbances that cannot be measured. Feed-back control system is essential to reject the unknown disturbances that can occur during plant operation.
Figure 5. Comparison of combined feed-forward/feed-back control strategy with feed-back only control strategy for hardness control.
Processes 03 00339 g005
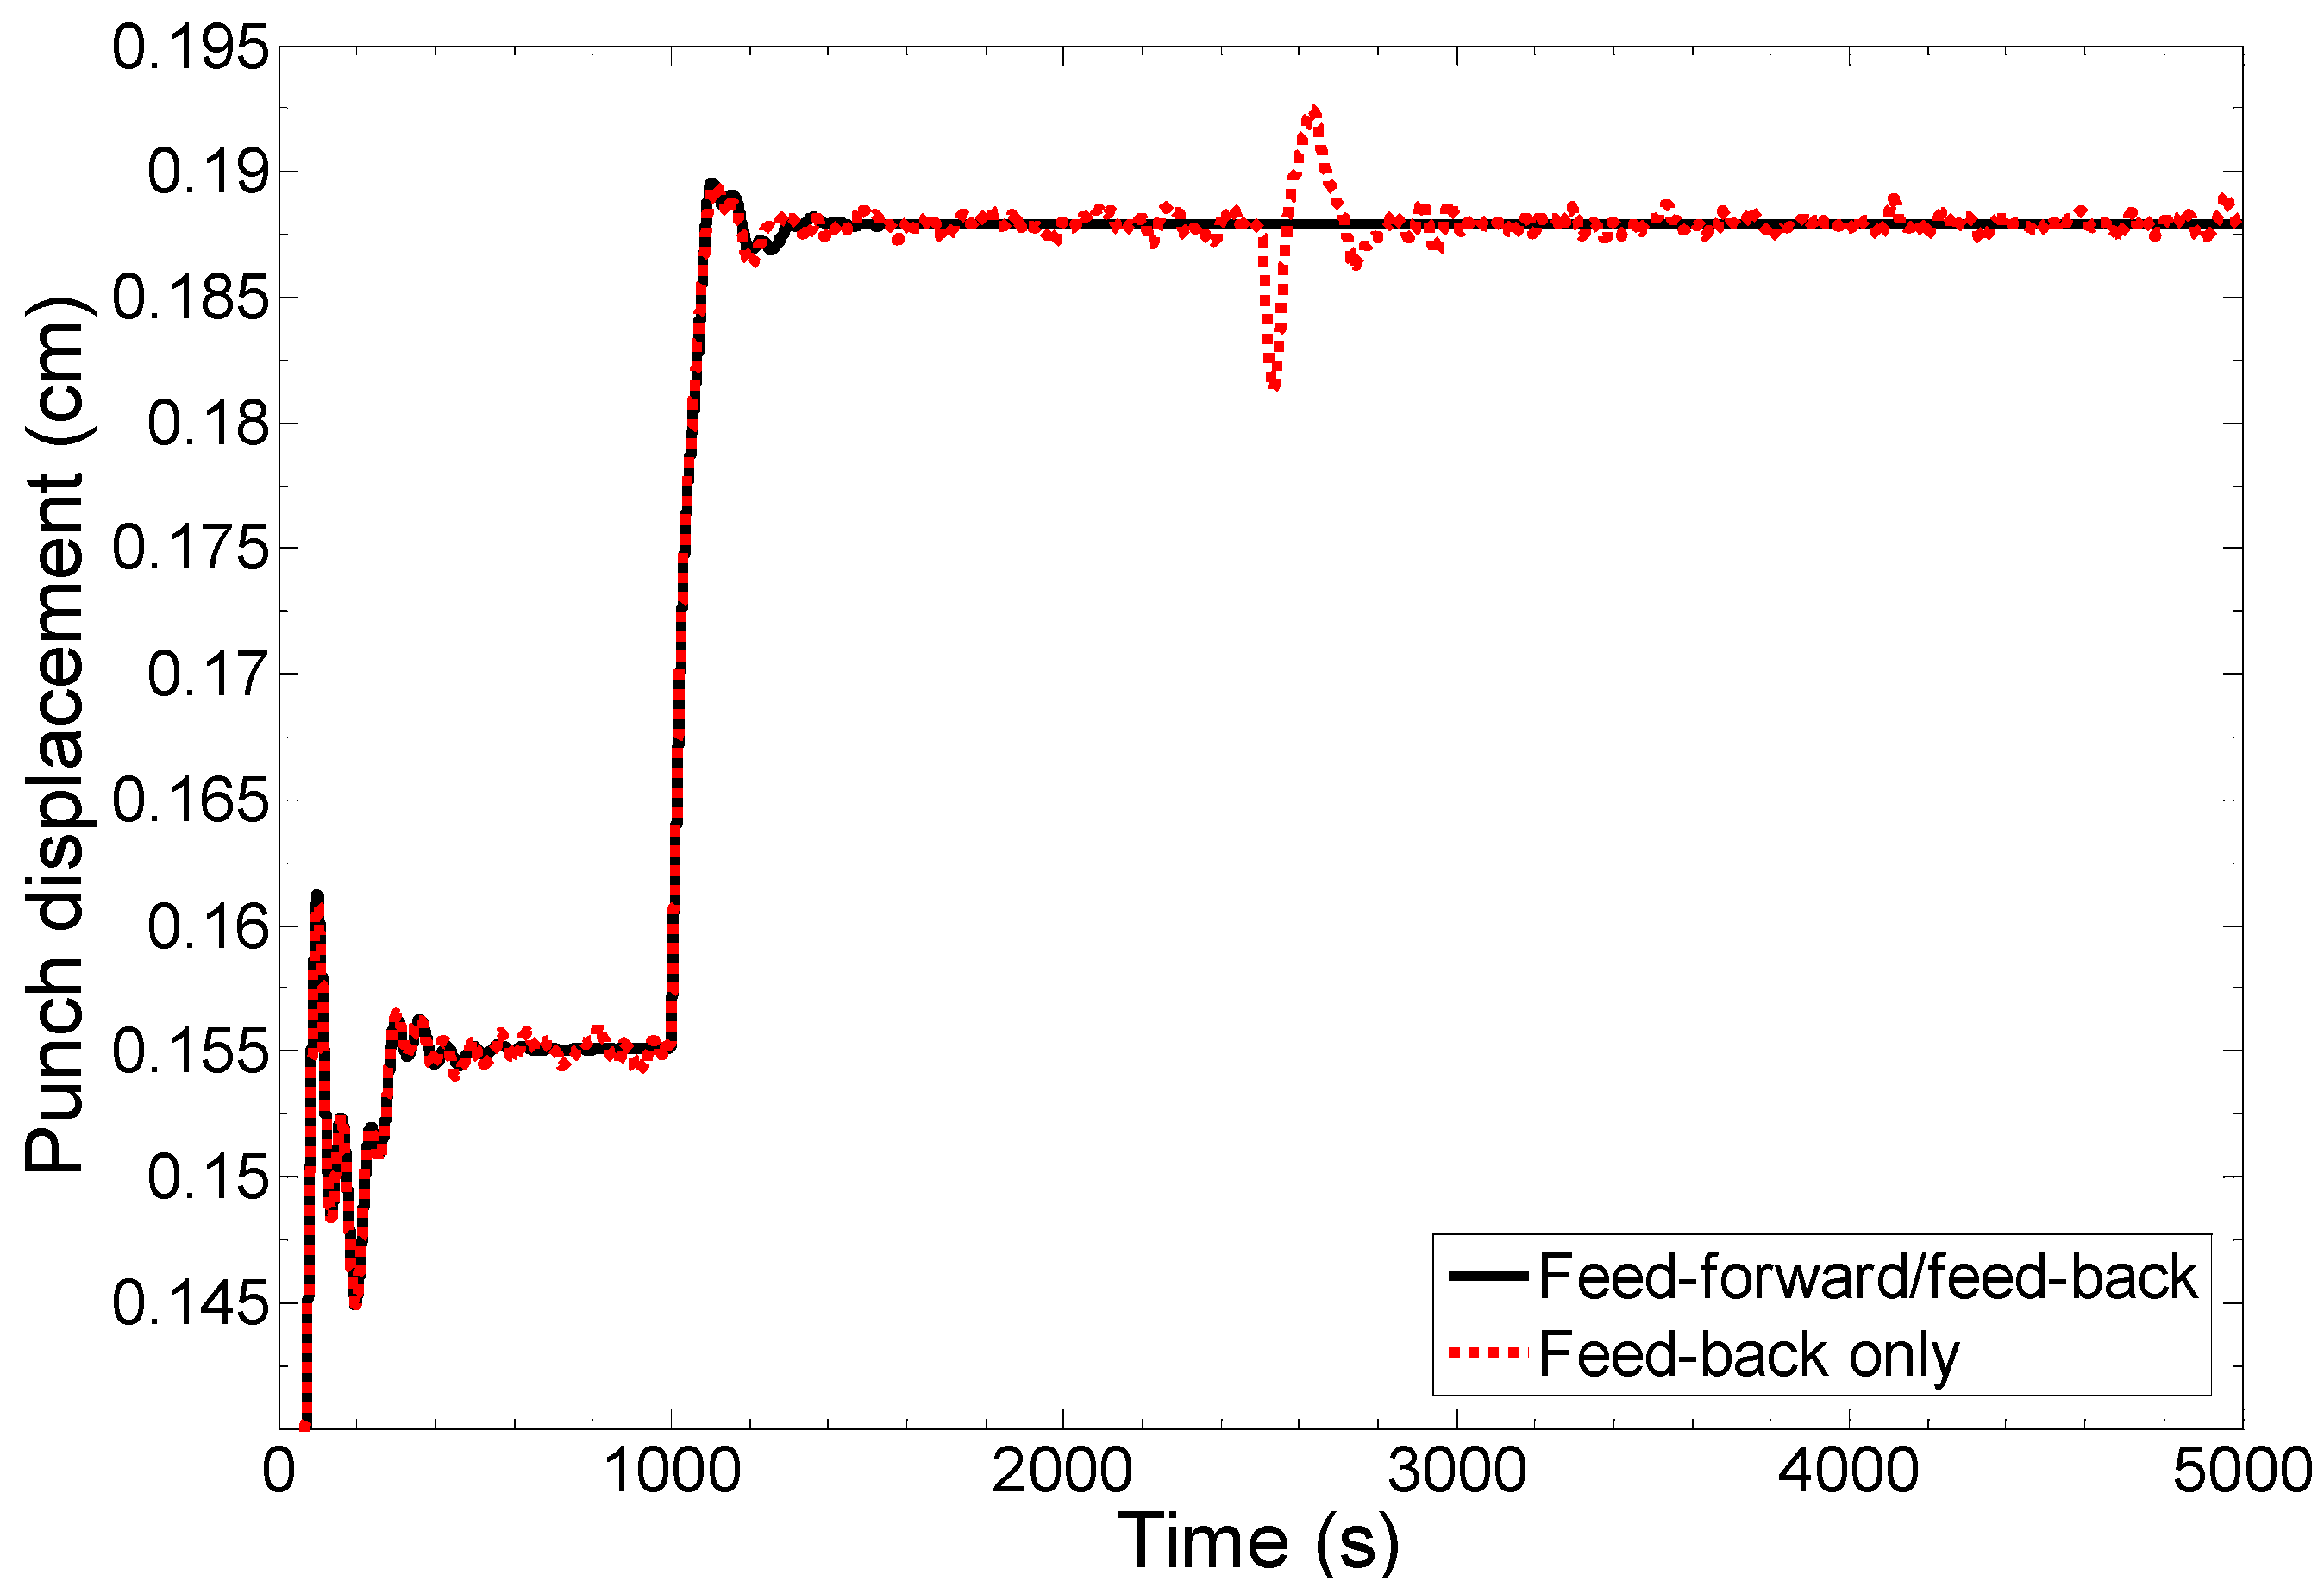
Actuators values obtained from combined feed-forward/feed-back control strategy with that obtained from feed-back only control strategy for tablet hardness control is shown in Figure 6. As shown in the figure, the combined control strategy provides a more consistent and steady actuator response in comparison to the feed-back only control strategy. The oscillations in the actuator obtained by feed-back only control strategy can be attributed to random disturbances introduced in the powder bulk density. In case of a feed-back only control strategy, the hardness is affected by the disturbances introduced in the powder bulk density while, in case of combined control strategy, this effect is compensated proactively. A significant oscillation can be seen at t = 2500 s where a step change in the powder bulk density has been introduced.
Figure 6. Comparison of actuators obtained from combined feed-forward/feed-back control strategy with feed-back only control strategy for hardness control.
Processes 03 00339 g006
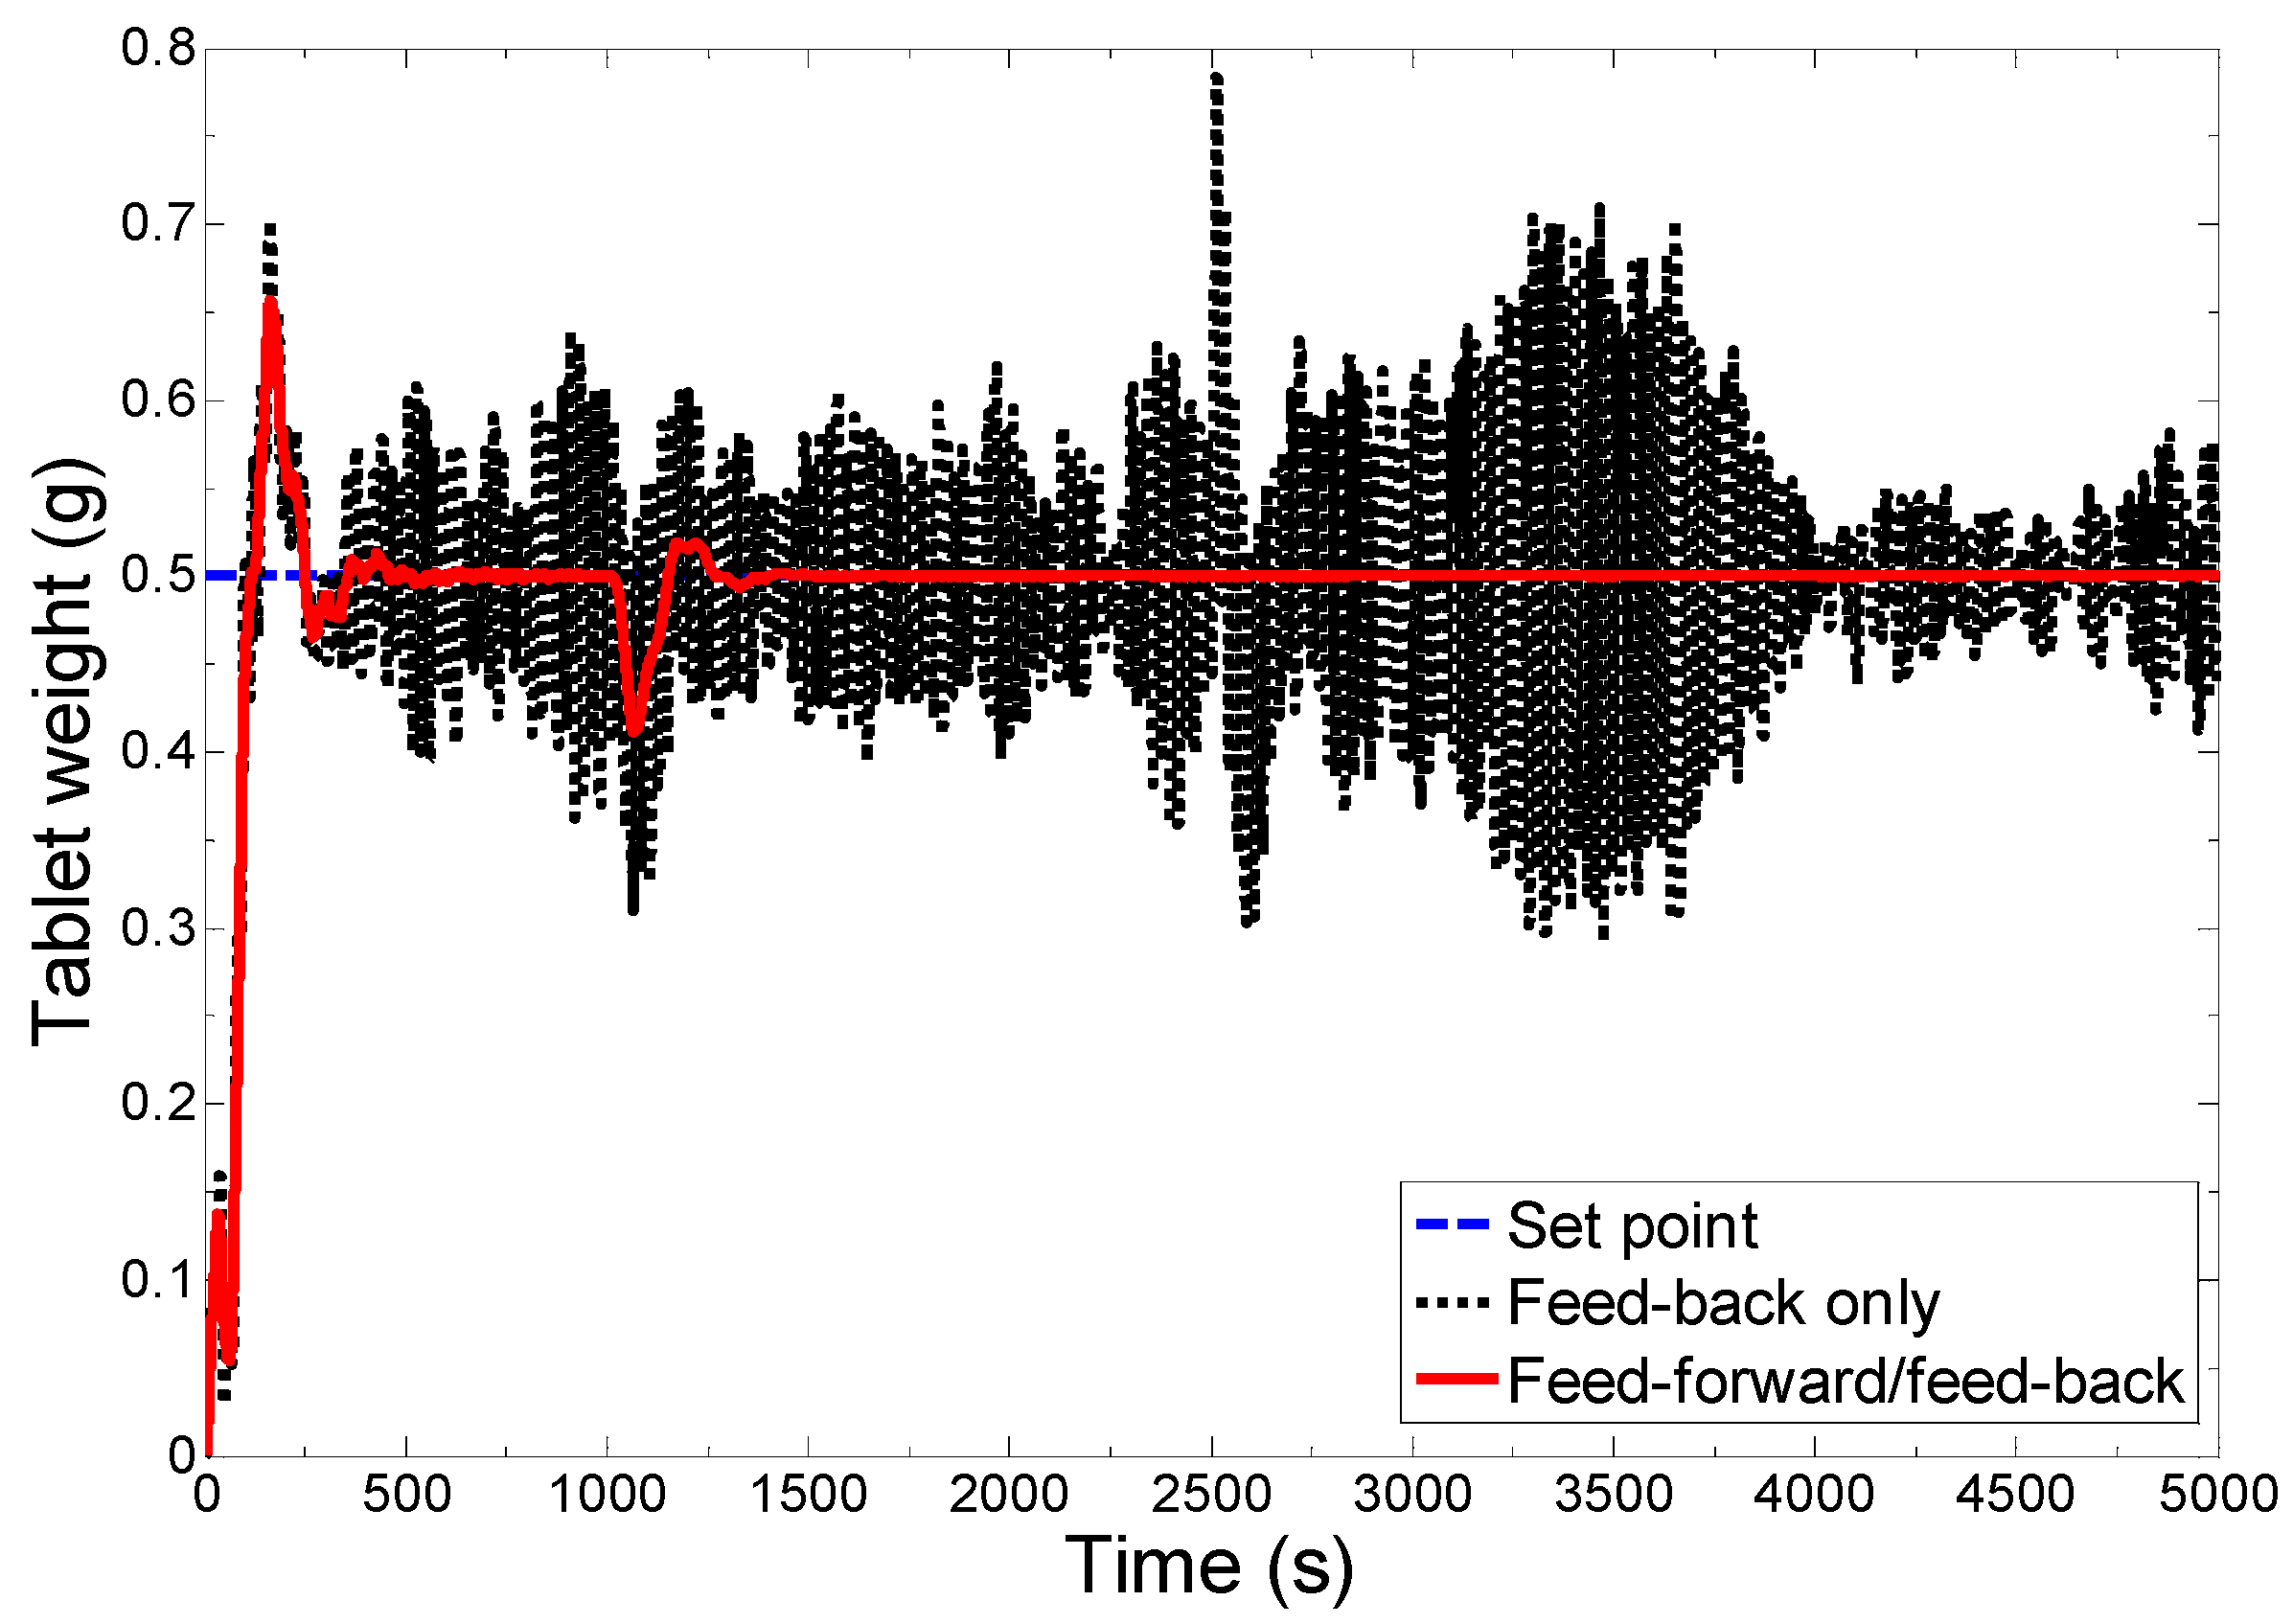
The closed-loop response of the tablet weight under the combined feed-forward/feed-back control strategy and only feed-back control strategy is shown in Figure 7. As shown in the figure, the variation in tablet weight is less under combined control scheme in compare to only feed-back control scheme. Under the combined control scheme, a small oscillation can be seen at startup, which is acceptable because the decay ratio is high. Higher decay ratios reduce the oscillation and overshoot faster. A small oscillation can be seen at t =1000 s where the step change in the hardness set point has been made and this is essentially because the hardness and weight control loops are highly interactive. Note that the step change in the hardness set point has been made for demonstration of the set point tracking ability of the designed control system and in practice for a given formulation hardness and weight set points need to be fixed. At t = 2500 s, a step change in the blend density has been introduced but the combined feed-forward/feed-back control system has efficiently rejected its effect and thereby a consistent desired tablet weight has been achieved. In the case of the feed-back only control scheme, the variation in achieved tablet weight is very high and corresponds to the random variations introduced to the blend density. The deviation of the tablet weight from the desired set point in the interval of 2500–2600 s is significantly higher because of the introduced step change in the blend density. The tablets produced in this range need to be rejected.
Figure 7. Comparison of the performance of the combined feed-forward/feed-back control scheme with feed-back only control scheme for tablet weight control.
Processes 03 00339 g007
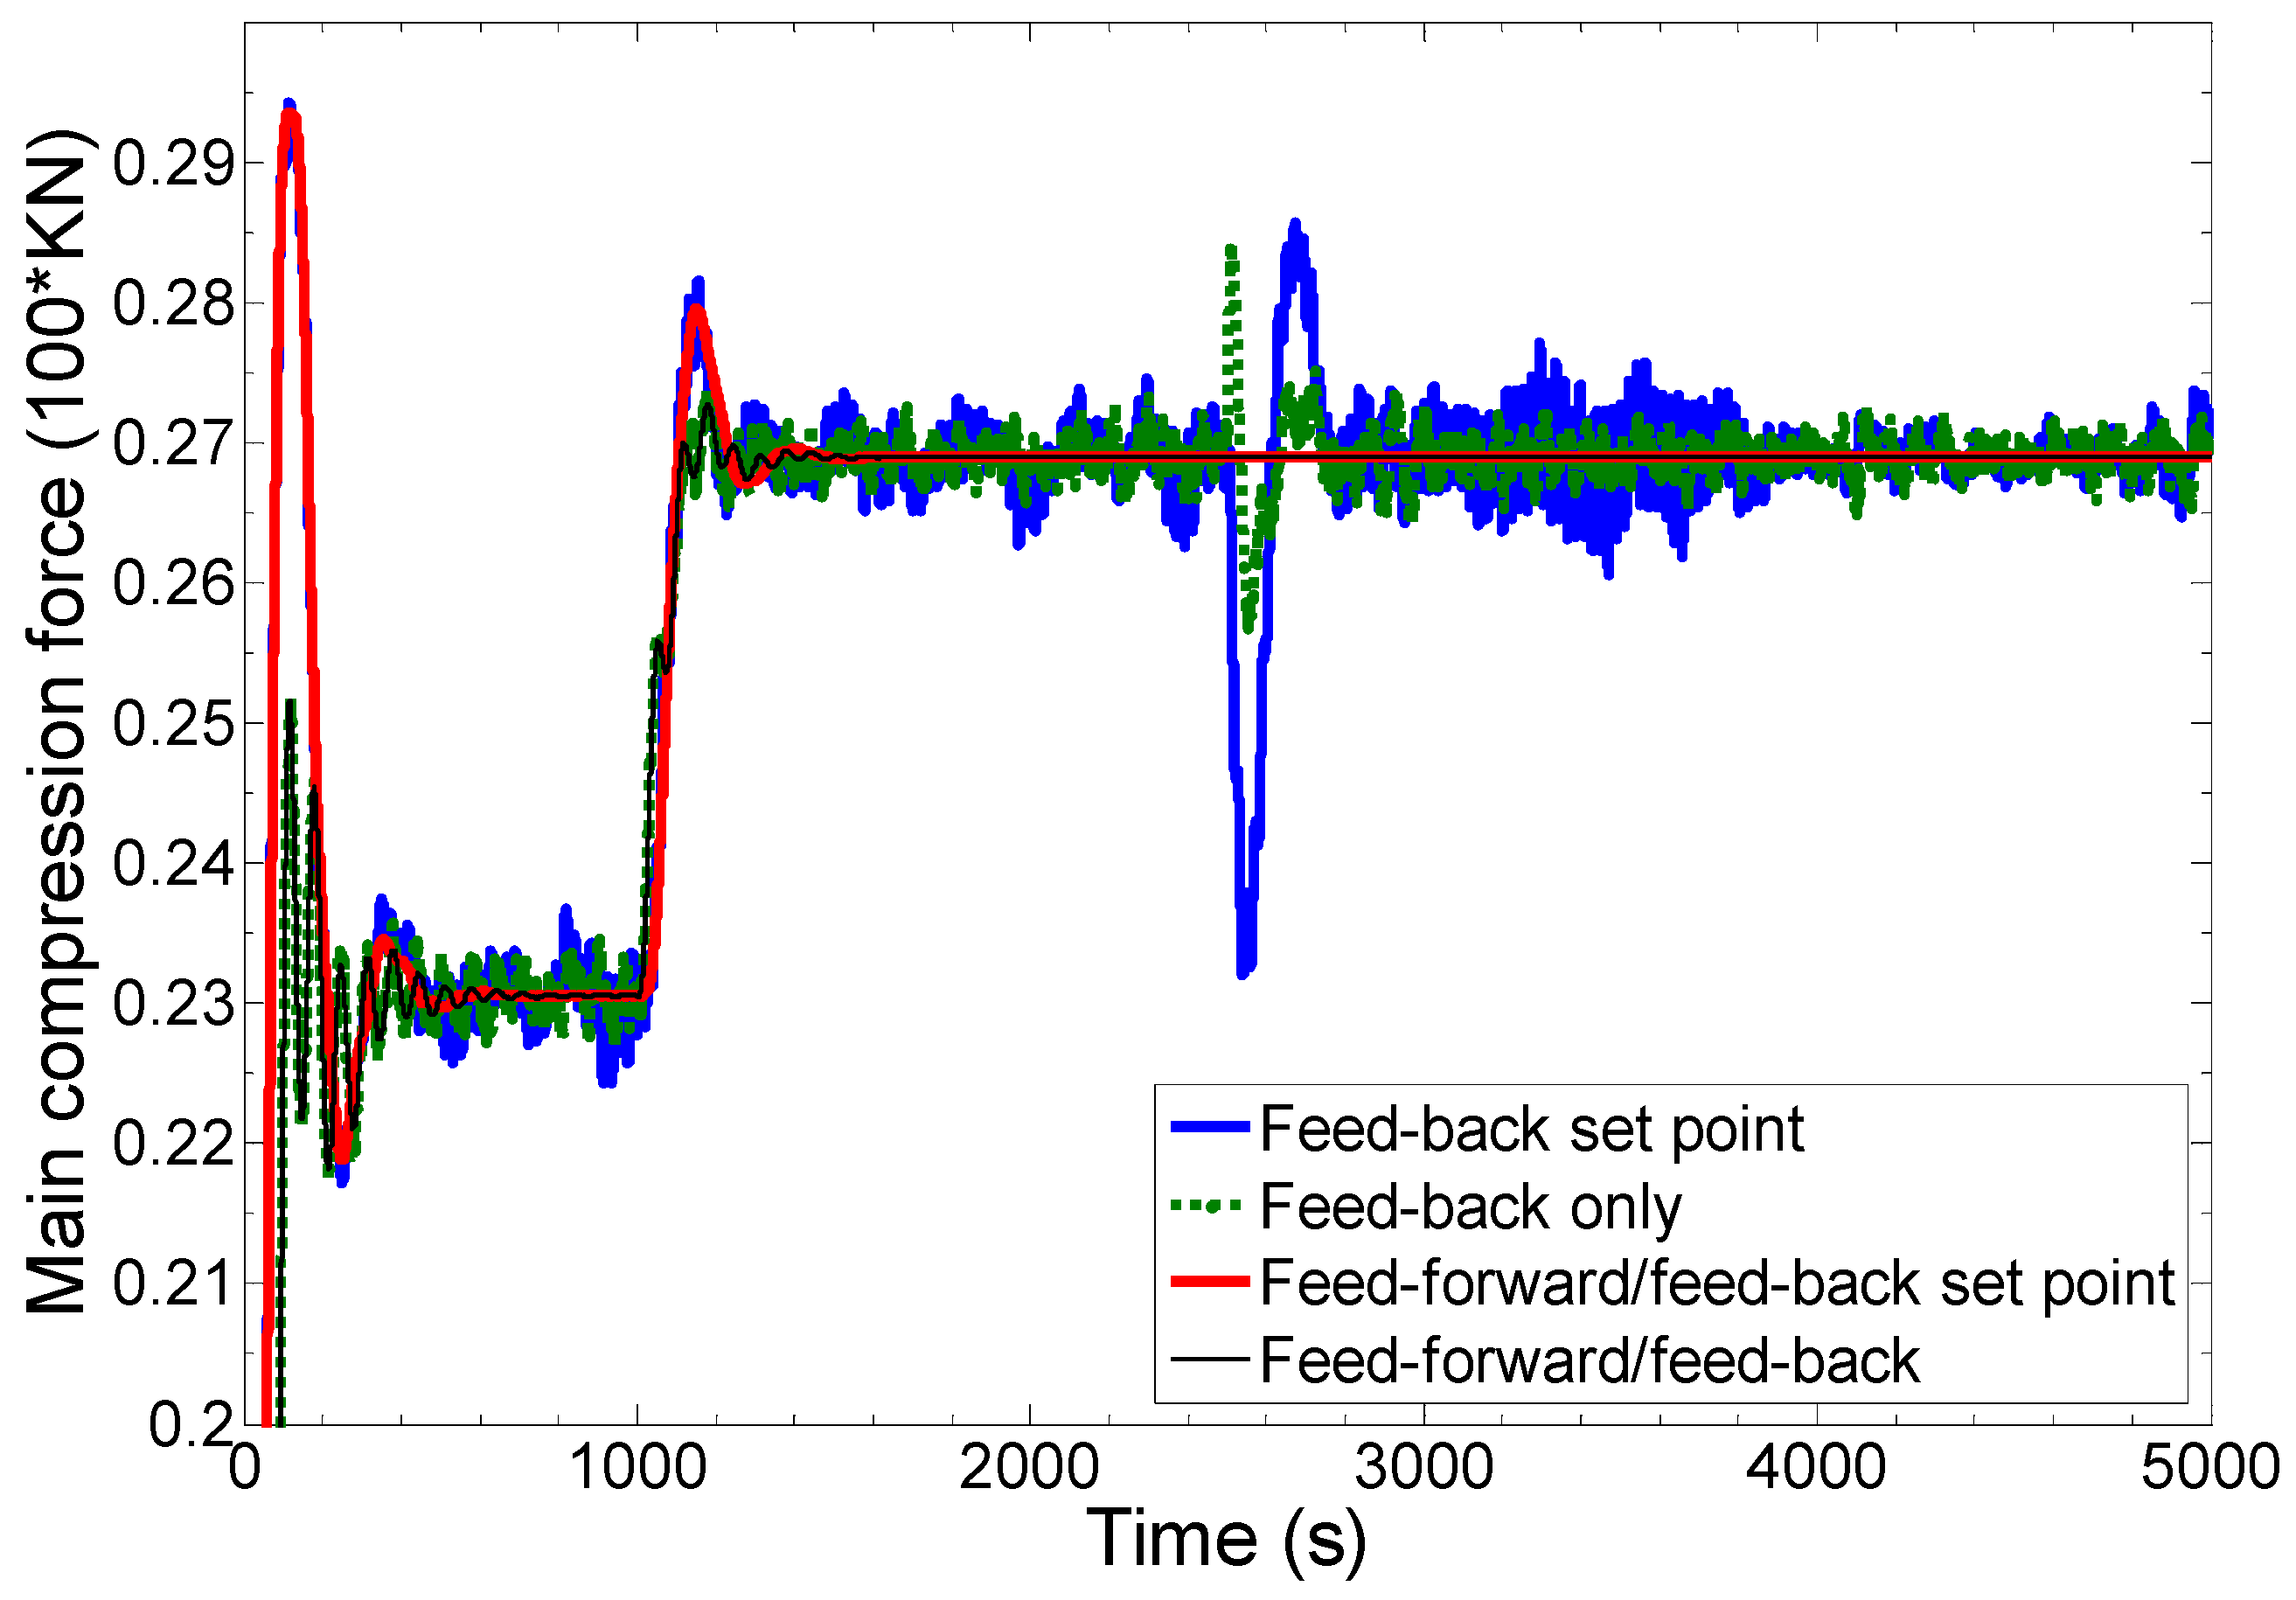
The main compression force has been controlled in real time through a slave controller. The performance of the tablet weight and hardness master controller depends significantly on the performance of the slave ‘main compression force’ controller. The closed-loop response of the main compression force under the combined and feed-back only control strategy is shown in Figure 8. In each case, the set point of the main compression force has been obtained by master controller specifically designed to control the tablet weight. As shown in Figure 8, in the case of the combined feed-forward/feed-back control scheme, the main compression force is controlled at the set pint generated by master controller. A small oscillation can be seen at startup and at the point where step change in the hardness set point has been made. The decay ratio is however higher as is desired for a well-tuned controller. The step change in the main compression force set point (generated by master controller) can be seen at t = 1000 s. This step change in the main compression force set point is to achieve the step change in the hardness. More compression force is needed to produce the higher hardness tablet. In spite of an increase in compression force, the tablet weight has not been increased meaning that this increase in compression force is because of increased upper punch displacement while keeping the consistent fill depth (see Figure 5, Figure 6, Figure 7 and Figure 8). In the case of the feed-back only control scheme, first the main compression force set point generated from master controller is oscillatory and second this set point has not been tracked precisely. The variation in the achieved main compression force under the feed-back only control scheme can be seen in Figure 8 which is because of variation in the blend density. The major variation can be seen at t = 2500 s where a step change in the blend density has been introduced.
Figure 8. Closed-loop response of main compression force (performance of slave controller).
Processes 03 00339 g008
Results shown in Figure 5, Figure 6, Figure 7 and Figure 8 demonstrate that the tablet weight and hardness control loops have been decoupled so that both variables can be controlled simultaneously. In order to verify the performance of decoupling control mechanism, a step change in the hardness set point has been made (see Figure 5) while keeping the tablet weight set point at a constant value (see Figure 7). As shown in Figure 5, Figure 6 and Figure 7, the tablet hardness value has been changed successfully while maintaining a consistent tablet weight. Figure 8 shows that in order to achieve the increased tablet hardness, the set point of the main compression force has been increased. Note that the hardness set point has been changed just for demonstration of the performance of decoupling control mechanism and set point tracking ability of the control system and, for a given formulation, the hardness needs to be consistent throughout the operation.
The response of the fill depth is shown in Figure 9. As shown in the figure under the feed-forward/feed-back control scheme, the control system changes the fill depth more precisely to compensate for the disturbances introduced in the powder bulk density. More change can be seen at t = 1000 s where the step change in hardness set point has been introduced. A step change in the fill depth can be seen at t = 2500 s where step change in the powder bulk density has been introduced. Note that, there are also random disturbances throughout the operation. The fill depth was within the acceptable range during closed-loop operation indicating that the proposed control system is feasible.
Figure 9. Comparison of actuators obtained from combined feed-forward/feed-back control strategy with feed-back only control strategy for main compression force control.
Processes 03 00339 g009
The set point of the proposed control system can be changed within a feasible operating range of a tablet press. This range depends on many factors such as tablet press configuration and the properties of the raw materials. The actuators should be within the feasible operating range in order to maintain the control variables within the control limits. For example, in case of Kikusui rotary tablet press, the powder filling depth range is 1–15 mm. Maximum tablet diameter is 16 mm and tablet thickness range is 0–5 mm. The range of tablet weight and hardness that can be produced from a tablet press also depends on the raw materials (API, Excipient, Lubricant) and blend properties along with tablet press specifications. Some of the ranges mentioned above can be changed by changing the tooling used in the tablet press. The control architecture will be same for different tablet presses and raw materials but the controller parameters need to be returned.
5. Conclusions

A well-designed control system incorporating the feed-forward and feed-back control algorithm is developed in this work to obtain a precise pre-defined end-product quality for a pharmaceutical product as mandated by regulatory authorities. The combined control strategy incorporates the advantages of both feed-forward and feed-back control strategies. The feed-forward control strategy rejects the effects of the measured process disturbances proactively before they can influence the product quality and, thereby, minimizes the rejection, while the feed-back control strategy takes into account the effects of other unknown process disturbances in real time. The performance of the combined control strategy is found to be better than only feed-back control. The proposed strategy is complementary to the classical feed-back control approach and should thus have a broad application range for QbD-based manufacturing. The tablet weight and hardness control loops have been also decoupled so that these variables can be controlled simultaneously. For this study, it was assumed that the process model is perfect, which is an ideal scenario, and in practice, there could be some model-plant mismatch. Future work includes the implementation of the designed combined feed-forward/feed-back control system in our continuous tablet manufacturing pilot-plant through commercially available hardware (e.g., Delta V) and the control interface (e.g., OPC).

Acknowledgements

This work is supported by the National Science Foundation Engineering Research Center on Structured Organic Particulate Systems, through Grant NSF-ECC 0540855.

Author Contributions

The research work reported in this manuscript is conducted by Ravendra Singh and supervised by Fernando J. Muzzio, Marianthi Ierapetritou and Rohit Ramachandran.

Nomenclature

Abbreviations
APIActive Pharmaceutical Ingredient
APAPAcetyl-Para-Aminophenol
CPPCritical Process Parameter
CQACritical Quality Attribute
DTDead Time
MgStMagnesium Stearate
MCFMain Compression Force
NIRNear Infrared
OPCOLE (Object linked and embedding) for process control
PATProcess Analytical Technology
PIDProportional Integral Derivative
QbDQuality by Design
QbTQuality by Testing
RSDRelative Standard Deviation
SMCCSilicified Microcrystalline Cellulose
SPSet point
SymbolsVariables
Gd(s)Disturbance transfer function model
Gp(s)Process transfer function model
Gc(s)Controller transfer function model
dDisturbances
uActuator
yControl variable
SubscriptDescription
ddisturbance
pprocess
ccontroller
1,2,3,4Process or controller numbers

Conflicts of Interest

The authors declare no conflict of interest.

References

  1. FDA. PAT—A Framework for Innovative Pharmaceutical Development, Manufacturing, and Quality Assurance; US Food and Drug Administration: Silver Spring, MD, USA, 2004. Available online: http://www.fda.gov/downloads/Drugs/Guidances/ucm070305.pdf (accessed on 19 March 2015).
  2. FDA. Guidance for Industry, Q8 (R2) Pharmaceutical Development; US Food and Drug Administration: Silver Spring, MD, USA, 2007. Available online: http://www.fda.gov/downloads/Drugs/Guidances/ucm073507.pdf (accessed on 19 March 2015).
  3. Singh, R.; Sahay, A.; Karry, K.M.; Muzzio, F.; Ierapetritou, M.; Ramachandran, R. Implementation of a hybrid MPC-PID control strategy using PAT tools into a direct compaction continuous pharmaceutical tablet manufacturing pilot-plant. Int. J. Pharm. 2014, 473, 38–54. [Google Scholar] [CrossRef] [PubMed]
  4. Igne, B.; Juan, A.D.; Jaumot, J.; Lallemand, J.; Preys, S.; Drennen, J.K.; Anderson, C.A. Modeling strategies for pharmaceutical blend monitoring and end-point determination by near-infrared spectroscopy. Int. J. Pharm. 2014, 473, 219–231. [Google Scholar] [CrossRef] [PubMed]
  5. Sen, M.; Singh, R.; Vanarase, A.; John, J.; Ramachandran, R. Multi-dimensional population balance modeling and experimental validation of continuous powder mixing processes. Chem. Eng. Sci. 2012, 80, 349–360. [Google Scholar] [CrossRef]
  6. Boukouvala, F.; Niotis, V.; Ramachandran, R.; Muzzio, F.; Ierapetritou, M. An integrated approach for dynamic flowsheet modeling and sensitivity analysis of a continuous tablet manufacturing process: An integrated approach. Comput. Chem. Eng. 2012, 42, 30–47. [Google Scholar] [CrossRef]
  7. Vanarase, A.; Alcal, M.; Rozo, J.; Muzzio, F.; Romaach, R. Real-time monitoring of drug concentration in a continuous powder mixing process using NIR spectroscopy. Chem. Eng. Sci. 2010, 65, 5728–5733. [Google Scholar] [CrossRef]
  8. García-Munoz, S.; Dolph, S.; Ward, H.W., II. Handling uncertainty in the establishment of a design space for the manufacture of a pharmaceutical product. Comput. Chem. Eng. 2010, 34, 1098–1107. [Google Scholar] [CrossRef]
  9. Myerson, A.S.; Krumme, M.; Nasr, M.; Thomas, H.; Braatz, R.D. Control Systems Engineering in Continuous Pharmaceutical Manufacturing. J. Pharm. Sci. 2015, 104, 832–839. [Google Scholar] [CrossRef] [PubMed]
  10. Hsu, S.; Reklaitis, G.V.; Venkatasubramanian, V. Modeling and control of roller compaction for pharmaceutical manufacturing. Part I: Process dynamics and control framework. J. Pharm. Innov. 2010, 5, 14–23. [Google Scholar]
  11. Hsu, S.; Reklaitis, G.V.; Venkatasubramanian, V. Modeling and control of roller compaction for pharmaceutical manufacturing. Part II: Control and system design. J. Pharm. Innov. 2010, 5, 24–36. [Google Scholar]
  12. Burggraeve, A.; Tavares da Silva, A.; Van den Kerkhof, T.; Hellings, M.; Vervaet, C.; Remon, J.P.; Vander Heyden, Y.; Beer, T.D. Development of a fluid bed granulation process control strategy based on real-time process and product measurements. TALANTA 2012, 100, 293–302. [Google Scholar] [CrossRef] [PubMed] [Green Version]
  13. Bardin, M.; Knight, P.C.; Seville, J.P.K. On control of particle size distribution in granulation using high-shear mixers. Powder Technol. 2004, 140, 169–175. [Google Scholar] [CrossRef]
  14. Sanders, C.F.W.; Hounslow, M.J.; Doyle, F.J., III. Identification of models for control of wet granulation. Powder Technol. 2009, 188, 255–263. [Google Scholar] [CrossRef]
  15. Singh, R.; Sahay, A.; Muzzio, F.; Ierapetritou, M.; Ramachandran, R. Systematic framework for onsite design and implementation of the control system in continuous tablet manufacturing process. Comput. Chem. Eng. J. 2014, 66, 186–200. [Google Scholar] [CrossRef]
  16. Singh, R.; Ierapetritou, M.; Ramachandran, R. System-wide hybrid model predictive control of a continuous pharmaceutical tablet manufacturing process via direct compaction. Eur. J. Pharm. Biopharm. 2013, 85, 1164–1182. [Google Scholar] [CrossRef] [PubMed]
  17. Kawakita, K.; Ludde, K.H. Some considerations on powder compression equations. Powder Technol. 1971, 4, 61–68. [Google Scholar] [CrossRef]
  18. Kuentz, M.; Leuenberger, H. A new model for the hardness of a compacted particle system, applied to tablets of pharmaceutical polymers. Powder Technol. 2000, 111, 143–145. [Google Scholar] [CrossRef]
  19. Kimber, J.A.; Kazarian, S.G.; Stepánek, F. Microstructure-based mathematical modelling and spectroscopic imaging of tablet dissolution. Comput. Chem. Eng. 2011, 35, 1328–1339. [Google Scholar] [CrossRef]
  20. Seborg, D.E.; Edgar, T.F.; Mellichamp, D.A. Process Dynamics and Control, 2nd ed.; John Wiley & Sons, Inc.: Hoboken, NJ, USA, 2004. [Google Scholar]
  21. Davies, C.E.; Lankshear, R.C.; Webster, E.S. Direct measurement of the bulk density of cohesive particulate materials by a quasicontinuous in-line weighing method. Proceedings of Chemeca 2011, Sydney, Australia, 18–21 September 2011; Available online: http://search.informit.com.au/documentSummary;dn=173928395929049;res=IELENG (accessed on 19 March 2015).
  22. Ziegler, J.G.; Nichols, B. Optimum settings for automatic controllers. Trans. ASME 1942, 64, 759–765. [Google Scholar]
  23. Ogunnaike, B.A.; Ray, W.H. Process Dynamics, Modeling, and Control; Oxford University Press Inc.: New York, NY, USA, 1994. [Google Scholar]
  24. Marlin, T.E. Process Control; McGraw-Hill, Inc.: Blacklick, OH, USA, 2000. [Google Scholar]