Abstract
The fate choice of human embryonic stem cells (hESCs) is controlled by complex signaling milieu synthesized by diverse chemical factors in the growth media. Prevalence of crosstalks and interactions between parallel pathways renders any analysis probing the process of fate transition of hESCs elusive. This work presents an important step in the evaluation of network level interactions between signaling molecules controlling endoderm lineage specification from hESCs using a statistical network identification algorithm. Network analysis was performed on detailed signaling dynamics of key molecules from TGF-β/SMAD, PI3K/AKT and MAPK/ERK pathways under two common endoderm induction conditions. The results show the existence of significant crosstalk interactions during endoderm signaling and they identify differences in network connectivity between the induction conditions in the early and late phases of signaling dynamics. Predicted networks elucidate the significant effect of modulation of AKT mediated crosstalk leading to the success of PI3K inhibition in inducing efficient endoderm from hESCs in combination with TGF-β/SMAD signaling.
1. Introduction
Human embryonic stem cells (hESCs) are a promising raw material for regenerative medicine applications because of their potential for directed differentiation into clinically relevant cell types. In differentiating hESCs to lineages of pancreas, liver, etc., an important first step is the induction of Definitive Endoderm (called endoderm henceforth) [1]. The quality of later stage maturation is dictated by the initial pathway of endoderm differentiation [2]. Extensive research over a decade have given rise to alternate protocols for endoderm induction of hESCs that employ unique combinations of growth factors and small molecules [3,4,5,6,7]. These protocols aim to recapitulate signaling dynamics mimicking in vivo development of endoderm. Among these signaling mediators, activation of TGF-β/SMAD2,3 pathway by ligand molecules like Activin A (called Activin henceforth) has been identified as necessary to induce endoderm differentiation of hESCs [8]. Additionally, secondary modulation of parallel pathways have been shown to enhance endoderm specific differentiation; these include inhibition of PI3K pathway [4], or activation of FGF + BMP4 pathways [3], or activation of WNT pathway [6]. Among these commonly used supplementary constituents, inhibition of PI3K pathway has been consistently reported to enhance endoderm differentiation of hESCs in conjunction with Activin induction [9]. The resulting endoderm cells show good potential to transform into pancreatic β-like cells with continued differentiation [2,10].
The process of differentiation is induced by activation of specific signaling molecules by growth factors and small molecules. Activin in culture media binds to type 1 and type 2 receptors on the cell surface to form active heteromeric complexes [11]. These receptors then regulate downstream signals using the same mechanism as TGF-β receptor complexes. Briefly, the ligand receptor complex is responsible for C-terminal phosphorylation of regulatory SMAD molecules, namely SMAD2 and SMAD3 [12]. Active regulatory SMADs form homomeric complexes and they also complex with co-regulatory molecules like SMAD4 to form heteromeric complexes. These complexes shuttle to the nucleus to orchestrate a host of gene transcriptional events that maintain homeostasis and activate developmental programs [13]. Previous studies have shown that SMAD molecules play a major role in fate choice of hESCs [14,15,16]. However, the context of survival pathways like PI3K/AKT and mitogen activated pathways like MAPK/ERK ultimately decides whether active SMAD complexes support self-renewal or differentiation of hESCs. This is because of critical crosstalk interactions between TGF-β/SMAD and these other pathways participating in development [14,17].
Multiple experimental reports have shown the existence of significant crosstalk interfering with the TGF-β pathway during endoderm differentiation [17,18]. The efficiency of endoderm differentiation is consequently diminished without appropriate removal of interaction with parallel pathways. In spite of several experimental reports, there has not been a thorough mathematical and network level analysis of the existing interactions, which is the focus of the current paper. The primary goal of this work is to quantitatively evaluate the existence of network interactions and the direction of interaction from signaling dynamics of hESCs differentiating to endoderm. Due to the high variability associated with hESC systems, it is also necessary to infer robust connections from noisy data. Bayesian models provide a natural framework to investigate the causal dependence between nodes in a network and derive probabilistic relationships that most likely explain experimental observations [19]. These models have proven successful in network reconstruction from noisy signal transduction data [20,21]. Among the different Bayesian models, non-stationary Dynamic Bayesian Networks (DBNs) provide the best representation of the adaptive nature of signal transduction networks [22].
In the present work, interactions between the signaling molecules belonging to the TGF-β/SMAD, PI3K/AKT and MAPK/ERK pathways controlling endoderm differentiation of hESCs were identified. The nature of interactions present in the signaling network and the sequence of signal propagation events are cumulatively captured in the dynamics of key molecules in a signaling pathway [23]. As a first step, a multiplex measurement platform was used to measure detailed dynamics of multiple signaling molecules of the TGFβ pathway along with key crosstalk molecules. The measurements were made under Activin induction condition along with a perturbed case where PI3K pathway was simultaneously inhibited. DBN analysis conducted on the entire time series of key signaling molecules from these pathways elucidated the presence of multiple crosstalk interactions regulating the endoderm induction conditions. The results show that the receptor levels play an important role in controlling majority of the intracellular signaling molecules in the early and late phases of the signaling dynamics. Further, molecule from PI3K/AKT pathway (p-AKT) shows significant crosstalk interactions in the high PI3K condition, which is removed in the low PI3K condition. The early signaling dynamics contained enough information to recapitulate the key crosstalk interactions. Overall, the analysis provided explanations for the network level differences between the Activin alone and Activin + PI3K inhibition condition used for endoderm induction. The DBNs showed the key crosstalk interactions removed under Activin + PI3K inhibition providing an explanation for its good endoderm differentiation potential at the signaling level.
2. Methods
2.1. Cell Culture and Treatment
2.1.1. Human ESC Maintenance
H1 hESCs were placed on hESC certified Matrigel (BD Biosciences, Billerica, MA, USA)-coated tissue culture plate for 5–7 days in mTESR1 (Stemcell Technologies, Vancouver, BC, Canada) at 37 °C and 5% CO2 before passaging. Cells were examined under the microscope every day and colonies with observable differentiation were picked and removed before the media changes. The maintenance protocol was adopted from our previous studies [2,9,10].
2.1.2. Experimental Induction of Endoderm from hESCs
Human ESCs were allowed to grow to 60%–70% confluency before experiments were started. Once confluency was reached, endoderm differentiation was induced by adding 100 ng/mL Activin A (R & D Systems, Minneapolis, MN, USA) in the presence or absence of 1 μM Wortmannin (PI3K inhibitor; Sigma-Aldrich, St. Louis, MO, USA) for 24 h (or otherwise indicated). The differentiation media were made using DMEM/F12 (Life Technologies, Grand Island, NE, USA), supplemented with 0.2% bovine serum albumin (BSA; Sigma-Aldrich, St. Louis, MO, USA) and 1xB27 (Life Technologies, Grand Island, NE, USA). The induction protocol for endoderm was adopted from our previous study [2,9].
2.1.3. Measuring Experimental Dynamics of Signaling Molecules
Intracellular expression of signaling proteins were measured by MagPix analysis using the TGFβ Signaling Pathway Magnetic Bead 6-Plex Cell Signaling Multiplex Assay (EMD Millipore, Catalog no.: 48-614MAG) according to manufacturer’s instructions. The detailed protocol for MagPix is described in our previous study [10]. Mean fluorescence intensity (MFI) was measured using the xMAP (Luminex, Madison, WI, USA) instrument. Measurements were obtained for 6 analytes, namely total TGFβ receptor 2 (t-TGFβRII), total SMAD4 (t-SMAD4), phosphorylated SMAD2 (p-SMAD2 Ser465/Ser467), p-SMAD3 (Ser423/Ser425), p-AKT (Ser473) and p-ERK (Thr185/Tyr187). The time points selected for analysis were: 0, 0.5, 1, 1.5, 2, 3, 6, 12, 18 and 24 h (10 time points, each from a different well of tissue culture plate). Three repeats were conducted per experimental condition and quantitative analysis was performed on each repeat separately. Total protein content of the sample was measured using BCA total protein kit (Thermo Scientific, Grand Island, NE, USA), according to manufacturer’s instructions.
2.2. Identification of Network Interactions from Experimental Time Series Signaling Data
A DBN analysis was performed to identify the network structure that can explain the dynamics of signaling molecules during endoderm differentiation. Bayesian networks are probabilistic graphical models that relate nodes via directed edges, with the direction showing the causal relationship between the nodes [19]. These relationships are stronger as compared to correlative methods. Graphical models have nodes that represent entities that can interact (here molecules) and edges show how the nodes influence each other. The node where the edge originates is commonly called a parent node and the node where the edge ends is called a child node. Each node in the network is described by conditional probabilities as tables or functions. In continuous space, the relationship is represented by conditional probability distributions, and Gaussian distributions are commonly used to model the relationships [19,24]. Bayesian networks however cannot represent cyclic loops like feedbacks that are common in signal transduction networks. The problem of cyclic loops can be overcome by use of a generalization of Bayesian networks via DBNs [25].
2.2.1. Details of DBN Algorithm
DBNs relate variables between adjacent time points such that a child node at a given time point is related to the parent nodes at a previous time point, thereby expanding the network in time. Based on the system and the dynamics, the relationship can go back one or several time steps. A common approach to construct DBN is by using score equivalence criterion [24]. Here, a scoring metric (for example, maximum likelihood (ML) estimate in combination with regularization strategies) is used to evaluate how well a graph reconstructs the experimental data. Although DBNs provide good representation of biological networks, they are computationally expensive. Recently Grzegorczyk et al. developed a computationally efficient algorithm to identify non-stationary DBNs [25]. Specifically, in non-stationary DBNs, the network structure is kept constant between different time points, but the model parameters are allowed to vary between different time segments. The method has been successful in discovering biologically relevant interactions from diverse biological data sets including times series of gene expression and Milliplex protein concentrations across species [25,26,27,28,29,30,31]. The model systems are diverse, including circadian rhythms in A. thaliana, morphogenesis in D. melanogaster, synthetic metabolic networks in S. cerevisiae, serum inflammatory cytokine mediators in pediatric acute liver injury etc. [27,32]. Full details of the algorithm are presented in the manuscript and supplementary material of Grzegorczyk et al. [25]. A brief discussion of the algorithm based on the original manuscript is presented below.
Consider a set of N interacting nodes of a signaling network represented by and a directed graph structure G. An edge pointing from to in a DBN with time lag equal to one time step shows that the realization of at time step t is dependent on the realization of its parent at time step t − 1. It is commonly assumed that a time lag equal to one time step is sufficient to represent the relationship, indicating that the data have to be sampled at the right time intervals for the dynamics to be represented correctly. The parent node set, , of a node is the set of all nodes from which an edge points to in G. Grzegorczyk et al. proposed a non-stationary generalization of the Bayesian Gaussian with score equivalence model (called BGe), and it is a node-specific mixture of BGe models [25]. A linear Gaussian distribution is chosen for the local conditional distributions. The non-stationary DBN is based on the following Markov chain expansion:
where, D is the time course data, is the Kronecker delta, is a matrix of latent variables that indicate which BGe mixture component generates a data point, is a vector of mixture components, is the total number of time points. Vectors and matrices are denoted by single underbars in the symbols of all the equations of this manuscript. Each column of matrix is the vector , which divides the time series for a node into different time segments. The endpoints of these time segments are called as change-points. Each time segment between change-points is a different BGe model with parameters , which includes the mean and covariance matrix of the conditional dependences for the mixture component. The allocation scheme in Equation (1) provides representation of a nonlinear regulatory process by a piecewise linear process. From Equation (1), the marginal likelihood conditional on the latent variables is given by:
Equation (4) is the local change-point BGe score (called as cpBGe) for node n. In this work, a Gibbs MCMC sampling scheme was followed to sample from the local posterior distributions. Although, the location of change-points is inferred, the actual values of the parameters are not directly obtained since they are integrated out as seen from Equation (3). In this manuscript, correlation analysis was used in selected time segments to evaluate the nature of influence. In the algorithm, the change-points were sampled from a point process prior using dynamic programming and the graphs were sampled by sampling parent node set (restricted to 3 parents per node) from a Boltzmann posterior distribution using the cpBGe score. Additional details of the sampling procedure is given in [25]. The codes provided online by Grzegorczyk et al. were used in this work [25]. The sampling parameters were kept at nominal values suggested by Grzegorczyk et al. All simulations were performed in MATLAB® (Natick, MA, USA) on Linux 64-bit platform and single core of INTEL® (Santa Clara, CA, USA) Core™ 2 Quad CPU (Q8400 @ 2.66 GHz).
2.2.2. Constructing the DBNs
The DBN analysis was performed on each of the two experimental conditions separately to identify the network interactions that exist in each condition. The data were preprocessed as described in the results section prior to the DBN analysis (see Section 3.2). To construct the DBN, the marginal edge probability was monitored for each Gibbs sampling step. The marginal edge probability for a given edge denotes the fraction of the graphs in which that edge was present. Each Gibbs sampling step represents an instance of the network that can best explain the experimental time series. In the early phases of the simulation, the network is not yet stabilized and hence, the likelihood scores and the marginal edge probabilities fluctuate. The marginal edge probabilities of the final network were calculated after a burn-in phase when the distributions have stabilized. The DBN algorithm was applied to each repeat of the three available for each condition. The marginal edge probability scores from networks obtained for the three repeats were averaged to obtain a consensus network for a given condition or time zone. Finally, only those edges that were present in more than 50% of the sampled graphs were kept in the consensus DBN, a criterion used in the study by Azhar et al. [27]. Any value less than 50% indicates that the number of samples in which the associated edge was absent is more than the number of samples in which it is present. Specific details of the application of DBN for the dataset evaluated in this paper are explained in Section 3.2.
3. Results and Discussion
3.1. Dynamics of Signaling Molecules during Endoderm Induction
Figure 1 shows the dynamics of six signaling molecules after Activin A addition in the presence (shown by blue dashed line) and absence (shown by red continuous line) of PI3K inhibitor, called as low and high PI3K conditions respectively. The original data was normalized by time 0 values to obtain the fold change. The mean levels and standard deviation from 3 experimental repeats are plotted here. The time points selected for the study include: 0, 0.5, 1, 1.5, 2, 3, 6, 12, 18 and 24 h. The high PI3K condition represents the differentiation protocol where only the TGF-β/SMAD2,3 pathway is externally activated while the PI3K/AKT pathway is left unperturbed. In this condition, p-AKT levels are maintained near the basal levels, only slightly lower (Figure 1A). For the purpose of this manuscript, the basal levels are defined as the protein levels at time 0. It is seen that the mean levels of p-AKT fluctuate in the early time points (<6 h). Levels of t-TGFβRII (Figure 1B) also remain close to basal levels under high PI3K signaling. For p-SMAD2 (Figure 1C), an overshoot behavior is seen with levels reaching the maximum within 2–3 h and settling at intermediate levels by 6 h. For p-SMAD3 (Figure 1D), the dynamics shows a different behavior than p-SMAD2 even though both are activated by the same ligand-receptor complex. In general, the dynamics shows a continuous increase instead of the overshoot behavior seen for p-SMAD2. t-SMAD4 (Figure 1E) is maintained near the basal levels for this condition. p-ERK shows a minimal and delayed increase (Figure 1F) under high PI3K.

Figure 1.
Dynamics of key molecules from the TGF-β/SMAD, PI3K/AKT and MAPK/ERK pathways for two endoderm induction conditions. (A–F) p-AKT, t-TGFβRII, p-SMAD2, p-SMAD3, t-SMAD4 and p-ERK dynamics under high and low PI3K conditions. H1 hESCs were treated with 100 ng/mL Activin A in the presence or absence of 1 μM Wortmannin (PI3K inhibitor) for 24 h. The protein levels were quantified using Multiplex MagPix Assay. The mean and standard deviation (number of repeats = 3) in protein levels are represented here as fold change over time 0 levels.
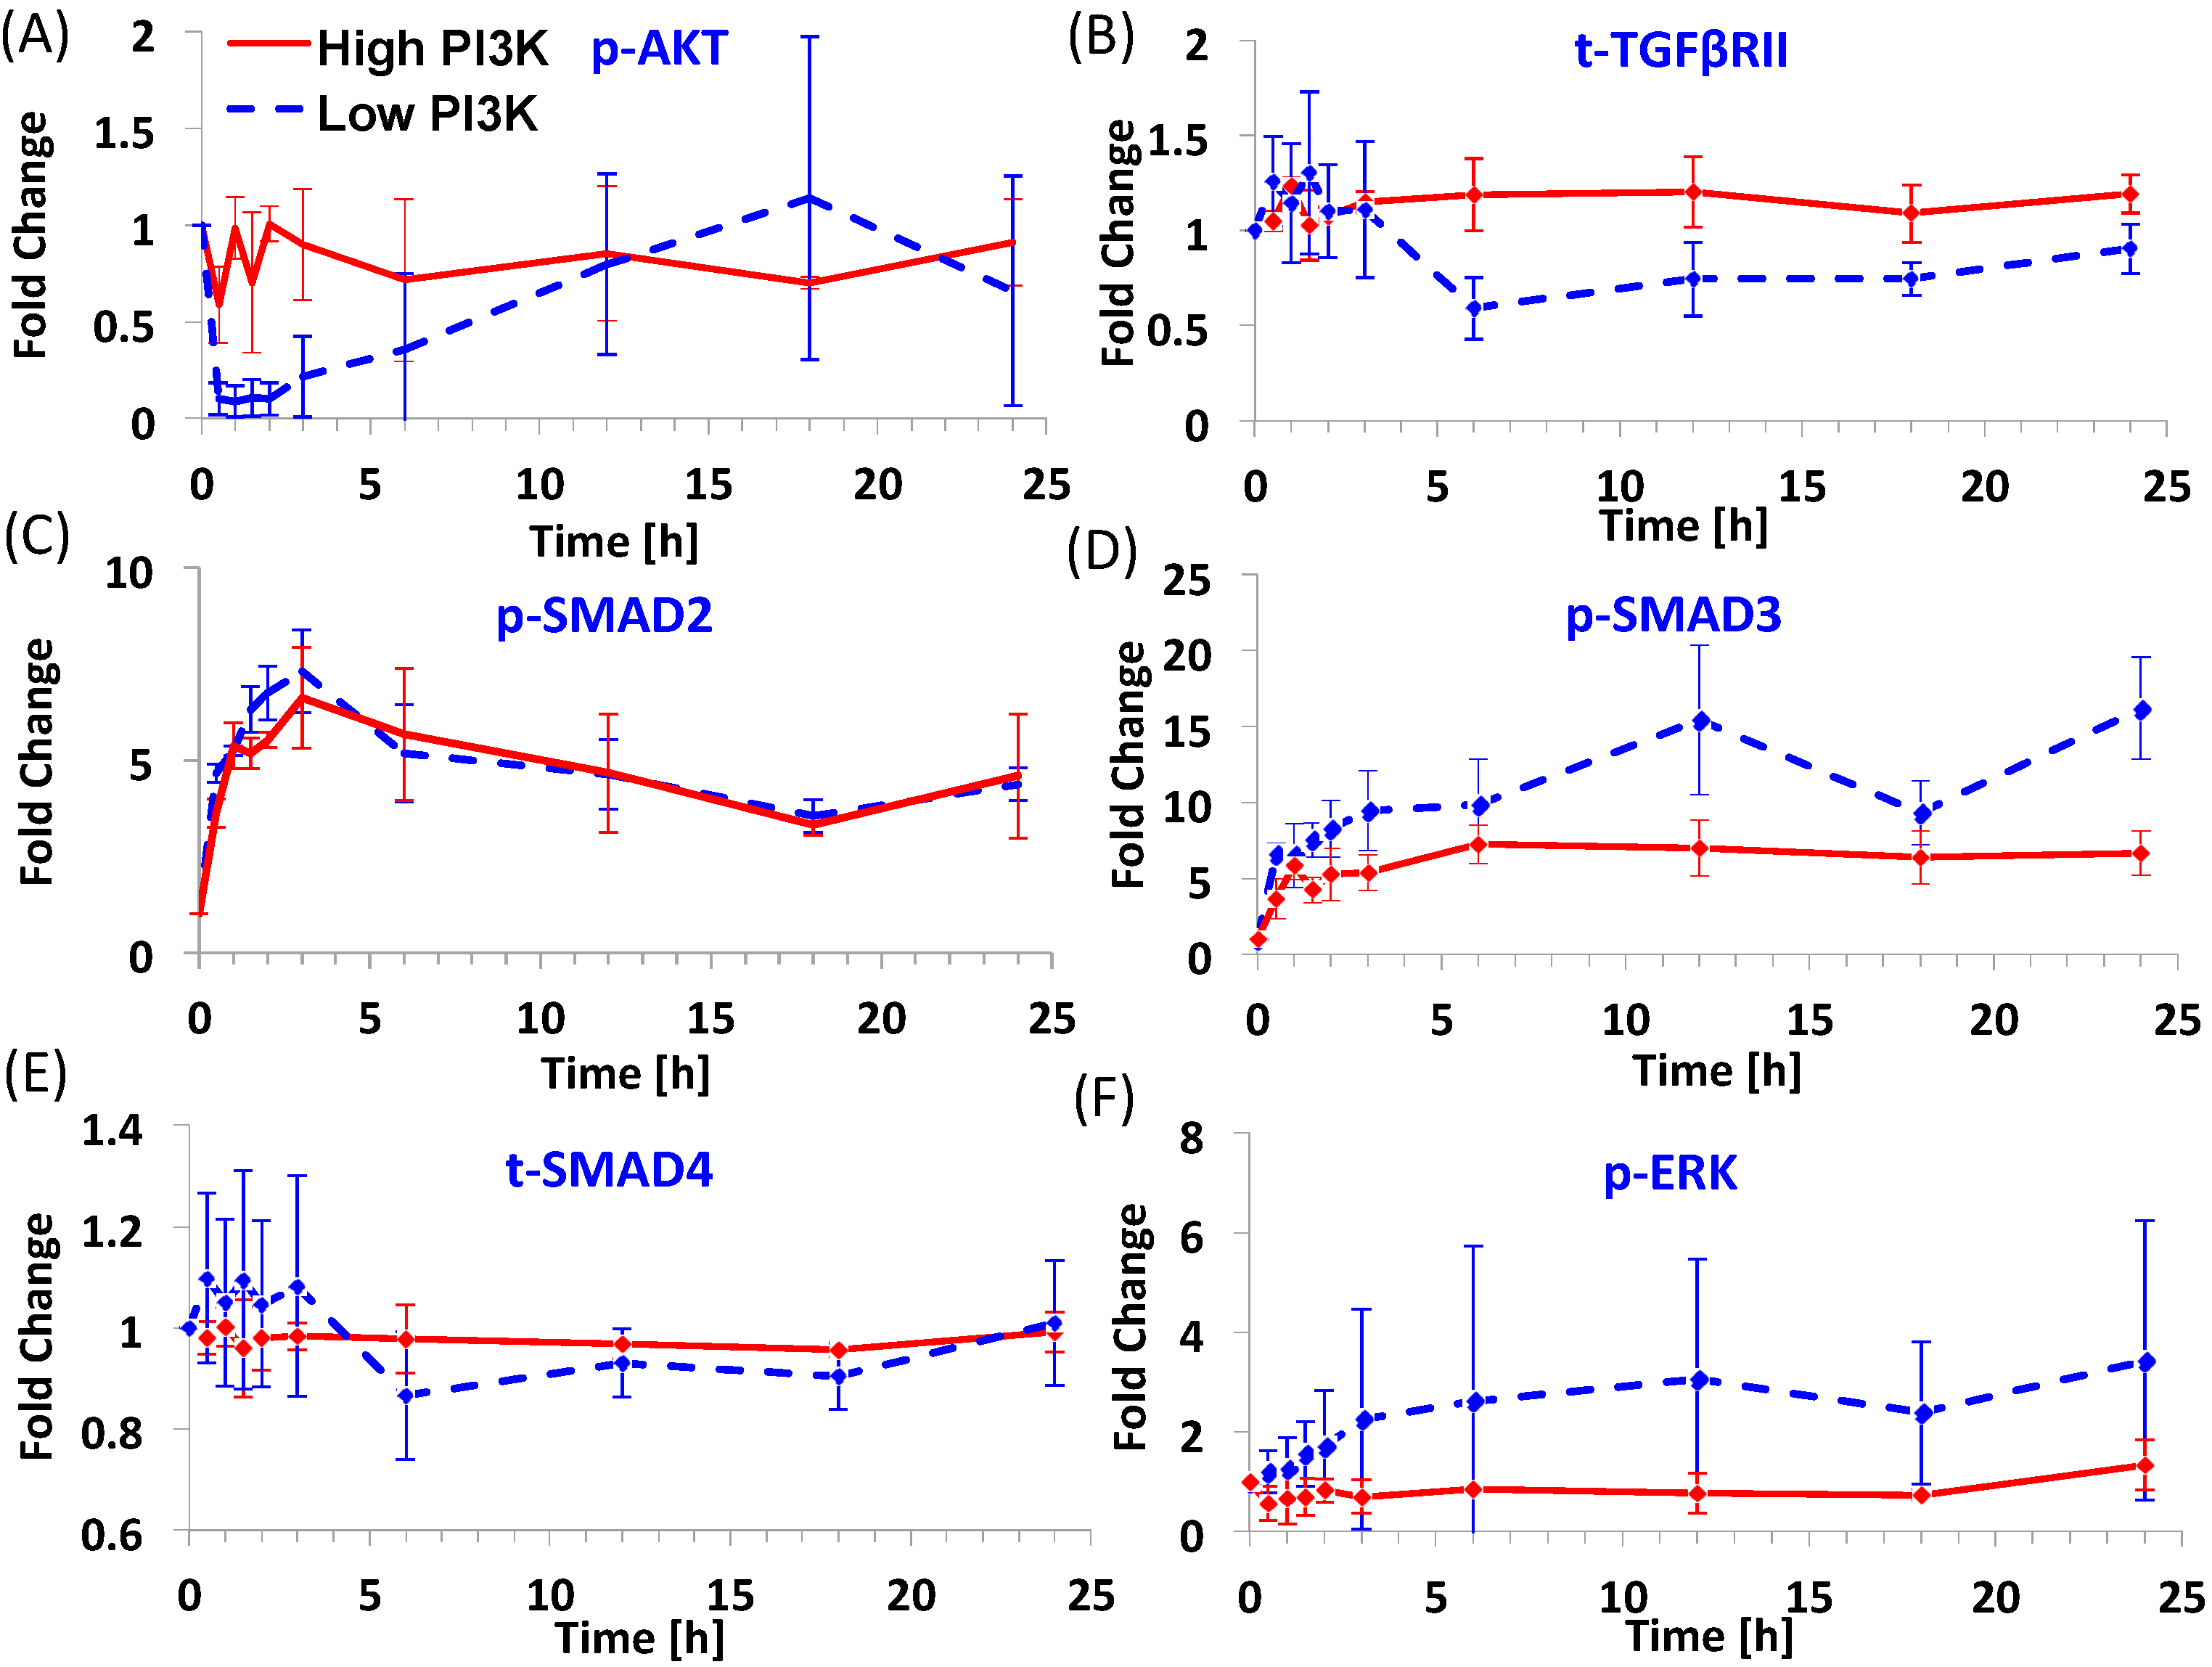
The low PI3K condition represents a modulation over the high PI3K condition with the PI3K/AKT pathway externally inhibited in addition to activation of TGF-β/SMAD2,3 pathway. In this condition, we see a considerable decrease in p-AKT levels since it is a downstream effector of PI3K signal (Figure 1A). However, interestingly this decrease is short-lived. Even after continued inhibition of PI3K, the levels of p-AKT start increasing from 3 h with the levels reaching near basal levels by 12 h. The levels of t-TGFβRII in this condition are lower than high PI3K condition at time points from 6 h (Figure 1B). The dynamics of p-SMAD2 is similar to the high PI3K condition (Figure 1C) with slightly higher fold-change at early time points. The fold-change in p-SMAD3 is higher compared to high PI3K signaling and it also shows substantial increase at later time points. t-SMAD4 (Figure 1E) shows fluctuations at early time points and a slight reduction at later time points (from 6 h). p-ERK (Figure 1F) shows a slow rise as compared to p-SMAD2,3 and the increase is substantial as compared to high PI3K signaling. Thus, overall, the low PI3K condition results in higher fold-changes in levels of phosphorylated SMAD3 and ERK than high PI3K condition. Further, low PI3K results in higher expression of two important endoderm genes, SOX17 and CER (Figure S1, also see [9] for more marker comparisons).
The dynamics shown in Figure 1 is the first detailed study of signaling dynamics obtained for hESCs under endoderm induction conditions. Two unique features are observed for hESCs, namely the rise in p-AKT levels under continued PI3K inhibition and the divergent dynamics of p-SMAD2 and p-SMAD3 under high Activin levels. Further, as is typical for hESC system, there is high degree of variability in the levels of most molecules and the degree of variability is different at different time points. The variability is higher for low PI3K condition, a possible effect resulting from high degree of cell death observed in this condition since PI3K is an important cell survival pathway. The differences in the levels and dynamics of molecules between high and low PI3K conditions indicate existence of crosstalk interactions between the TGF-β/SMAD2,3, PI3K/AKT and MAPK/ERK pathways. Previous reports from the Dalton group has indicated interactions between these pathways using static end-point analysis [17]. Here, we use a computational framework to identify all possible interactions from the information contained in the signaling dynamics.
3.2. Predictions of Network Interactions by DBN Analysis on Entire Time Series
We employed DBN algorithm developed by Grzegorczyk et al. for network identification [25]. As detailed in Section 2.2.1, the algorithm infers a causal relationship (hence directed graph) between the nodes in the network across any two adjacent time points from a given time series data. To apply the algorithm to the high and low PI3K data, the data were preprocessed by normalizing the raw MFI values of each protein by its maximum MFI value for the given time series. The data consists of 10 time points, namely 0, 0.5, 1, 1.5, 2, 3, 6, 12, 18 and 24 h for 6 nodes in the network and 3 experimental repeats per condition. The normalized data are presented in the supplementary figures, Figures S2 and S3 for high and low PI3K conditions respectively. A common concern with biological datasets is the inherent variability arising from batch-to-batch and well-to-well variability. This is further enhanced in hESC systems, used in the current work, due to inherent variations in differentiation, which cannot be conveniently controlled in the current experimental setting. However, even though the individual repeats elicited high variability in measured MFI values, many features of the overall protein dynamics was largely conserved (see Figures S2 and S3). Hence we performed the DBN on normalized data for each individual repeats separately. Figure 2 presents the directed graphs (or digraphs, used interchangeably in this manuscript) obtained from the DBN analysis.
3.2.1. DBN Analysis and Consensus Graph
Figure 2A,C shows the consensus digraphs for the high and low PI3K data. To construct the graph, DBN is first performed for each of the three repeats separately. This gives rise to three DBNs for each condition. The consensus graph in Figure 2 is constructed by averaging the edge probability across the repeats and keeping the edges that occur ≥ 50% of the times. The convergence diagnostics for the DBNs for each repeat is presented in Figure S4. The log likelihood score stabilized very early in the sampling runs for both conditions (see Figure S4A,B). For the current data, it was found that 250 Gibbs sampling steps were sufficient to converge to the marginal edge posterior distribution (see Figure S4C,D). This was confirmed over independent sampling runs, due to stochastic nature of the algorithm. Then, 500 sampling steps were performed to obtain enough samples in the converged region to calculate the marginal edge probabilities. At the end of 500 Gibbs sampling steps, the final marginal edge probabilities were calculated using the latter half of the 500 samples (the early half belongs to the burn-in phase of the simulation). The mean marginal edge probabilities from the three samples are presented in Figure 2B,D. Any edge, which was present in less than 50% of the samples, was removed from the consensus graph. Note that the DBN for each sample represents the network that can explain the entire time series of that sample, with only network parameters allowed to vary between time segments.
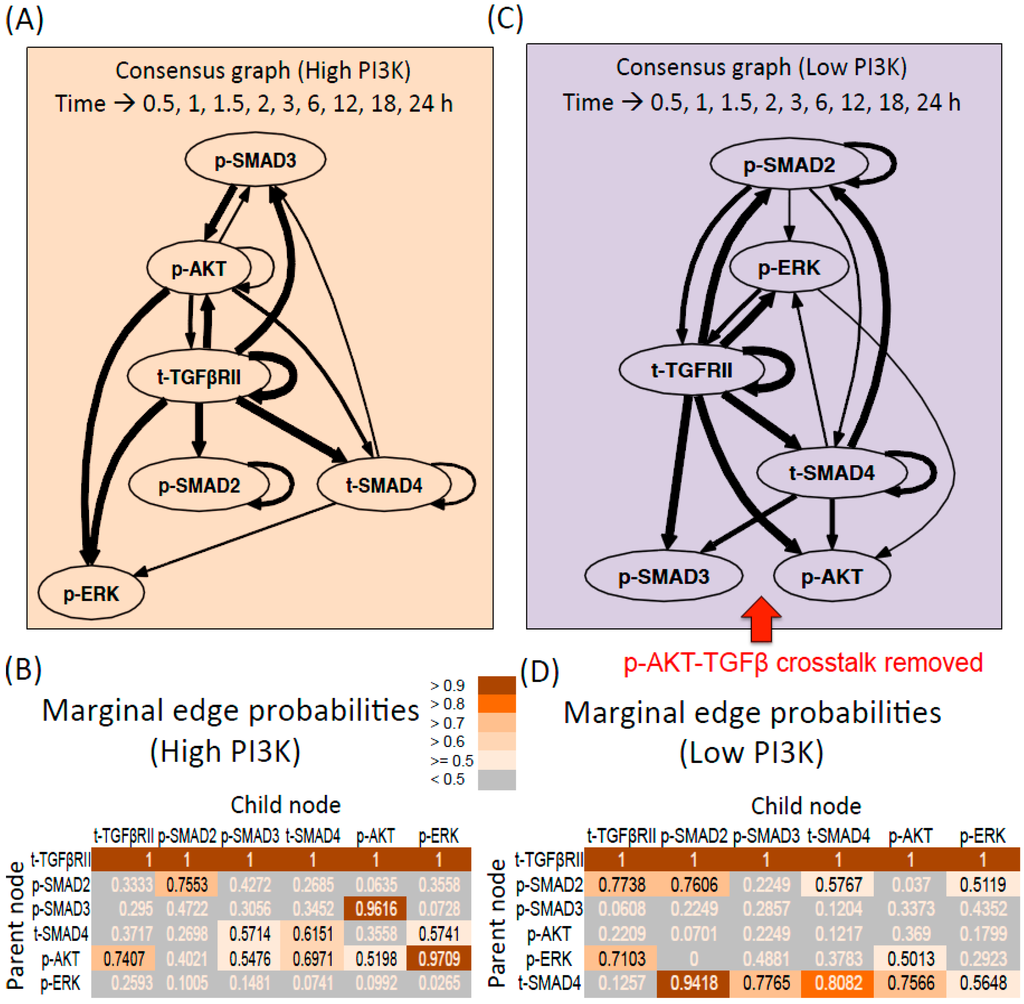
Figure 2.
Dynamic Bayesian Networks inferred for endoderm induction conditions (A) Consensus graph for high PI3K data. The thickness of the edges reflects the value of edge probabilities (≥0.5); (B) Marginal edge probability table for high PI3K data. The parent node is the node whose value at time step (t − 1) affects the value of child node at time step t; (C) Consensus graph for low PI3K data; (D) Marginal edge probability table for low PI3K data.

3.2.2. High PI3K Condition
The consensus graph shows the average interactions that are present for the given experimental condition across the three samples. As seen from Figure 2A, the dynamics of the receptor influences all the other molecules in the network, both molecules of the TGF-β pathway (p-SMAD2,3, SMAD4) and molecules of parallel pathways (p-AKT and p-ERK). The receptor is also self-regulated. The mean marginal edge probabilities in Figure 2B show that these edges are present in 100% of the sampled graphs (t-TGFβRII as the parent node and all the other molecules including the receptor being the child node). Next common edges include p-ERK regulation by p-AKT and p-AKT regulation by p-SMAD3 present in 97% and 96% of the graphs respectively. Remaining possible interactions include: Regulation of the receptor levels by p-AKT (74%), t-SMAD4 by p-AKT and t-SMAD4 (60%–70%), p-SMAD3 by p-AKT (55%), p-AKT self-regulation (52%), p-SMAD3 and p-ERK by t-SMAD4 (57%). The graphs for the individual repeats are presented in Figure S5.
3.2.3. Low PI3K Condition
For the low PI3K condition, the edges originating from the receptor are similar to the high PI3K case and are also reflected in 100% of the graphs (Figure 2C,D). Next highly represented edges include p-SMAD2 regulation by t-SMAD4 (94%) and t-SMAD4 self-regulation (81%). Remaining possible interactions include: t-SMAD4 as a parent node for p-SMAD3 (77%), p-AKT (76%), p-ERK (56%), p-ERK as the parent node for t-TGFβRII (71%) and p-AKT (50%), p-SMAD2 as a parent node for t-TGFβRII (77%), p-SMAD2 (76%), t-SMAD4 (58%) and p-ERK (51%). The graphs for the individual repeats are presented in Figure S6.
3.2.4. Comparison between Digraphs of High and low PI3K Conditions
Influence of Total Receptor Levels
The DBN analysis identified several similarities and differences in the interactions present in the two conditions. Firstly, the dynamics of the total receptor levels affect the downstream molecules in both the conditions. This influence of total receptor levels is reflected in all the individual samples across both the conditions (Figures S5 and S6). This indicates that the changes in the receptor levels are important in influencing the downstream molecules during endoderm induction.
Interactions between Intracellular Molecules
Among the TGF-β pathway molecules, p-SMAD2 has increased regulatory interactions in the low PI3K condition, especially influencing the receptor levels. Further, p-SMAD2 shows influence on p-SMAD3 and p-ERK in sample 1 of high PI3K (Figure S5). p-SMAD3 shows interactions with p-AKT in the high PI3K condition. This interaction is removed in the low PI3K condition. The low PI3K condition also shows increased role for t-SMAD4 in influencing the p-SMAD2 and p-SMAD3 dynamics. p-AKT shows striking differences in the connections between the two conditions. For example, p-AKT interacts with and regulates majority of the nodes in the high PI3K condition. However, in the low PI3K condition, p-AKT does not regulate other nodes, but instead acts as a child node for all of its interactions. This is an interesting prediction, because the levels of p-AKT increased back in spite of continued inhibition in the low PI3K condition. The current analysis indicates that a short-term decrease in p-AKT levels is sufficient to remove the influence of p-AKT on TGF-β pathway molecules. Next important difference is in the regulatory role of p-ERK. p-ERK is not regulating any of the other nodes in the high PI3K condition. This is also reflected in each of the repeats in high PI3K condition (Figure S5). Interestingly in the low PI3K condition, p-ERK takes an important role in regulating the receptors. p-ERK shows increased regulatory role on p-SMAD3 and t-SMAD4 in one of the samples (see sample 3 in Figure S6). This sample also had the highest increase in p-ERK by 24 h among all the samples (data not shown), indicating that this specific sample is crossing the threshold for p-ERK mediated regulation of SMAD molecules.
3.2.5. Change-points Inferred by cpBGe Model
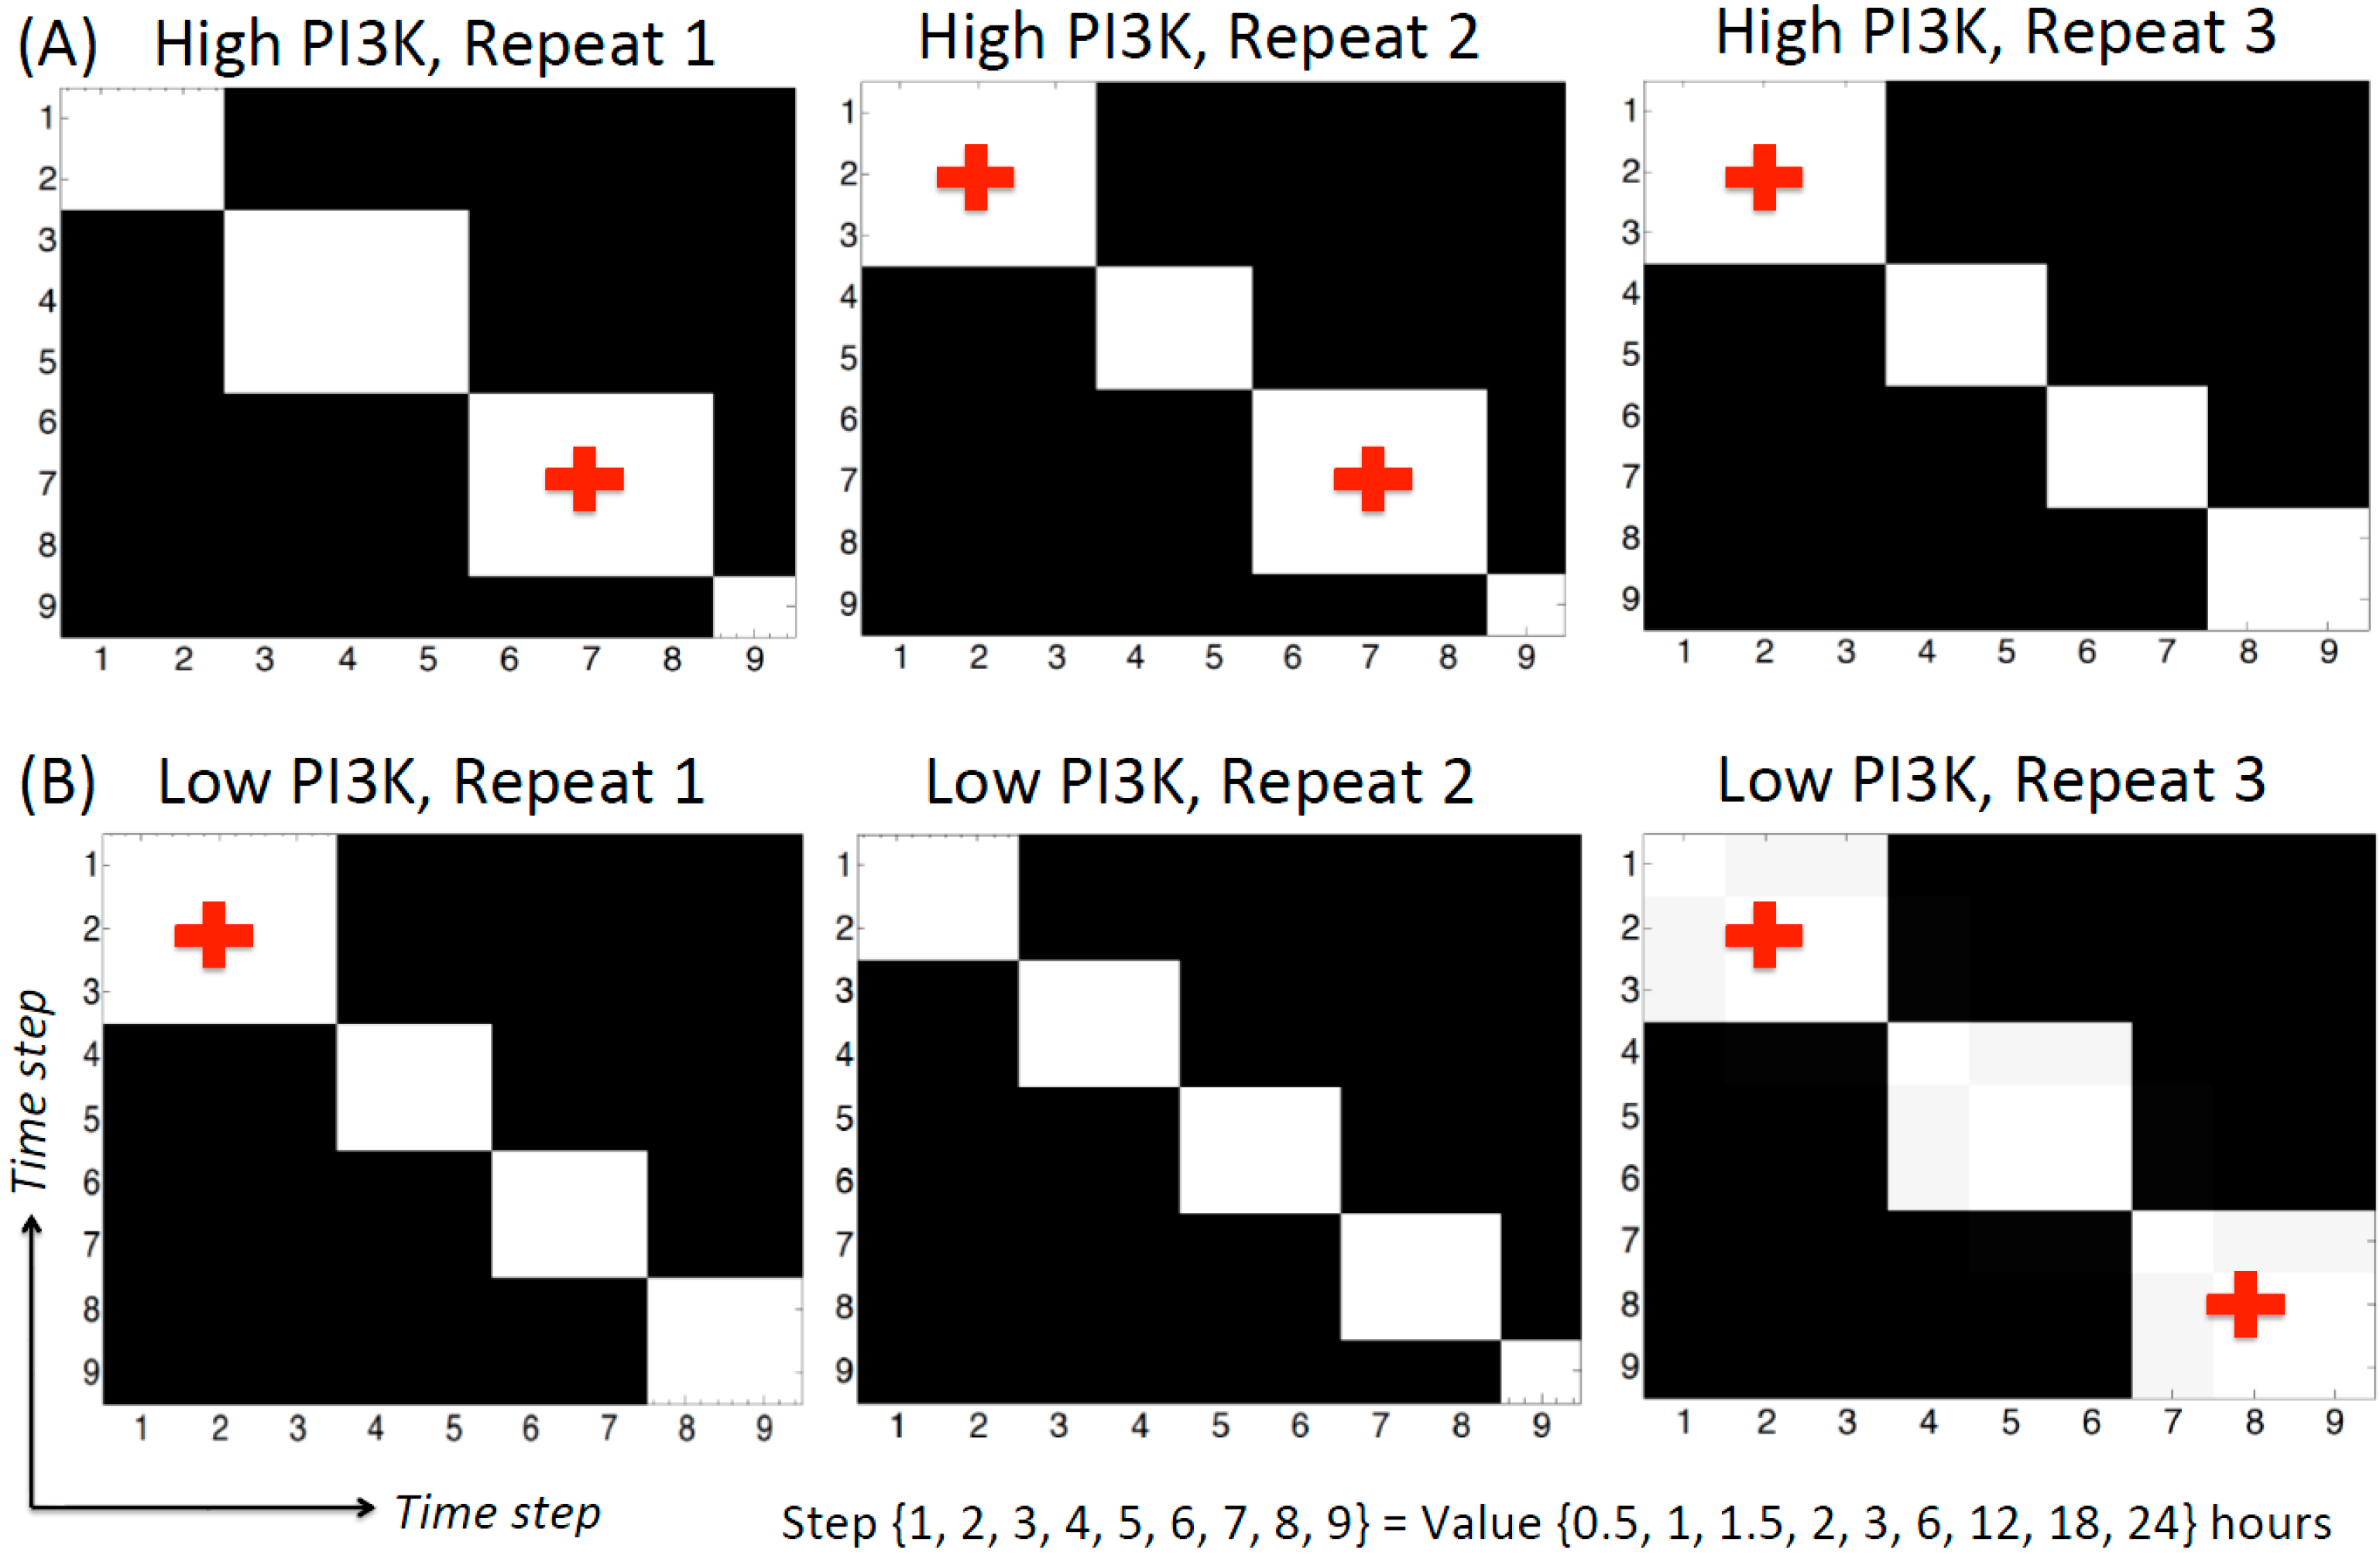
During DBN analysis, the algorithm segments the time series data in a non-supervised, node-specific manner. The ends of these time segments are called as change-points. Mathematically, the parameters of the distribution change at a change-point, but the specific structure of the network is not allowed to vary. Therefore, the nature (strength and/or direction) of the regulatory relation between the nodes for all the time points of a segment remains the same but different from the time points in the preceding and succeeding segments. Currently, the algorithm fits a Gaussian mixture model for each node separately and assigns the time points in the data to a specific mixture component. Two time points belonging to the same mixture component of a node will show the same regulatory relation with its parent nodes at these two time points. The algorithm also calculates the posterior probability of pairs of time points being co-allocated in this way. The co-allocation matrices for the time steps of high and low PI3K condition for each repeat are shown in Figure 3. The axes of each plot represent the time step (whose actual value is given at the bottom of the figure). The black/white shading of the plot shows the posterior probability of two time points being assigned to the same mixture component of the cpBGe model. Black region shows 0 probability while white region shows a probability of 1. This plot can be made for each node in the network. For the current data, it was observed that all the nodes showed identical change-points, indicating that these nodes are regulated together. The co-allocation plot in Figure 3 is representative of all the nodes in the network.
Based on Figure 3, many of the adjacent time points are well correlated as the high probability regions fall along the diagonals of the plot. This is an important observation given that each time point is obtained from different tissue culture well in the same experiment. More importantly, here we concentrate on those time segments that maintain the same regulatory relation for at least three consecutive time points. The high PI3K condition shows four main segments for each repeat (Figure 3A). Out of these, (0.5, 1, 1.5 h) and (6, 12, 18 h) are the segments containing three time points in at least two of the repeats. In each of these time segments, the parent node is active for the first two time points and the associated child node is active for the last two time points. Hence, the same regulatory relation between the parent and child node is active for at least two time points. Although the regulatory relation is changing frequently along the time series, the most repeated network edges are not changing along the time series, as they are kept fixed by the algorithm. The low PI3K data shows more variability in the number of change-points. Repeats 1, 2 and 3 show four, five and three time segments respectively. Of these, repeat 2 contains very short time segments. Only one of the time segments, containing (0.5, 1 and 1.5 h) is repeated twice in repeats 1 and 3.
The presence of many change-points in the same condition may be because of high variability in data, which is common for hESC systems. However, the presence of highly likely interactions identified by the DBNs indicates that there is a high degree of correlation between the nodes in spite of the variability in the data. In addition, the presence of correlation between many of the adjacent time points indicate that in spite of the uncontrolled variations, the dynamic information of signal transfer is still maintained.

Figure 3.
Co-allocation matrices for the high and low PI3K time series. (A) High PI3K condition; (B) Low PI3K condition. The axes represent time step. The actual time values corresponding to the time step are given below the plots. The black/white shading indicates the posterior probability of two time points being assigned to the same mixture component, ranging from 0 (black) to 1 (white). As seen from the figure, there are several time segments inferred from the data, 4 for the high PI3K condition and 3–5 for the low PI3K condition. All nodes show identical change-point behavior (data not shown), although this was not pre-fixed in the algorithm. The crosses indicate the time segments selected for network inference in different time zones.
3.3. Changes in Regulatory Structure across Time Zones
Previous section showed that the same regulatory relationship is maintained within some of the early and late time zones. This includes (0.5, 1, 1.5 h) which for both conditions is taken as early. The time points (6, 12, 18 h) are taken as late for high PI3K data and (12, 18, 24 h) for the low PI3K data. Since these early and late time segments have a consistent sampling interval of 0.5 and 6 h respectively, they were selected for further analysis to check if the regulatory interactions existing in the early and late time zones of the dynamics is the same (these segments are marked by crosses in Figure 3). This is necessary to check if the crosstalk interactions exist throughout the 24 h time series, or only in certain time zones. Therefore, DBN analysis was done on each zone separately. It is important to note that each of the resulting networks is particular to the time segment of interest since the algorithm has not seen data from the other zone. Nevertheless, the regulatory structure identified in each segment will confirm if these segments contain similar information as any other portion of the dynamics.
3.3.1. High PI3K Condition
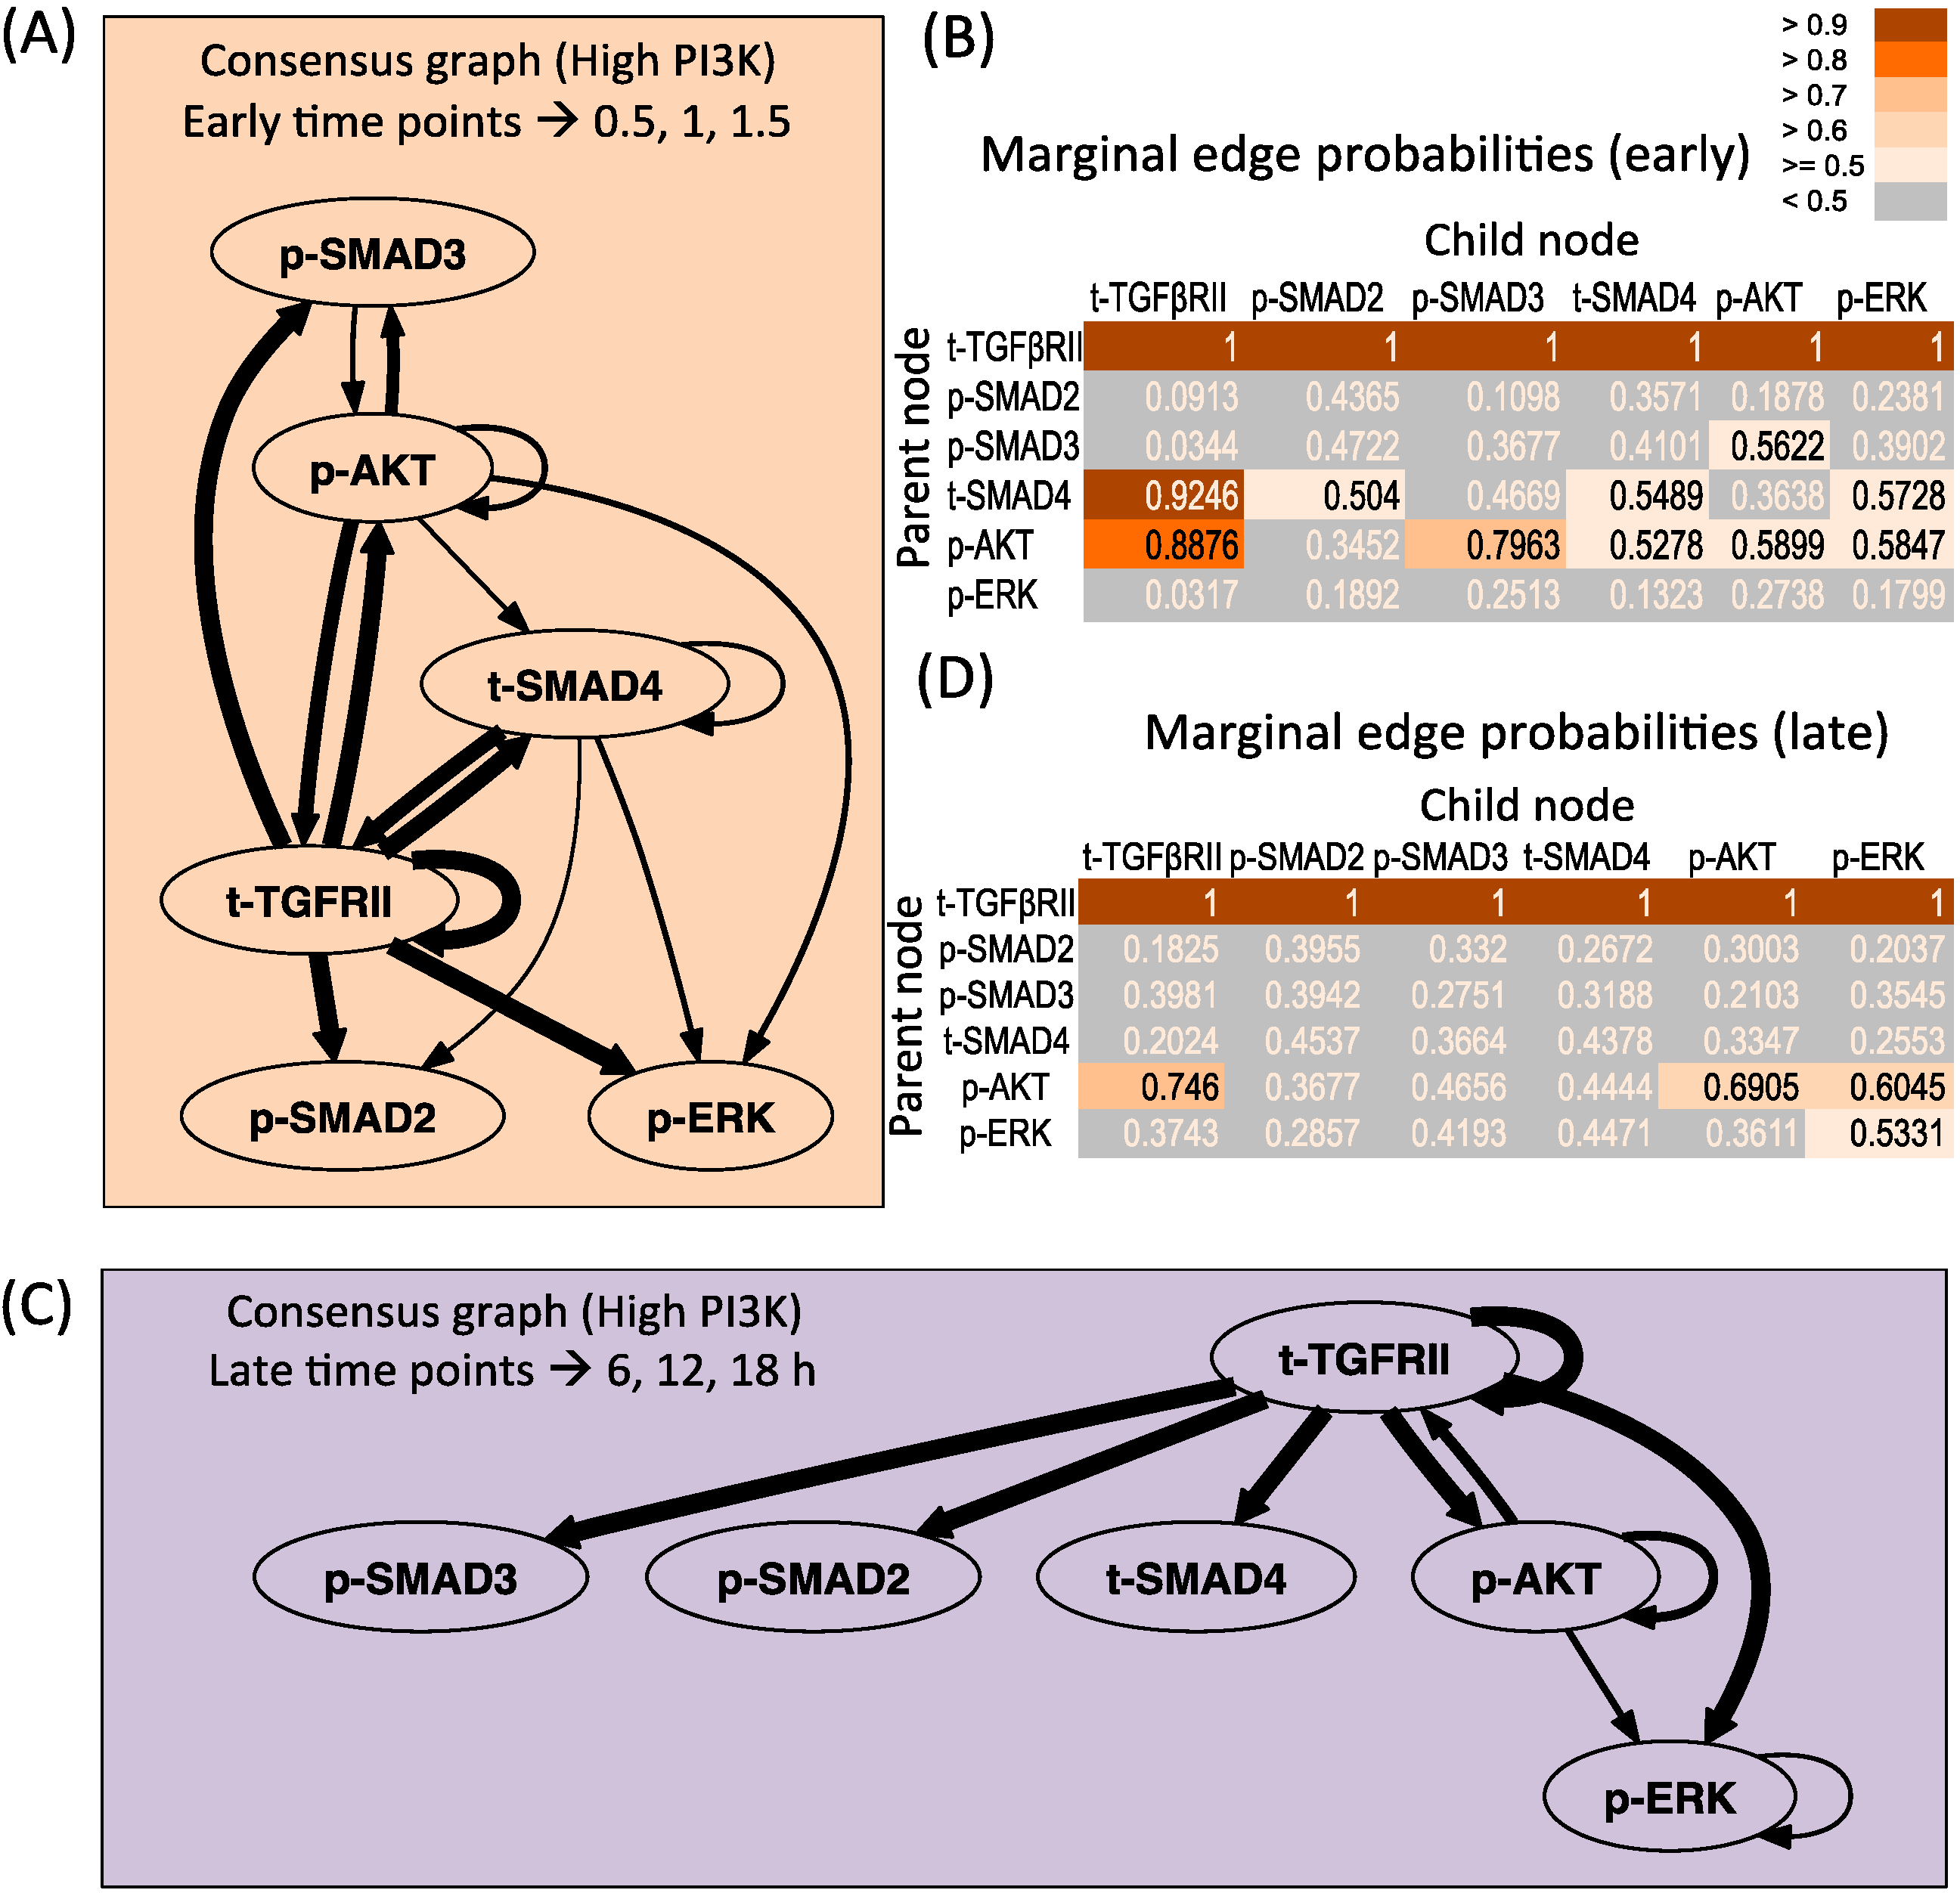
Figure 4A,B presents the consensus graph and marginal edge probabilities respectively for the early time points averaged over repeats 2 and 3. The network is very similar to the network obtained using the entire time series of high PI3K condition (Figure 2A), with some minor differences. The key regulations by the receptor as well as supplementary crosstalk interactions are identified from the early time points. Figure 4C,D presents the consensus graph and marginal edge probabilities respectively for the late time points, averaged over repeats 1 and 2. The network obtained only contains regulation by the receptor and some repeats contain the regulation by p-AKT on the receptor and p-ERK levels.

Figure 4.
Dynamic Bayesian Network inferred for endoderm induction conditions under different time zones and high PI3K. (A) Consensus graph for high PI3K data, early dynamics (t = 0.5, 1, 1.5 h); (B) Marginal edge probability table for high PI3K data, early dynamics; (C) Consensus graph for high PI3K data, late dynamics (t = 6, 12, 18 h); (D) Marginal edge probability table for high PI3K data, late dynamics.
The performance of DBN algorithm is dependent on the sampling resolution of the dataset, and increased time points to a certain extent have been shown to reduce falsely identified connections [33]. Since in our current analysis in Figure 4 we are restricted to low number of time points, we further verified our prediction by artificially increasing the sampling resolution of the dataset by linear interpolation of the original experimental data. It is important to note that the original sampling time points were based on the fact that the TGF-β signaling pathway shows a slow response (with dynamic changes of the order of hours in many cell lines [34]) and at the current sampling resolution, the key dynamic features like slow increase/decrease, first order and overshoot behavior are captured fairly well. Hence, a linear interpolation is a good assumption for the current analysis. The resulting consensus graphs obtained by tripling the data points (Figure S7A) shows that the most repeated connections involving the receptor mediated and p-AKT mediated dependences are re-captured in the resolved data-set. However, some of the less represented connections (mostly those with edge probability less than 0.58) originating from p-SMAD3 and t-SMAD4 are lost and p-SMAD2 regulation is regained. When additional time points were added, no further changes in the graph were observed (data not shown), as also seen by Yu et al. where the number of true and false positive connections reached a plateau after a certain point [33]. Similar conclusions are seen for the late time points (Figure S7B). Hence this increases confidence on the current predictions, indicating the robustness of the more repeated connections.
3.3.2. Low PI3K Condition
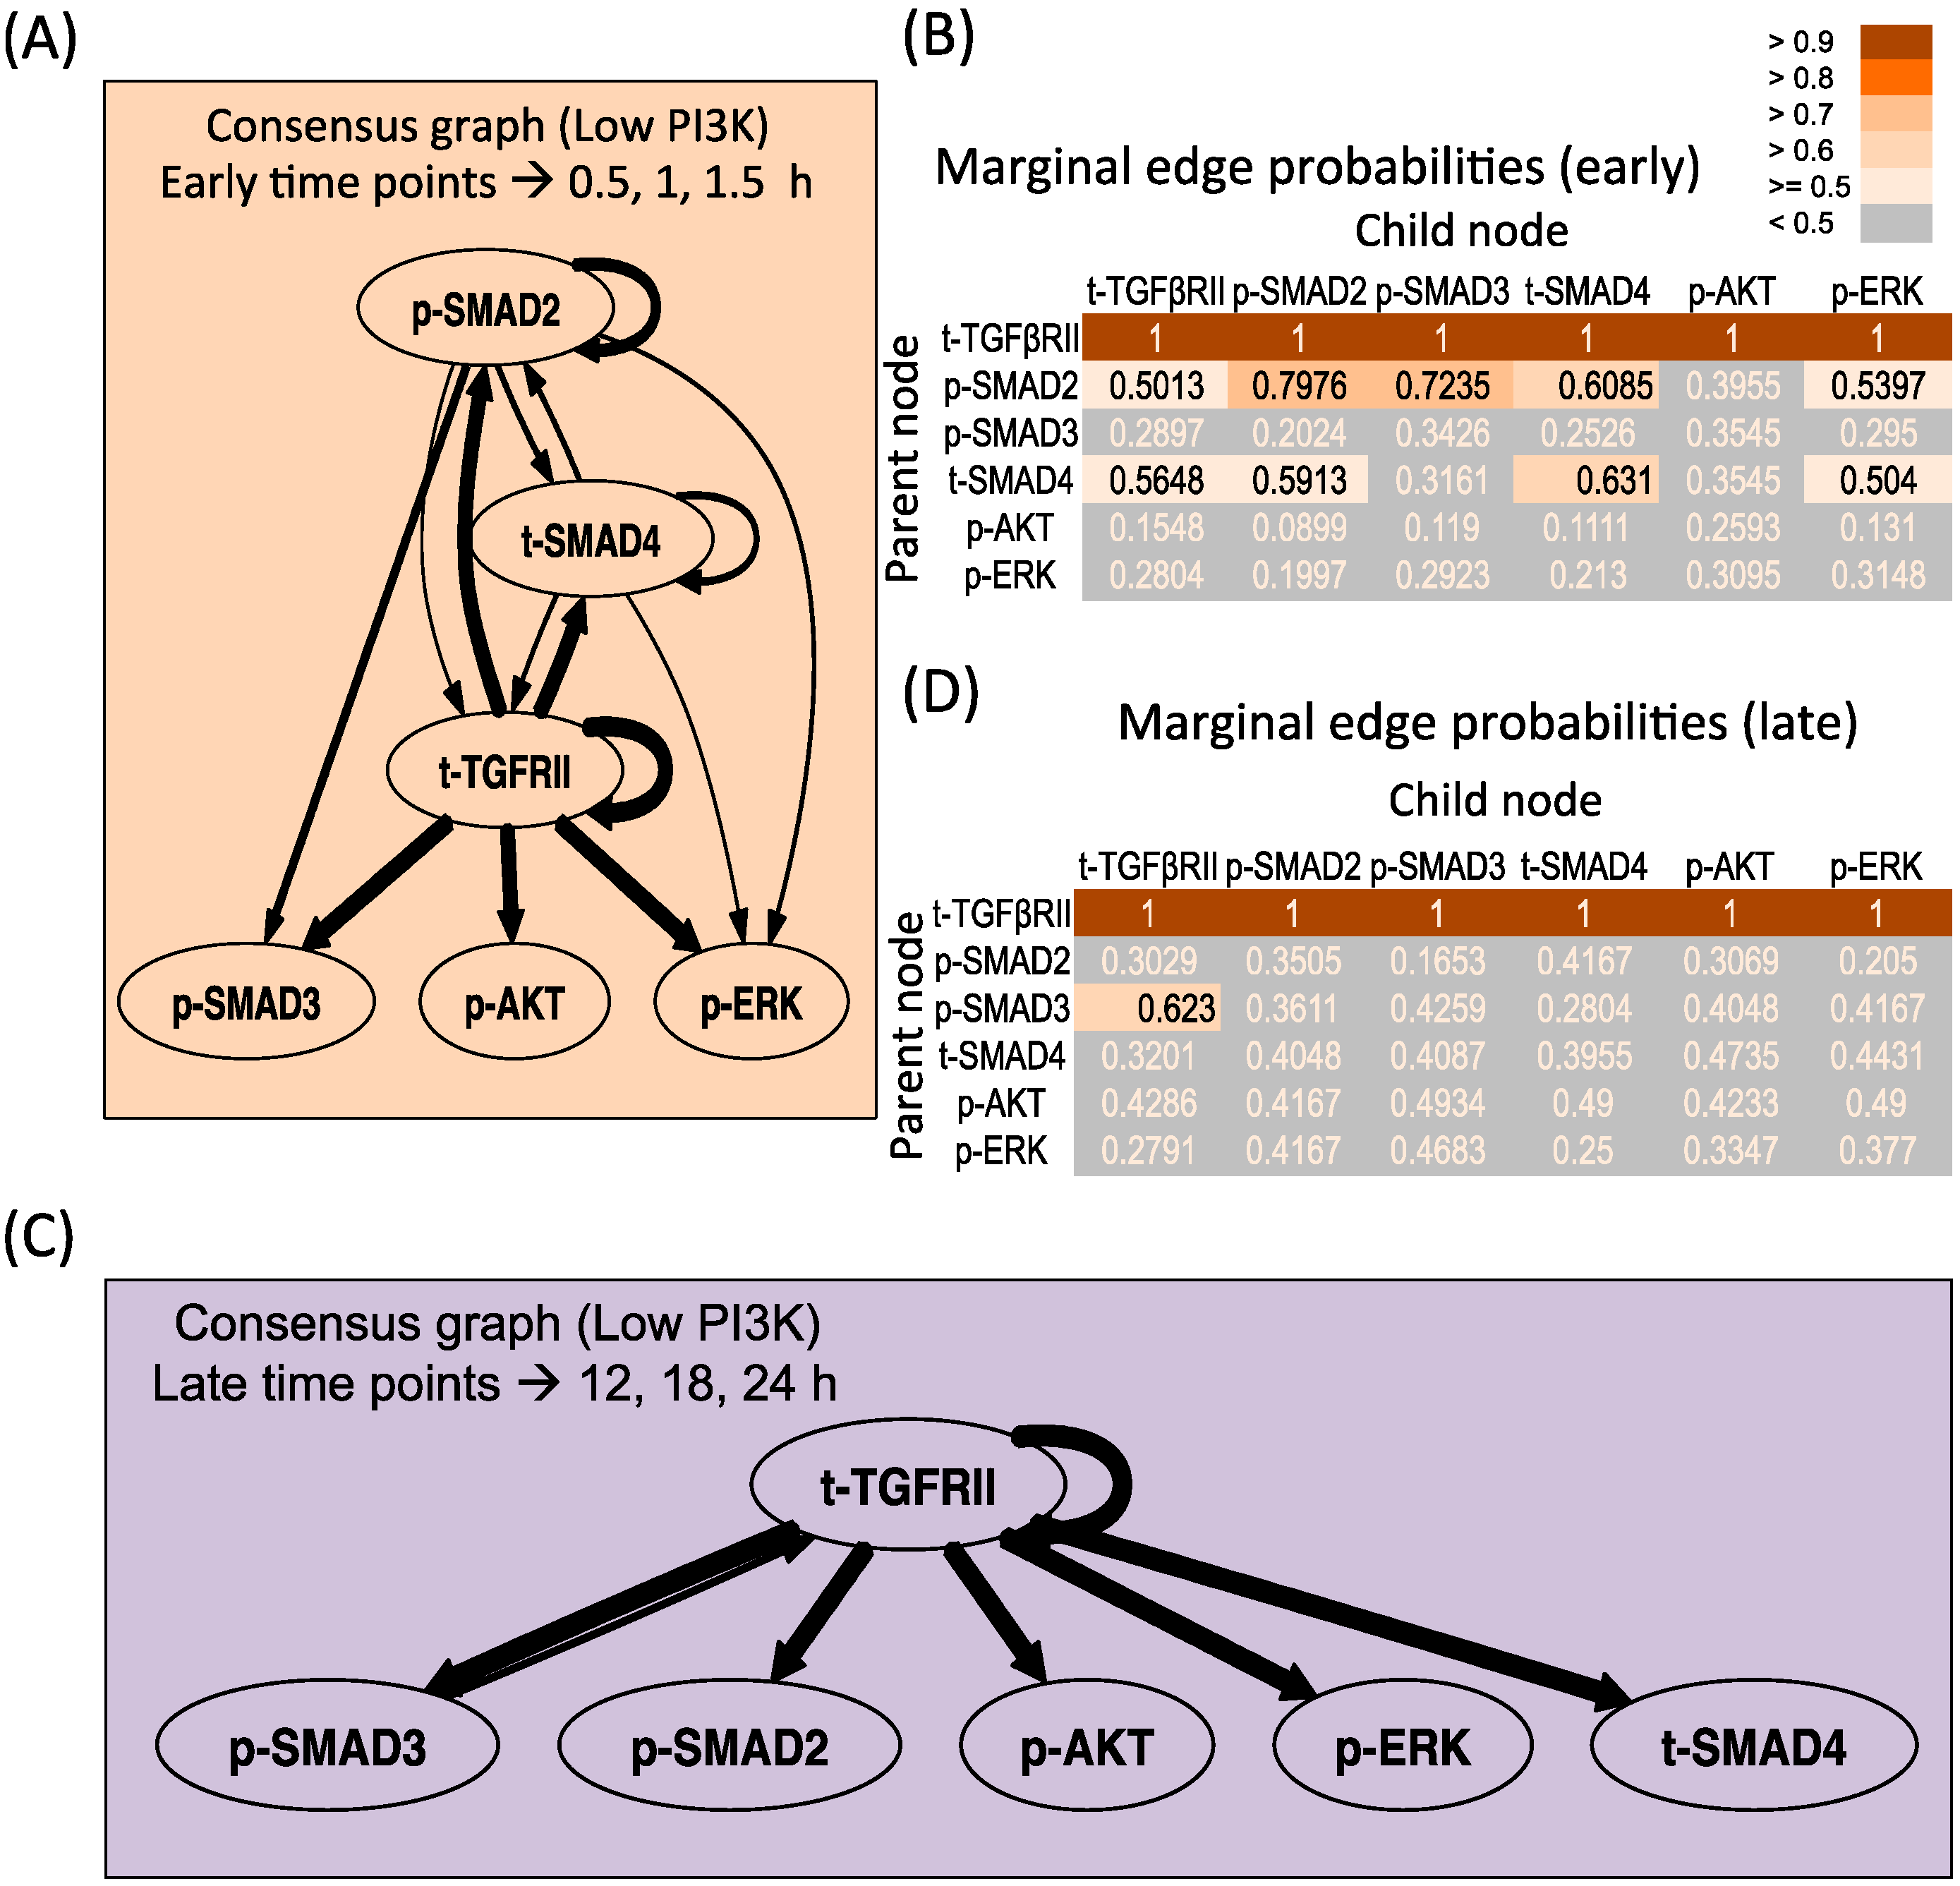
Figure 5A,B presents the consensus graph and marginal edge probabilities respectively for the early time points, averaged over repeats 1 and 3. The network is very similar to the network obtained using the entire time series of low PI3K condition (Figure 2B), with some minor differences. The key regulations by the receptor as well as supplementary crosstalk interactions are identified from the early time points. Figure 5C,D presents the consensus graph and marginal edge probabilities respectively for the late time points. Here late time points of 12, 18 and 24 h for repeat 3 were chosen based on Figure 3. It is seen that only the receptor-mediated regulation is identified in this region with no additional crosstalk interactions identified. When the sampling resolution is increased to contain triple the current number of time points in the early and late phases each, similar conclusions (see Figure S8) are obtained as the high PI3K case, with most represented connections from Figure 5 retained and some less represented connections (<0.51 in early and <0.63 in the late phase) lost.
3.4. Correlation between Molecule Pairs in the Early and Late Time Zones
The DBNs do not directly infer the strength and direction of regulation (positive or negative). This is because the parameters are integrated out during the calculation of the cpBGe scores (see Equation (3)). Alternately, this can be investigated by using correlation metrics. Since the algorithm here fits a linear Gaussian mixture model at each time segment between the change-points, the nature of interaction between pairs of nodes (parent and child nodes) within a time segment can be measured using linear correlation coefficients. For the purpose of comparison, Pearson correlation coefficient between pairs of molecules was calculated at the early and late time zones for each condition and averaged over the time zones for repeats selected from Figure 3. These coefficients are presented in Figure 6. Note that in Figure 6 the influence of a selected node on all the other nodes in the network (not just the child node) is presented. Based on the identified DBNs, the correlation coefficients are presented in three major groups showing the influence of receptors, p-AKT and p-ERK on the nodes in the network.
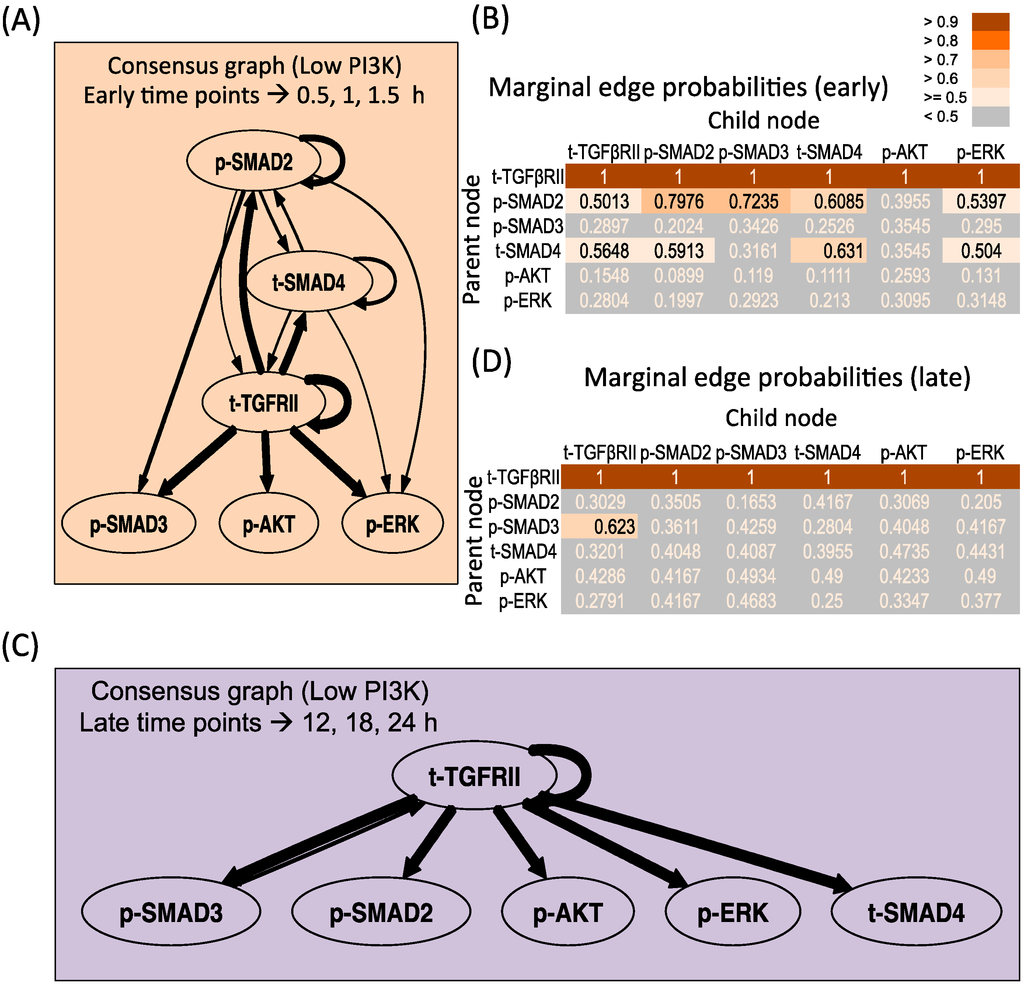
Figure 5.
Dynamic Bayesian Network inferred for endoderm induction conditions under different time zones and low PI3K. (A) Consensus graph for low PI3K data, early dynamics (t = 0.5, 1, 1.5 h); (B) Marginal edge probability table for low PI3K data, early dynamics; (C) Consensus graph for low PI3K data, late dynamics (t = 12, 18, 24 h); (D) Marginal edge probability table for low PI3K data, late dynamics.
3.4.1. Influence of Total Receptor Levels
As seen from Figure 6A, most of the molecules show positive and strong correlation with the receptor in the early and late time zones of both conditions. This indicates that the receptor is positively influencing the downstream molecules. It is interesting to note that the correlation is heavily dependent on the interaction with parallel pathways. For example, presence of high PI3K weakens the correlation between the receptors and downstream molecules both in the early and late time points. Suppression of PI3K significantly increases most of the correlation coefficients.
3.4.2. Intracellular Regulation by p-AKT
As shown from Figure 6B, p-AKT shows negative correlation with the p-SMAD2,3 molecules in the high PI3K condition. Among the p-SMADs, the correlation is stronger for p-SMAD3. The correlation is weak in the low PI3K case and from the DBNs, it is seen that edges from p-AKT to p-SMADs are absent in this condition. Therefore our results show that in the low PI3K condition, although the p-AKT levels increase to basal levels at later time points, the influence of p-AKT on p-SMADs is lost. A mostly negative correlation is also seen between the p-AKT and t-SMAD and positive correlation between p-AKT and the receptors in the DBNs. For p-ERK, DBN analysis showed regulation by p-AKT. Correlation coefficients show that the regulation is negative in the early time zone and positive in the late time zone.
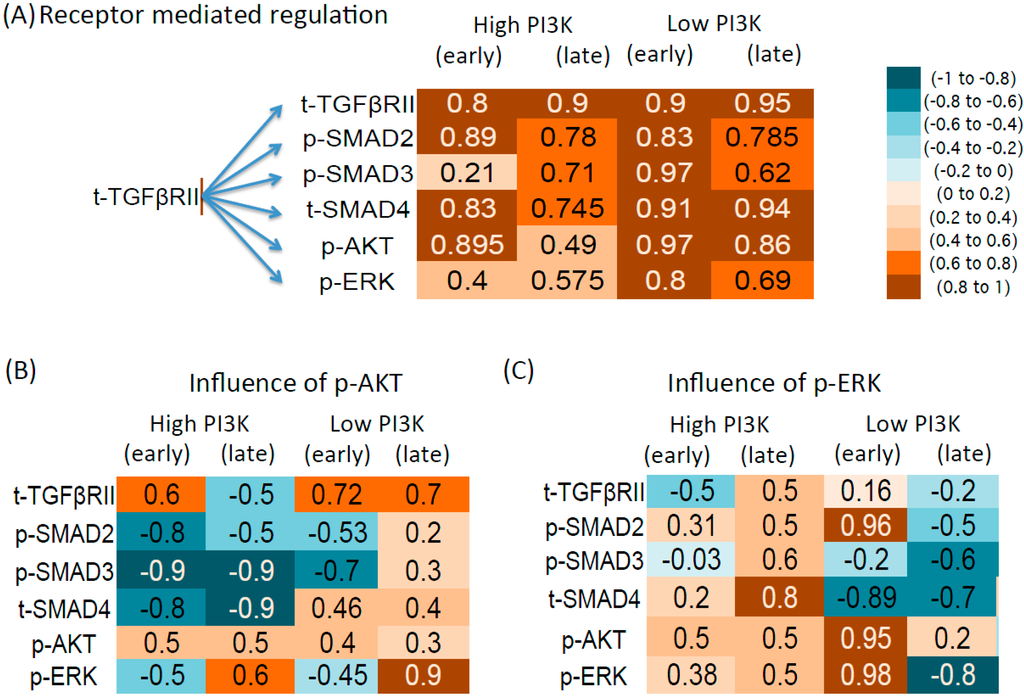
Figure 6.
Correlation tables for high and low PI3K condition. (A) Receptor mediated regulation; (B) p-AKT mediated regulation; (C) p-ERK mediated regulation. The Pearson correlation is calculated between the parent nodes at time step (t − 1) and all other nodes at time step t. The early time points 0.5, 1, 1.5 h (both conditions) and the late time points correspond to 6, 12, and 18 for high PI3K and 12, 18, 24 for low PI3K. The average correlation coefficients across 2 repeats (selected in Figure 3) are used for high and low PI3K. However, for the low PI3K late time points, only repeat 3 is used.

3.4.3. Intracellular Regulation by p-ERK
The consensus DBNs from all the conditions showed that p-ERK has a minor role in regulating the levels of most molecules. The influence if it exists is mainly for the low PI3K condition as seen from some samples in this condition. Based on correlation analysis, the correlation coefficients are weak in the high PI3K condition (Figure 6C). But, comparatively stronger correlation coefficients are seen in the low PI3K condition. The type of regulation is however mixed. The correlation with p-SMAD2 is positive in the early time zone and negative in the late time zone. The correlation with p-SMAD3 and t-SMAD4 are negative. In the early low PI3K condition, p-ERK shows a positive correlation with p-AKT.
3.5. Network Regulation during Endoderm Differentiation
This work is the first account in identifying specific signaling interactions governing endoderm differentiation of hESCs using network analysis tools. The DBNs inferred for the high and low PI3K data accomplished two major tasks: (1) They identified molecular interactions within the TGF-β pathway along-with crosstalk interactions with parallel pathways; and (2) They identified distinct pathway regulations during the early and late phases of the signaling dynamics. One key prediction from the entire analysis is the influence of receptor levels on downstream molecules including SMAD, AKT and ERK. In the canonical pathway, TGFβRII is known to activate SMAD molecules after formation of the ligand-receptor complex [35]. TGFβ signaling also participates in several non-canonical signaling leading to activation of PI3K/AKT and MAPK/ERK pathways in many cell lines [35,36]. Our analysis indicates that the levels of the receptors (TGFβRII) are still in the regime where they are limiting and any change in their level is reflected downstream. In addition, it is interesting to note that in each repeat, we repeatedly obtain the receptor-mediated edges, indicating that the connections are maintained in spite of sample variability.
Several important interactions from p-AKT were identified indicating the existence of p-AKT mediated crosstalk in high PI3K condition and its removal under low PI3K. Ours is the first systematic study to identify these crosstalk interactions in differentiating hESCs. The regulation of p-SMAD3 by p-AKT is well known in other cell lines, mainly inhibition of p-SMAD3 phosphorylation by mTORC1 and sequestration of non-phospho SMAD3 by p-AKT [37,38,39,40,41]. The regulation of p-SMAD2 by p-AKT is observed only in one sample of the high PI3K condition (Figure S5). Literature shows that most negative regulation of p-AKT is on p-SMAD3 and not p-SMAD2 [39], however some reports indicate negative regulation of both p-SMAD2 and p-SMAD3 by p-AKT in neuroblastoma and CHO cell lines [42,43]. The removal of crosstalk interactions with p-AKT in the low PI3K condition is interesting although the actual mechanism needs further study. One possibility is that the SMADs have undergone predominant nuclear translocation under inhibition of p-AKT and p-SMAD is no longer accessible to p-AKT [37,38,40]. The regulation of the receptors and t-SMAD4 by p-AKT was also seen but these interactions are not as widely studied as those of p-AKT and p-SMADs.
The DBNs showed regulation of p-ERK by p-AKT in the high PI3K condition. It is well reported that p-ERK is inhibited by p-AKT and many of its downstream effectors (via mTORC1) in multiple cell lines [44]. Previous study has shown the interaction between AKT1 and cRAF in hESCs leading to inhibition of RAF/MEK/ERK signaling [17]. Our experiments show that the levels of p-ERK are higher in low PI3K condition and the influence of p-AKT on p-ERK is also absent from the low PI3K DBNs. This indicates that this interaction negatively influences endoderm induction. However, a positive correlation was seen between p-ERK and p-AKT in the early low PI3K condition. ERK is known to influence the AKT pathway based on the context [44] indicating that this interaction may be seen during endoderm differentiation via additional networks interactions in these pathways.
4. Conclusions
Network inference is an area of active research in systems biology, with a multitude of methods currently being explored, starting from correlative and clustering methods to more involved algorithms utilizing Boolean, Bayesian and Differential Equation frameworks [45,46,47,48,49,50]. Many attempts to compare different approaches have led to the conclusion that there is no true gold standard method currently available that can identify all true positive connections (those present and inferred) with minimal false positive (not present but inferred) and false negative (present and not inferred) connections [51,52]. During benchmarking tests on in silico signal transduction dataset to check the network reconstruction accuracy of the DBN algorithm used in this work, Grzegorczyk et al. obtained favorable values for several measures of accuracy for datasets with wide range of signal to noise ratio (SNR) [25,32] and these measures were comparable to other methods for similar node numbers, connectivity and SNR [51]. Due to the success on a variety of datasets, the algorithm by Grzegorczyk et al. was used to determine the network connections in this work. Significant care was taken to infer connections from independent repeats of the same experimental condition due to high variability of the system and emphasis was given to most repeated connections across independent repeats. While current analysis indicates robustness of the predictions across independent repeats, verification of such robustness is only possible by running selective perturbation experiments [53,54], which will be considered in our future work.
Precise control of differentiation of hESCs is a difficult problem due to the high variability and multiple signaling mediators associated with this process. While experiments have identified features of signal transduction that orchestrate this process, rational design using network level properties is not well studied. This work is an important contribution in this direction. Using network analysis methods, we uncovered signaling interactions existing amongst the common mediators of endoderm differentiation of hESCs. One of the most common predictions across all conditions and repeats was that the receptor levels are most influential in governing the downstream pathway molecules in most cases. The TGF-βRII levels correlated well with the canonical and non-canonical molecules. The influence of receptor levels on downstream signals provides an avenue to understand the origins of variability that is common in hESC system and it is reasonable to expect that cell-to-cell variability in receptor levels will lead to variability of downstream signals and eventually cell fate specification. In mouse ES cells, it was previously shown that variability in the activity of TGF-β pathway (Activin/Nodal and BMP) controlled the variability in the level of pluripotency marker, NANOG, in the self-renewal state and modulation of receptor activity using small molecule inhibitors influenced the heterogeneity of NANOG in subpopulations [55].
A significant observation was the strong crosstalk interactions of p-AKT with the mediators of TGF-β pathway during Activin induction condition and complete removal of any of these interactions under PI3K inhibition. The introduction of p-AKT mediated interactions and their removal is captured in the independent repeats of the high and low PI3K conditions. Importantly, p-AKT levels could not be continuously suppressed experimentally by continued inhibition of PI3K pathway, and it regained its basal expression. However in spite of the increase in p-AKT expression levels, the correlation remained weak with most molecules like p-SMAD2,3 and p-ERK, indicating continued removal of crosstalk. This is counter-intuitive and demonstrates the necessity of network level analysis to comprehend experimental data, in particular for such complex and dynamic systems. The influence of p-AKT on p-ERK was seen in the high PI3K condition. Report from Dalton Lab has shown increases in p-ERK under p-AKT inhibition in hESCs leading to activation of WNT signaling supporting endoderm differentiation [17]. This can explain the increase in p-ERK levels under PI3K inhibition in our system. In addition, a weaker regulatory role for p-ERK was predicted in the high PI3K condition, with some enhancement under the low PI3K condition. Possibility of p-ERK mediated interactions under low PI3K signaling is interesting. It is known that p-ERK has additional roles in linker phosphorylation of SMAD molecules which can affect the nucleo-cytoplasmic shuttling and ultimately their dynamics as modeled by Liu et al. in this issue of the journal [56]. This could be the reason for seeing increasing p-ERK influence on SMAD molecules under low PI3K condition in some samples. But, since this was observed in only some samples of low PI3K that used the entire time series information, additional investigation needs to be done. Future studies of long-term p-ERK dynamics (>24 h) and perturbation experiments will enable further exploration of this portion of the network. Overall, the identified DBNs demonstrate significant biologically relevant interactions. Such agreement with literature observations along with prediction of additional interactions prove the applicability of quantitative methods for teasing out the network level properties of complex systems like hESCs.
Another important result from DBN analysis was inference of time zones (change-points) where the network parameters changed thereby, indicating an adaptive nature of the network. The nature of the data indicated multiple change-points, with two major change-points in the early and late phases of the dynamics. Application of DBN analysis in the early and late segments showed that the early dynamics is more informative and could adequately identify the network inferred by using the entire time series. This hints at the importance of measuring early dynamics of signal transduction. Further, the late time segments showed strong influence of the receptors levels on other molecules with weaker influence of any crosstalk interaction. It was also seen that the performance of the DBN algorithm in each time zone was better when the number of time points was increased. However, there was no change in the most representative connections, but it enabled loss of some less represented connections.
We recognize that the additional interactions identified here require further testing by perturbation experiments. Further, the interactions identified by DBN need not be direct associations from a biological standpoint, but the resulting effect via intermediated processes. The interacting molecules are solely dependent on the molecules tracked in the experiments. These observations, however, need further investigation in hESCs. An important point to note is that DBN analysis is a useful tool to generate hypothesis based on existing experimental data. The identified networks can inform future experimentation and the network themselves may undergo refinement, a common workflow in systems biology. Hypotheses provided by DBNs can be utilized by detailed modeling approaches like differential equations to investigate the kinetics of the process.
Acknowledgments
The authors would like to thank the Stem Cell Core Facility at the University of Pittsburgh for supply of H1 hESCs. This project was supported by the National Institute of Health New Innovator Award (1DP2OD006491 to IB) and National Science Foundation EAGER fund (CBET-1455800 to IB). The authors would like to thank Yoram Vodovotz and Nabil Azhar at the University of Pittsburgh School of Medicine for valuable discussions on the DBN algorithm.
Author Contributions
Conceived and designed the study: S.M., S.S. and I.B.; Conducted wet-lab experiments: S.S.; Performed computational analysis: S.M.; Supplied reagents and materials: I.B.; Wrote the manuscript: S.M. and I.B.
Nomenclature
| DBN | Dynamic Bayesian Network |
| DE | Definitive Endoderm |
| hESCs | Human Embryonic Stem Cells |
| p-SMAD2 | phosphorylated SMAD2 |
| p-SMAD3 | phosphorylated SMAD3 |
| p-AKT | phosphorylated AKT |
| p-ERK | phosphorylated ERK |
| TGFβ | Transforming growth factor-beta |
| t-TGFβRII | total TGFβ receptor 2 |
| t-SMAD4 | total SMAD4 |
SMAD, PI3K, AKT and ERK are common signaling proteins
Conflicts of Interest
The authors declare no conflict of interest.
References
- Semb, H. Definitive endoderm: A key step in coaxing human embryonic stem cells into transplantable beta-cells. Biochem. Soc. Trans. 2008, 36, 272–275. [Google Scholar] [CrossRef] [PubMed]
- Jaramillo, M.; Mathew, S.; Task, K.; Barner, S.; Banerjee, I. Potential for pancreatic maturation of differentiating human embryonic stem cells is sensitive to the specific pathway of definitive endoderm commitment. PLoS One 2014, 9, e94307. [Google Scholar] [CrossRef] [PubMed]
- Xu, X.; Browning, V.L.; Odorico, J.S. Activin, bmp and fgf pathways cooperate to promote endoderm and pancreatic lineage cell differentiation from human embryonic stem cells. Mech. Dev. 2011, 128, 412–427. [Google Scholar] [CrossRef] [PubMed]
- McLean, A.B.; D’Amour, K.A.; Jones, K.L.; Krishnamoorthy, M.; Kulik, M.J.; Reynolds, D.M.; Sheppard, A.M.; Liu, H.; Xu, Y.; Baetge, E.E. Activin a efficiently specifies definitive endoderm from human embryonic stem cells only when phosphatidylinositol 3-kinase signaling is suppressed. Stem Cells 2007, 25, 29–38. [Google Scholar] [CrossRef] [PubMed]
- D’Amour, K.A.; Agulnick, A.D.; Eliazer, S.; Kelly, O.G.; Kroon, E.; Baetge, E.E. Efficient differentiation of human embryonic stem cells to definitive endoderm. Nat. Biotechnol. 2005, 23, 1534–1541. [Google Scholar] [CrossRef] [PubMed]
- Nostro, M.C.; Sarangi, F.; Ogawa, S.; Holtzinger, A.; Corneo, B.; Li, X.; Micallef, S.J.; Park, I.-H.; Basford, C.; Wheeler, M.B. Stage-specific signaling through tgfβ family members and wnt regulates patterning and pancreatic specification of human pluripotent stem cells. Development 2011, 138, 861–871. [Google Scholar] [CrossRef] [PubMed]
- Basma, H.; Soto-Gutierrez, A.; Yannam, G.R.; Liu, L.; Ito, R.; Yamamoto, T.; Ellis, E.; Carson, S.D.; Sato, S.; Chen, Y.; et al. Differentiation and transplantation of human embryonic stem cell-derived hepatocytes. Gastroenterology 2009, 136, 990–999. [Google Scholar] [CrossRef] [PubMed]
- Sulzbacher, S.; Schroeder, I.S.; Truong, T.T.; Wobus, A.M. Activin a-induced differentiation of embryonic stem cells into endoderm and pancreatic progenitors—The influence of differentiation factors and culture conditions. Stem Cell Reviews Rep. 2009, 5, 159–173. [Google Scholar] [CrossRef]
- Mathew, S.; Jaramillo, M.; Zhang, X.; Zhang, L.A.; Soto-Gutierrez, A.; Banerjee, I. Analysis of alternative signaling pathways of endoderm induction of human embryonic stem cells identifies context specific differences. BMC Syst. Biol. 2012, 6, 154. [Google Scholar] [CrossRef] [PubMed]
- Richardson, T.; Kumta, P.N.; Banerjee, I. Alginate encapsulation of human embryonic stem cells to enhance directed differentiation to pancreatic islet-like cells. Tissue Eng. Part A 2014, 20, 3198–3211. [Google Scholar] [CrossRef] [PubMed]
- Attisano, L.; Wrana, J.L.; Montalvo, E.; Massague, J. Activation of signalling by the activin receptor complex. Mol. Cell. Biol. 1996, 16, 1066–1073. [Google Scholar] [PubMed]
- Massague, J.; Seoane, J.; Wotton, D. Smad transcription factors. Genes Dev. 2005, 19, 2783–2810. [Google Scholar] [CrossRef] [PubMed]
- Wu, M.Y.; Hill, C.S. Tgf-beta superfamily signaling in embryonic development and homeostasis. Dev. Cell 2009, 16, 329–343. [Google Scholar] [CrossRef] [PubMed]
- Dalton, S. Signaling networks in human pluripotent stem cells. Curr. Opin. Cell Biol. 2013, 25, 241–246. [Google Scholar] [CrossRef] [PubMed]
- Avery, S.; Zafarana, G.; Gokhale, P.J.; Andrews, P.W. The role of smad4 in human embryonic stem cell self-renewal and stem cell fate. Stem Cells 2010, 28, 863–873. [Google Scholar] [PubMed]
- Sakaki-Yumoto, M.; Liu, J.M.; Ramalho-Santos, M.; Yoshida, N.; Derynck, R. Smad2 is essential for maintenance of the human and mouse primed pluripotent stem cell state. J. Biol. Chem. 2013, 288, 18546–18560. [Google Scholar] [CrossRef] [PubMed]
- Singh, A.M.; Reynolds, D.; Cliff, T.; Ohtsuka, S.; Mattheyses, A.L.; Sun, Y.; Menendez, L.; Kulik, M.; Dalton, S. Signaling network crosstalk in human pluripotent cells: A smad2/3-regulated switch that controls the balance between self-renewal and differentiation. Cell Stem Cell 2012, 10, 312–326. [Google Scholar] [CrossRef] [PubMed]
- Pauklin, S.; Vallier, L. The cell-cycle state of stem cells determines cell fate propensity. Cell 2013, 155, 135–147. [Google Scholar] [CrossRef] [PubMed]
- Needham, C.J.; Bradford, J.R.; Bulpitt, A.J.; Westhead, D.R. A primer on learning in bayesian networks for computational biology. PLoS Comput. Biol. 2007, 3, e129. [Google Scholar] [CrossRef] [PubMed]
- Woolf, P.J.; Prudhomme, W.; Daheron, L.; Daley, G.Q.; Lauffenburger, D.A. Bayesian analysis of signaling networks governing embryonic stem cell fate decisions. Bioinformatics 2005, 21, 741–753. [Google Scholar] [CrossRef] [PubMed]
- Zielinski, R.; Przytycki, P.F.; Zheng, J.; Zhang, D.; Przytycka, T.M.; Capala, J. The crosstalk between egf, igf, and insulin cell signaling pathways—Computational and experimental analysis. BMC Syst. Biol. 2009, 3, 88. [Google Scholar] [CrossRef] [PubMed]
- Murphy, K.P. Dynamic Bayesian Networks: Representation, Inference and Learning. Ph.D. Thesis, University of California, Berkeley, CA, USA, 2002. [Google Scholar]
- Heinrich, R.; Neel, B.G.; Rapoport, T.A. Mathematical models of protein kinase signal transduction. Mol. Cell 2002, 9, 957–970. [Google Scholar] [CrossRef] [PubMed]
- Koller, D.; Friedman, N. Probabilistic Graphical Models: Principles and Techniques; MIT Press: Cambridge, MA, USA, 2009. [Google Scholar]
- Grzegorczyk, M.; Husmeier, D. Improvements in the reconstruction of time-varying gene regulatory networks: Dynamic programming and regularization by information sharing among genes. Bioinformatics 2011, 27, 693–699. [Google Scholar] [CrossRef] [PubMed]
- Grzegorczyk, M.; Husmeier, D. Non-homogeneous dynamic bayesian networks for continuous data. Mach. Learn. 2011, 83, 355–419. [Google Scholar] [CrossRef]
- Azhar, N.; Ziraldo, C.; Barclay, D.; Rudnick, D.A.; Squires, R.H.; Vodovotz, Y.; Pediatric Acute Liver Failure Study Group. Analysis of serum inflammatory mediators identifies unique dynamic networks associated with death and spontaneous survival in pediatric acute liver failure. PLoS One 2013, 8, e78202. [Google Scholar] [CrossRef] [PubMed]
- Emr, B.; Sadowsky, D.; Azhar, N.; Gatto, L.A.; An, G.; Nieman, G.F.; Vodovotz, Y. Removal of inflammatory ascites is associated with dynamic modification of local and systemic inflammation along with prevention of acute lung injury: In vivo and in silico studies. Shock 2014, 41, 317–323. [Google Scholar] [CrossRef] [PubMed]
- Aerts, J.M.; Haddad, W.M.; An, G.; Vodovotz, Y. From data patterns to mechanistic models in acute critical illness. J. Crit. Care 2014, 29, 604–610. [Google Scholar] [CrossRef] [PubMed]
- Dojer, N.; Gambin, A.; Mizera, A.; Wilczynski, B.; Tiuryn, J. Applying dynamic bayesian networks to perturbed gene expression data. BMC Bioinf. 2006, 7, 249. [Google Scholar] [CrossRef]
- Chang, R.; Shoemaker, R.; Wang, W. Systematic search for recipes to generate induced pluripotent stem cells. PLoS Comput. Biol. 2011, 7, e1002300. [Google Scholar] [CrossRef] [PubMed]
- Grzegorczyk, M.; Husmeier, D. A non-homogeneous dynamic bayesian network with sequentially coupled interaction parameters for applications in systems and synthetic biology. Stat. Appl. Genet. Mol. Biol. 2012, 11. [Google Scholar] [CrossRef]
- Yu, J.; Smith, V.A.; Wang, P.P.; Hartemink, A.J.; Jarvis, E.D. Advances to bayesian network inference for generating causal networks from observational biological data. Bioinformatics 2004, 20, 3594–3603. [Google Scholar] [CrossRef] [PubMed]
- Schmierer, B.; Hill, C.S. Tgfbeta-smad signal transduction: Molecular specificity and functional flexibility. Nat. Rev. Mol. Cell Biol. 2007, 8, 970–982. [Google Scholar] [CrossRef] [PubMed]
- Guo, X.; Wang, X.-F. Signaling cross-talk between tgf-β/bmp and other pathways. Cell Res. 2008, 19, 71–88. [Google Scholar] [CrossRef]
- Zhang, Y.E. Non-smad pathways in tgf-β signaling. Cell Res. 2008, 19, 128–139. [Google Scholar] [CrossRef]
- Conery, A.R.; Cao, Y.; Thompson, E.A.; Townsend, C.M., Jr.; Ko, T.C.; Luo, K. Akt interacts directly with smad3 to regulate the sensitivity to tgf-beta induced apoptosis. Nat. Cell Biol. 2004, 6, 366–372. [Google Scholar] [CrossRef] [PubMed]
- Danielpour, D.; Song, K. Cross-talk between igf-i and tgf-β signaling pathways. Cytokine Growth Factor Rev. 2006, 17, 59–74. [Google Scholar] [CrossRef] [PubMed]
- Song, K.; Wang, H.; Krebs, T.L.; Danielpour, D. Novel roles of akt and mtor in suppressing tgf-beta/alk5-mediated smad3 activation. EMBO J. 2006, 25, 58–69. [Google Scholar] [CrossRef] [PubMed]
- Remy, I.; Montmarquette, A.; Michnick, S.W. Pkb/akt modulates tgf-β signalling through a direct interaction with smad3. Nat. Cell Biol. 2004, 6, 358–365. [Google Scholar] [CrossRef] [PubMed]
- Zhang, L.; Zhou, F.; ten Dijke, P. Signaling interplay between transforming growth factor-β receptor and pi3k/akt pathways in cancer. Trends Biochem. Sci. 2013, 38, 612–620. [Google Scholar] [CrossRef] [PubMed]
- Qiao, J.; Kang, J.; Ko, T.C.; Evers, B.M.; Chung, D.H. Inhibition of transforming growth factor-beta/smad signaling by phosphatidylinositol 3-kinase pathway. Cancer Lett. 2006, 242, 207–214. [Google Scholar] [CrossRef] [PubMed]
- Sun, T.; Ye, F.; Ding, H.; Chen, K.; Jiang, H.; Shen, X. Protein tyrosine phosphatase 1b regulates tgf beta 1-induced smad2 activation through pi3 kinase-dependent pathway. Cytokine 2006, 35, 88–94. [Google Scholar] [CrossRef] [PubMed]
- Aksamitiene, E.; Kiyatkin, A.; Kholodenko, B.N. Cross-talk between mitogenic ras/mapk and survival pi3k/akt pathways: A fine balance. Biochem. Soc. Trans. 2012, 40, 139–146. [Google Scholar] [CrossRef] [PubMed]
- Villaverde, A.F.; Banga, J.R. Reverse engineering and identification in systems biology: Strategies, perspectives and challenges. J. R. Soc. Interface 2014, 11, 20130505. [Google Scholar] [CrossRef] [PubMed]
- Banerjee, I.; Maiti, S.; Parashurama, N.; Yarmush, M. An integer programming formulation to identify the sparse network architecture governing differentiation of embryonic stem cells. Bioinformatics 2010, 26, 1332–1339. [Google Scholar] [CrossRef] [PubMed]
- Chemmangattuvalappil, N.; Task, K.; Banerjee, I. An integer optimization algorithm for robust identification of non-linear gene regulatory networks. BMC Syst. Biol. 2012, 6, 119. [Google Scholar] [CrossRef] [PubMed]
- Guillen-Gosálbez, G.; Miró, A.; Alves, R.; Sorribas, A.; Jiménez, L. Identification of regulatory structure and kinetic parameters of biochemical networks via mixed-integer dynamic optimization. BMC Syst. Biol. 2013, 7, 113. [Google Scholar] [CrossRef] [PubMed]
- Rodriguez-Fernandez, M.; Rehberg, M.; Kremling, A.; Banga, J.R. Simultaneous model discrimination and parameter estimation in dynamic models of cellular systems. BMC Syst. Biol. 2013, 7, 76. [Google Scholar] [CrossRef] [PubMed]
- Penfold, C.A.; Wild, D.L. How to infer gene networks from expression profiles, revisited. Interface Focus 2011, 1, 857–870. [Google Scholar] [CrossRef] [PubMed]
- Lee, W.P.; Tzou, W.S. Computational methods for discovering gene networks from expression data. Brief Bioinform. 2009, 10, 408–423. [Google Scholar] [PubMed]
- Bansal, M.; Belcastro, V.; Ambesi-Impiombato, A.; Di Bernardo, D. How to infer gene networks from expression profiles. Mol. Syst. Biol. 2007, 3. [Google Scholar] [CrossRef]
- Tegner, J.; Yeung, M.K.; Hasty, J.; Collins, J.J. Reverse engineering gene networks: Integrating genetic perturbations with dynamical modeling. Proc. Natl. Acad. Sci. USA 2003, 100, 5944–5949. [Google Scholar] [CrossRef] [PubMed]
- Molinelli, E.J.; Korkut, A.; Wang, W.; Miller, M.L.; Gauthier, N.P.; Jing, X.; Kaushik, P.; He, Q.; Mills, G.; Solit, D.B.; et al. Perturbation biology: Inferring signaling networks in cellular systems. PLoS Comput. Biol. 2013, 9, e1003290. [Google Scholar] [CrossRef] [PubMed]
- Galvin-Burgess, K.E.; Travis, E.D.; Pierson, K.E.; Vivian, J.L. Tgf-β-superfamily signaling regulates embryonic stem cell heterogeneity: Self-renewal as a dynamic and regulated equilibrium. Stem Cells 2013, 31, 48–58. [Google Scholar] [CrossRef] [PubMed]
- Liu, J.; Dai, W.; Hahn, J. Mathematical modeling and analysis of crosstalk between mapk pathway and smad-dependent tgf-β signal transduction. Processes 2014, 2, 570–595. [Google Scholar] [CrossRef]
© 2015 by the authors; licensee MDPI, Basel, Switzerland. This article is an open access article distributed under the terms and conditions of the Creative Commons Attribution license (http://creativecommons.org/licenses/by/4.0/).