Article

Processing-Dependent Aging Behavior of Dental Resins: Impact on Color Stability and Translucency

1
Department of Restorative Odontology and Endodontics, School of Dental Medicine, University of Belgrade, Rankeova 4, 11000 Belgrade, Serbia
2
Institute of Technical Sciences of SASA, Kneza Mihaila 35/IV, 11000 Belgrade, Serbia
3
Department of Prosthodontics, School of Dental Medicine, University of Belgrade, Rankeova 4, 11000 Belgrade, Serbia
4
Institute of Physics, University of Belgrade, Pregrevica 118, 11000 Belgrade, Serbia
*
Author to whom correspondence should be addressed.
Processes 2026, 14(9), 1359; https://doi.org/10.3390/pr14091359
Submission received: 17 March 2026 / Revised: 15 April 2026 / Accepted: 21 April 2026 / Published: 23 April 2026
(This article belongs to the Special Issue Advances in Multifunctional Natural and Synthetic Biomaterials)

Abstract

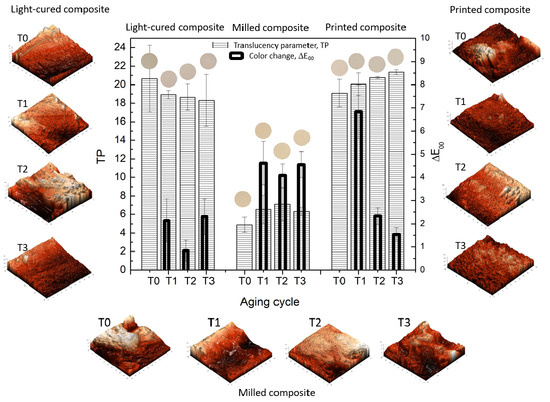
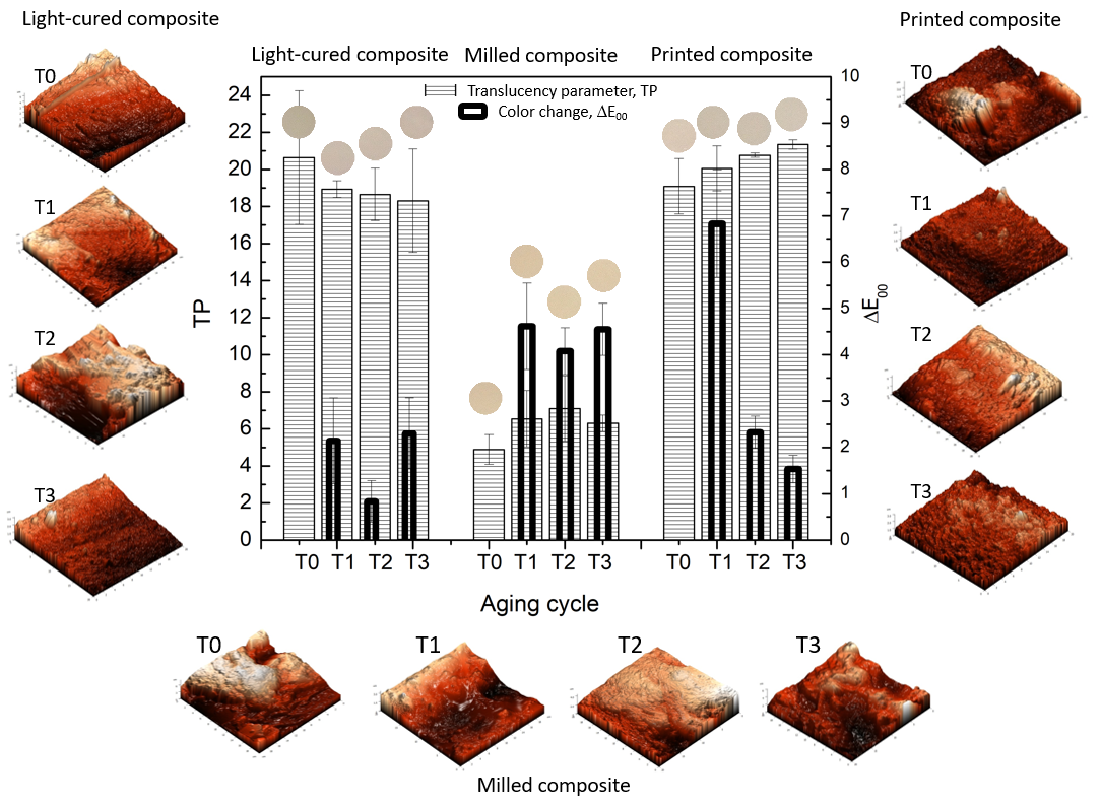
This study comparatively evaluated the influence of processing routes on the optical stability of three dental resin composites: a light-cured direct composite—G-ænial A’CHORD (LCC), a CAD-CAM milled composite—BreCAM.HIPC (MC), and a 3D-printed composite—Saremco Print Crowntec (PC). Specimens were analyzed before (T0) and after hydrothermal aging for 5000 (T1), 10,000 (T2), and 30,000 cycles (T3). Optical stability was assessed through the change in color (ΔE00) and translucency parameter (TP) after aging and immersion in beverages. Surface topography was evaluated using atomic force microscopy (AFM), while Raman spectroscopy was employed to detect aging-induced molecular changes. After aging and staining, all composites exceeded the acceptability threshold for color change. ΔE00 values of 6.8 ± 1.1 (PC), 4.6 ± 0.9 (MC), and 2.1 ± 0.9 (LCC), obtained after initial aging, further increased following prolonged immersion in coffee. After 1 day of immersion in Coca-Cola, MC exhibited the highest ΔE00 values, which slightly exceeded the clinically acceptable threshold. Prolonged immersion (7 days) significantly increased staining for all materials. TP values significantly differed among materials, with the highest values detected for LCC (20.6 ± 3.6) and PC (19.1 ± 1.5) and the lowest values detected for MC (4.9 ± 0.8). Overall, the results demonstrated that ΔE00 was strongly influenced by the processing route and surface topography, whereas changes in translucency parameter (TP) were predominantly governed by the intrinsic properties of the resin composites.

Graphical Abstract

1. Introduction

Resin composites have been extensively utilized in clinical practice owing to their exceptional esthetic performance and their ability to biomimetically replicate the optical and structural integrity of lost tooth tissues [1]. However, the use of conventional light-cured composites has raised several concerns related to polymerization shrinkage and postoperative sensitivity [2,3]. Incomplete polymerization may reduce the polymer cross-link density, thereby increasing the susceptibility of materials to water sorption, hydrolytic degradation, and surface roughening [4,5]. When exposed to the dynamic oral environment, characterized by temperature fluctuations and the frequent consumption of staining beverages and foods, these materials become increasingly prone to discoloration [6]. Recent technological advancements in manufacturing processes have expanded the range of resin composites to include CAD/CAM milling and additive manufacturing (3D printing). These processing methods result in distinct microstructural and chemical characteristics that influence the properties of the final product. CAD/CAM-milled resin composites benefit from industrial polymerization processes that generally provide a higher degree of conversion and improved structural homogeneity. Nevertheless, these composites remain susceptible to water-related degradation and surface alterations over time. In contrast, additive manufacturing systems, which are designed to ensure printability of composite resins, typically require a higher proportion of organic matrix and a reduced filler content. This composition can affect water sorption, surface degradation, and pigment uptake, particularly depending on post-processing procedures such as washing, polishing, and additional extraoral curing [7,8,9].
Color differences in dentistry are commonly evaluated using the CIEDE2000 color difference formula (ΔE00), based on the CIELAB color space. A color difference perceived by 50% of observers corresponds to the 50:50 perceptibility threshold (PT00), while a color difference considered acceptable by 50% of observers corresponds to the 50:50 acceptability threshold (AT00). According to established criteria, the threshold values are PT00 = 0.8 and AT00 = 1.8 [10].
Although CAD/CAM-milled resin composites have been extensively investigated, comparative studies addressing the optical and chemical stability of resin composites produced by different processing techniques remain limited [11,12]. Therefore, the aim of the present study was to systematically evaluate and compare the optical properties (color change and translucency parameter) of three representative resin composites (with different resin composition and filler loading) processed by conventional light curing, CAD/CAM milling, and additive manufacturing, following hydrothermal aging and immersion in staining solutions for different times. Determined optical characteristics are correlated for the first time with composites that have chemical stability (i.e., molecular changes) and surface topography evaluated by Raman spectroscopy and atomic force microscopy (AFM), respectively.

2. Materials and Methods

2.1. Specimen Preparation

Three dental composite materials produced using different processing techniques were evaluated in this study (Table 1): a light-cured resin composite—G-ænial A’CHORD, GC Corporation, Tokyo, Japan (LCC), a CAD/CAM-milled polymer—BreCAM.HIPC, bredent GmbH & Co. KG, Senden, Germany (MC), and a 3D-printed composite—Crowntec, Saremco Dental AG, Rebstein, Switzerland (PC). For each material, disc-shaped specimens (5 mm diameter × 2 mm thickness) were prepared according to the manufacturer’s instructions.
For processing of LC specimens, a 2 mm layer of material was placed into a silicone mold in a single increment and covered with a transparent polyester Mylar strip (SS White, Philadelphia, PA, USA). The assembly was gently pressed against a microscope glass plate to obtain a uniform, smooth, and flat surface and to prevent the formation of an oxygen inhibition layer. Each specimen was light-cured perpendicularly in direct contact with the Mylar strip and glass plate for 20 s using an LED curing unit (Bluephase Style, Ivoclar Vivadent, Schaan, Liechtenstein) at an intensity of 1000 mW/cm2, according to the manufacturer’s recommendations.
MC specimens were designed using CAD software (inLab MC X5, Dentsply Sirona, Charlotte, NC, USA), exported as standard tessellation language (STL) files, and milled from a material disc using a milling machine.
The PC specimens were designed in CAD software and exported as standard tessellation language (STL) files to printing software (AccuWare, Shining 3D, Hangzhou, Zhejiang, China). The specimens were fabricated using a DLP printer (AccuFab-L4D, Shining 3D) under the following parameters: 90° build orientation, 50 μm layer thickness, and a printer wavelength of 405 nm. Post-processing aimed at removing residual monomers was performed by immersing the specimens in 90% isopropyl alcohol using a cleaning system (FH-WA-01, Formlabs, Somerville, MA, USA) for 20 min, followed by drying with compressed air. Subsequently, post-curing was carried out for 30 min at 405 nm using a light-curing unit (FabCure 2, Shining 3D).
After processing, all specimens were finished and polished according to the manufacturer’s instructions. The specimens were then stored in distilled water at 37 °C for 24 h to allow stabilization of the cross-linked resin matrix and completion of polymerization reactions prior to further analyses.
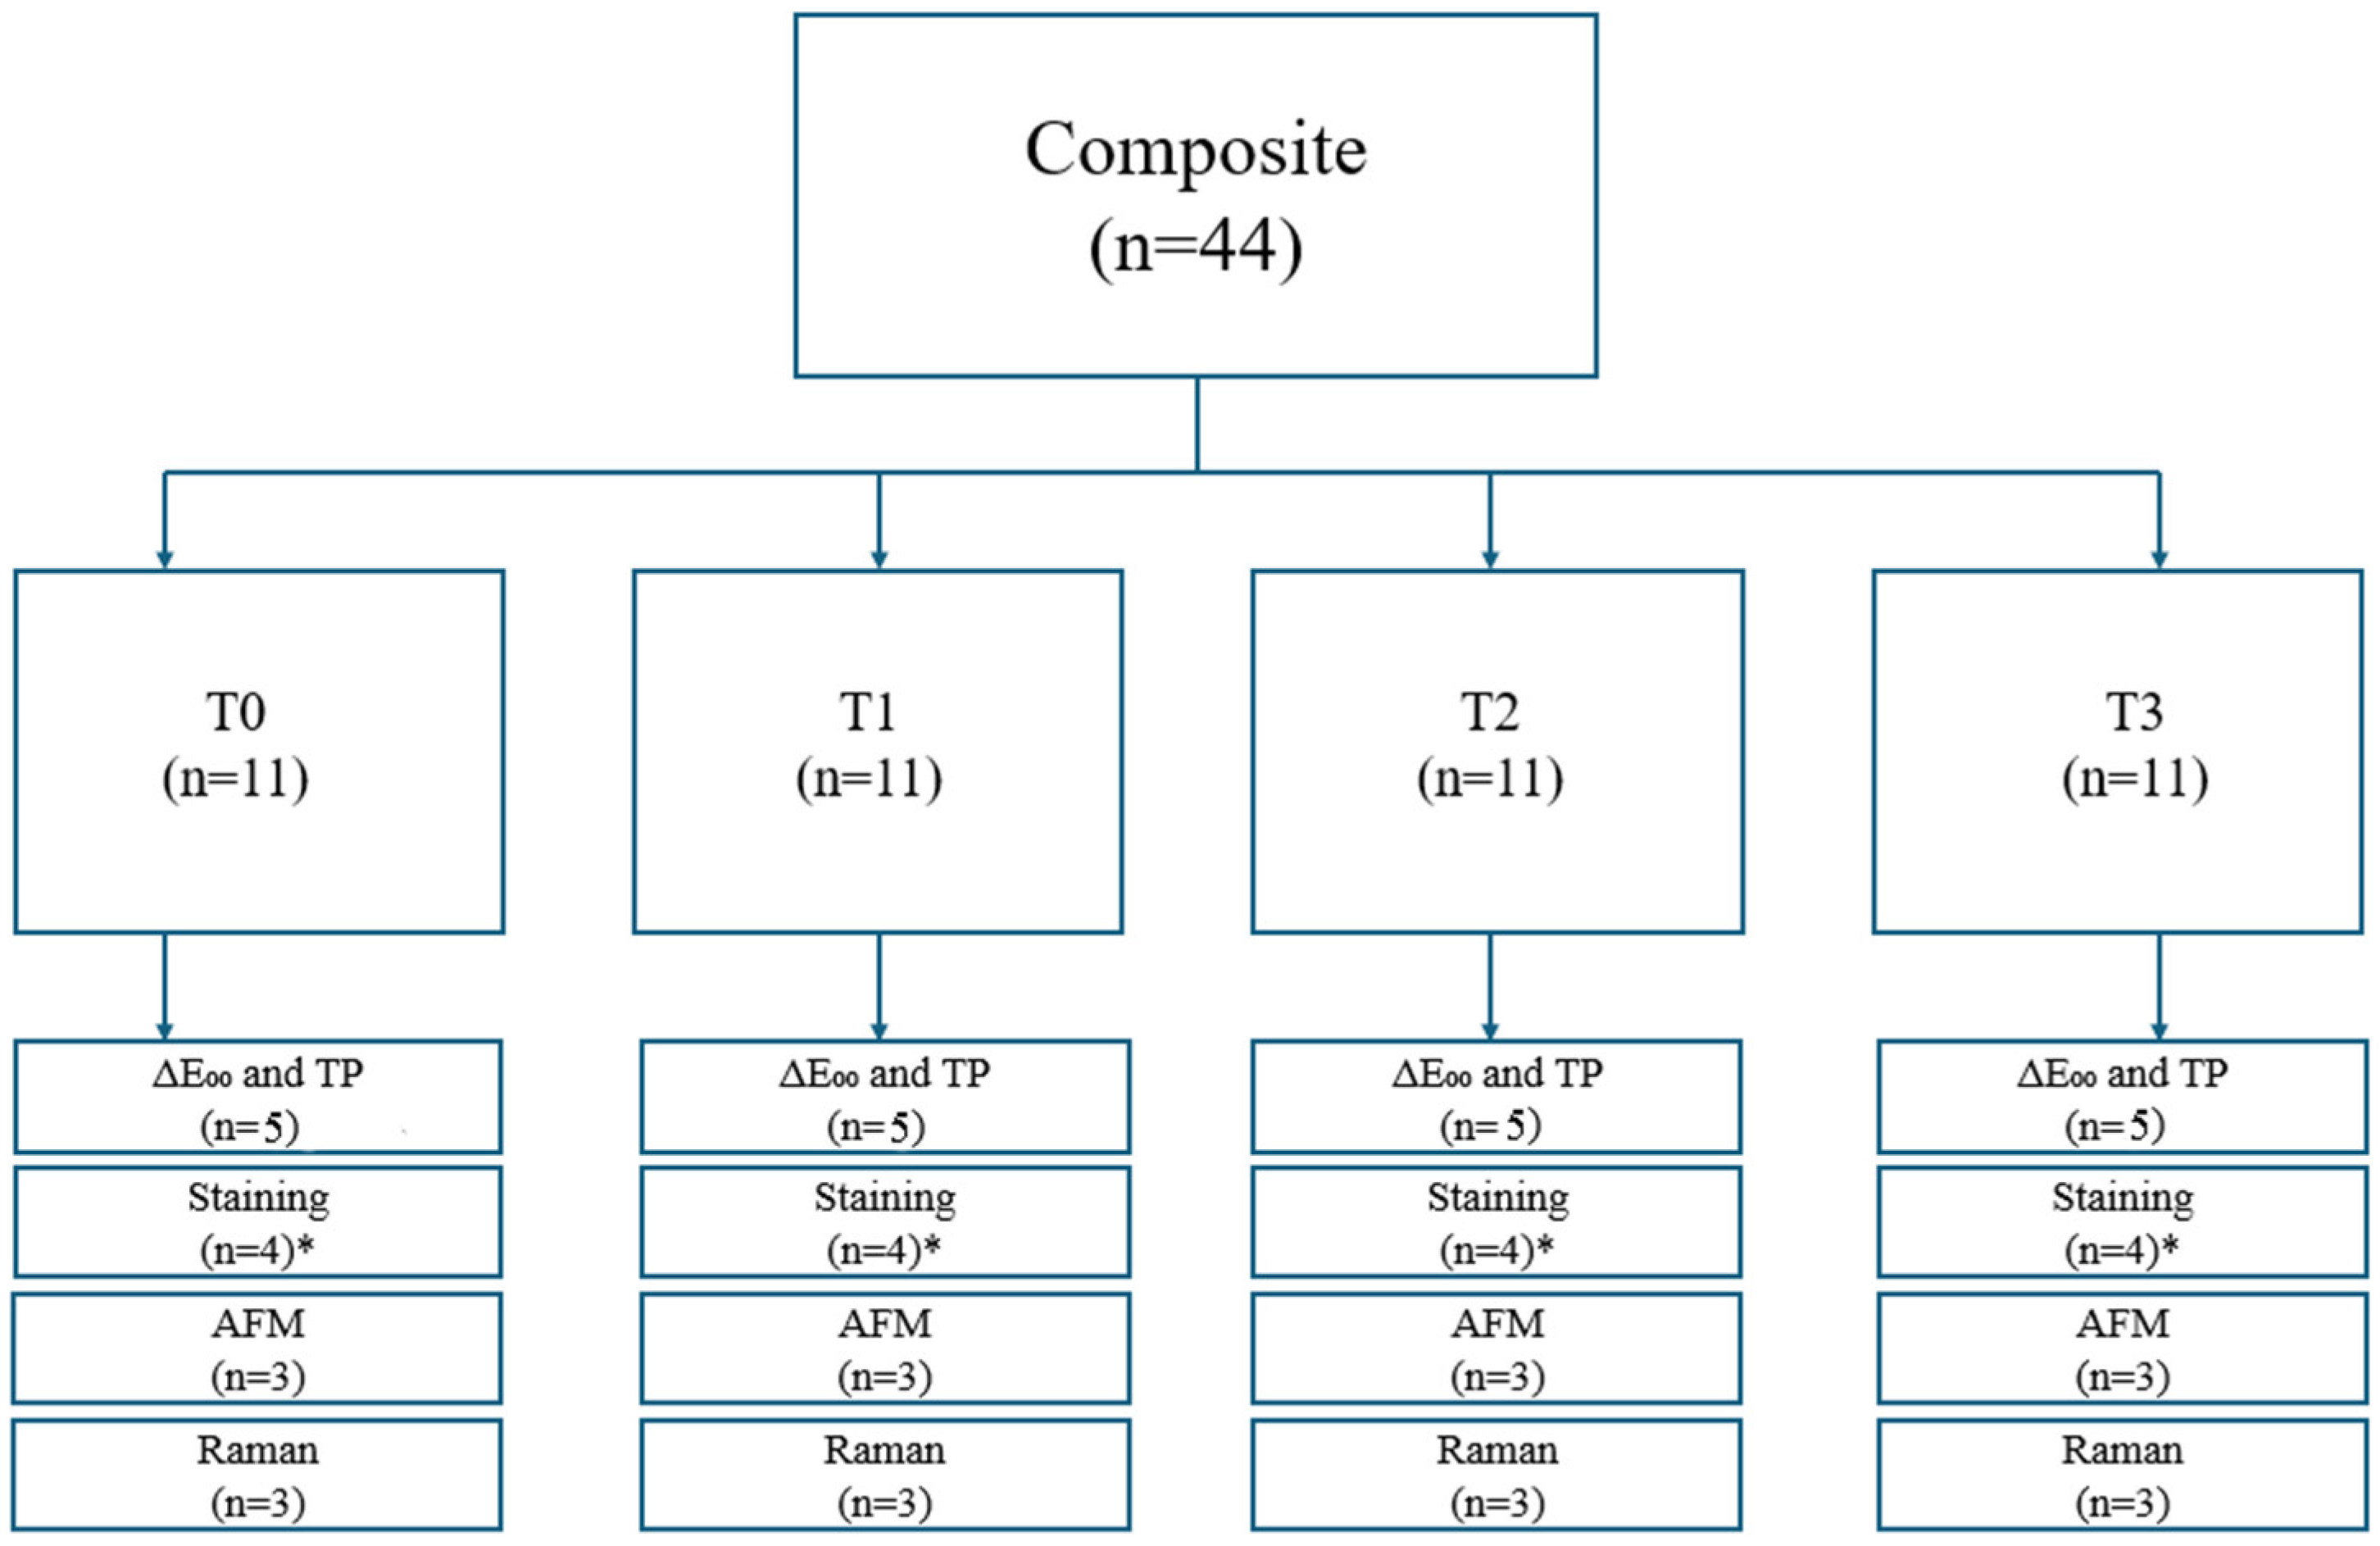
A total of 132 specimens were prepared, with 44 specimens per material (n = 44). The specimens were randomly assigned to four independent aging intervals (T0, T1, T2, and T3) (n = 11 per group). For the evaluation of color change (ΔE00) and translucency parameters (TPs), five specimens of composites (n = 5) were analyzed for each aging group. After aging, four randomly selected specimens from each aging group of composites were selected for staining. Staining was performed in coffee (2 samples, one for 1 day and another for 7 days) and Coca-Cola (2 samples, one for 1 day and another for 7 days). In addition, three specimens per aging interval for each composite were allocated for Raman spectroscopy and three were allocated for atomic force microscopy (AFM) analysis. The complete experimental workflow for each composite, including the number of specimens assigned to each analysis, is summarized in Figure 1.

2.2. Hydrothermal Aging

Hydrothermal aging was performed using a thermocycler (Thermo Cycler THE 1200, SD Mechatronik, Feldkirchen-Westerham, Germany), by alternating specimens between cold water (5 °C) and hot water (55 °C), with a dwell time of 60 s and a transfer time of 10 s. To minimize bacterial and fungal contamination, the specimens were rinsed with distilled water and immersed in freshly prepared solutions, which were renewed every three days during the aging procedure. Thermocycling was conducted for 5000 (T1; approximately 6 clinical months), 10,000 (T2; approximately 1 clinical year), and 30,000 (T3; approximately 3 clinical years) thermal cycles [13]. Unaged control specimens were designated as T0.

2.3. Color Change and Translucency Parameter of Dental Resin Composites

The color change (ΔE00) and translucency parameters (TPs) of specimens were evaluated over a white certified standard (Labshere, North Sutton, NH, USA) and a black color standard (Spidercheckr 24, Lawrenceville, GA, USA) as backgrounds. The measurement setup consisted of a standard illuminant D65 (BDS130—BWTEK, Plainsboro, NJ, USA), a TE-cooled CCD fluorescence spectrometer (Glacier X, BWTEK, Plainsboro, NJ, USA), a reflection sphere (Labsphere, North Sutton, NH, USA), and an Optronik digilux 9500 luxmeter (Instrument Systems GmbH, Berlin, Germany). ΔE00 and TP were evaluated before and after aging (thermocycling), as well as before and after the immersion of specimens in 10mL of cold coffee (Nescafé Classic, Nestlé, Vevey, Switzerland) or Coca-Cola (The Coca-Cola Company, Atlanta, GA, USA), for 1 and 7 days. The coffee solution was prepared by dissolving 3 g of instant coffee in 150 mL of boiled distilled water. During immersion, specimens were stored at 37 °C in a dark environment, after which they were rinsed with distilled water, gently air-dried, and subjected to characterization.
The color change was calculated according to the CIEDE2000 equation [14]:
Δ E 00 = L k L S L 2 + C k C S C 2 + H k H S H 2 + R T C k C S C H k H S H
where ΔL′—corrected lightness difference; ΔC′—corrected chroma difference; ΔH′—corrected hue difference; kL—lightness weighting factor; kC—chroma weighting factor; kH—hue weighting factor; SL—lightness compensation; SC—chroma compensation; SH—hue compensation; and RT—interaction term between chroma and hue differences (this accounts for blue regions of perceptual non-uniformity).
The translucency parameter was determined by calculating the color difference in the same specimen measured against black and white backgrounds using the following equation [15]:
TP = {(LB* − LW*)2 + (aB* − aW*)2 + (bB* − bW*)2}1/2
where the subscripts B and W correspond to the color coordinates measured over black and white backgrounds, respectively.

2.4. Atomic Force Microscopy (AFM)

AFM analysis was performed using an NTEGRA PRIMA atomic force microscope (NT-MDT, Moscow, Russia) operating in semi-contact mode. Topography and phase images were acquired simultaneously using NSG01 silicon probes (NT-MDT, Moscow, Russia) with a typical resonant frequency of approximately 150 kHz and a nominal tip apex radius of about 10 nm. For each group, randomly selected areas from three specimens were scanned to identify a representative region. The acquired height images were processed using the manufacturer’s software, and the surface roughness parameter root mean square roughness (Rq) was calculated from the height distribution.

2.5. Raman Spectroscopy

Raman spectroscopy was performed using a commercial NTegra Spectra system (NT-MDT, Moscow, Russia) equipped with a 532 nm excitation laser. The laser power was set to 2 mW at the sample surface, focused to an approximate spot size of 0.5 × 0.5 µm. The exposure time was set to 360 s. Instrument calibration was performed before each session using the standard first-order silicon reference peak at 520.7 cm−1. For each group, randomly selected areas from three specimens were recorded to identify a representative area. All Raman spectra were recorded in an unpolarized mode to reduce the influence of anisotropy and orientation-related spectral variability.

2.6. Statistical Analysis

For the evaluation of color change (ΔE00) and translucency parameters (TPs), materials were prepared and analyzed in replicates for each aging group, followed by data processing using SPSS Statistics (version 22.0, IBM Corp., Chicago, IL, USA). Results were expressed as the average of the obtained results, ±standard deviation. For analysis of statistically significant differences, the non-parametric Mann–Whitney U-test was used to compare measurements of hydrothermally aged samples to the measurements of samples before aging. The level of statistical significance was set to * p < 0.05.

3. Results

3.1. Color Change

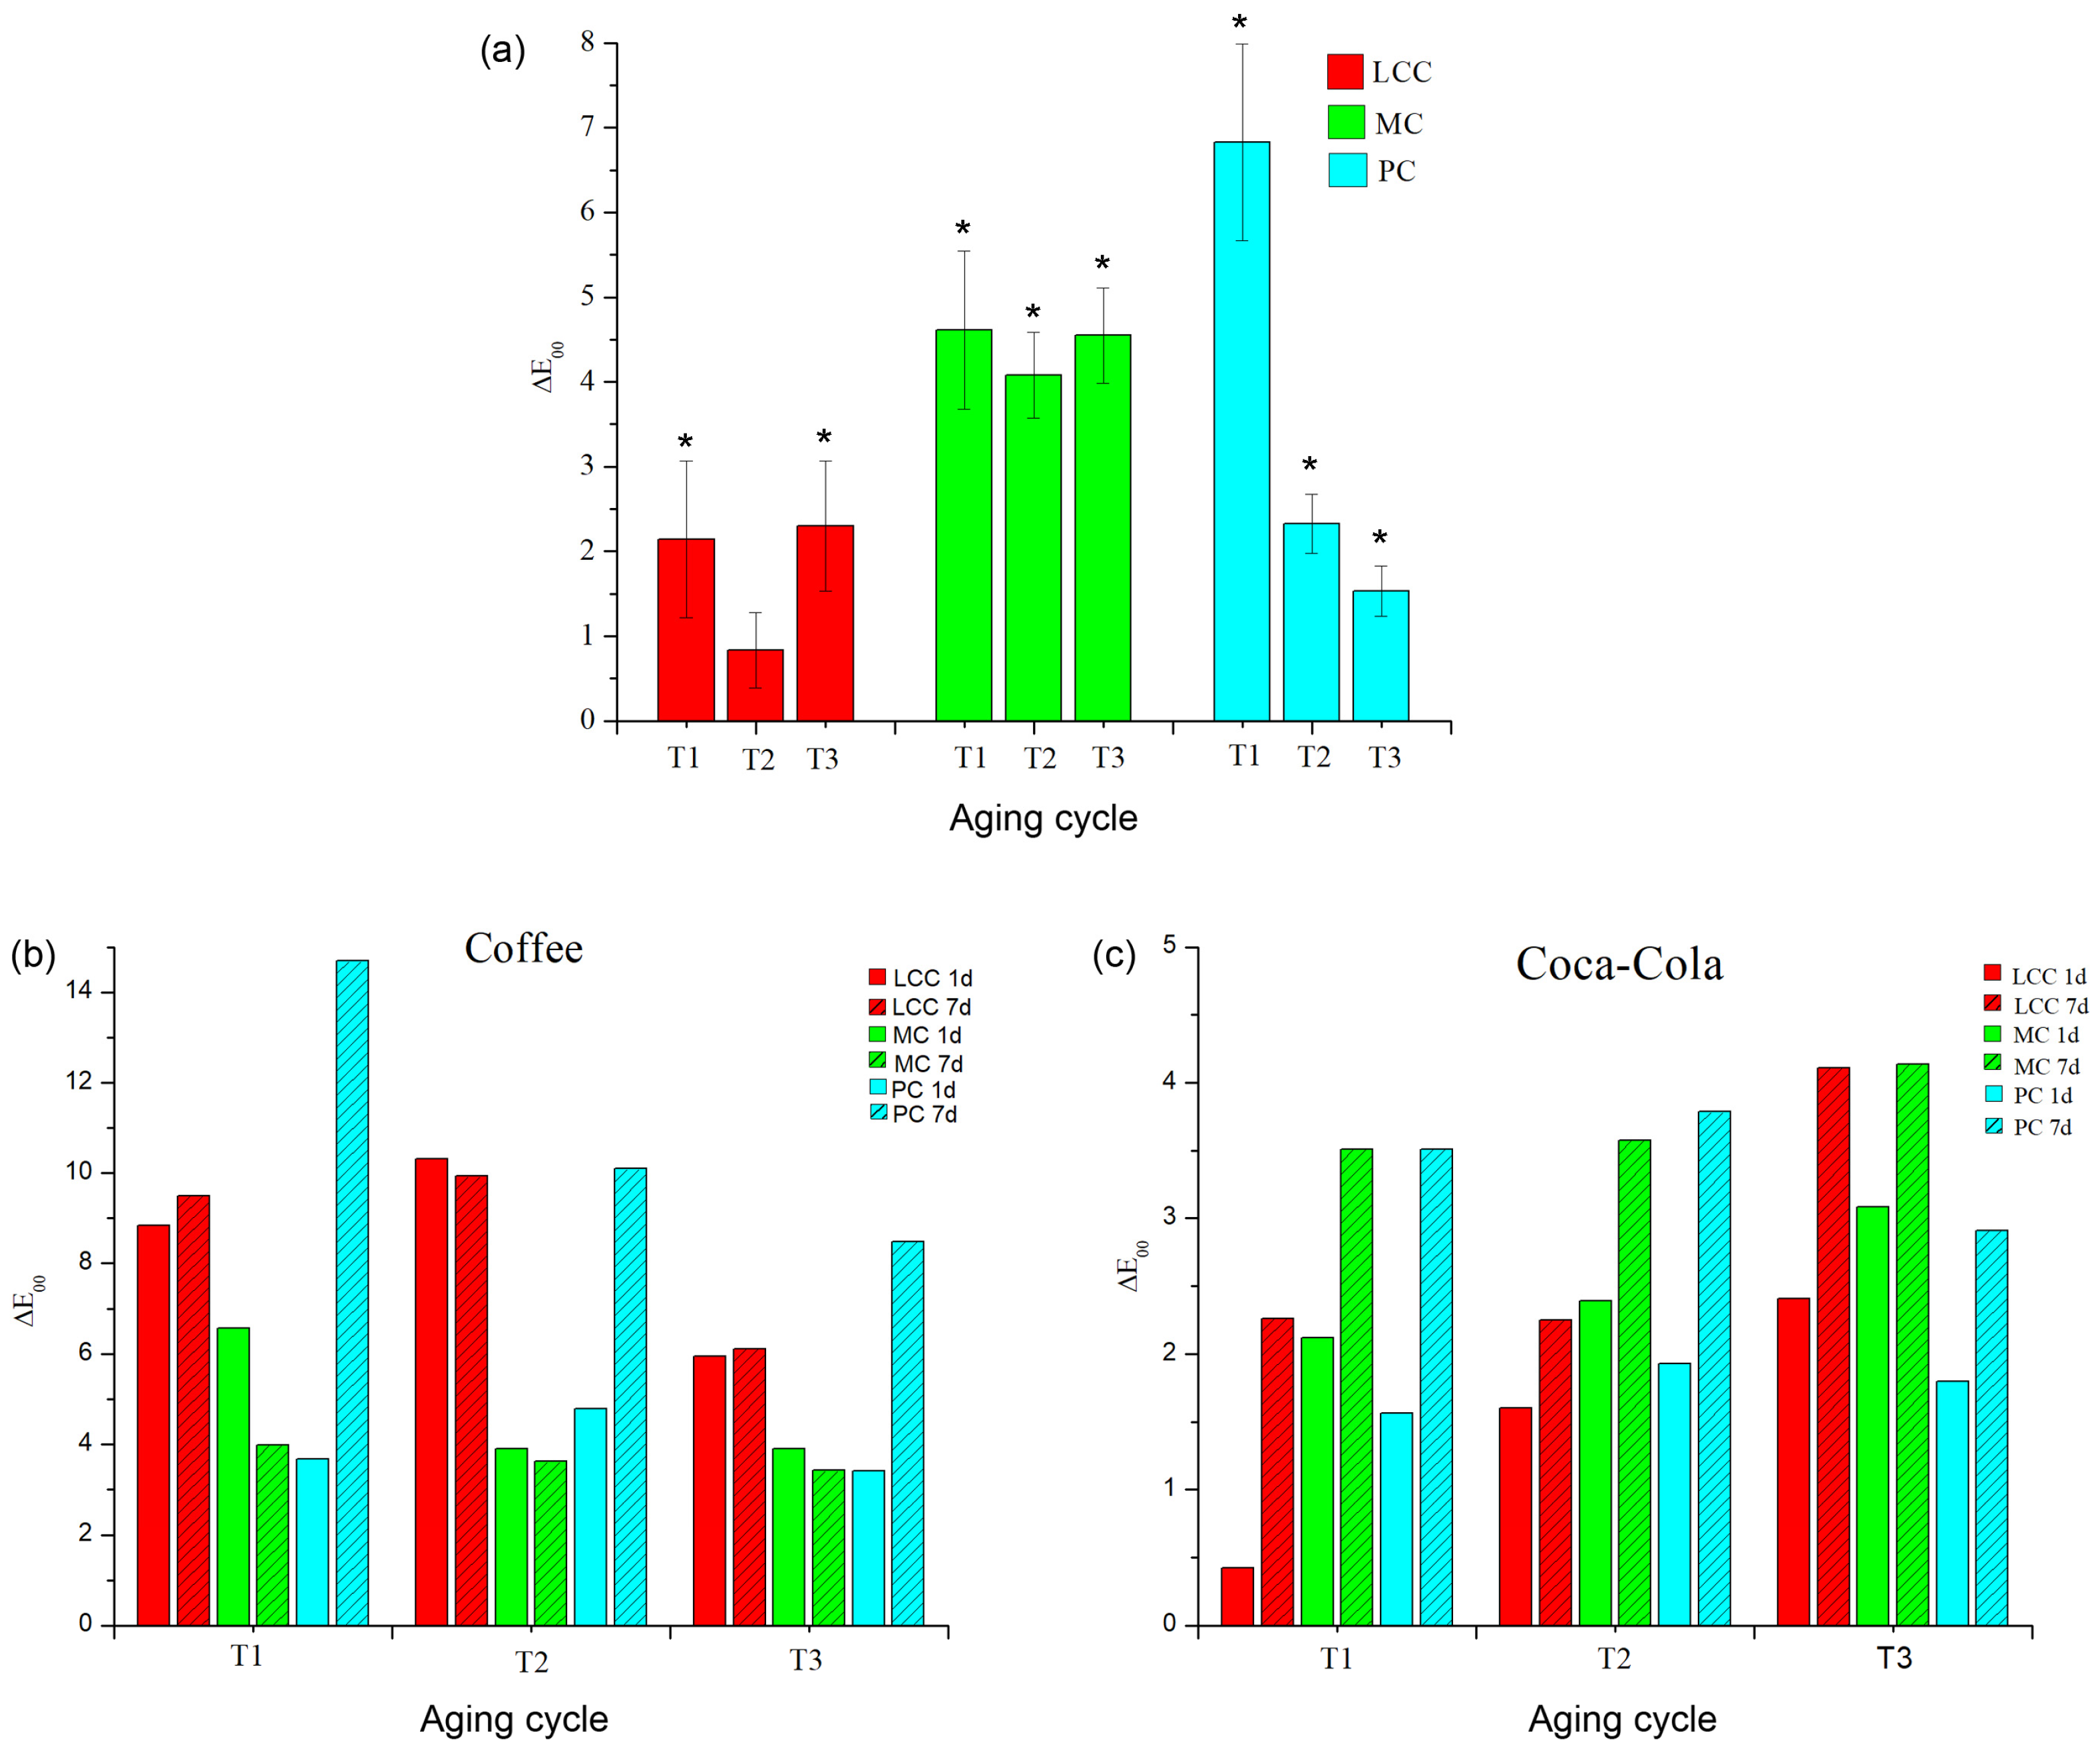
Color changes in the specimens after hydrothermal aging and subsequent staining are presented in Figure 2. For clinical interpretation, ΔE00 values were compared with the perceptibility (PT00 = 0.8) and acceptability (AT00 = 1.8) thresholds, while the statistical significance threshold was expressed as * (p < 0.05). After the first aging cycle (T1), all tested composite materials exceeded the acceptability threshold, with the highest ΔE00 values observed for PC (6.8 ± 1.1), followed by MC (4.6 ± 0.9), while LCC exhibited the lowest color change (2.1 ± 0.9) (Figure 2a). With increasing numbers of aging cycles, the ΔE00 values of LCC and MC remained relatively stable. In contrast, PC showed a pronounced and clinically acceptable decrease in ΔE00 values with further aging (1.5 ± 0.2, T3), with the highest discoloration recorded after the first aging cycle (T1).
Following immersion in coffee, all investigated materials exhibited clinically unacceptable color changes, with noticeable increases in ΔE00 values for PC after prolonged exposure to the staining solution (as shown in Figure 2b). The MC demonstrated the lowest susceptibility to discoloration after coffee immersion. The highest ΔE00 value (8.8, T1) was recorded following 1 day of staining, whereas the remaining aging intervals and immersion durations exhibited approximately two-fold lower color change values. For the LCC, the ΔE00 values determined after different immersion times remained largely unchanged and even showed a slight decrease with increasing numbers of aging cycles. (5.9–T3, 1 day; and 6.1–T3, 7 days).
Similarly, immersion in Coca-Cola induced color changes in all tested composites, with ΔE00 values generally increasing with longer immersion times (as shown in Figure 2c). After 1 day of immersion, the LCC exhibited the lowest and most clinically acceptable color changes (0.4—T1; 1.5—T2; 2.4—T3); MC showed the highest values and was slightly above the clinically acceptable range ΔE00 (2.1—T1; 2.3—T2; 3.1—T3); and PC demonstrated clinically acceptable values with moderate changes (1.6—T1; 1.9—T2; 1.7—T3). Prolonged immersion for 7 days significantly increased staining for all materials. The MC showed consistently high ΔE00 values across all aging intervals. For LCC, ΔE00 increased markedly with aging, reaching the highest clinically unacceptable value after the third aging cycle (4.1, T3). The PC also exhibited increased staining after 7 days, although a slight decrease was observed after the third aging cycle. Overall, extended immersion time in beverages had a stronger effect on color change than the number of aging cycles.

3.2. Translucency Parameter

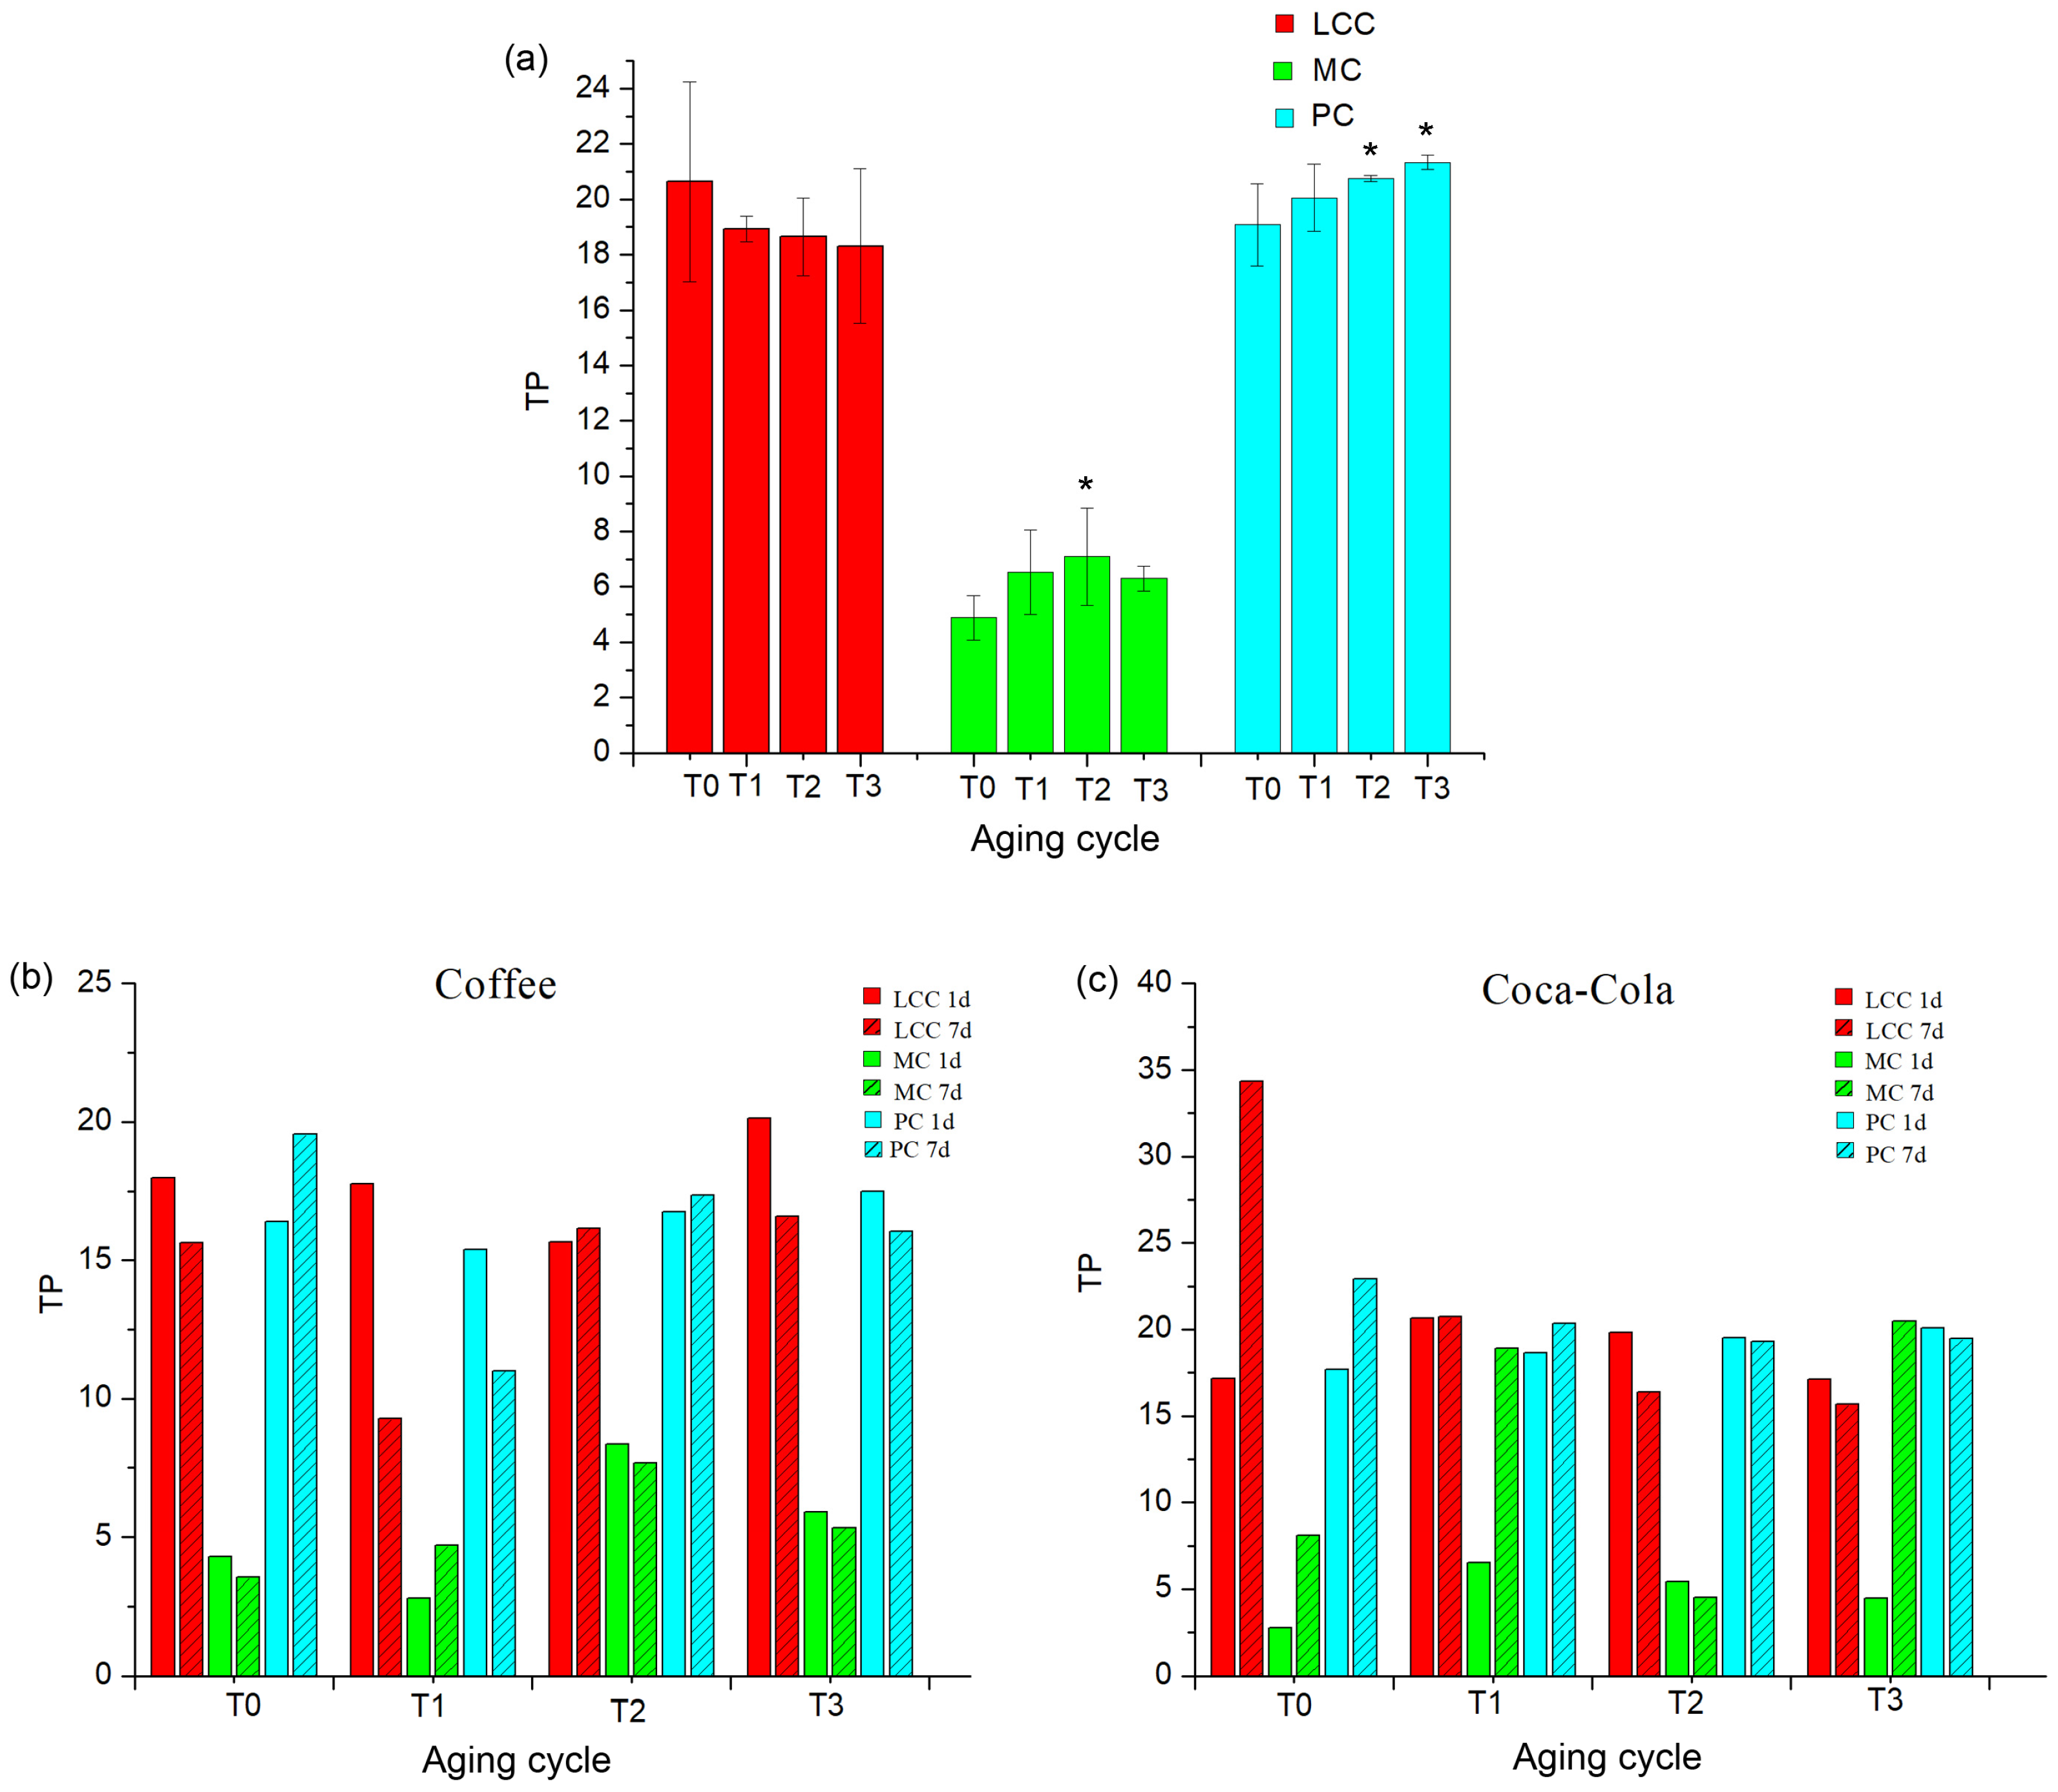
Values of translucency parameters, which illustrate the ability of dental material to transmit light, were determined after hydrothermal aging and subsequent staining (as shown in Figure 3). It is notable that TP values significantly differed among materials (as shown in Figure 3a). While higher values were recorded for LCC (20.6 ± 3.6) and PC (19.1 ± 1.5), MC exhibited substantially lower translucency (4.9 ± 0.8). With increasing numbers of aging cycles, the TP of the LCC slightly decreased (18.3 ± 3.8, T3). In contrast, MC and PC showed a pronounced increase in TP with aging, with the highest values recorded after the second (7.1 ± 1.7) and third aging cycles (21.3 ± 0.2), respectively.
Immersion in coffee resulted in noticeable changes in TP for all tested composites across all aging stages (as shown in Figure 3b). For the unaged LCC, relatively high TP values were observed after 1 day of coffee immersion (17.9, T0). After the first two aging cycles, TP was almost unchanged, but then it increased with further aging (20.1—T3, 1 day). The MC maintained consistently low TP values throughout aging, with moderate fluctuations and a slight increase after the second aging cycle, particularly following 7 days of immersion (8.4—T2, 7 days). In contrast, PC showed consistently high TP values across all aging intervals after 1 day of coffee immersion (15.41—T1; 16.8—T2; 17.5—T3). Differences in TP between 1-day and 7-day immersion were evidenced in terms of the initial increase, followed by a decrease with further aging.
Following immersion in Coca-Cola for 1 day and 7 days, alterations in TP were also observed for all resin composites (as shown in Figure 3c). For LCC, TP values progressively decreased with increasing aging cycles, indicating reduced translucency at advanced aging stages, particularly after 7 days of immersion (15.7—T3). The MC following 1 day of immersion generally exhibited low TP values across all aging intervals, with a tendency to increase with prolonged thermocycling, especially after 7 days of immersion (15.7—T3). In contrast, the PC maintained consistently high TP values after 1 day of Coca-Cola immersion, with a slight increase observed with initial aging following 7 days of immersion (18.6—T1).

3.3. Topography and Phase Images of Dental Resin Composites

AFM in semi-contact mode was used to obtain high-resolution two- and three-dimensional topographical maps of the dental composite surfaces and evaluate surface roughness. Representative AFM topographs illustrating morphological changes after thermocycling are presented in Figure 4, Figure 5 and Figure 6.
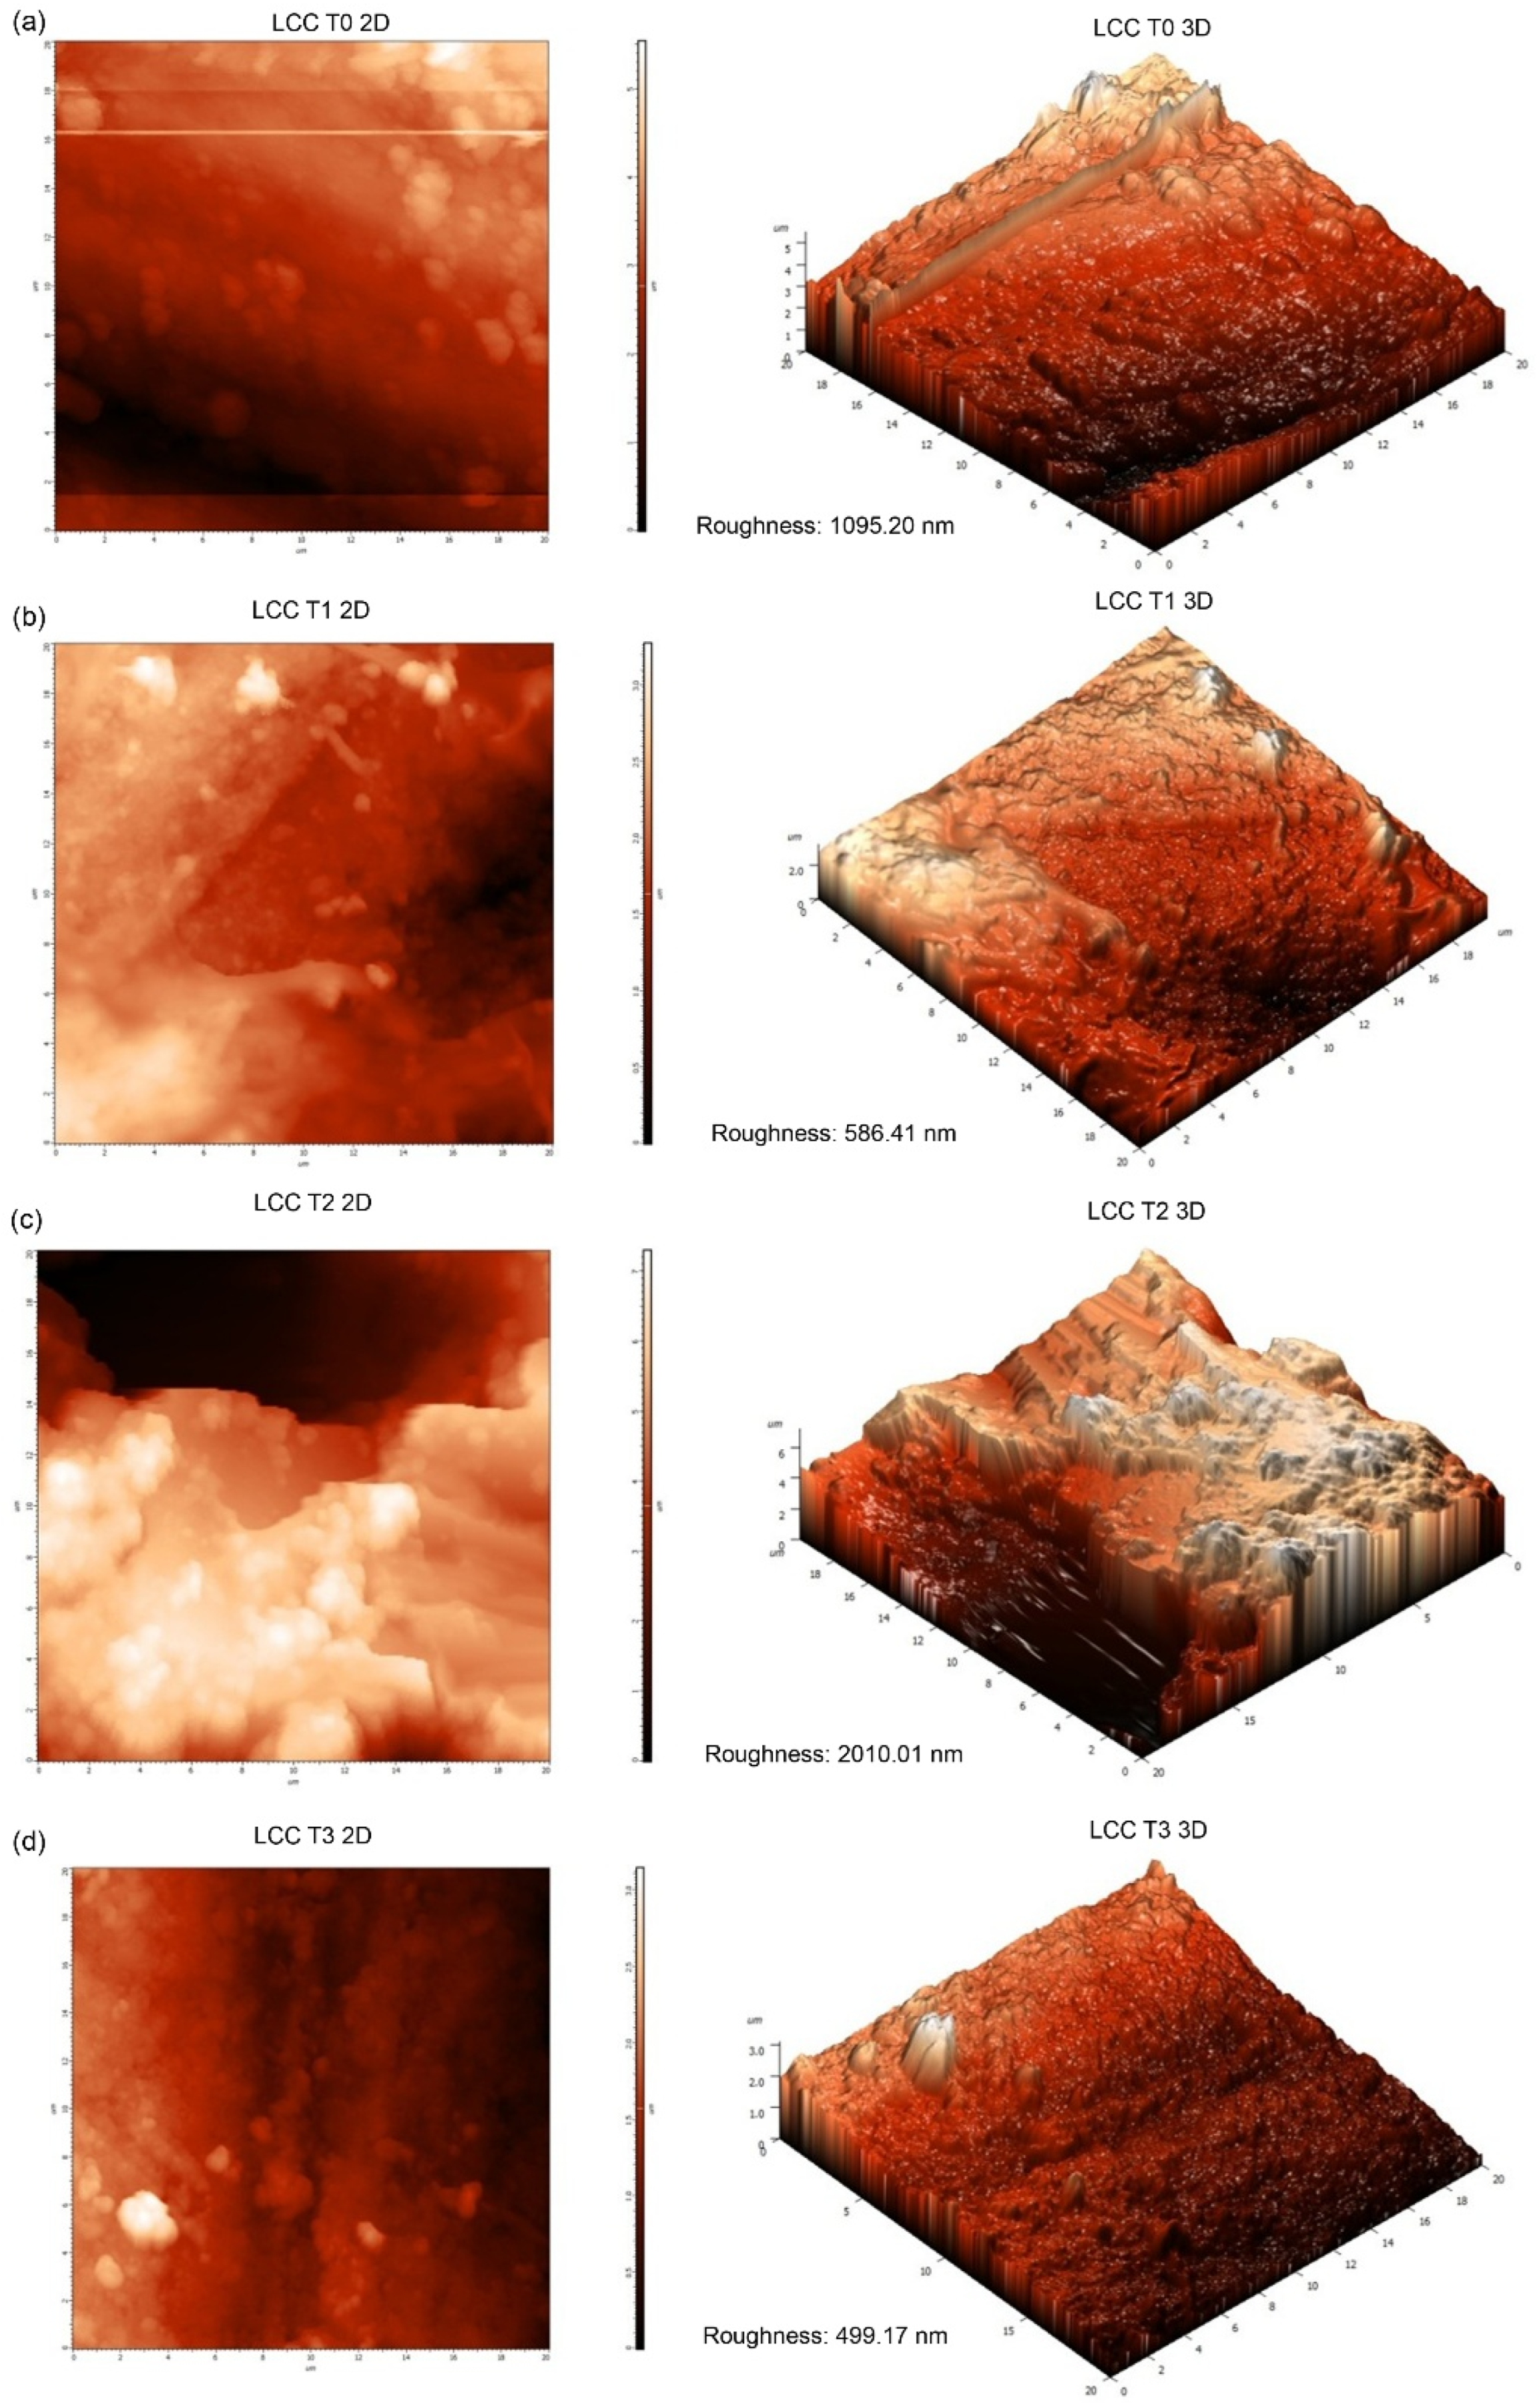
The surface of the unaged LCC, as shown in Figure 4a, displayed a heterogeneous morphology characterized by irregular protrusions embedded within a relatively smooth matrix. Elevated structures surrounded by localized depressions resulted in a highly irregular nanoscale topography. After initial aging, as shown in Figure 4b, the surface became more homogeneous with reduced topographic amplitude. The prominent protrusions observed in the unaged specimens became less pronounced, and the morphology evolved toward a smoother, gently undulating structure. Further aging, as shown in Figure 4c, produced a highly irregular morphology characterized by deep pits, sharp crater-like edges, and interconnected ridge-like structures, indicating pronounced spatial heterogeneity. After extended thermocycling, as shown in Figure 4d, the surface appeared globally flattened compared with earlier stages but exhibited a granular texture. The previously observed pits became wider and shallower, while ridge-like features appeared more rounded.
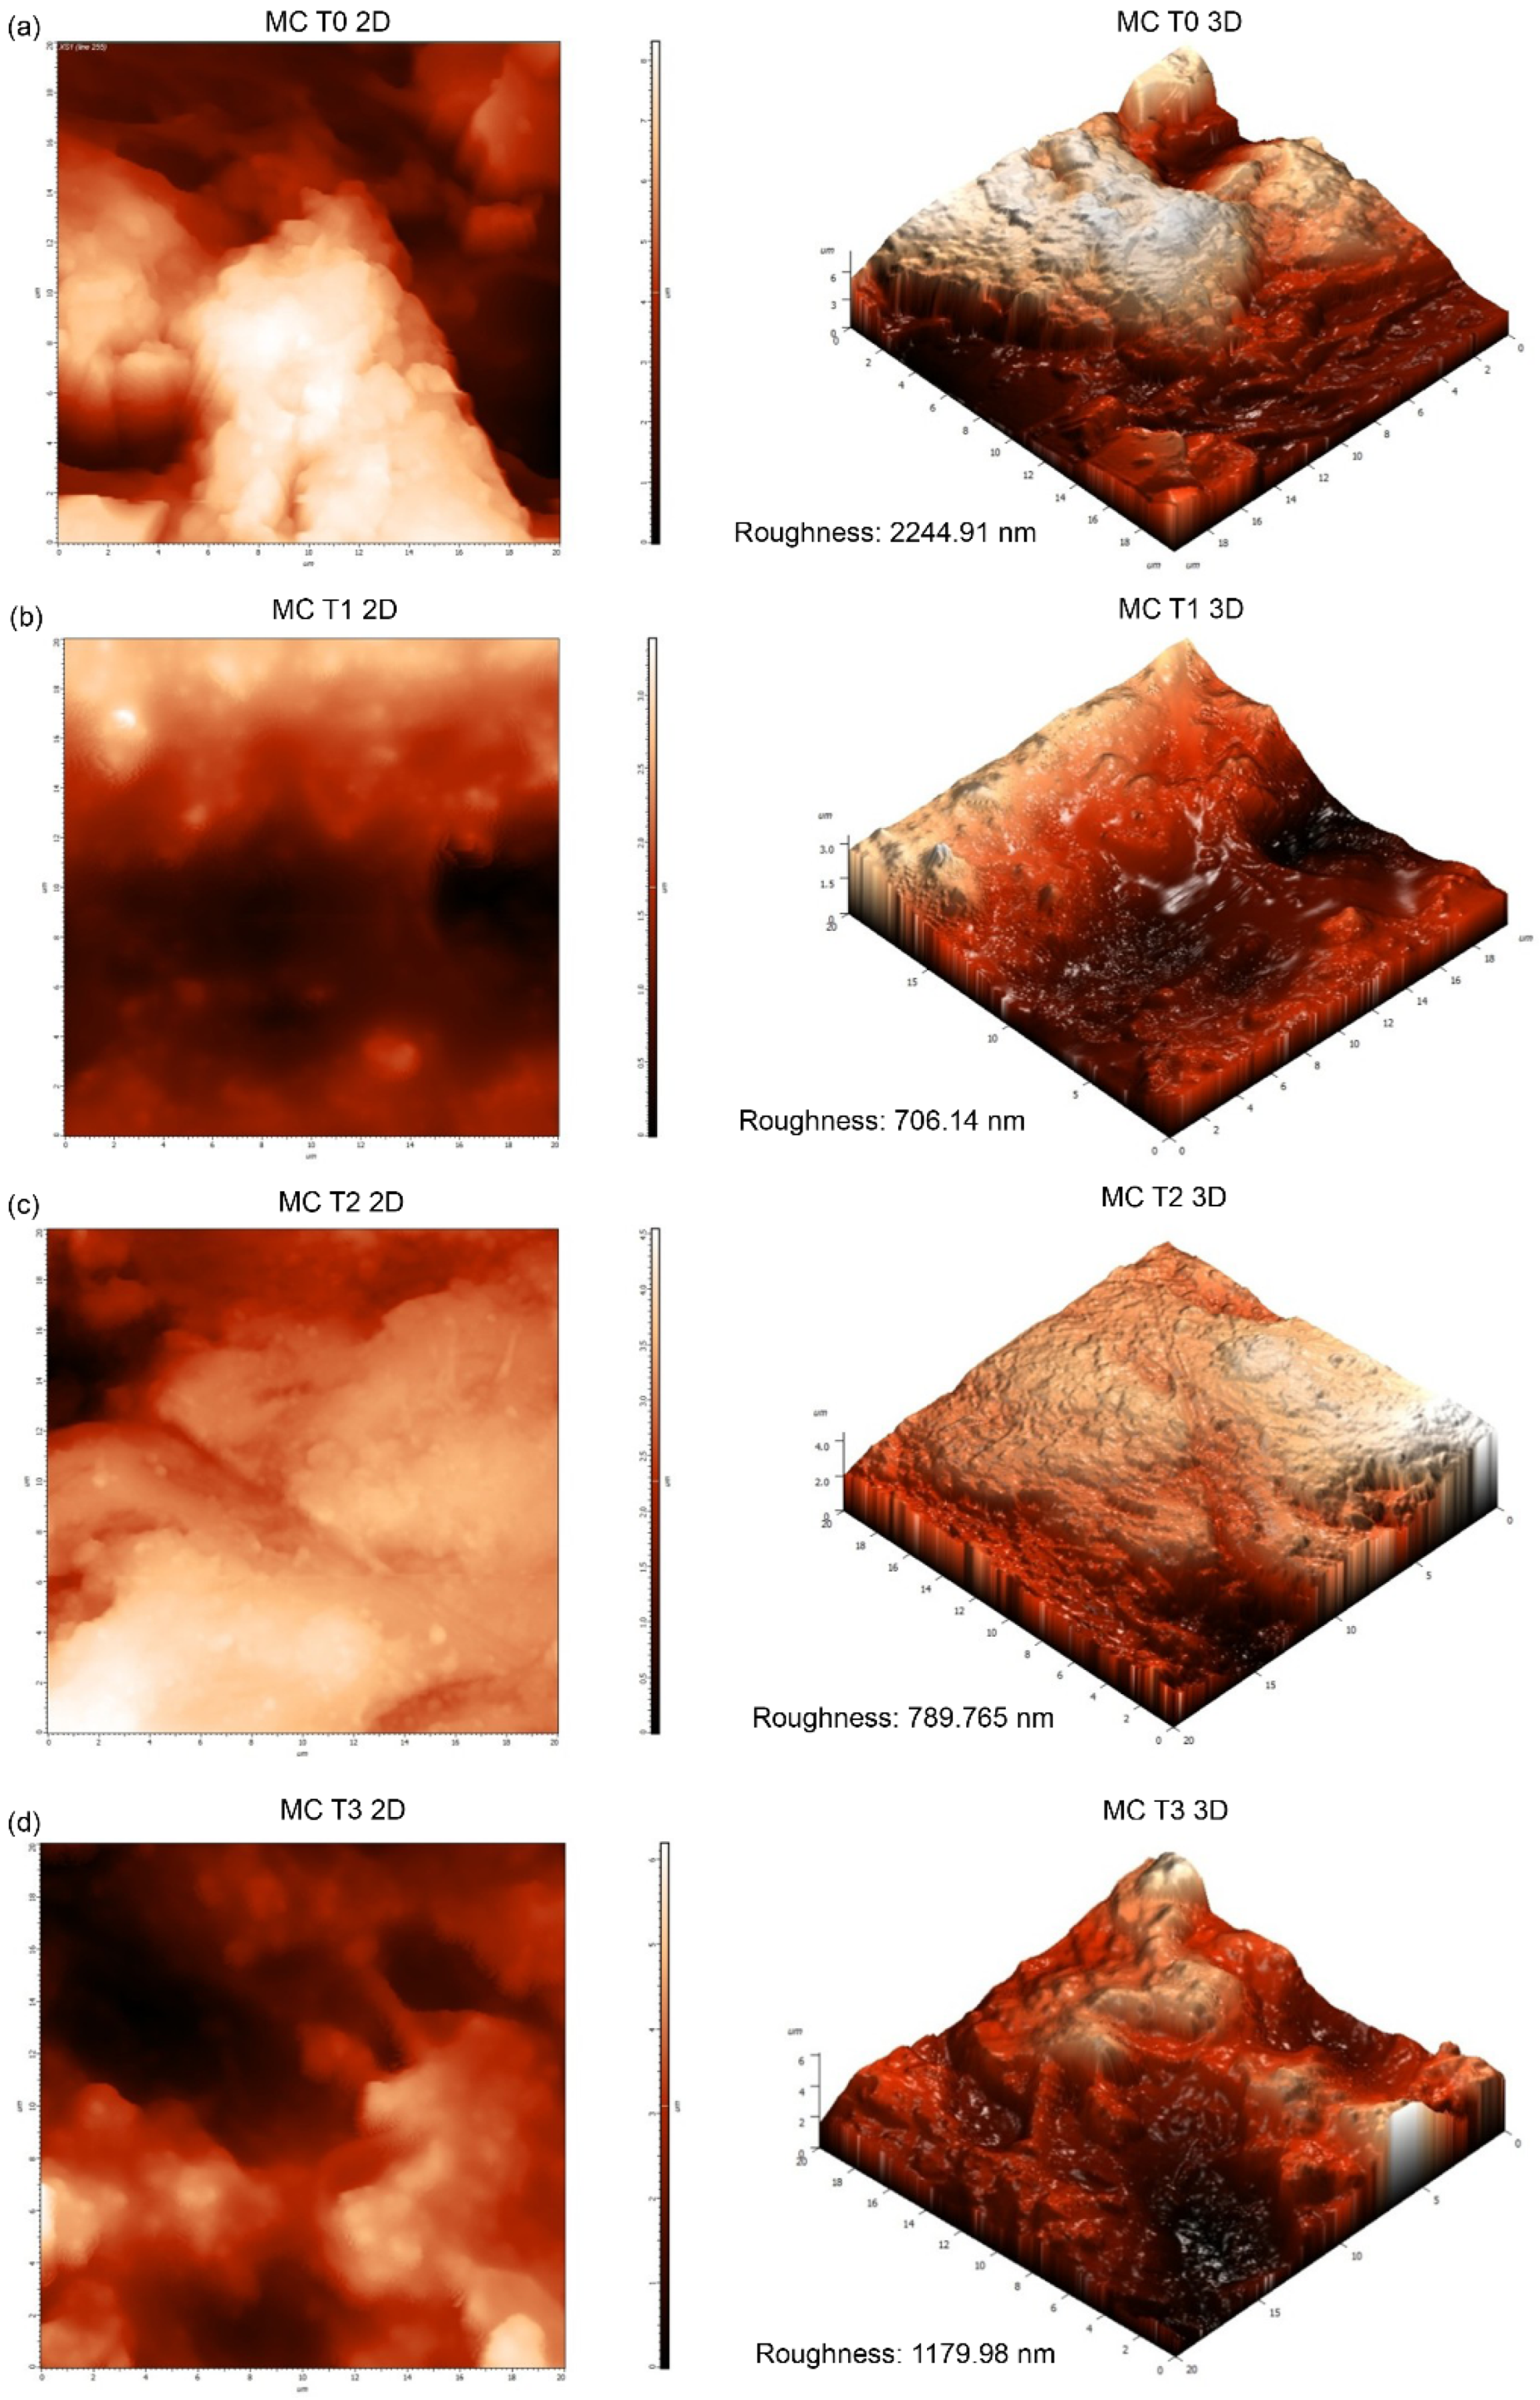
The unaged MC, as shown in Figure 5a, exhibited a complex topography characterized by sharp, irregular protrusions and deep valleys, resulting in a pronounced topographic contrast. After initial aging, as shown in Figure 5b, the surface appeared visually smoother with a reduction in the height and sharpness of the protrusions. The morphology became more uniform and showed a gently undulating structure. With further aging, as shown in Figure 5c, the surface appeared flatter compared with previous stages but retained a fine granular texture. The pits became broader and shallower, while sharp ridges were replaced by more rounded features. After prolonged aging, as shown in Figure 5d, the surface again developed a highly irregular morphology characterized by deep pits, ridge-like structures, and localized surface defects, indicating strong spatial heterogeneity.
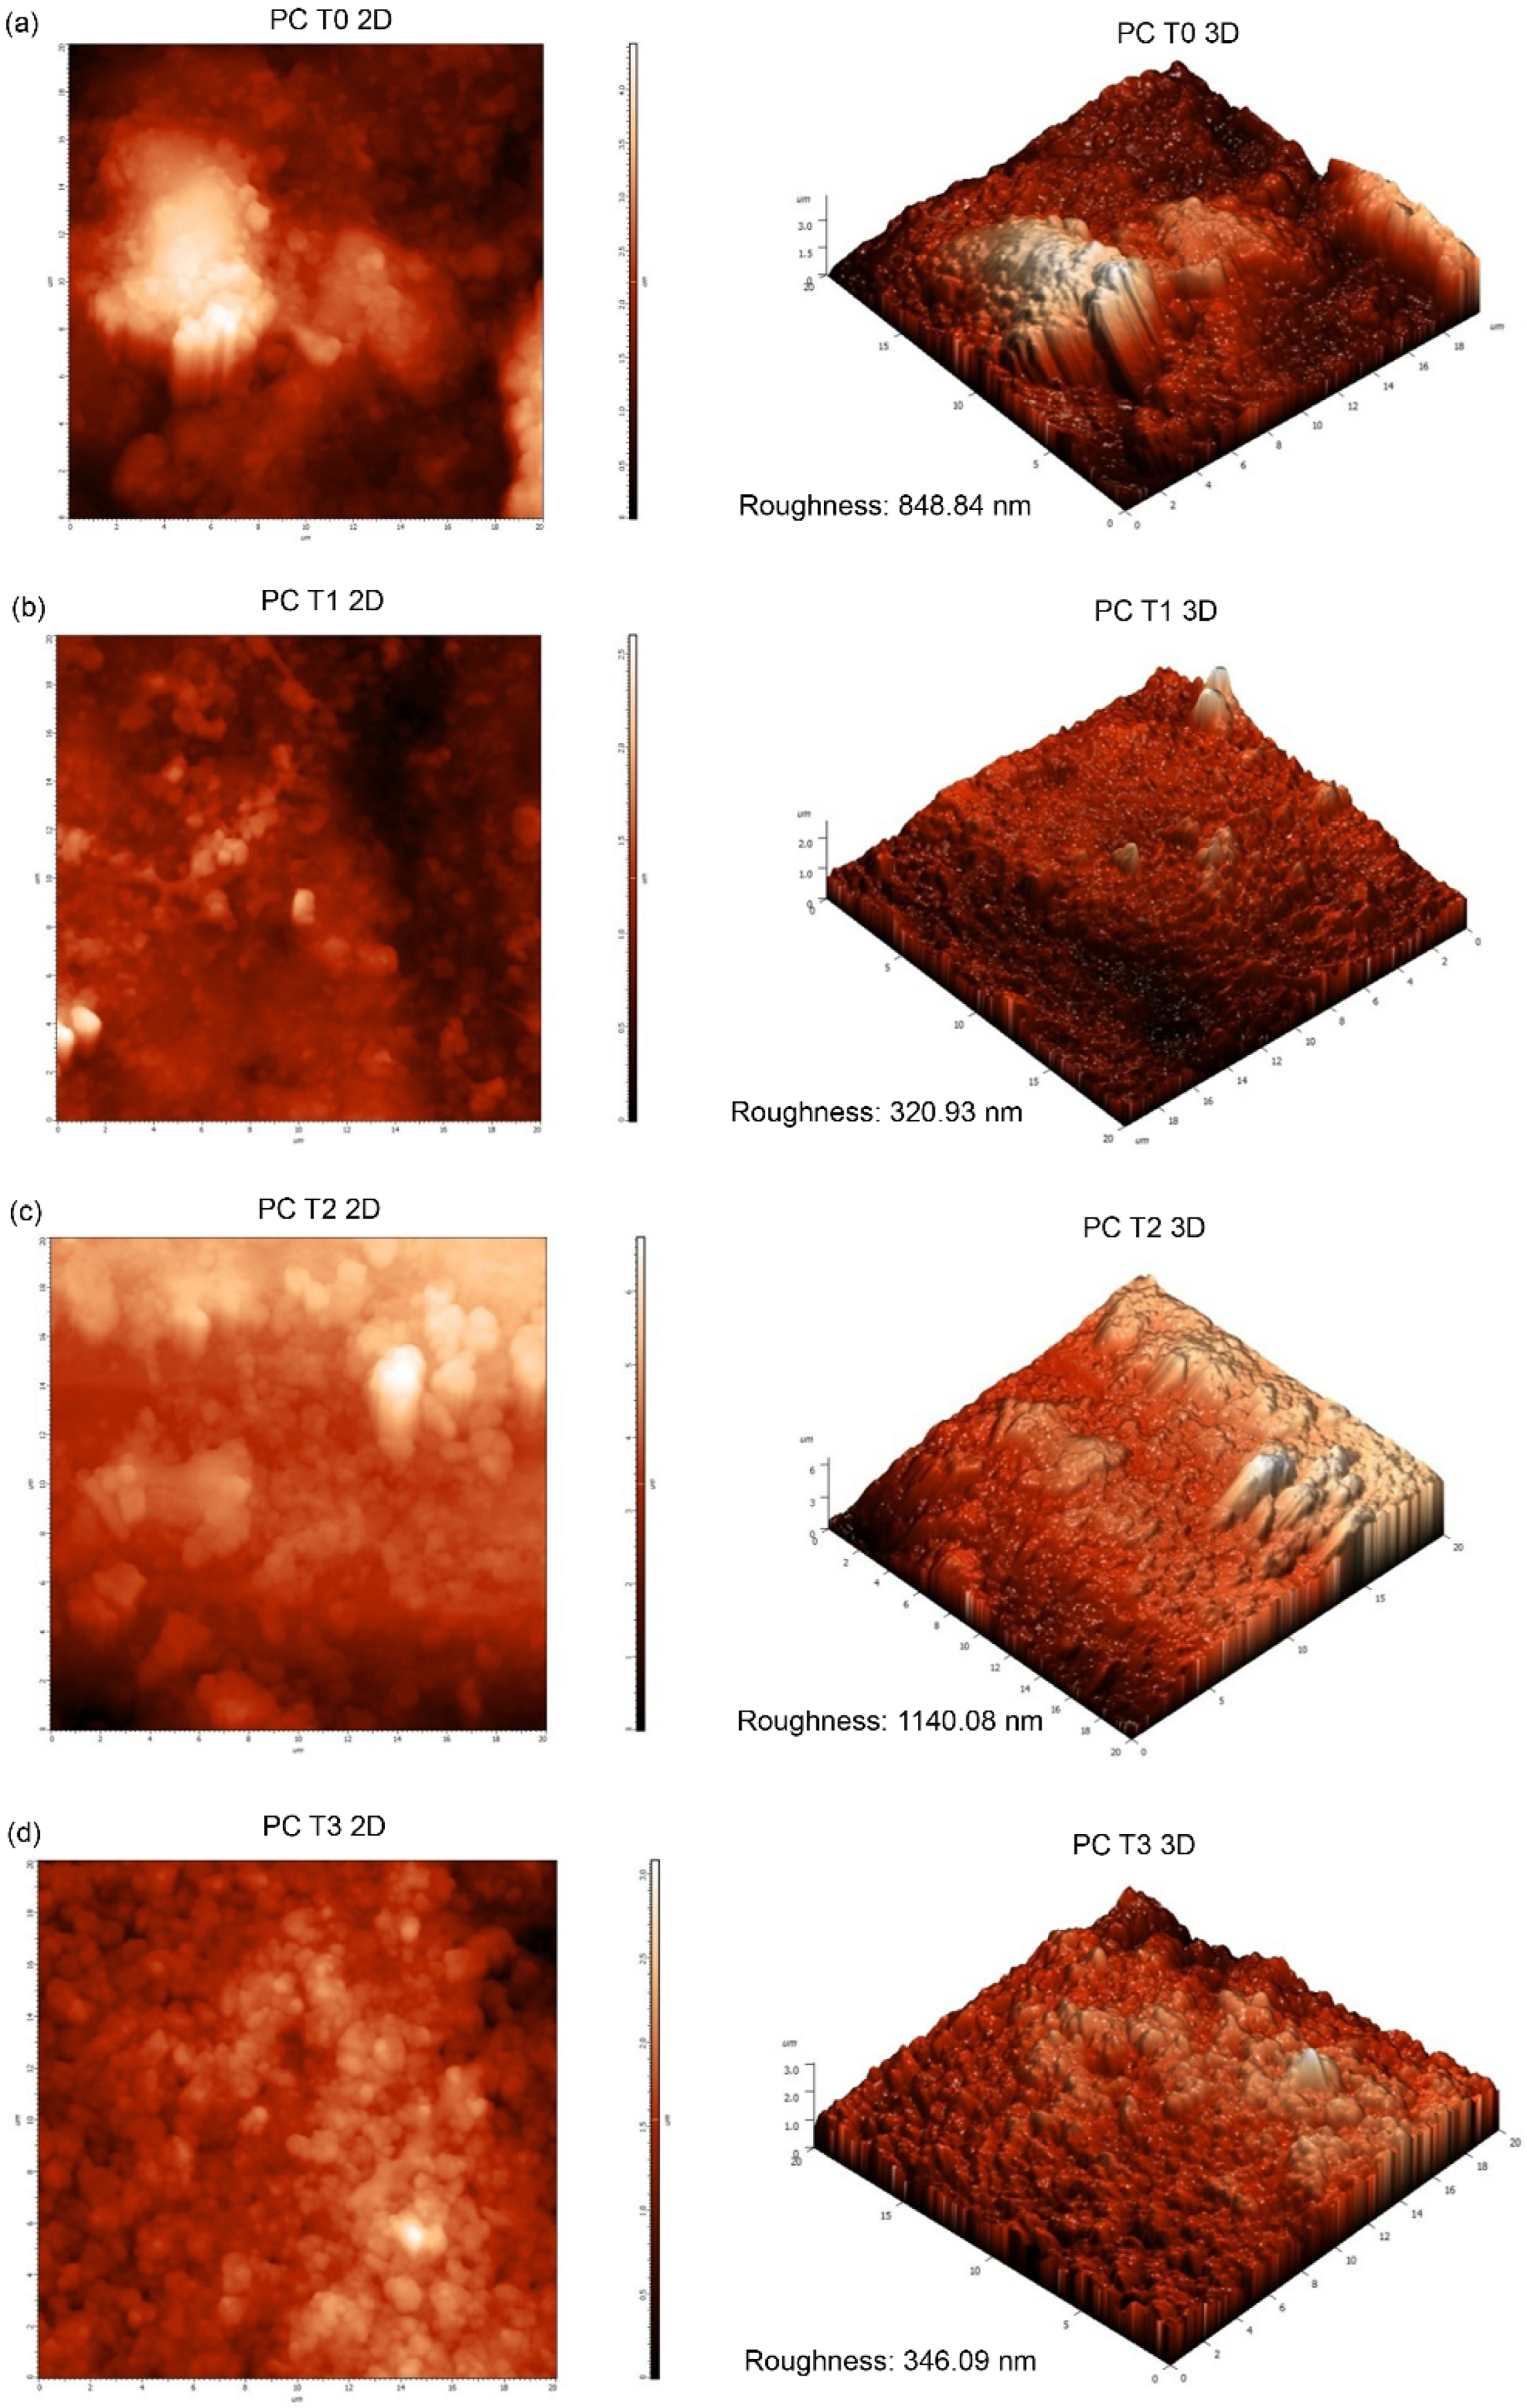
Representative AFM topographs of the PC presented in Figure 6 illustrate progressive surface evolution with aging. The unaged surface of an unaged specimen, as shown in Figure 6a, exhibited rough but relatively uniform morphology characterized by shallow, rounded features without pronounced peaks or deep valleys. Following aging, as shown in Figure 6b, the surface became smoother and more uniform, with reduced amplitude of surface features and a flattened, gently undulating morphology. Further aging, as shown in Figure 6c, resulted in a highly irregular topography characterized by sharp protrusions and deep pits, producing pronounced elevation differences across the surface. After prolonged aging, as shown in Figure 6d, the surface remained irregular but appeared flattened. The sharp protrusions became rounded, while valleys appeared broader and shallower.
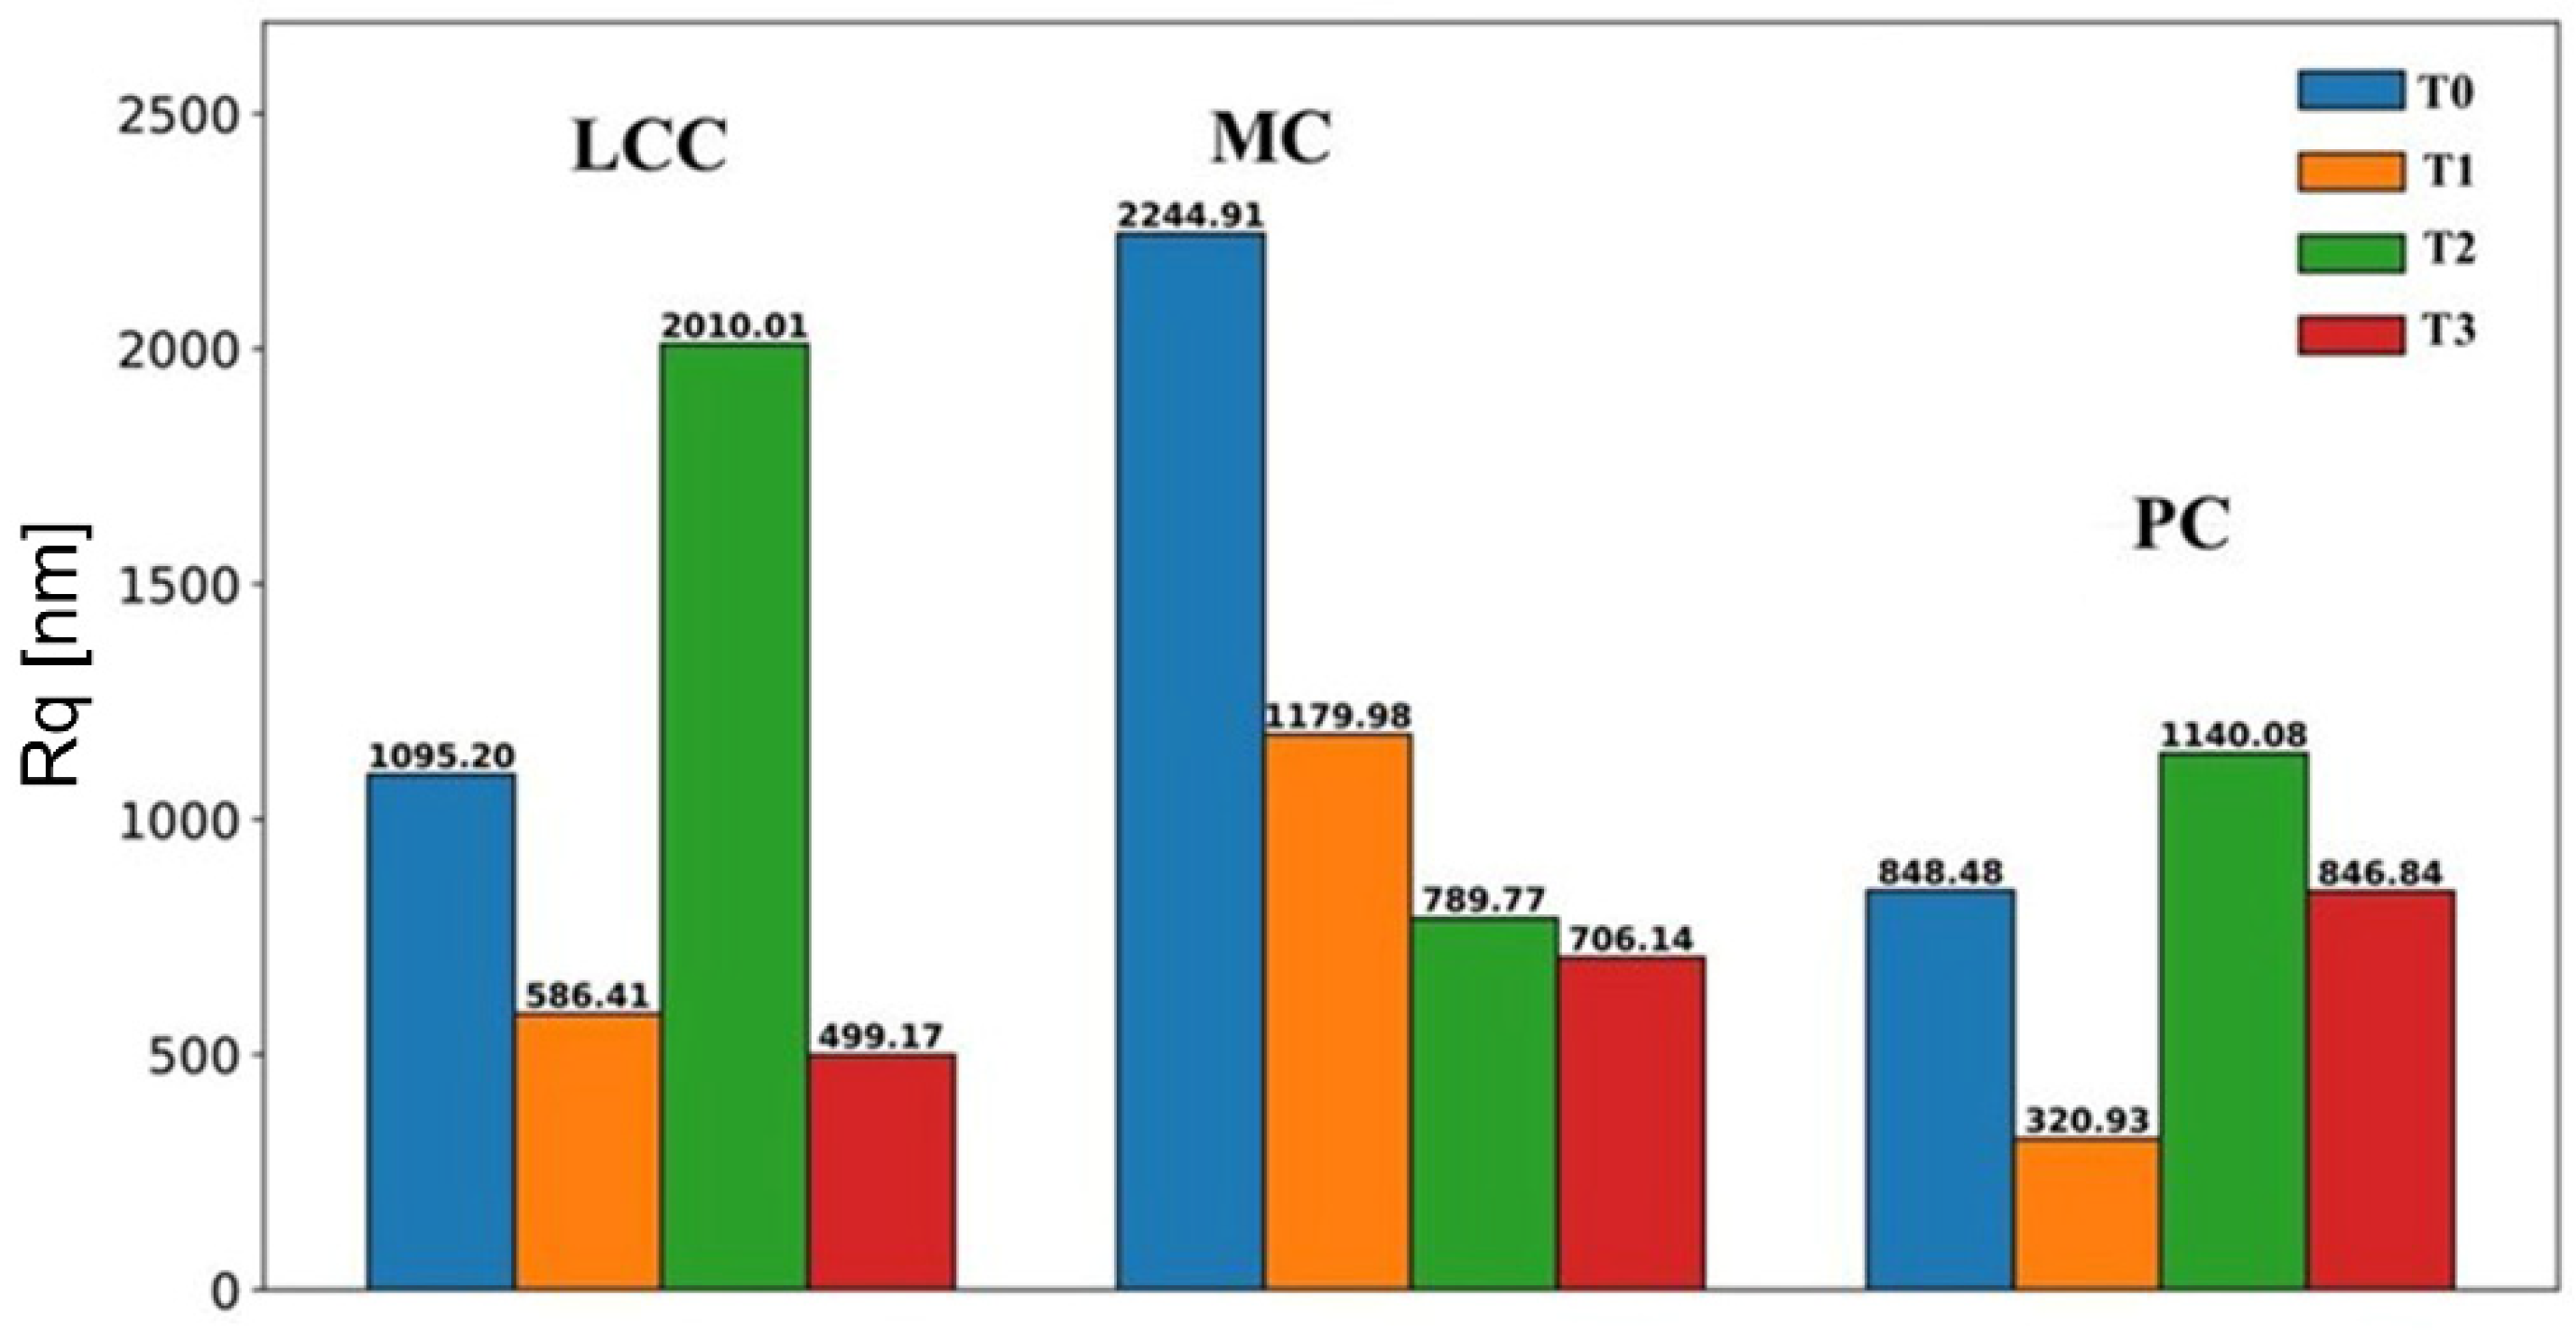
The Rq values quantitatively supported the AFM observations for all investigated composites, as shown in Figure 7, revealing a non-linear evolution of surface roughness during aging. For LCC, Rq decreased from 1095.20 nm (T0) to 586.41 nm (T1), reflecting the smoother surface observed after initial aging. A pronounced increase in roughness occurred at T2 (2010.01 nm), corresponding to the severely disrupted and pitted morphology. After prolonged aging, Rq decreased to 499.17 nm (T3), indicating reduced topographic amplitude and a more flattened surface. For MC, the highest roughness value was observed in the unaged specimens (2244.91 nm at T0). After the first aging cycle (T1), Rq decreased to 1179.98 nm, indicating surface smoothing. Further aging resulted in a gradual decrease to 789.77 nm (T2) and 706.14 nm (T3), suggesting a progressive reduction in peak-to-valley height and overall surface flattening. For PC, Rq values decreased markedly from 848.48 nm (T0) to 320.93 nm (T1). A subsequent increase in roughness was recorded at T2 (1140.08 nm), corresponding to the irregular and disrupted surface morphology. After prolonged aging, Rq decreased again to 846.84 nm (T3), approaching the value of the unaged specimens.

3.4. Raman Spectroscopy

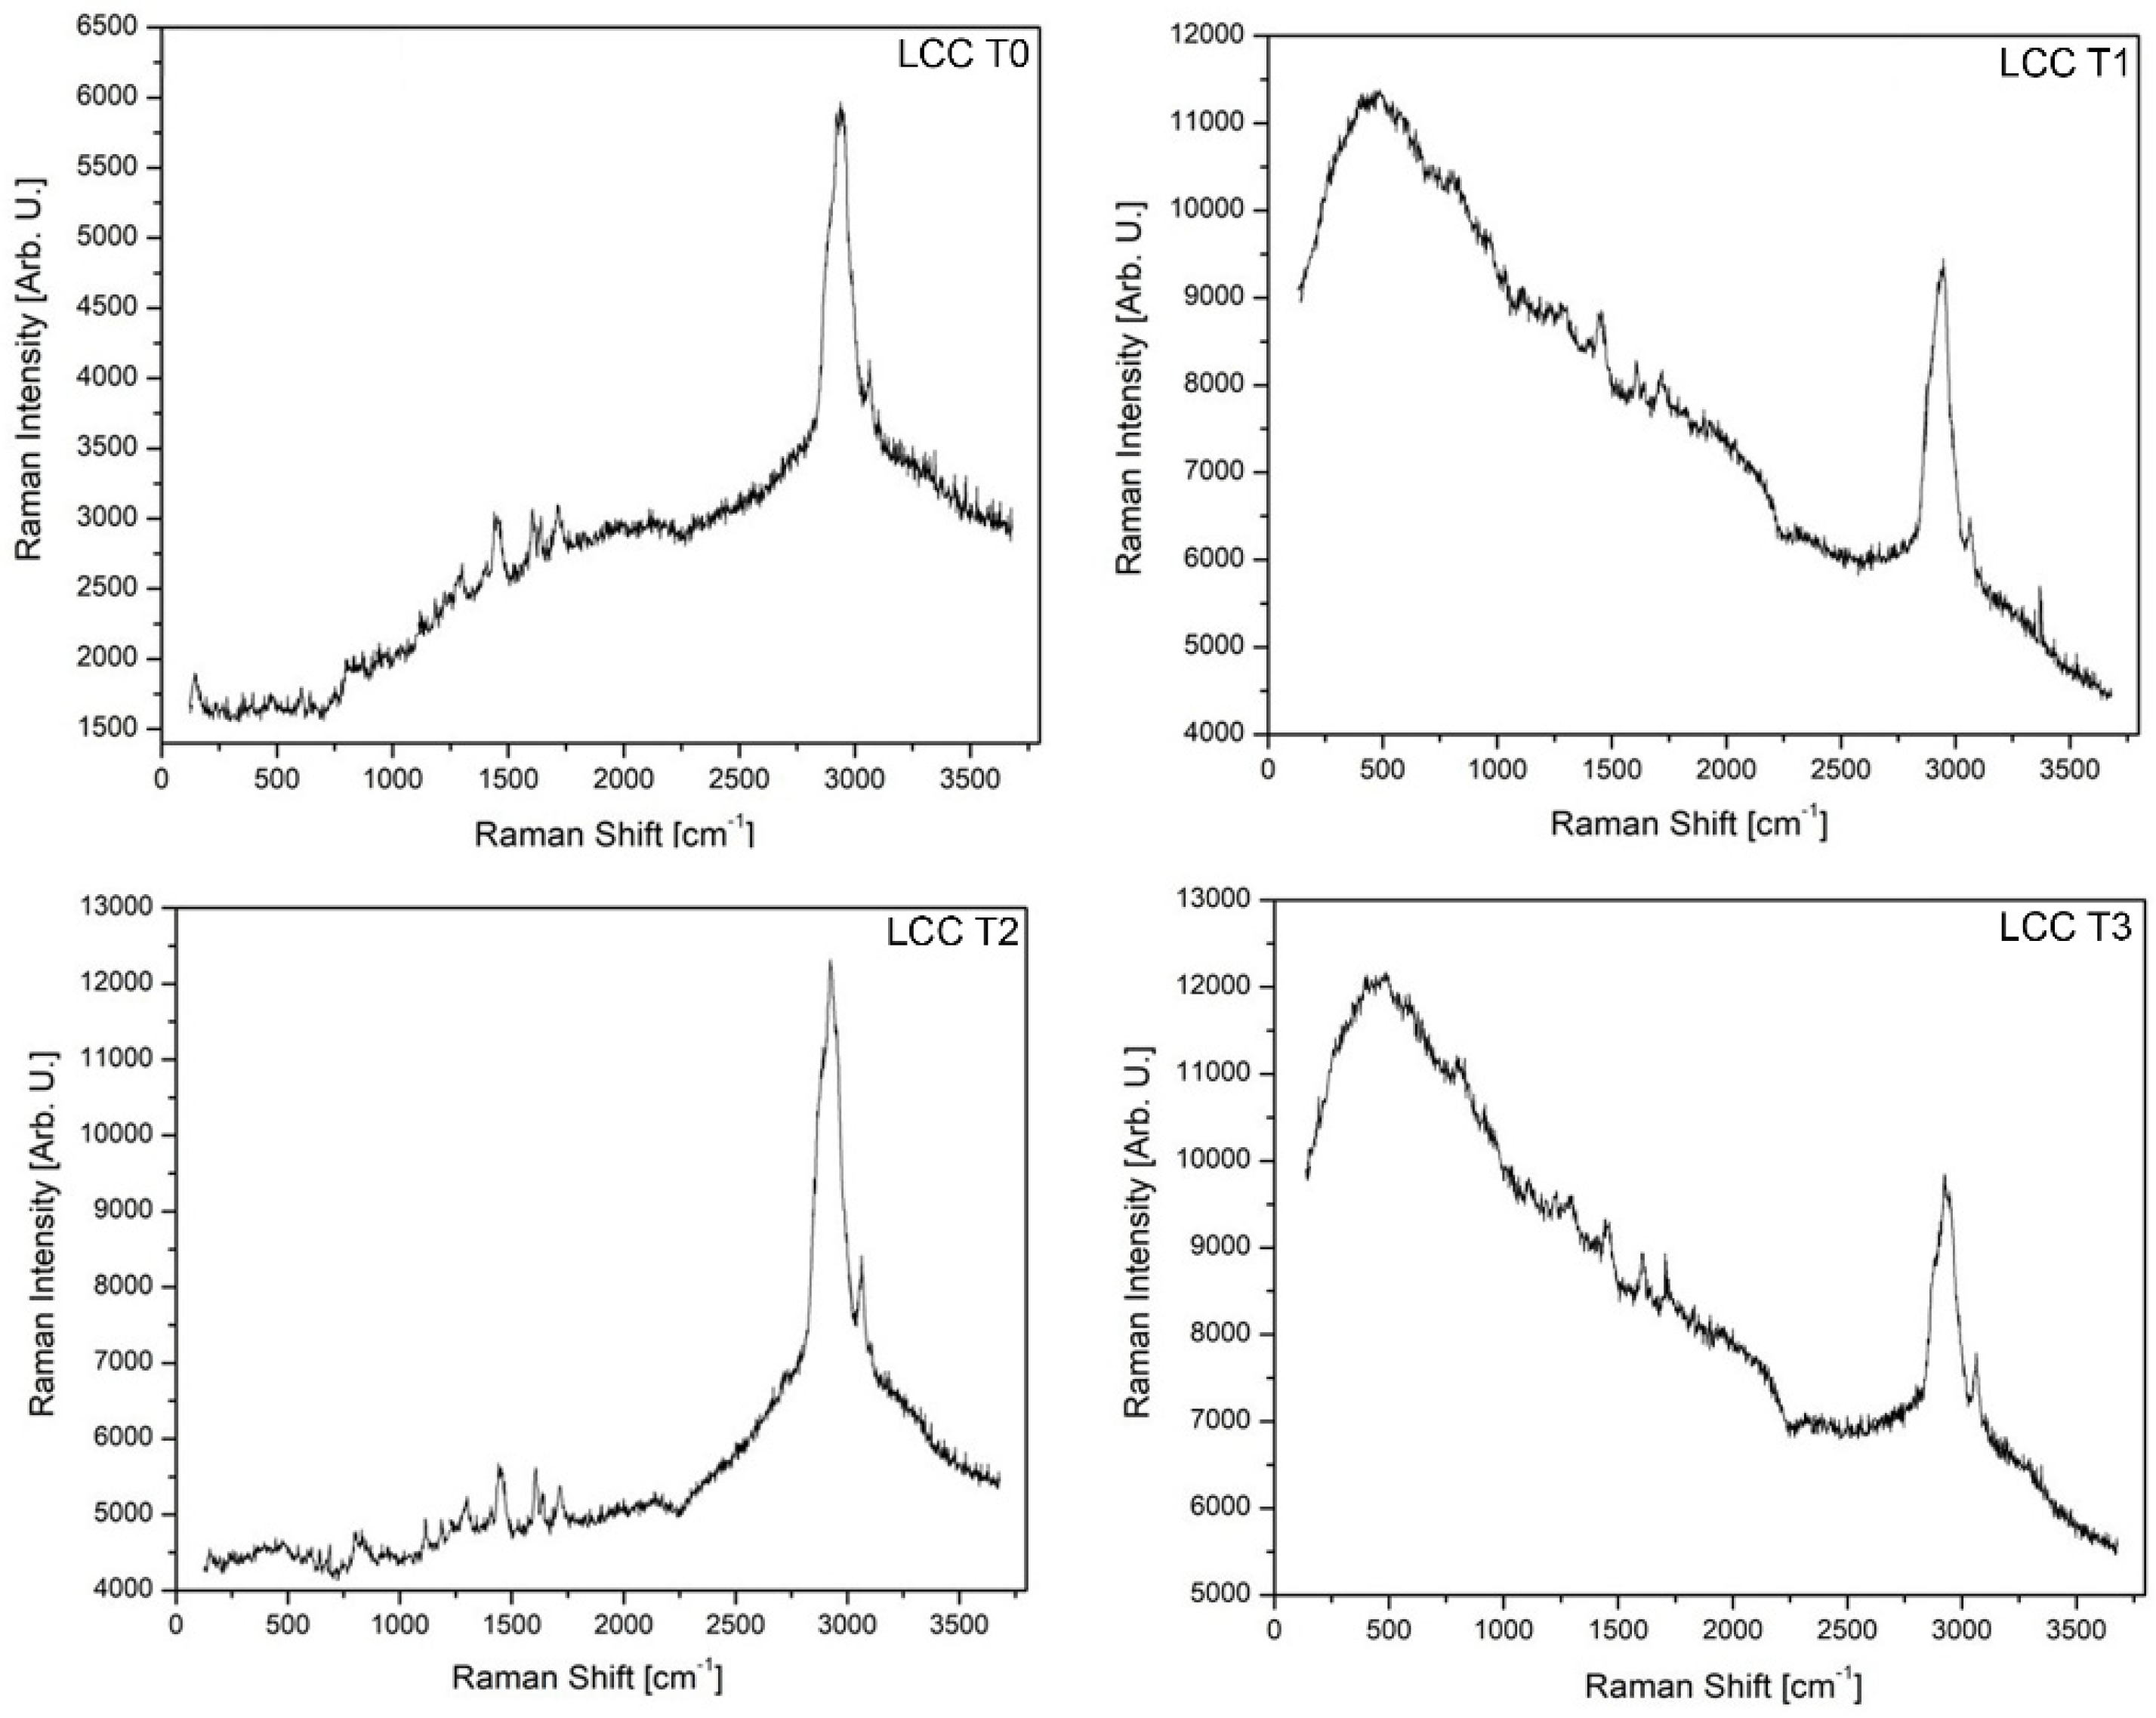
Representative Raman spectra were analyzed to evaluate chemical changes in the organic matrix and inorganic filler phases following the aging process. In LCCs, progressive modifications were revealed, primarily in regions associated with the UDMA-based organic matrix, as shown in Figure 8. The aliphatic C=C stretching band (~1639 cm−1) decreased monotonically with increasing thermocycling, indicating progressive conversion or degradation of residual unsaturated bonds. The carbonyl C=O band (~1710 cm−1), initially symmetric in T0, broadened in T1 and T3, developing a shoulder between 1700 and 1720 cm−1, accompanied by an increase in full width at half maximum (FWHM). A broad O–H band (~3400 cm−1) increased with thermocycling, suggesting enhanced water uptake. In contrast, silicate filler bands corresponding to Si–O–Si bending (~490 cm−1) and asymmetric stretching (~1100 cm−1) remained spectrally stable. However, the relative intensity ratio between silicate (~1100 cm−1) and organic C=C (~1639 cm−1) increased from T0 to T3.
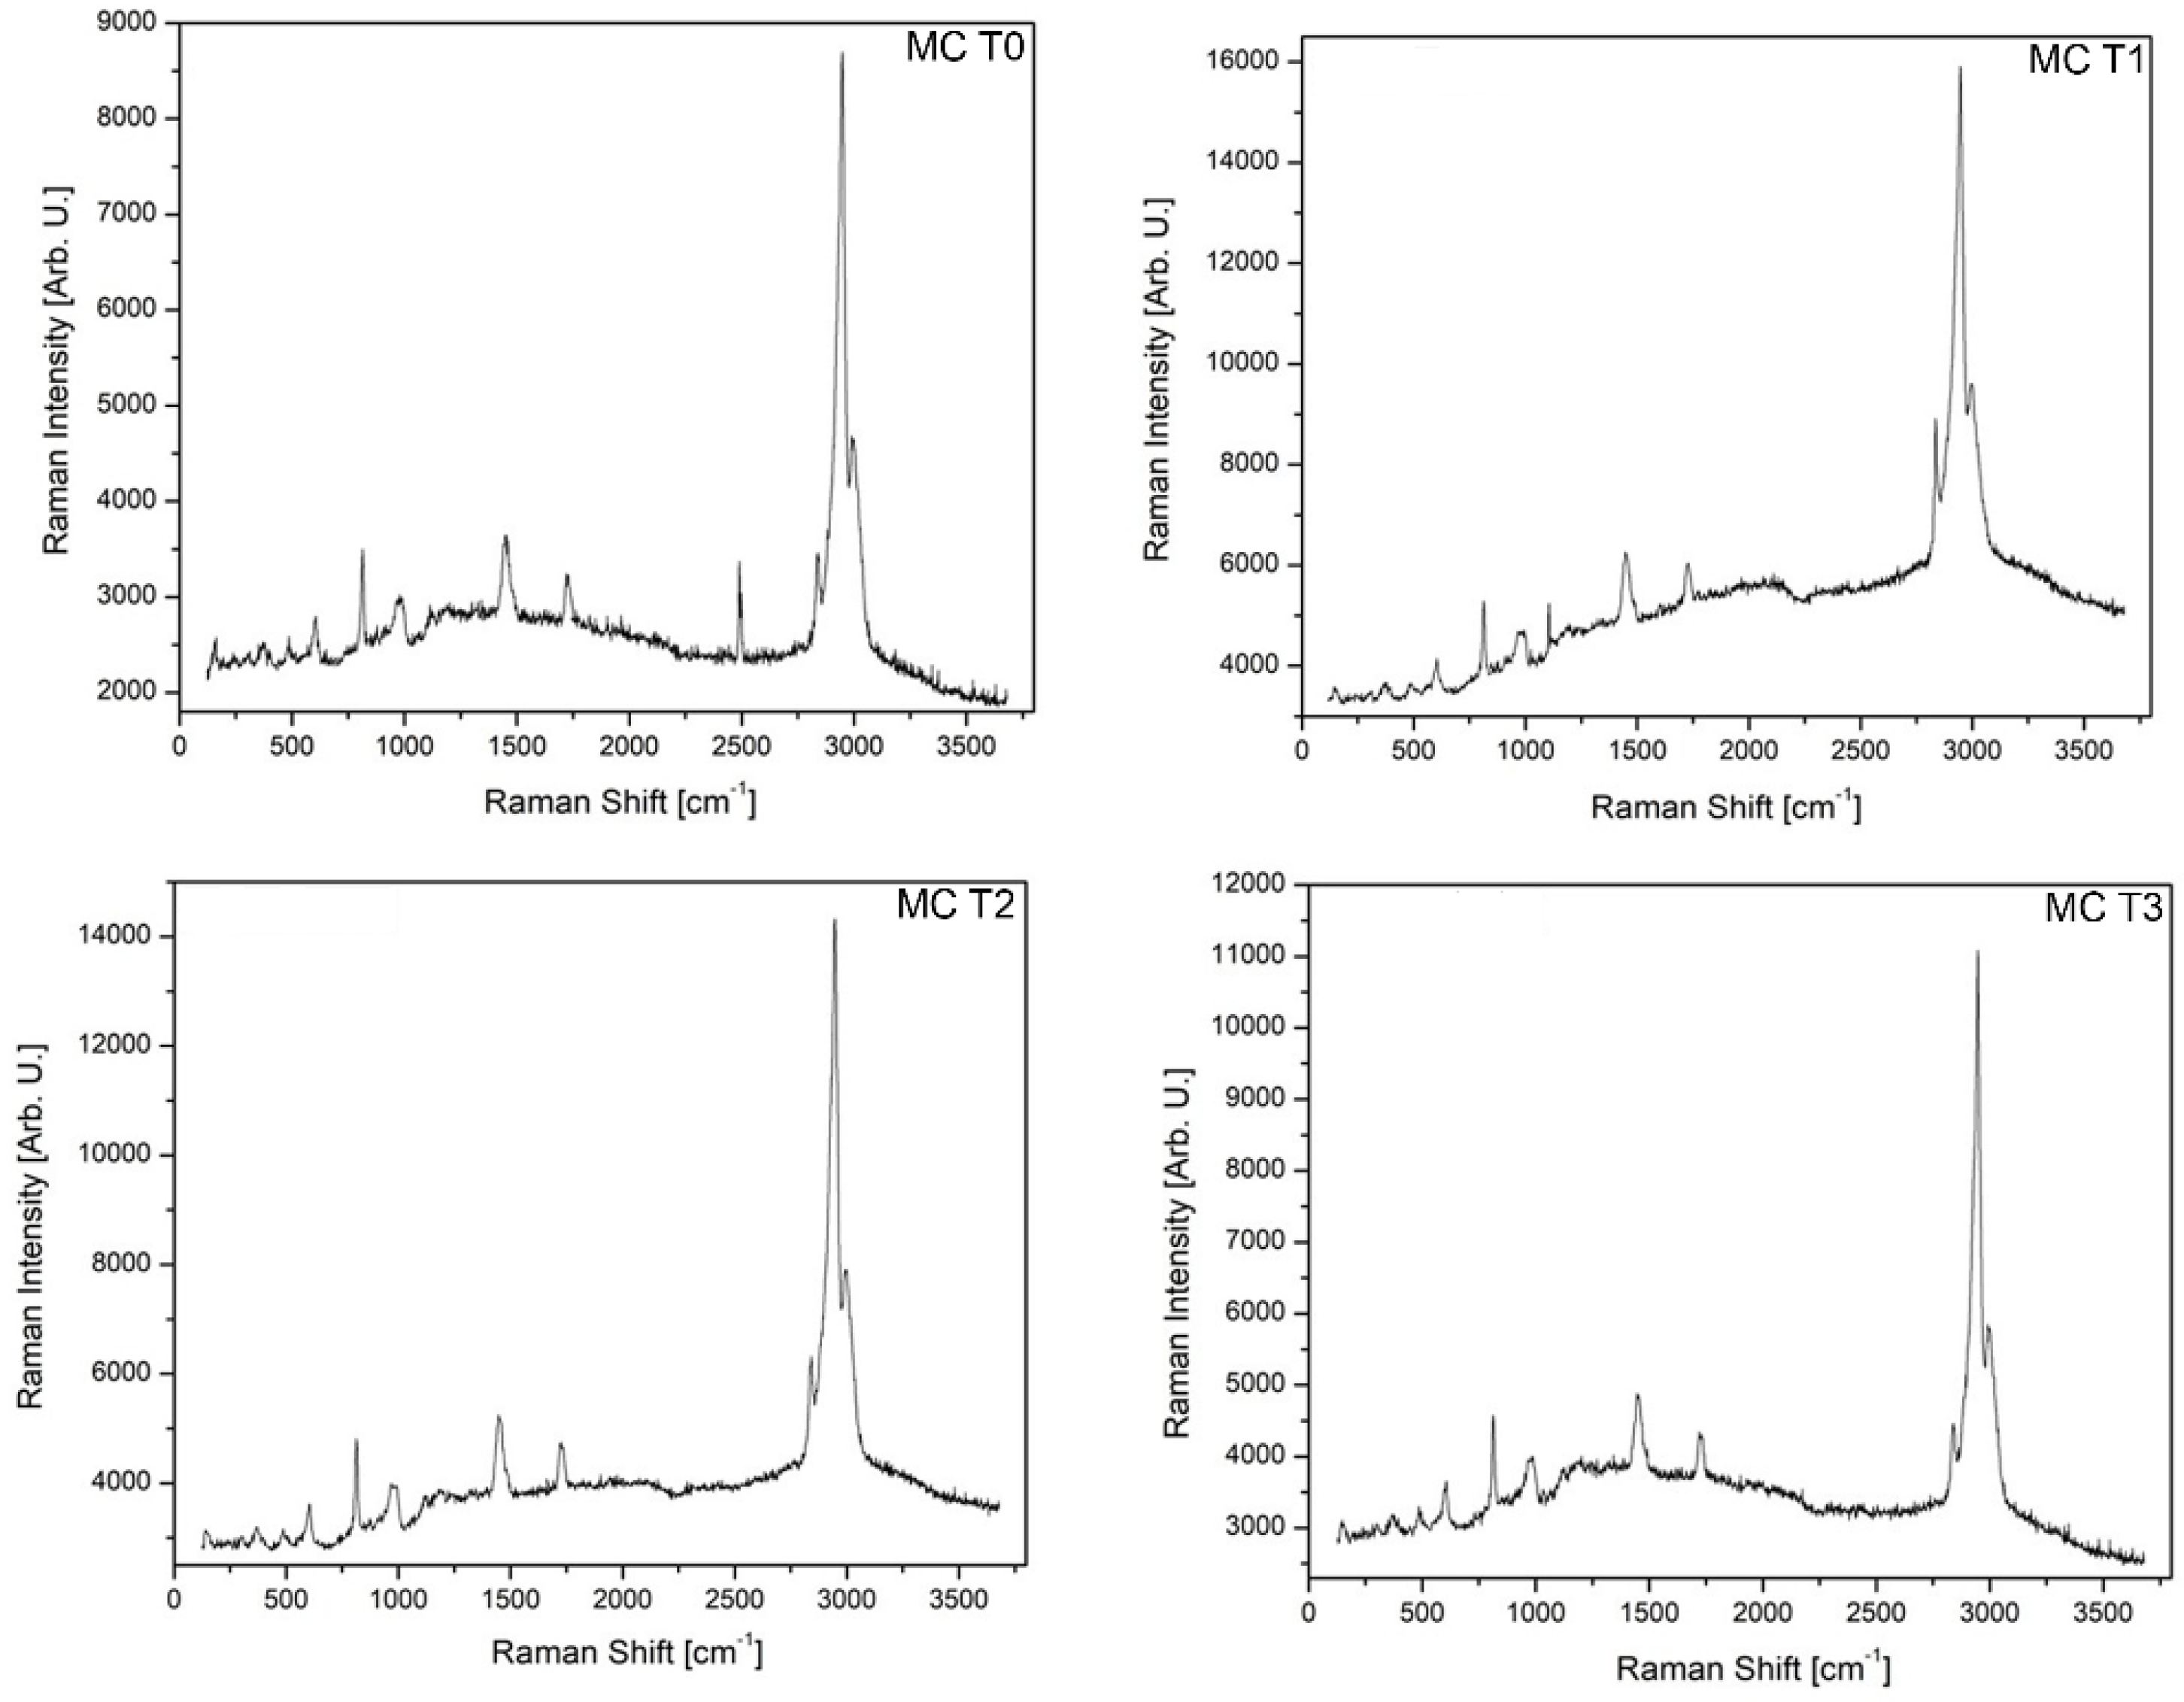
Similar trends were observed for MC, as shown in Figure 9. The carbonyl stretching band (~1725 cm−1) broadened progressively with aging, developing a shoulder at ~1710 cm−1 and showing a slight shift toward lower wavenumbers at T3. The aliphatic C=C band (~1640 cm−1) decreased steadily with age, while the aromatic C=C band (~1608 cm−1) remained relatively stable when normalized to the silicate reference (~1100 cm−1). Bands associated with CH2 bending (~1450 cm−1) and C–H stretching (2800–3000 cm−1) gradually decreased in intensity. The silicate bands (~490 and 1000–1100 cm−1) remained spectrally stable, while the O–H band (~3400 cm−1) increased with thermocycling.
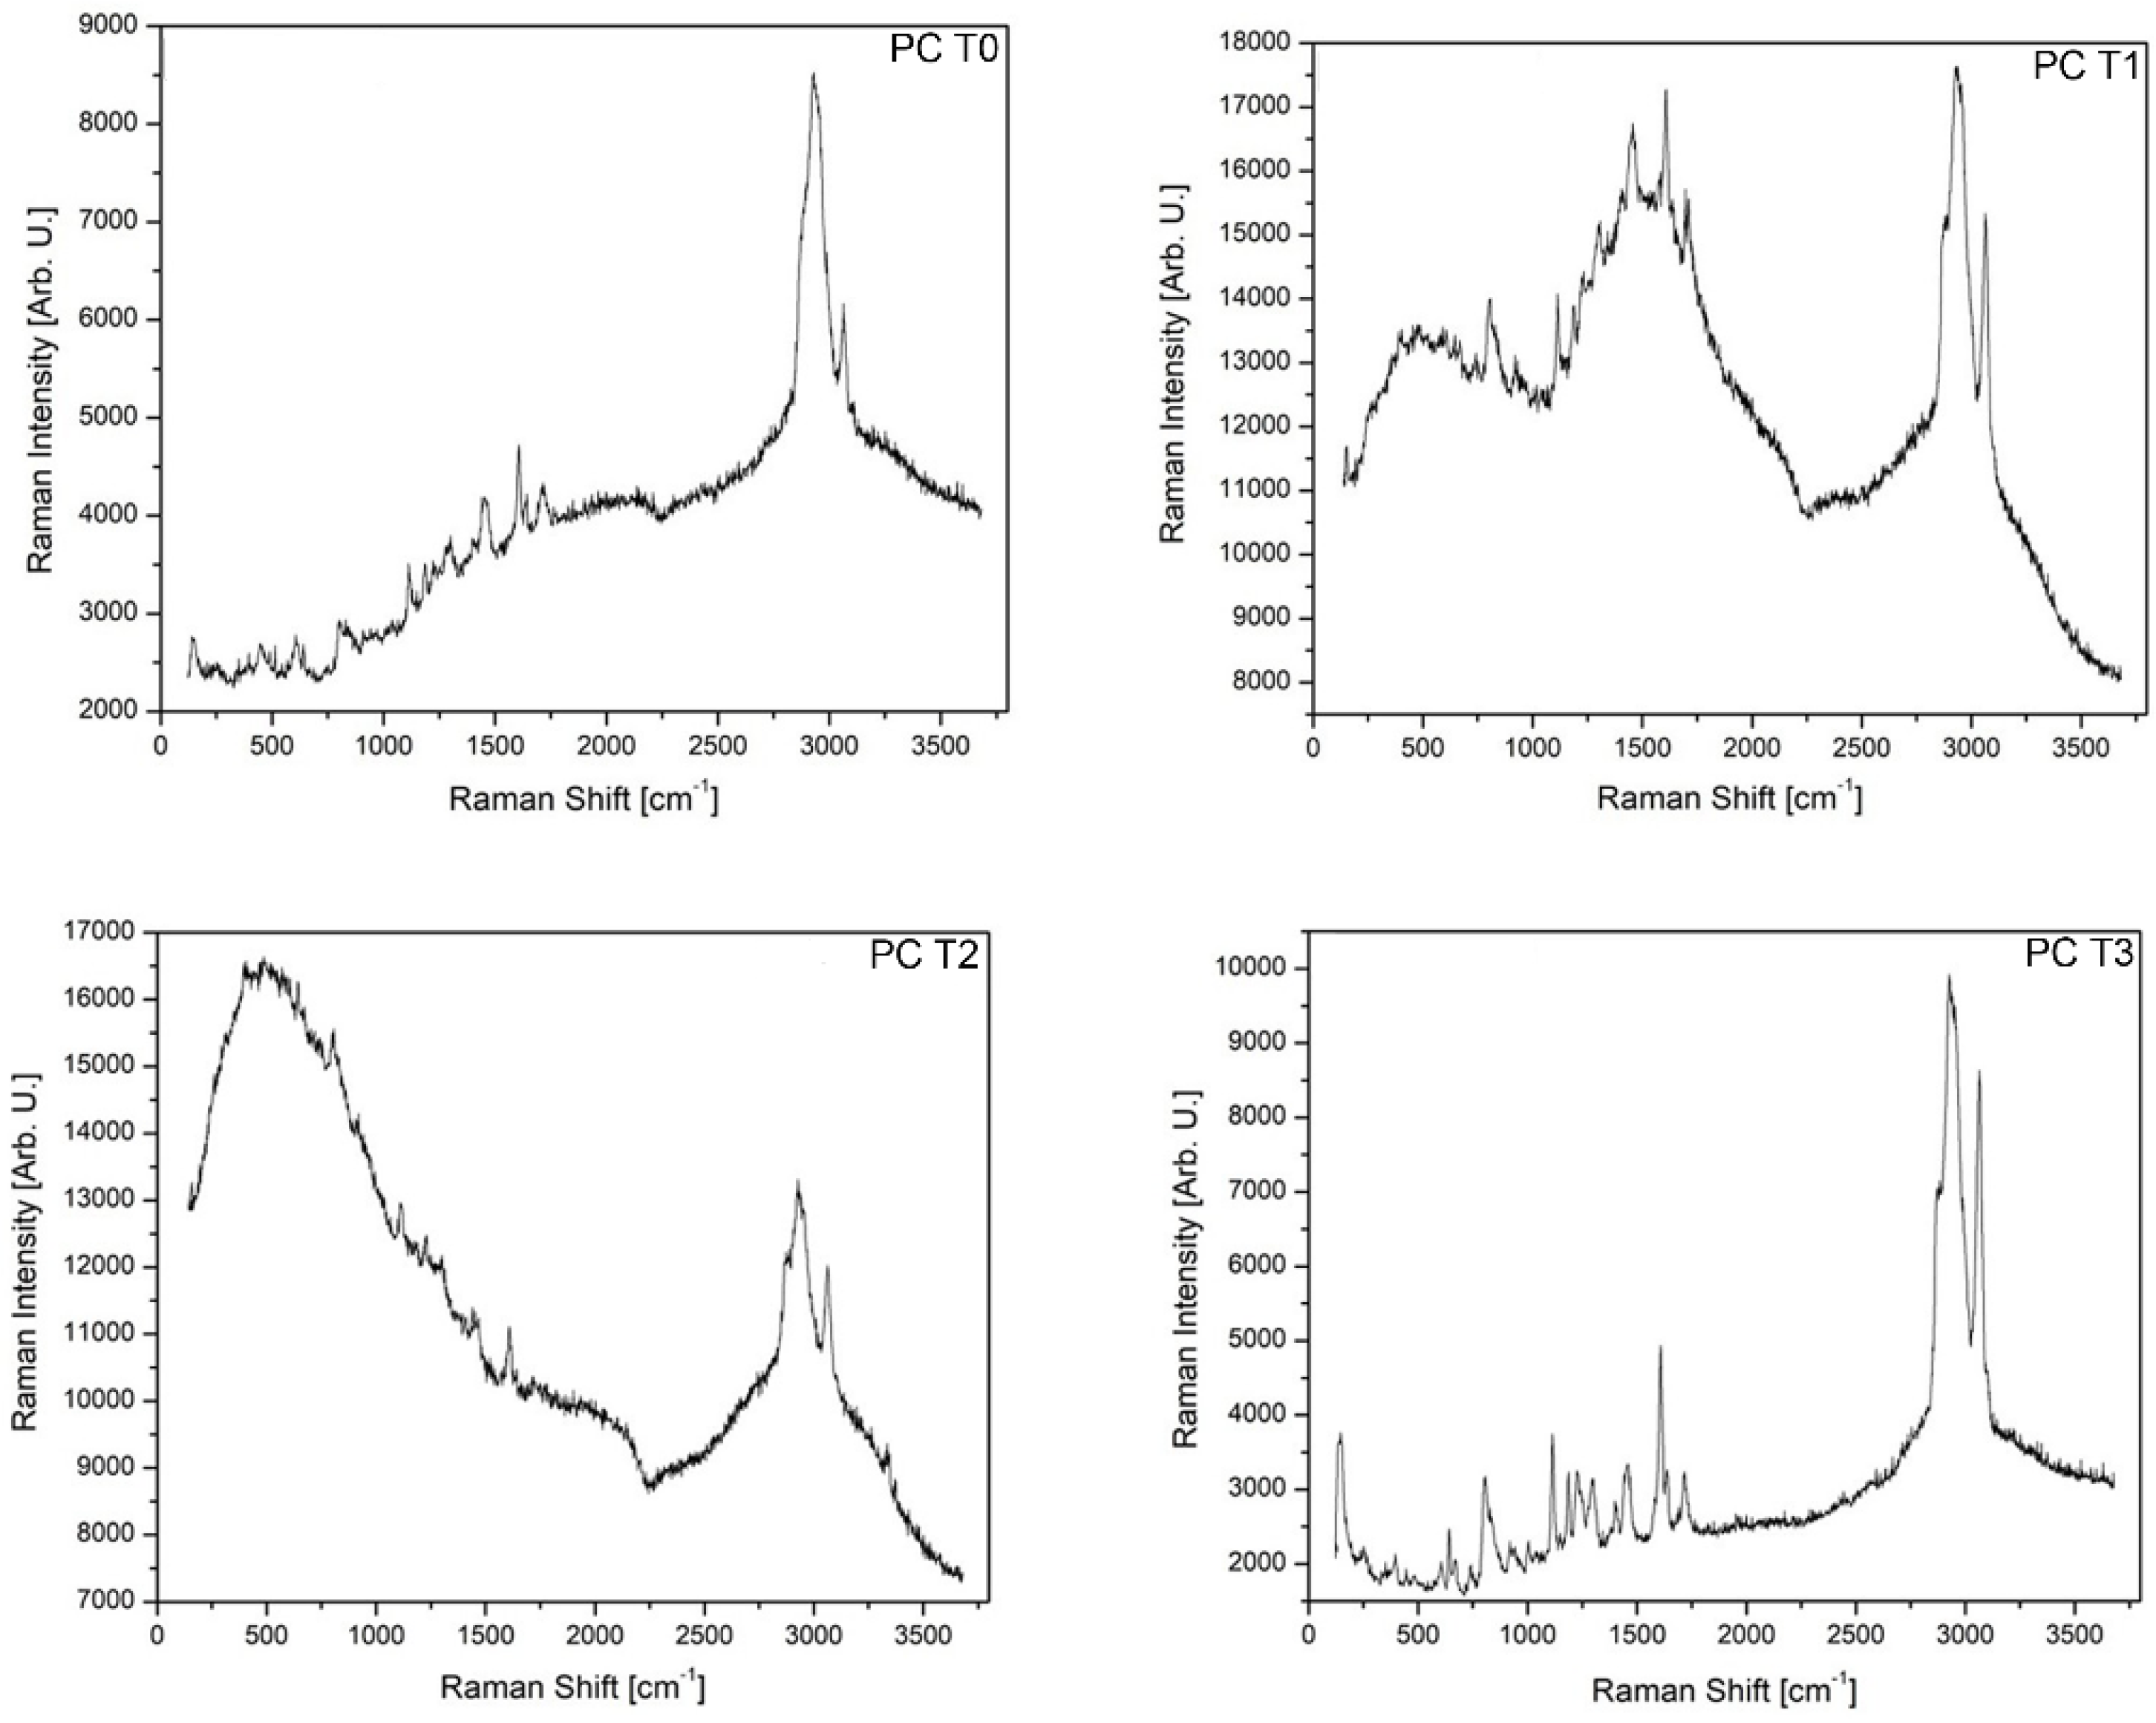
The Raman spectra of the PC indicated that aging-dependent changes predominantly occurred in the organic phase (Figure 10). The untreated specimen exhibited a sharp and symmetric carbonyl band (~1725 cm−1), which progressively broadened and shifted toward lower wavenumbers with increasing thermocycling. At T2, a shoulder appeared near ~1700 cm−1, while at T3, the carbonyl region became markedly broadened and asymmetric. The aliphatic C=C band (~1639 cm−1) remained relatively stable compared with pronounced carbonyl changes. A broad O–H band (~3400 cm−1) increased with the cycle number, indicating increased water sorption. The inorganic filler bands (~490 and ~1100 cm−1) remained spectrally stable, although their relative intensity increased at higher thermocycling levels.

4. Discussion

The present results demonstrate that hydrothermal aging and exposure to staining beverages significantly affect the optical properties of resin composites, although the extent of these changes strongly depends on the type of material, chemical composition, and processing method used. The interpretation of color change was performed in relation to established perceptibility and acceptability thresholds, thereby providing a clinically relevant framework for evaluating the obtained results. Although variability was observed among the tested materials, most ΔE00 values approached or exceeded the acceptability threshold, indicating a potential impact on long-term esthetic stability.
Among the investigated composites, PC exhibited the highest color change after the first aging cycle, while LCC showed the lowest ΔE00, indicating superior initial color stability, which could be associated with the limited water sorption capability of this composite. MC displayed intermediate behavior, which probably resulted from the high degree of conversion achieved during industrial polymerization of this composite [16]. Further aging cycles did not substantially affect the staining of LCC and MC, whereas PC showed a gradual reduction in ΔE00 values. This behavior may be associated with the stabilization of the polymer network during thermocycling in the latter [17]. The immersion experiments confirmed that all resin composites are prone to staining. Coffee produced pronounced color changes in all materials due to the presence of chromogenic molecules capable of penetrating the resin matrix and their adsorption onto the material surface [12]. In the present study, MC demonstrated the highest resistance to coffee staining, while PC showed the greatest discoloration after the initial aging cycle. Such a pattern may reflect the initial instability of the printed polymer network, characterized by higher water sorption and residual monomer content, which facilitated early pigment penetration [18]; this is consistent with the study by Pérez et al., which evaluated color change in four different 3D-printed composite materials and reported ΔE00 values exceeding the established acceptability thresholds [19].
In contrast, the LCC examined in the present study exhibited relatively stable ΔE00 values across aging intervals, suggesting the presence of a more stable polymer network or reduced pigment adsorption. A similar trend was observed following immersion in Coca-Cola, although the magnitude of color change was generally lower compared to coffee. The increase in ΔE00 values after 7 days of immersion indicates that exposure time is a critical factor influencing staining susceptibility. These observations are in agreement with a recent study by Uctasli et al., in which LCCs demonstrated comparable optical behavior despite differences in experimental design [20]. Although acidic beverages such as Coca-Cola may promote superficial degradation of the resin matrix, increasing surface roughness and facilitating pigment adsorption, the overall discoloration remained lower than that observed with coffee, highlighting the predominant role of chromogenic compounds rather than acidity alone.
The translucency parameter (TP) analysis further confirmed that the optical behavior of the investigated composites differs markedly depending on material composition. LCC and PC showed significantly higher TP values compared with MC, indicating greater light transmission through these materials. The lower translucency observed for MC may be attributed to the denser and more compact polymer network formed during polymerization under high temperature and high pressure [21]. During hydrothermal aging, LCC exhibited a small decrease in TP that did not reach statistical significance, suggesting that aging-induced structural changes, such as water sorption or microstructural degradation, slightly affect internal light scattering. In contrast, MC and PC showed a gradual increase in TP with aging, with statistically significant changes observed for the latter. Such behavior may be related to changes in refractive index matching between filler particles and the polymer matrix caused by water uptake and matrix relaxation during thermocycling. These processes usually reduce internal scattering and increase light transmission through the material. Coffee exposure resulted in noticeable TP changes for all materials, particularly for PC, which maintained relatively high translucency values even after aging. This could be associated with the layer-by-layer polymerization process, which may create interlayer heterogeneities that act as additional scattering sites and are further modified during aging [12]. Differences between immersion for 1 day and 7 days indicate that pigment adsorption and matrix swelling can influence the optical properties of the composites. Similarly, immersion in Coca-Cola led to a progressive reduction in TP in LCC and slight increases in MC and PC after prolonged aging, suggesting that acidic media may promote structural modifications affecting light propagation through the material.
Not only does the processing route play a critical role, but the chemical composition also has a significant impact on changes in optical properties. In addition to industrial polymerization under high-temperature and high-pressure conditions, the lower filler loading and presence of nanoceramic fillers may contribute to improved homogeneity, polishability, and optical stability of the MC material [22]. The examined LCC demonstrated relatively stable behavior, which may be associated with its higher filler loading, potentially limiting water and pigment uptake. However, the presence of more hydrophilic monomers, such as TEGDMA, may increase susceptibility to color change [23]. In contrast, the lower filler loading of PC, which contributes to its enhanced flowability and reduced viscosity, may also be responsible for the greater color variability observed [24]. These material-dependent characteristics are consistent with the ΔE00 and TP results observed, where MC exhibited improved optical stability, LCC showed moderate but stable changes, and PC demonstrated greater variability, particularly under aging and staining conditions. This highlights the combined influence of processing conditions and compositional factors in determining the long-term optical performance of resin composites.
AFM analysis revealed progressive modifications of the surface morphology during aging, which correlate well with the observed optical changes. Initially smoother surfaces after the first aging cycle of LCC may result from partial surface relaxation or leaching of loosely bound filler particles [25]. However, continued aging and repeated thermal stress led to filler particle dislodgment and microcrack formation at the filler–matrix interface, resulting in the appearance of pits and ridges [26]. These morphological changes increase the surface area and facilitate the adsorption and retention of staining molecules, thereby contributing to the observed color changes after beverage immersion. The subsequent flattening and rounding of surface features at later aging stages may reflect gradual surface wear or matrix plasticization induced by repeated thermal stress [27].
The surface of the unaged MC exhibited a pronounced and complex topography characterized by sharp filler protrusions and deep valleys, reflecting the processing stages of milling and grinding. Initial thermocycling resulted in noticeable smoothing of the material surface, which may be attributed to the removal of superficially exposed filler particles and superficial softening of the resin phases due to water sorption and thermal stress [28]. However, further thermocycling provoked structural degradation of the filler–matrix interface, as evidenced by the propagation of deep pits and angular ridge-like structures. These features likely arose from differences in thermal expansion between the organic matrix and inorganic fillers, ultimately resulting in localized interfacial failure [29,30].
In contrast, unaged PC exhibited a relatively uniform surface morphology, with shallow rounded features reflecting a homogeneous distribution of silica fillers and a relatively stable filler–matrix interface. Following initial thermocycling, the surface became even more uniform, which may be associated with the removal of superficial irregularities and viscoelastic relaxation of the superficial BisEMA resin layer caused by water sorption and thermal stresses [31]. However, with continued thermocycling, PC underwent pronounced structural disruption, characterized by deep pits, sharp protrusions, and strong spatial contrast, indicating filler exposure, localized particle dislodgment, and potential microcrack formation at the filler–matrix interface, all driven by cumulative thermo-mechanical stresses. At later stages of aging, PC showed evidence of generalized surface wear, where previously sharp features became rounded, and the overall surface appeared “sanded down,” suggesting continuous abrasive removal of both the degraded resin matrix and exposed silica fillers. Ultimately, prolonged aging forms a consolidated, worn, pseudo-surface layer, similar to that observed in other composites.
It is important to note that differences in polishing systems and finishing protocols represent a potential confounding factor, as surface roughness directly influences both color stability and translucency. Interestingly, the results revealed a clear correlation between surface roughness and color change (ΔE00), whereas no such relationship was observed between surface roughness and the translucency parameter (TP). The observed correlation between surface roughness and color change can be explained by the increased susceptibility of rougher surfaces to staining, as surface irregularities facilitate pigment accumulation and the adsorption of chromogenic agents. This is consistent with the well-established role of surface topography in influencing the discoloration behavior of resin-based composites [32]. In contrast, translucency appeared to be independent of surface roughness within the tested range. This finding suggests that TP is predominantly governed by intrinsic optical properties of the material, such as filler content, particle size distribution, and refractive index matching between the resin matrix and fillers, rather than by surface characteristics alone [33]. Overall, the correlation between surface roughness (Rq), filler characteristics, and optical properties observed in this study supports the assumption that optical performance is governed by a complex interplay between material composition and surface condition, with color stability being more sensitive to surface-related factors than translucency.
Raman spectroscopic analysis further supports these observations by revealing progressive chemical modifications in the organic matrix of all investigated composites. The increasing intensity of the O–H band confirms enhanced water uptake, which can lead to hydrolytic degradation of the resin matrix and weakening of the filler–matrix interface [34,35]. The decrease in the aliphatic C=C band indicates ongoing conversion of residual unsaturated bonds [17,36,37]. The broadening and shifting of the carbonyl band suggest structural rearrangements within the polymer network during aging, including ester hydrolysis and the formation of carboxylic acid species [23,38,39,40,41]. Reductions in CH2 and C–H bands support matrix loss and potential monomer leaching [40]. In contrast, the aromatic C=C band (Bis-GMA backbone) remained stable, suggesting greater resistance of aromatic structures to hydrolytic attack [42]. The decrease in the aliphatic C=C band also supports these observations [43]. In contrast, the relative stability of the silicate bands indicates that the inorganic filler phase remains largely unaffected by thermocycling, confirming that degradation was associated primarily with the matrix rather than the fillers [44].
These chemical changes in the polymer matrix likely contribute to the observed modifications in surface morphology and optical behavior, including changes in color stability and translucency.
Overall, the correlation of all results indicates that hydrothermal aging primarily affects the organic matrix of resin composites, leading to water uptake, matrix relaxation, and progressive surface degradation. These structural and chemical processes ultimately influence the optical stability and staining susceptibility of restorative materials. Considering perceptual interpretation of ΔE00, the majority of the measured ΔE00 values, particularly after aging, indicate that prolonged exposure to strongly pigmented beverages can significantly compromise the esthetic longevity of composite restorations.
This study has several limitations that should be acknowledged. First, the in vitro design does not fully replicate the complexity of the oral environment, where biological, mechanical, and chemical factors interact simultaneously. Second, only a limited number of commercially available materials were evaluated, which restricts the generalizability of the findings. In addition, the number of specimens used for certain analytical techniques was limited, reflecting the exploratory nature of the study. Furthermore, although the applied polishing, staining, and aging protocols were widely used, they cannot fully reproduce clinical conditions. Despite these limitations, the study provides a standardized and controlled comparison of material behavior, offering meaningful insights into their optical performance.

5. Conclusions

Within the limitations of this study, hydrothermal aging and exposure to staining agents significantly influenced the optical properties of the evaluated resin composites, with the extent of change being strongly dependent on material composition and processing methods. Materials with higher filler loading and optimized polymer networks demonstrated improved color stability, while those with a lower filler content exhibited greater susceptibility to discoloration. Surface roughness was identified as a key factor affecting color change, whereas translucency was predominantly governed by intrinsic material properties. Among the tested materials, the light-cured composite (LCC) exhibited the highest resistance to intrinsic discoloration, maintaining relatively stable ΔE00 values during aging. In contrast, the printed composite (PC) showed the greatest initial susceptibility to color change, likely due to higher water sorption and the structural characteristics of the printed polymer network. The milled composite (MC) demonstrated intermediate behavior and the highest resistance to coffee staining, probably associated with its highly polymerized, dense structure formed under industrial processing conditions.
Coffee produced substantially greater staining than Coca-Cola of all composites, while immersion time had a more pronounced influence on color change than the number of aging cycles. Translucency analysis revealed significant differences among the composites, with LCC and PC exhibiting greater light transmission than MC. Aging and staining media altered translucency in different ways depending on the composite type, indicating that optical behavior is closely related to water sorption, matrix relaxation, and changes in refractive index matching within the composite structure.
AFM revealed progressive surface degradation and morphological alterations during aging, including filler particle dislodgement, pit formation, and generalized surface wear, which increase the potential for pigment adsorption. Raman spectroscopy confirmed that aging primarily affected the organic resin matrix, promoting water uptake, hydrolytic degradation, and structural rearrangements, while the inorganic filler phase remained largely stable.
Overall, hydrothermal aging induced matrix-driven structural and chemical changes in composites that increase their susceptibility to staining and may compromise the long-term esthetic of composite restorations, particularly under prolonged exposure to highly pigmented beverages. However, these findings should be interpreted with caution, as they are based on in vitro conditions and may not fully reflect the long-term clinical behavior of the materials investigated.

Author Contributions

Conceptualization, N.Ž., M.V., M.T. and L.M.; Methodology, N.Ž., M.V., M.T. and L.M.; Software, M.T.; Validation, M.T. and L.M.; Formal analysis, N.Ž., M.V., S.V., S.N. and J.M.; Investigation, N.Ž., M.V., M.T., A.M.L. and L.M.; Resources, A.M.L.; Writing—original draft, N.Ž. and J.M.; Writing—review and editing, A.M.L. and L.M.; Visualization, M.T.; Supervision, A.M.L. and L.M.; Project administration, A.M.L. and L.M.; Funding acquisition, L.M. All authors have read and agreed to the published version of the manuscript.

Funding

The research was supported by the Ministry of Science, Technological Development and Innovation of the Republic of Serbia through Grant No. 451-03-33/2026-03/200175 and Grant No. 451-03-137/2025-03/200129.

Data Availability Statement

The datasets used in the study are available from the corresponding author upon reasonable request.

Acknowledgments

The authors would like to thank the dental laboratory “Dental M Press” and Maja Šćepanović for technical support in producing the material specimens.

Conflicts of Interest

The authors declare no conflicts of interest.

References

  1. Singer, L.; Fouda, A.; Bourauel, C. Biomimetic approaches and materials in restorative and regenerative dentistry: Review article. BMC Oral Health 2023, 23, 105. [Google Scholar] [CrossRef] [Scilit]
  2. Zimmerli, B.; Strub, M.; Jeger, F.; Stadler, O.; Lussi, A. Composite materials: Composition, properties and clinical applications. A literature review. Schweiz. Monatsschr. Zahnmed. 2010, 120, 972–986. [Google Scholar] [PubMed]
  3. Al Sunbul, H.; Silikas, N.; Watts, D.C. Polymerization shrinkage kinetics and shrinkage-stress in dental resin-composites. Dent. Mater. 2016, 32, 998–1006. [Google Scholar] [CrossRef] [Scilit]
  4. Sideridou, I.D.; Karabela, M.M.; Vouvoudi, E.C. Physical properties of current dental nanohybrid and nanofill light-cured resin composites. Dent. Mater. 2011, 27, 598–607. [Google Scholar] [CrossRef] [Scilit]
  5. Ionescu, A.C.; Cazzaniga, G.; Ottobelli, M.; Ferracane, J.L.; Paolone, G.; Brambilla, E. In vitro biofilm formation on resin-based composites cured under different surface conditions. J. Dent. 2018, 77, 78–86. [Google Scholar] [CrossRef] [Scilit] [PubMed]
  6. Tuncer, D.; Karaman, E.; Firat, E. Does the temperature of beverages affect the surface roughness, hardness and color stability of a composite resin? Eur. J. Dent. 2013, 7, 165–171. [Google Scholar] [CrossRef] [Scilit]
  7. Stansbury, J.W.; Idacavage, M.J. 3D printing with polymers: Challenges among expanding options and opportunities. Dent. Mater. 2016, 32, 54–64. [Google Scholar] [CrossRef] [Scilit] [PubMed]
  8. Keßler, A.; Montenbruck, L.; Schwendicke, F.; Lüchtenborg, J.; Kaisarly, D. Narrative review of 3D-printed temporary and permanent dental resin restorations. Polym. Test. 2025, 151, 108953. [Google Scholar] [CrossRef] [Scilit]
  9. Alfouzan, A.F.; Alotiabi, H.M.; Labban, N.; Al-Otaibi, H.N.; Al Taweel, S.M.; AlShehri, H.A. Color stability of 3D-printed denture resins: Effect of aging, mechanical brushing and immersion in staining medium. J. Adv. Prosthodont. 2021, 13, 160–171. [Google Scholar] [CrossRef] [Scilit]
  10. Paravina, R.D.; Ghinea, R.; Herrera, L.J.; Bona, A.D.; Igiel, C.; Linninger, M.; Sakai, M.; Takahashi, H.; Tashkandi, E.; Perez, M.M. Color difference thresholds in dentistry. J. Esthet. Restor. Dent. 2015, 27, S1–S9. [Google Scholar] [CrossRef] [Scilit]
  11. Alharbi, A.; Ardu, S.; Bortolotto, T.; Krejci, I. Stain susceptibility of composite and ceramic CAD/CAM blocks versus direct resin composites with different resinous matrices. Odontology 2017, 105, 162–169. [Google Scholar] [CrossRef] [Scilit]
  12. Stawarczyk, B.; Sener, B.; Trottmann, A.; Roos, M.; Ozcan, M.; Hämmerle, C.H. Discoloration of manually fabricated resins and industrially fabricated CAD/CAM blocks versus glass-ceramic: Effect of storage media, duration and polishing. Dent. Mater. J. 2012, 31, 377–383. [Google Scholar] [CrossRef] [Scilit]
  13. Gale, M.S.; Darvell, B.W. Thermal cycling procedures for laboratory testing of dental restorations. J. Dent. 1999, 27, 89–99. [Google Scholar] [CrossRef] [Scilit]
  14. Sharma, G.; Wu, W.; Dalal, E.N. The CIEDE2000 color-difference formula: Implementation notes, supplementary test data and mathematical observations. Color Res. Appl. 2005, 30, 21–30. [Google Scholar] [CrossRef] [Scilit]
  15. Wang, J.; Yang, J.; Lv, K.; Zhang, H.; Huang, H.; Jiang, X. Can we use the translucency parameter to predict the CAD/CAM ceramic restoration aesthetic? Dent. Mater. 2023, 39, e1–e10. [Google Scholar] [CrossRef] [Scilit]
  16. Lauvahutanon, S.; Takahashi, H.; Shiozawa, M.; Iwasaki, N.; Asakawa, Y.; Oki, M.; Finger, W.J.; Arksornnukit, M. Mechanical properties of composite resin blocks for CAD/CAM. Dent. Mater. J. 2014, 33, 705–710. [Google Scholar] [CrossRef] [Scilit] [PubMed]
  17. Živković, N.; Vulović, S.; Lazarević, M.; Đukić, L.; Jakovljević, A.; Dinić, I.; Perić, M.; Lemić, A.M. Evaluation of biological properties of the light-cured, CAD/CAM milled and 3D printed dental composites after artificial aging—An in vitro study. Dent. Mater. 2026, 42, 767–779. [Google Scholar] [CrossRef] [Scilit] [PubMed]
  18. Cinelli, F.; Scaminaci Russo, D.; Nieri, M.; Giachetti, L. Stain susceptibility of composite resins: Pigment penetration analysis. Materials 2022, 15, 4874. [Google Scholar] [CrossRef] [Scilit]
  19. Pérez, M.M.; Espinar, C.; Pecho, O.E.; Tejada-Casado, M.; Della Bona, A. Effect of aging on optical behavior and color of 3D printing resin-based dental restorative materials. J. Dent. 2025, 157, 105734. [Google Scholar] [CrossRef] [Scilit] [PubMed]
  20. Uctasli, M.; Garoushi, S.; Lassila, L.V.J.; Vallittu, P.K. A comparative assessment of color stability among various commercial resin composites. BMC Oral Health 2023, 23, 789. [Google Scholar] [CrossRef] [Scilit]
  21. Gad, M.M.; Alshehri, S.Z.; Alhamid, S.A.; Albarrak, A.; Khan, S.Q.; Alshahrani, F.A.; Alqarawi, F.K. Water sorption, solubility and translucency of 3D-printed denture base resins. Dent. J. 2022, 10, 42. [Google Scholar] [CrossRef] [Scilit] [PubMed]
  22. Paolone, G.; Mandurino, M.; De Palma, F.; Mazzitelli, C.; Scotti, N.; Breschi, L.; Gherlone, E.; Cantatore, G.; Vichi, A. Color Stability of Polymer-Based Composite CAD/CAM Blocks: A Systematic Review. Polymers 2023, 15, 464. [Google Scholar] [CrossRef] [Scilit]
  23. Ortengren, U.; Wellendorf, H.; Karlsson, S.; Ruyter, I.E. Water sorption and solubility of dental composites and identification of monomers released in an aqueous environment. J. Oral Rehabil. 2001, 28, 1106–1115. [Google Scholar] [CrossRef] [Scilit]
  24. Zattera, A.C.A.; Morganti, F.A.; Balbinot, G.S.; Della Bona, A.; Collares, F.M. The influence of filler load in 3D printing resin-based composites. Dent. Mater. 2024, 40, 1041–1046. [Google Scholar] [CrossRef] [Scilit]
  25. Temizci, T.; Bozoğulları, H.N. Effect of thermocycling on the mechanical properties of permanent composite-based CAD-CAM restorative materials produced by additive and subtractive manufacturing techniques. BMC Oral Health 2024, 24, 334. [Google Scholar] [CrossRef] [Scilit] [PubMed]
  26. Papadogiannis, D.; Tolidis, K.; Gerasimou, P.; Lakes, R.; Papadogiannis, Y. Viscoelastic properties, creep behavior and degree of conversion of bulk fill composite resins. Dent. Mater. 2015, 31, 1533–1541. [Google Scholar] [CrossRef] [Scilit] [PubMed]
  27. Boonyapookana, A.; Nagata, K.; Mutoh, Y. Fatigue crack growth behavior of silica particulate reinforced epoxy resin composite. Compos. Sci. Technol. 2011, 71, 1124–1131. [Google Scholar] [CrossRef] [Scilit]
  28. Pimentel, E.S.; França, F.M.G.; Turssi, C.P.; Basting, R.T.; Vieira-Junior, W.F. Effects of in vitro erosion on surface texture, microhardness and color stability of resin composite with S-PRG fillers. Clin. Oral Investig. 2023, 27, 3545–3556. [Google Scholar] [CrossRef] [Scilit]
  29. Malik, A.; Kothari, A.K.; Dave, R.; Rao, V.V.; Vyas, K.; Agrawal, D.P.; Patel, K. Comparative evaluation of surface roughness of different composite restorative materials after thermocycling and prolonged immersion in common beverages using atomic force microscopy—In vitro study. J. Pharm. Bioallied Sci. 2024, 16, S3251–S3253. [Google Scholar] [CrossRef] [Scilit]
  30. Boussès, Y.; Brulat-Bouchard, N.; Bouchard, P.O.; Tillier, Y. Effect of thermocycling on the matrix-filler interface of dental restorative materials. Dent. Mater. 2021, 37, 772–782. [Google Scholar] [CrossRef] [Scilit]
  31. Luo, H.; Lu, G.; Roy, S.; Lu, H. Characterization of the viscoelastic behavior of bismaleimide resin before and after exposure to high temperatures. Mech. Time-Depend. Mater. 2013, 17, 369–399. [Google Scholar] [CrossRef] [Scilit]
  32. Atala, M.H. Color Stability and Surface Roughness of CAD/CAM Hybrid Ceramics and Resin Composites After Simulated Toothbrushing in Coffee: An In Vitro Study. Appl. Sci. 2026, 16, 1576. [Google Scholar] [CrossRef] [Scilit]
  33. Oivanen, M.; Keulemans, F.; Garoushi, S.; Vallittu, P.K.; Lassila, L. The effect of refractive index of fillers and polymer matrix on translucency and color matching of dental resin composite. Biomater. Investig. Dent. 2021, 8, 48–53. [Google Scholar] [CrossRef] [Scilit] [PubMed]
  34. Ferracane, J.L. Hygroscopic and hydrolytic effects in dental polymer networks. Dent. Mater. 2006, 22, 211–222. [Google Scholar] [CrossRef] [Scilit]
  35. Nasu, T.; Ozaki, Y.; Sato, H. Study of changes in water structure during water absorption in acrylic acid-based polymers using Raman spectroscopy. Spectrochim. Acta A 2021, 250, 119305. [Google Scholar] [CrossRef] [Scilit]
  36. Jiang, E.S.; Moon, W.; Lim, B.S.; Ahn, J. Cytotoxicity and reactive oxygen species production induced by co-monomer eluted from nanohybrid dental composites. BMC Oral Health 2023, 23, 55. [Google Scholar] [CrossRef] [Scilit]
  37. Sideridou, I.; Tserki, V.; Papanastasiou, G. Effect of chemical structure on degree of conversion in light-cured dimethacrylate dental resins. Biomaterials 2002, 23, 1819–1829. [Google Scholar] [CrossRef] [Scilit]
  38. Ryu, I.S.; Liu, X.; Jin, Y.; Sun, J.; Lee, Y.J. Stoichiometric analysis of competing intermolecular hydrogen bonds using infrared spectroscopy. RSC Adv. 2018, 8, 23481–23488. [Google Scholar] [CrossRef] [Scilit]
  39. Xiang, K.; Wang, X.; Huang, G.; Zheng, J.; Huang, J.; Li, G. Thermal ageing behavior of styrene–butadiene copolymer. Polym. Degrad. Stab. 2012, 97, 1704–1715. [Google Scholar] [CrossRef] [Scilit]
  40. Ishida, T.; Kitagaki, R.; Watanabe, R.; Hagihara, H.; Elakneswaran, Y.; Shinzawa, H. Molecular architectural dynamics of crosslinked urethane during photo-aging. Polym. Degrad. Stab. 2020, 179, 109242. [Google Scholar] [CrossRef] [Scilit]
  41. Kammer, S.; Albinsky, K.; Sandner, B.; Wartewig, S. Polymerization of hydroxyalkyl methacrylates characterized by FT-Raman spectroscopy. Polymer 1999, 40, 1131–1137. [Google Scholar] [CrossRef] [Scilit]
  42. Miletic, V.; Santini, A.; Trkulja, I. Quantification of monomer elution and carbon-carbon double bonds in dental adhesive systems using micro-Raman spectroscopy. J. Dent. 2009, 37, 177–184. [Google Scholar] [CrossRef] [Scilit] [PubMed]
  43. Montes-G, G.M.; Draughn, R.A. In vitro surface degradation of composites by water and thermal cycling. Dent. Mater. 1986, 2, 193–197. [Google Scholar] [CrossRef] [Scilit] [PubMed]
  44. Mair, L.H. Surface permeability and degradation of dental composites resulting from oral temperature changes. Dent. Mater. 1989, 5, 247–255. [Google Scholar] [CrossRef] [Scilit] [PubMed]
Figure 1. Workflow of the study and number of specimens used per analysis for each composite (LCC, MC, and PC); T0—unaged; T1—aged for 5000 thermal cycles; T2—aged for 10,000 cycles; and T3—aged for 30,000 cycles. The asterisk (*) denotes that staining was performed in Coca-Cola and coffee (two specimens per beverage; 1 and 7 days).
Processes 14 01359 g001
Figure 2. Color changes in dental resin composites after hydrothermal aging (a) and subsequent staining in coffee (b) and Coca-Cola (c). Values of color change are expressed compared to the color of samples before aging, which represents a value of 0 in the graphs. The values after hydrothermal aging are expressed as average ± standard deviation between replicates. The statistical significance threshold of observed color changes was expressed as * p < 0.05.
Processes 14 01359 g002
Figure 3. Translucency parameters of dental resin composites before and after hydrothermal aging (a), and subsequent staining in coffee (b) and Coca-Cola (c). TP values are expressed as the mean ± standard deviation of replicate measurements in (a). Statistical significance was evaluated by comparing TP values after aging with the corresponding initial values (T0), using a significance threshold of * p < 0.05.
Processes 14 01359 g003
Figure 4. AFM topographs of LCC surface before (a) and after aging (bd).
Processes 14 01359 g004
Figure 5. AFM topographs of the MC surface before (a) and after aging (bd).
Processes 14 01359 g005
Figure 6. AFM topographs of the PC surface before (a) and after aging (bd).
Processes 14 01359 g006
Figure 7. Root mean square roughness (Rq) values of dental resin composite surface before and after aging.
Processes 14 01359 g007
Figure 8. Raman spectra of LCC before and after aging.
Processes 14 01359 g008
Figure 9. Raman spectra of MC before and after aging.
Processes 14 01359 g009
Figure 10. Raman spectra of the PC before and after aging.
Processes 14 01359 g010
Table 1. Processing techniques and composition of dental composite materials.
Processing
techniques
Light-Cured
Composite, LCC
CAD/CAM Milled Composite, MC3D Printed
Composite, PC
Brand nameG-aenial A’CHORDBreCAM.HIPCCrowntec
Resin
composition
UDMA, Bis-EMA
Bis-GMA, TEGDMA
Bis-MEPP
PMMA
Bis-GMA
Bis-EMA,
photoinitiators
FillersBarium glass,
pre-polymerized silica,
fumed silica
Ceramic
micro/nanofillers
Ba-Al-borosilicate glass fillers, fumed silica
Filler loading, %81–82 wt. %20–50 wt. %30–50 wt. %
Producer, LOTGC Europe
Leuven (BE)
283EZ4
Bredent
Senden (DE) 231210A1
Saremco,
Rebstein (CH) F629
UDMA—urethane dimethacrylate; Bis-EMA—bisphenol A ethoxylated dimethacrylate; Bis-GMA—bisphenol A glycidyl methacrylate; TEGDMA—triethylene glycol dimethacrylate; Bis-MEPP—bisphenol A monoethoxy polypropylene glycol dimethacrylate; PMMA—polymethyl methacrylate.
Disclaimer/Publisher’s Note: The statements, opinions and data contained in all publications are solely those of the individual author(s) and contributor(s) and not of MDPI and/or the editor(s). MDPI and/or the editor(s) disclaim responsibility for any injury to people or property resulting from any ideas, methods, instructions or products referred to in the content.