Article

Antibacterial Activity and Photocatalytic Properties of Zinc Oxide Nanoparticles Biosynthesized Using Licania tomentosa Leaf Extract: Optimization and Kinetic Studies


by
Moudo Thiam
1,
Vanessa O. Arnoldi Pellegrini
1,
Ruth Celestina Condori Mamani
1,
Fernanda Cassieri
1,
Haryne Lizandrey Azevedo Furtado
2,
Michael Santos Ribeiro
2,
Aruanã Joaquim Matheus Costa Rodrigues Pinheiro
2,
Luís Cláudio Nascimento da Silva
2,
Balla D. Ngom
3,
Mario de Oliveira Neto
4 and
Igor Polikarpov
1,*
1
Institute of Physics, University of São Paulo, Avenida Joao Dagnone, 1100, Jardim Santa Angelina, São Carlos 13563-120, SP, Brazil
2
Laboratório de Patogencidade Microbiana, Universidade Ceuma, Rua Josué Montello, No. 1, Renascença II, São Luís 65075-120, MA, Brazil
3
Faculté des Sciences et Techniques, Université Cheikh Anta Diop de Dakar (UCAD), Fann, Dakar B.P. 5005, Senegal
4
Institute of Biosciences, Sao Paulo State University, District of Rubiao Jr., Botucatu 18618-970, SP, Brazil
*
Author to whom correspondence should be addressed.
Processes 2026, 14(9), 1334; https://doi.org/10.3390/pr14091334
Submission received: 19 February 2026 / Revised: 9 April 2026 / Accepted: 16 April 2026 / Published: 22 April 2026
(This article belongs to the Special Issue Synthesis and Applications of Nanomaterials)

Abstract

Licania tomentosa leaf extract was used to synthesize zinc oxide nanoparticles (ZnO NPs) which were systematically analyzed by X-ray diffraction (XRD), scanning electron microscopy (SEM), UV-Visible (UV-Vis) and Fourier transform infrared (FT-IR) spectroscopies and energy-dispersion X-ray spectroscopy (EDS) methods. Based on XRD scans, the green NPs have an average crystallite size of 15.9 nm as estimated using the Scherrer equation and have a roughly spherical shape with an average diameter of 25.15 ± 1.2 nm as calculated from SEM data. As estimated from the Tauc plot based on UV-Vis absorption spectra, ZnO NPs have a small band gap of 3.0 eV. The biosynthesized ZnO NPs were effectively utilized for the photodegradation of methylene blue (MB) and crystal violet (CV) dyes under UV illumination with resulting MB and CV degradation efficiencies of ~94% and ~81% after 60 min and 70 min, with pH = 12 and pH = 10, respectively. Different experimental parameters such as NPs quantity, experimental pH, light intensity and initial concentration of dyes were varied to test the performance of the catalyst. Furthermore, efficient recycling of the catalyst was demonstrated. We also undertook antimicrobial studies of the green ZnO NPs. The ZnO NPs demonstrated broad-spectrum antimicrobial efficacy against Escherichia coli ATCC 35218, Enterococcus faecalis ATCC 29737, Klebsiella pneumoniae ATCC 700603, Pseudomonas aeruginosa ATCC 27853, P. aeruginosa B3, Staphylococcus aureus ATCC 29213, and S. aureus SA01, with the minimum inhibitory concentration (MIC) and the inhibitory concentrations associated with 50% effect (IC50) values ranging from 250 to 2000 µg/mL and 7.74 to 283.14 µg/mL, respectively. The nanoparticles also significantly inhibited biofilm formation by E. faecalis ATCC 29737, P. aeruginosa ATCC 27856, and S. aureus SA03. The antimicrobial efficiency of the ZnO NPs against Escherichia coli ATCC 25922 and Staphylococcus aureus SA03 isolates was also assessed using the disk diffusion assays. Taken together, our results reveal that the biosynthesized ZnO NPs are promising multifunctional materials with potential applications in antimicrobial treatments, biofilm control, and photocatalytic remediation.

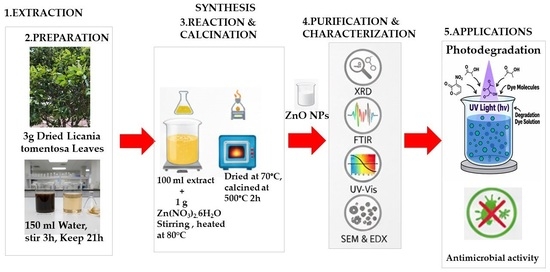
Graphical Abstract

1. Introduction

Water is an invaluable vital resource, but clean sources are becoming more and more scarce due to human carelessness and manufacturing activities leading to elevated levels of pollution [1]. Organic pollutants, such as dyes, antibiotics, and pesticides, constitute the most concerning category of contaminants [2]. Furthermore, microbial contamination poses a major global health risk, causing serious diseases like dysentery, typhoid fever, and cholera [3].
ZnO NPs have diverse applications in fields such as anticancer, antidiabetic, antibacterial, BioReRAM, antifungal treatments, drug delivery, CO2 photoreduction and agricultural technologies [4,5,6,7]. The application of NPs in water sanitation is an actively developing area. The most advanced materials in this field are the ones that combine photocatalytic and antimicrobial properties. These nanomaterials offer the potential to simultaneously achieve the degradation of organic pollutants and the eradication of pathogenic microorganisms in a single step under visible/UV light irradiation. Zinc oxide (ZnO), a Group II-V semiconductor compound, frequently crystallizes in a wurtzite structure. ZnO possesses remarkable qualities, such as a wide, direct band gap (approximatively 3.36 eV), strong absorption in the ultraviolet region, high room-temperature exciton binding energy (around 60 meV), a large electrochemical coupling coefficient, excellent photostability, biocompatibility and low toxicity [8].
ZnO is a highly versatile material, considered an ideal candidate for water treatment process thanks to its two main properties: ZnO exhibits strong photocatalytic activity, not only under ultraviolet (UV), but also visible radiation due to its lower band gap energy compared to TiO2. When irradiated, ZnO NPs produce reactive oxygen species (ROS), which are responsible for both the photocatalytic activity (pollutant degradation) and the antimicrobial activity. The antimicrobial activity of ZnO NPs is generally higher for smaller NPs. This effect relies on two primary mechanisms [9]: (i). light-related mechanisms (ROS production), and (ii). morphology-related mechanisms including mechanical damage (physical destruction of microbial cell membranes) and/or ion release (diffusion of Zn2+ ions, which interact with essential cell components) [10]. Furthermore, ZnO is non-toxic to humans, water insoluble, reusable, and combines elevated photocatalytic and antimicrobial activities. However, all these characteristics strongly depend on the size, shape, surface morphology, and defects of the ZnO NPs, which are themselves determined by the synthesis method.
The preparation of ZnO NPs can follow various chemical and physical routes (sol–gel, pulsed laser deposition, thermal evaporation, etc.) [11,12]. However, most of these traditional methods are expensive, intensive in terms of energy and time, require critical conditions (temperature and pressure), and use hazardous chemicals that negatively affect the environment. Given environmental concerns, biosynthesis, or “green synthesis”, has arisen as a very promising approach. This method is favored because it is simple and low-cost, environmentally friendly, suitable for large-scale production, results in more stable and biocompatible NPs [13]. At the same time, ZnO NPs might exhibit significant ecotoxicity to aquatic and terrestrial organisms, primarily driven by the release of Zn2+ ions and reactive oxygen production [14,15] and cause considerable oxidative stress, metabolic inhibition, and structural damage to algae, bacteria, and invertebrates [16]. Therefore, ZnO NPs applications have to be investigated in each specific case and applied with caution.
For practical large-scale implementation, improvements are required in synthesis reproducibility, photocatalytic efficiency, and NP recovery or reuse. Furthermore, pilot studies in real wastewater conditions, cost–benefit analyses, and adherence to industrial standards remain essential to ensure feasibility and efficiency at an industrial scale [17]. Green biosynthesis methods further enhance the environmental value of ZnO NPs by producing non-toxic and biodegradable materials. Using biological agents such as plant extracts, bacteria, or fungi, this approach avoids hazardous chemicals while yielding nanoparticles with enhanced photocatalytic and antimicrobial performance [18]. Several recent studies focus on ZnO NPs’ capacity to act simultaneously as a photocatalyst (e.g., for organic dye degradation) and as an antimicrobial agent, optimizing both functionalities within the single nanostructures [19,20,21,22]. The composition of biological materials used in green synthesis, including plant extracts and microorganisms, can vary significantly depending on factors such as plant species, extraction techniques, seasonal conditions, and geographic origin. These variations can affect the consistency of NPs’ characteristics, making it crucial to systematically evaluate NP production in particular pilot settings [23,24].
The most promising biosynthetic route utilizes plant extract (from fruits, leaves and seeds). Plants are rich in phytochemical compounds (flavonoids, tannins, alkaloids, etc.). These compounds can be extracted using eco-friendly solvents, such as distilled water, for example. The phytochemicals (especially polyphenols) serve as reducing agents, transforming the precursor metal ions into metal oxide NPs. They also serve as stabilizing agents, partially preventing the formed NPs from agglomeration.
There have been numerous reports on the ZnO NPs synthesis of with leaf extract from Lemon peel [23], Camellia sinensis [24], Annato tree [25], Hibiscus subdariffa [26], Coffea arabica L. [4], Aloe vera [27], Ficus carica [28], Lupinus pilosus [29], to name a few, and their antibacterial and photocatalytic activities have been evaluated [30]. Licania tomentosa Benth (Oiti) belongs to the Chrysobalanaceae family and is native to the Caatinga region of Brazil [31]. It is commonly used in public gardens to provide shade [32] and its seed oil can be used as ink drying oil [33]. L. tomentosa Benth leaves are readily available in Brazil, reducing raw material costs. The leaves are rich in active phytochemical compounds, such as betulinic acid, flavonoids, phenolics, and various triterpenic and fatty acids [34,35,36]. Licania tomentosa leaf extracts have demonstrated antioxidant [36], anticholinesterase [37], antibacterial, and antiviral activities [38]. Here, we report the biosynthesis of ZnO NPs with L. tomentosa leaf extract and their characterization with various techniques, such as UV-Vis, SEM, XRD, EDX, and FT-IR. The NPs were subsequently utilized as photocatalysts in organic dye photodegradation. The ZnO NPs were also shown to inhibit the biofilm formation and to eliminate planktonic cells of clinically relevant pathogenic microorganisms.

2. Material and Methods

2.1. Original Materials

Licania tomentosa Benth fresh leaves were collected at the Sao Carlos Campus 2 of the University of Sao Paulo (USP) (geolocation: −21.999041, −47.932830) in January 2025. The analytical quality zinc nitrate hexahydrate, ethylenediaminetetraacetic (EDTA), Isopropyl alcohol (IPA, P-Benzoquinone (BQ, and DMSO (purity ≥ 99.0%) were bought from Sigma-Aldrich (Burlington, MS, USA) and used as received. Origin 2018 64 Bit was used to plot graphs.

2.2. Licania Tomentosa Leaf Extracts

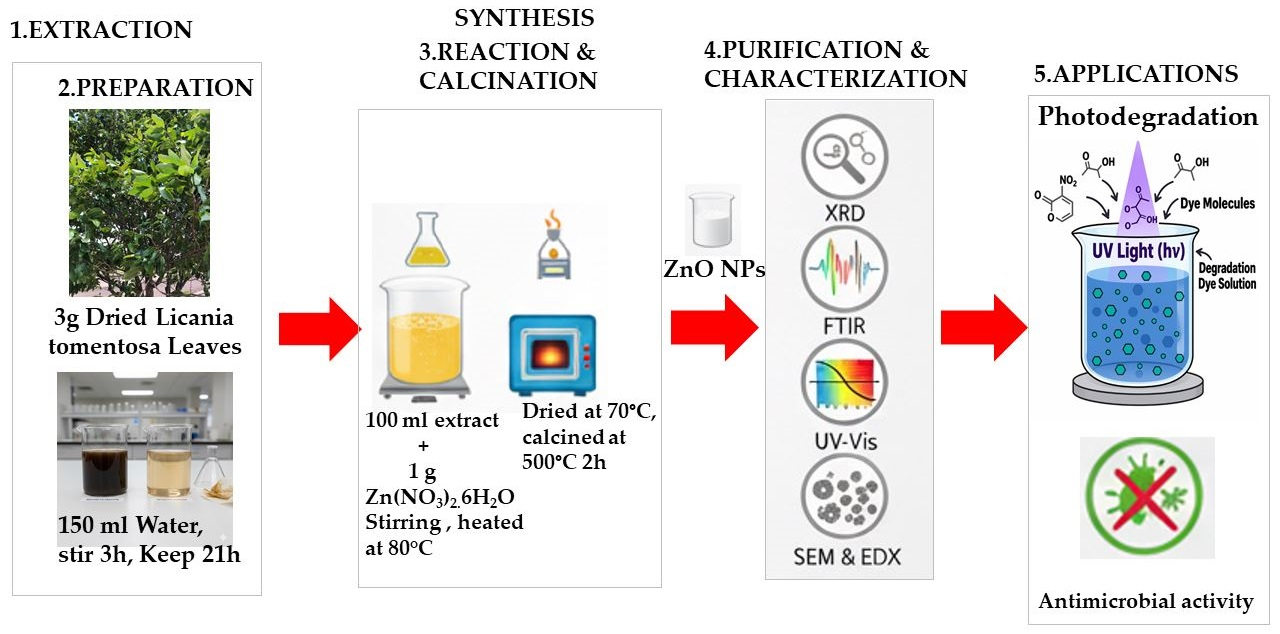
The L. tomentosa leaves were extensively rinsed with distilled water to clean them up. The leaves were dried at 50 °C for 5 days and milled. A total of 3.25 g of the milled powder was added to 150 mL of deionized water and stirred using a magnetic stirrer at room temperature for 3 h to optimize the extraction of the soluble bioactive compounds. Well enclosed with an aluminum foil, the mixture was allowed to settle at room temperature for 21 h. Next, it was passed through a Whatman No. 1 filter paper (produced in Germany and packaged in Brazil) to get rid of the residual solids (Graphical abstract).

2.3. ZnO NPs Biosynthesis

ZnO NPs synthesis used 100 mL of the filtered extract in which 1 g of Zn (NO3)2·6H2O was dissolved and stirred for 3 h at room temperature. The resultant solution was partially evaporated at 70–80 °C using a magnetic stirrer. The process was stopped when the mixture was reduced to 1/10th of the volume. The resulting solids were dried in the air oven at 70 °C overnight and thermally treated at 500 °C for 2 h. The obtained white powder was thoroughly washed to remove impurities and dried overnight at 70 °C (see Graphical abstract). The output efficiency was found to be 266.6 mg NPs/g using Equation (1):
e f f i c i e n c y = M a s s e   o f   p r e p a r e d   N P s   ( m g ) M a s s   o f   d r i e d   e x t r a c t ( g ) = 800   m g 3   g = 266.6   m g   N P s / g

2.4. Analytical Characterization of the Obtained NPs

XRD measurements were conducted using Cu Kα radiation (λ = 1.5406 Å) on a Miniflex 600 X-ray diffractometer (Rigaku, Tokyo, Japan), which was operating at 40 kV and 15 mA. Detection was performed in the 2θ range between 5° and 70°, with an angular step of 0.02° and an exposure time of 15 s per step. The observed diffraction peaks were extracted from the measured diffractograms. Peak fitting program (PeakFit Version 13; www.systat.com, accessed on 15 April 2026) was used to adjust Gaussian functions for each peak and the NPs’ average crystallite sizes were estimated using the modified Scherrer equation [39,40]. For comparison, an average crystallite size (D), dislocation density (δ), and micro strain (ε) were also estimated using the Williamson–Hall method [41] from the following Equations (2) and (3):
δ = 1 D 2
ε = β 4   t a n θ
Here, D is the crystallite average dimension, β is the full width at half maximum (FWHM) in radians and θ is the scattering angle in degrees.
UV-Vis adsorption spectra were measured using Thermo Scientific (Waltham, MA, USA) Multiskan GO UV/Vis Microplate Reader Spectrophotometer between 200 and 1000 nm. For the measurements, the ZnO NPs were suspended in milli-Q water in a 1 cm quartz cuvette. Origin 8 software was used to analyze the adsorption spectra.
FT-IR data were obtained as follows: Pellets of the ZnO NPs samples were prepared using a hydraulic press. A Nicolet 6700 FT-IR spectrometer was used to collect spectra within a wave number range between 400 cm−1 and 4000 cm−1.
Morphology and the average size of the synthesized green ZnO NPs were evaluated by scanning electron microscopy (SEM). The ZnO NPs powder was scattered on a sample holder, coated with gold and scanned using an electron beam. The element composition of the samples was analyzed by energy-dispersion X-ray spectroscopy (EDS) using an X-Max solid-state silicon detector (Oxford Instruments). Finally, the pHzpc of the ZnO NPs was determined.
Hydrodynamic radii and the NP size distribution were analyzed using the DLS technique (SpectroSize 300 instrument, XtalConcepts, Germany). DLS relies on the measurements of light intensity fluctuations as a function of time due to the particle’s Brownian motion [42]. Such measurements allow for the determination of the diffusion coefficient (D), which is related to the hydrodynamic radius (Rh) of the particle via the Stokes-Einstein equation,
D = k b T 6 π η R h
where kb is the Boltzmann constant (1.380 × 10⁻²³ kg m2 k−1), T is the absolute temperature, and η is the viscosity of the solution [42].

2.5. Photocatalytic Activity Measurements

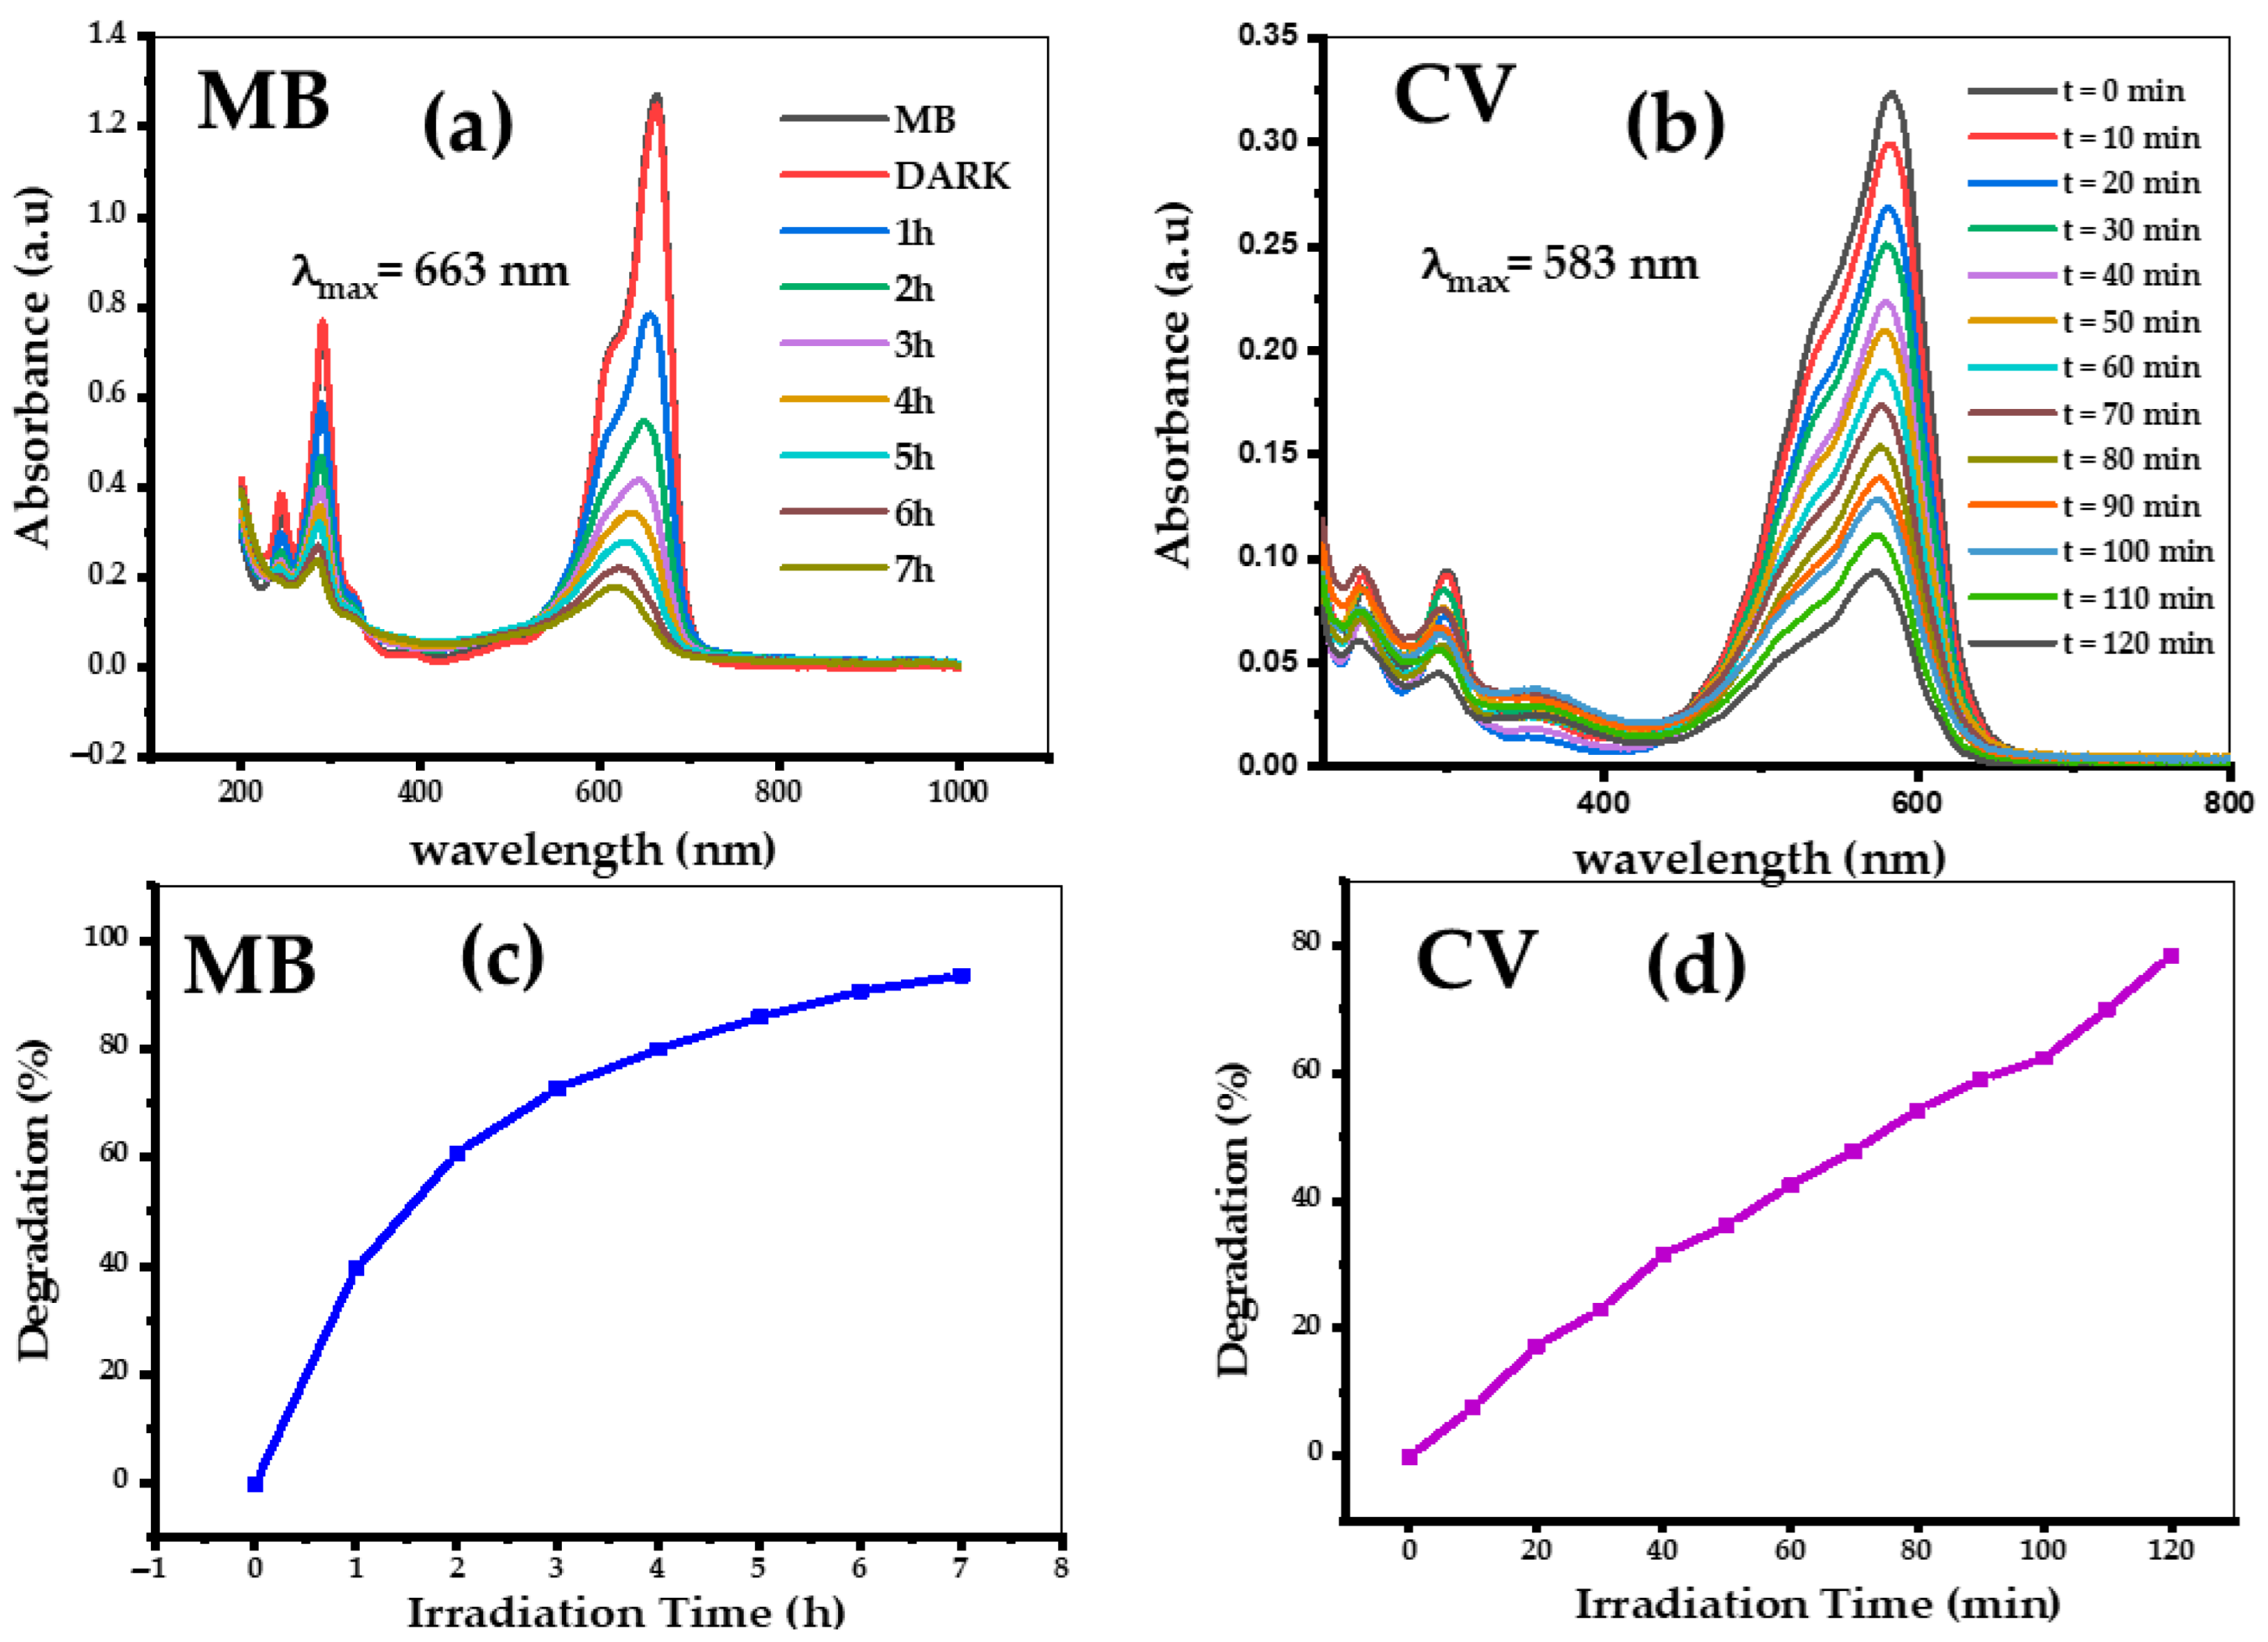
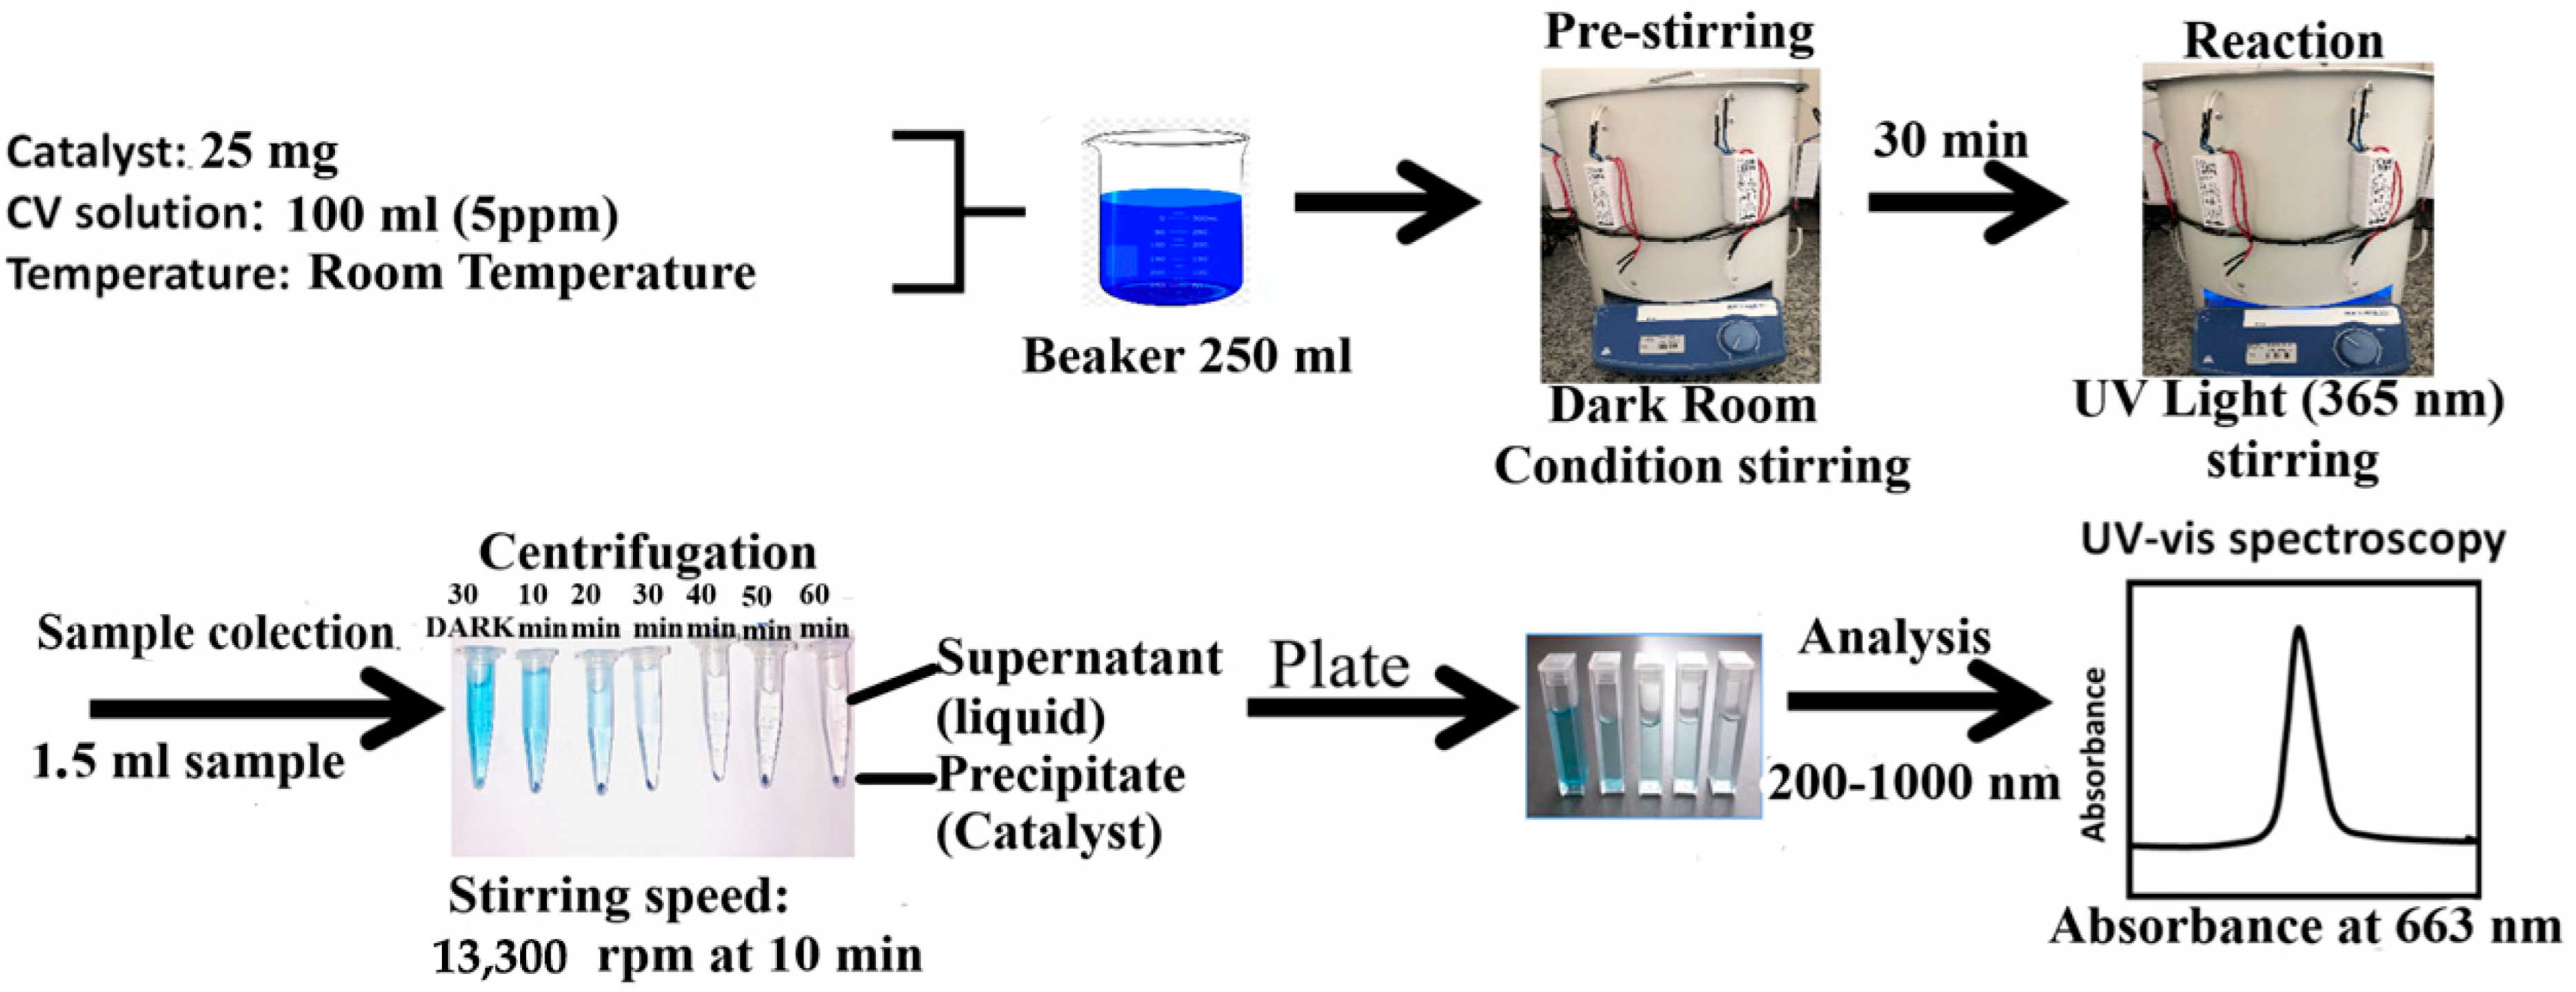
The photocatalytic activity of the ZnO NPs biosynthesized using L. tomentosa leaf extract was studied using MB and CV as model dyes. MB and CV are extensively applied in the textile and paper industries and are components of navy blue and black inks, respectively. In a typical photocatalytic experiment, 25 mgs of the ZnO NPs were dispersed in 100 mL of 5 mg/L MB dissolved in water. The mixture was first stirred in the dark for 30 min. After this period, a mixture containing dyes and the photocatalyst was submitted to UV-A light using eight (8) UV-A 6W T-5-BL Lucmat lamps (LUCMAT, São Paulo, SP, Brazil), with a maximum emission wavelength of 368 nm. After that, 1.5 mL aliquots were periodically taken. The supernatant was obtained by centrifugation at 13,300 rpm for 10 min. The dye degradation was monitored by measuring the fall in the maximum absorbance of MB and CV dyes in the supernatant, with absorption peaks centered at λ = 663 nm and 583 nm, respectively, using Thermo Scientific Multiskan GO UV/Vis Microplate Reader Spectrophotometer over a wavelength range 200–1000 nm (Figure 1).
The degradation was quantified using the equation:
D e g r a d a t i o n   ( % ) = C 0 C t C 0 × 100 % = A 0 A t A 0 × 100 %
Here, A 0 is the initial absorbance of dyes at the initial concentration C 0 , and A t is the absorbance of the dye with concentration C t at time interval t.
Figure 1. Schematic representation of the experimental steps for MB decomposition.
Processes 14 01334 g001

2.6. Antimicrobial Activity Measurements

The antimicrobial activity of the green-synthesized ZnO nanoparticles was evaluated using the broth microdilution method in 96-well microplates. The bacterial isolates (Escherichia coli ATCC 35218, Enterococcus faecalis ATCC 29737, Klebsiella pneumoniae ATCC 700603, Pseudomonas aeruginosa ATCC 27853, P. aeruginosa B3, Staphylococcus aureus ATCC 29213, and S. aureus SA01) were suspended in sterile saline and adjusted to an optical density of 0.1 at 600 nm (≈1.5 × 10⁸ CFU/mL; McFarland 0.5 standard). A stock suspension of ZnO NPs (4000 µg/mL) was prepared in Milli-Q water and subjected to twofold serial dilutions in Mueller–Hinton (MH) broth to obtain final concentrations ranging from 1.95 to 2000 µg/mL. Each well received 10 µL of the bacterial inoculum and 90 µL of MH broth containing the corresponding ZnO nanoparticle dilution. Following incubation at 37 °C for 24 h, 30 µL of 0.03% resazurin solution (Sigma-Aldrich®) was added to each well and plates were incubated for an additional 4 h [28]. Minimum inhibitory concentration (MIC) was defined as the lowest concentration capable of inhibiting the colorimetric changes from blue (no reduction in resazurin to resorufin) to pink. The bacterial growth was determined from measurements of the optical density at 600 nm (OD600). The percentage of bacterial growth inhibition at each nanoparticle concentration was calculated relative to the positive growth control (bacteria without nanoparticles) using Formula (6):
Growth   Inhibition   ( % ) = 1 ( A test A NP   blank ) A control × 100 %
Here, A t e s t is the absorbance of NPs in MH broth with bacteria, A NP   blank is the absorbance of NPs in MH broth without bacteria, and A c o n t r o l is the absorbance of bacteria in MH broth without nanoparticles.
Nonlinear regression using a four-parameter logistic model ([inhibitor] vs. response, 4PL) was performed in GraphPad Prism (v. 10) to determine the IC50, defined as the concentration of nanoparticles required to inhibit 50% of bacterial growth.
Minimum bactericidal concentrations (MBCs) were determined as follows: aliquots of 10 µL from wells showing no detectable bacterial growth after 24 h of incubation were streaked onto Mueller–Hinton agar plates and incubated at 37 °C for 24 h. The MBC was defined as the lowest concentration of ZnO NPs yielding no detectable bacterial colonies on the agar surface [43].

2.7. Biofilm Inhibition Assay

Further, the ZnO NPs were assessed for their ability to inhibit bacterial biofilm formation. For this assay, E. faecalis ATCC 29737, P. aeruginosa ATCC 27856 and S. aureus SA03 were used as test organisms. Bacterial cultures were initially grown in Mueller–Hinton broth and adjusted to a final density of approximately 1 × 10⁶ CFU/mL. Aliquots of the standardized bacterial suspensions (10 µL) were then inoculated into sterile 96-well microplates together with 90 µL of ZnO NPs at different concentrations (0.25  ×  MIC, 0.5  ×  MIC, 1  ×  MIC) and 100 µL of MH broth. Following incubation, the solutions from the wells were gently aspirated, and each well was washed carefully with phosphate-buffered saline (PBS) to remove non-adherent cells. The remaining attached biofilms were then fixed using methanol and stained with 1% (w/v) CV for 20 min at room temperature. Excess stain was eliminated by repeated rinsing with PBS. The stained biofilm biomass was subsequently solubilized with 70% (v/v) ethanol and allowed to rest for 15 min. The OD of the solubilized crystal violet was analyzed at 590 nm using a microplate spectrophotometer. The measured absorbance was used to quantify biofilm formation and to calculate the percentage of biofilm inhibition induced by nanoparticle treatment relative to the untreated control [44].
B i o f i l m   formation   ( % ) = ( A t e s t A   blank ) ( A c o n t r o l A   blank ) × 100 %

2.8. Disk Diffusion Assays

The disk diffusion assay (Kirby–Bauer method) was adapted to evaluate the ZnO NPs antibacterial activity against Staphylococcus aureus SA03 and Escherichia coli ATCC 25922 isolates. Under sterile conditions, suspensions of the NPs were prepared using serial dilutions. All suspensions were subjected to sonication for 10 min to ensure homogenous dispersion and subsequently kept at rest for 24 h to favor solubilization. The bacterial cultures were adjusted to an optical density of O.D. = 0.1 in LB medium. Next, 20 µL of each NPs suspension was applied to the plates previously seeded with the bacteria. Each assay was performed in duplicate. As a positive control (+), 10 µL of ampicillin (10 mg/mL) was used, and as a negative control, 10 µL of sterile water was applied. After that, the plates were incubated at 35 °C for 24 h. Finally, the inhibition zones formed were evaluated, and the results were recorded in millimeters (mm). All measurements were performed in duplicate.

2.9. Statistical Analysis

Statistical analyses were undertaken using the software GraphPad Prism version 10.01 (GraphPad Software Inc., La Jolla, CA, USA). The data were analyzed by one-way analysis of variance (ANOVA) followed by the Tukey test. A p-value of <0.05 was considered statistically significant. All experiments, excluding photocatalytic degradation and antimicrobial assays, were performed in triplicate (n = 3). The data are presented as the mean ± standard deviation.

3. Results and Discussion

3.1. SEM Analysis

The SEM was used to evaluate morphology of the biogenic ZnO NPs and to estimate their particle size (Figure 2a,b). The green ZnO NPs have a homogeneously spherical morphology and are grouped together in aggregates. To analyze the chemical composition of the NPs sample, energy dispersive X-ray (EDS) data were obtained, as depicted in Figure 2d. The EDS spectrum showed the presence of three main elements (zinc, oxygen and silicon) in the samples. The silicon signal originates from the Si grids used for the sample loading, whereas Zn and O signals support successful ZnO NP synthesis. In Figure 2c, the histogram of particle size distribution shows that the mean diameter of ZnO nanoparticles is 25.15 ± 1.2 nm.

3.2. XRD Analysis and Average Crystallite Size

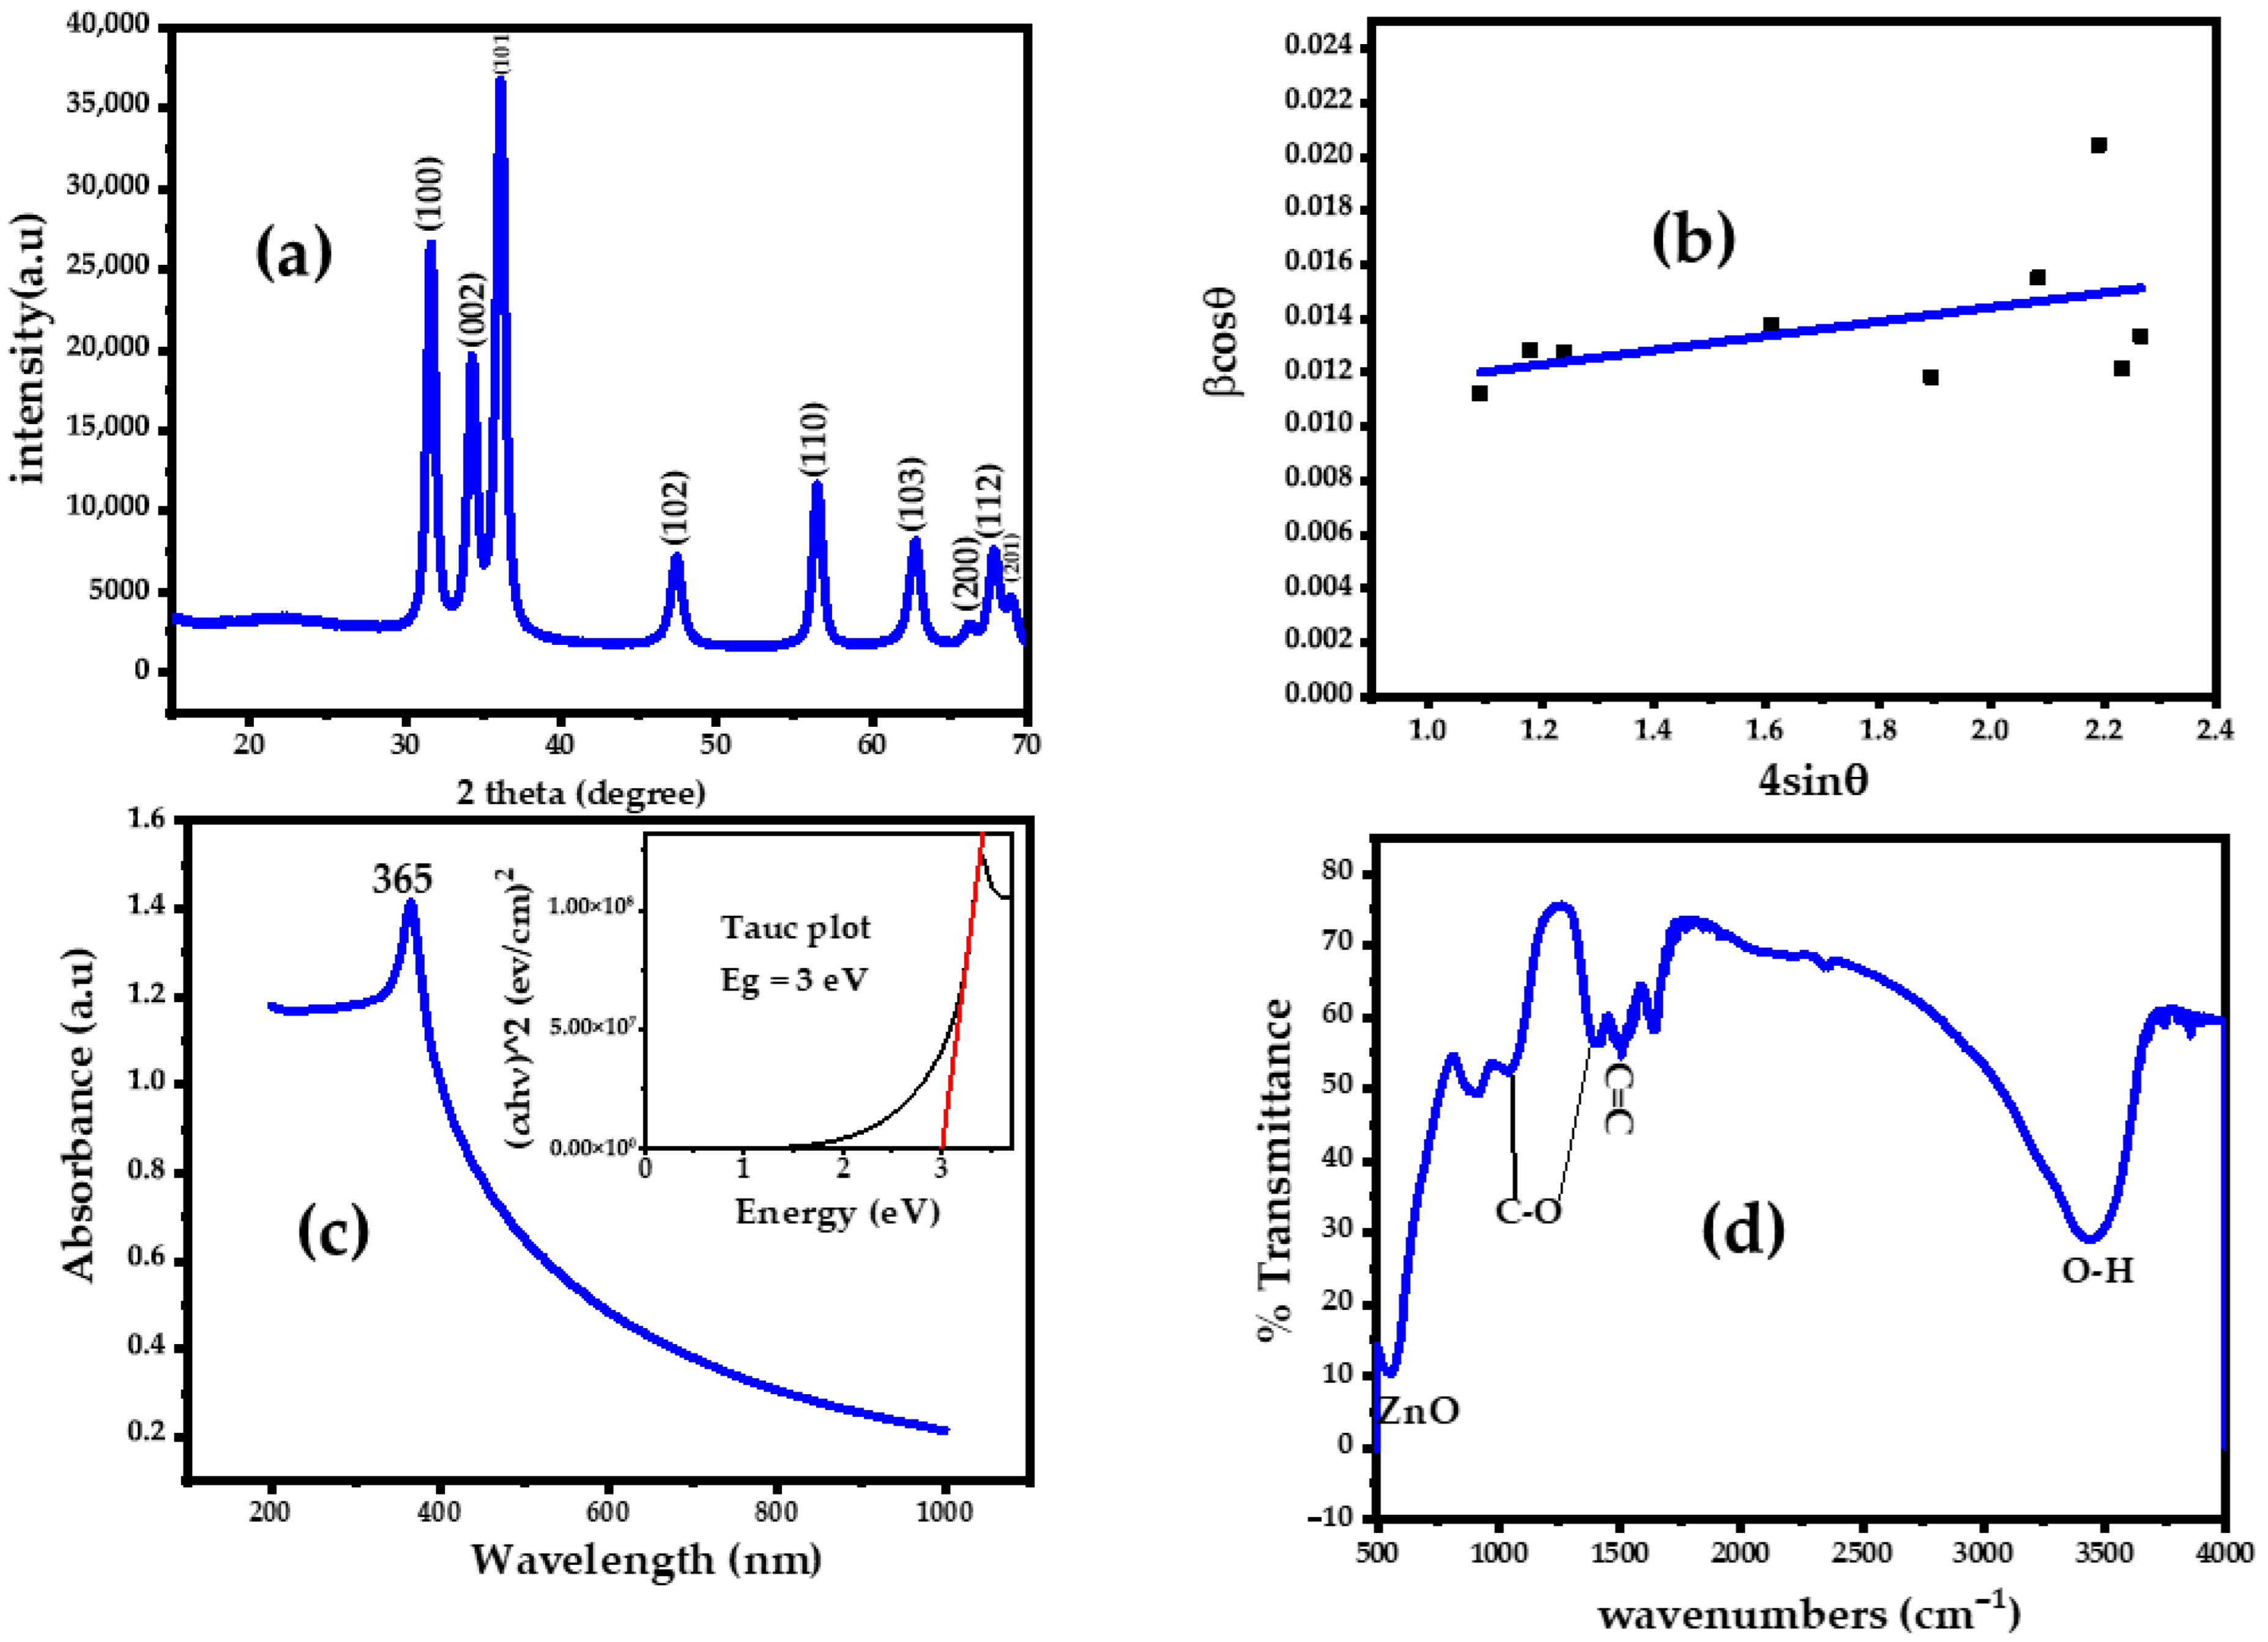
X-ray diffraction (XRD) analysis of the biogenic ZnO NPs obtained using L. tomentosa leaf extract shows well-defined strong diffraction peaks (Figure 3a), with 2θ values of 31.65°, 34.33°, 36.12°, 47.44°, 56.50°, 62.78°, 66.40°, 67.87 and 69.0°. The peaks correspond to the crystallographic planes (100), (002), (101), (102), (110), (103), (200), (112) and (201) of ZnO NPs in a polycrystalline hexagonal wurtzite structure (JCPDS 5-0664). The XRD data exclude the presence of a secondary phase (Figure 3a). Out of all existing ZnO NPs structures, the hexagonal wurtzite structure is one of the most frequently observed [45].
The average crystallite size was calculated using the Scherrer equation resulting in an estimate of about 15.9 nm. At the same time, using the Williamson–Hall approach (Figure 3b) the average crystallite size was estimated to be about 10.8 nm. In addition, the dislocation density (δ) and micro-strain (ε) can be evaluated as 2.55 × 10⁻³ nm and 3.94 × 10⁻³. Comparison of the average crystallize sizes with the average particle size (Figure 3c) shows that each of the ZnO NPs is made of several crystallites, i.e., is polycrystalline.

3.3. UV-Vis Spectroscopy Data

The optical properties of the ZnO NPs were analyzed using UV-Vis adsorption spectroscopy (Figure 3c). A clear absorption peak at 365 nm is characteristic of ZnO NPs. The ZnO NPs band gap was estimated from the experimental UV-Vis data based on Equation (8) [46].
( α h υ ) 2 = B ( h υ E g ) 1 / 2
Here, B is a constant, h = 6.626 × 10⁻³⁴ J Hz−1 is the Planck constant, υ is the frequency of light, Eg is the optical band gap energy and α is the adsorption coefficient. The specific band gap was determined using the extrapolation of the linear part of the (αhυ)2 versus (hυ) function to the x-axis. The band gap of the ZnO NPs was estimated to be equal to 3 eV (see the insert in Figure 3c). This band gap is considerably smaller than a typical band gap of bulk ZnO (EG = 3.37 eV) [47]. A decrease in the band gap is a consequence of nanoscopic NP dimensions as well as the plant extract reduction [48], which can result in even more catalytically active NPs than the similar NPs prepared by other methods [49,50].

3.4. FT-IR Measurements

The ZnO NPs FT-IR spectra reveal various peaks centered at 3400 cm−1, 1550 cm−1, 1400 cm−1, 1050 cm−1 and 550 cm−1 (Figure 3d). The peak at 550 cm−1 corresponds to the Zn-O bond, which further corroborates the idea of ZnO NP synthesis [51]. A strong peak at 3400 cm−1 could be ascribed to the O-H stretching vibrations of the bound OH group and/or the moisture adsorbed on the ZnO NP surface, whereas a less intense peak at 1550 cm−1 stems from the deformation vibrations of the same chemical moieties [52,53]. At the same time, the peaks at 1400 cm−1 and 1050 cm−1 can be linked to the C-O stretching modes [54,55].

3.5. Dynamic Light Scattering (DLS) Measurements

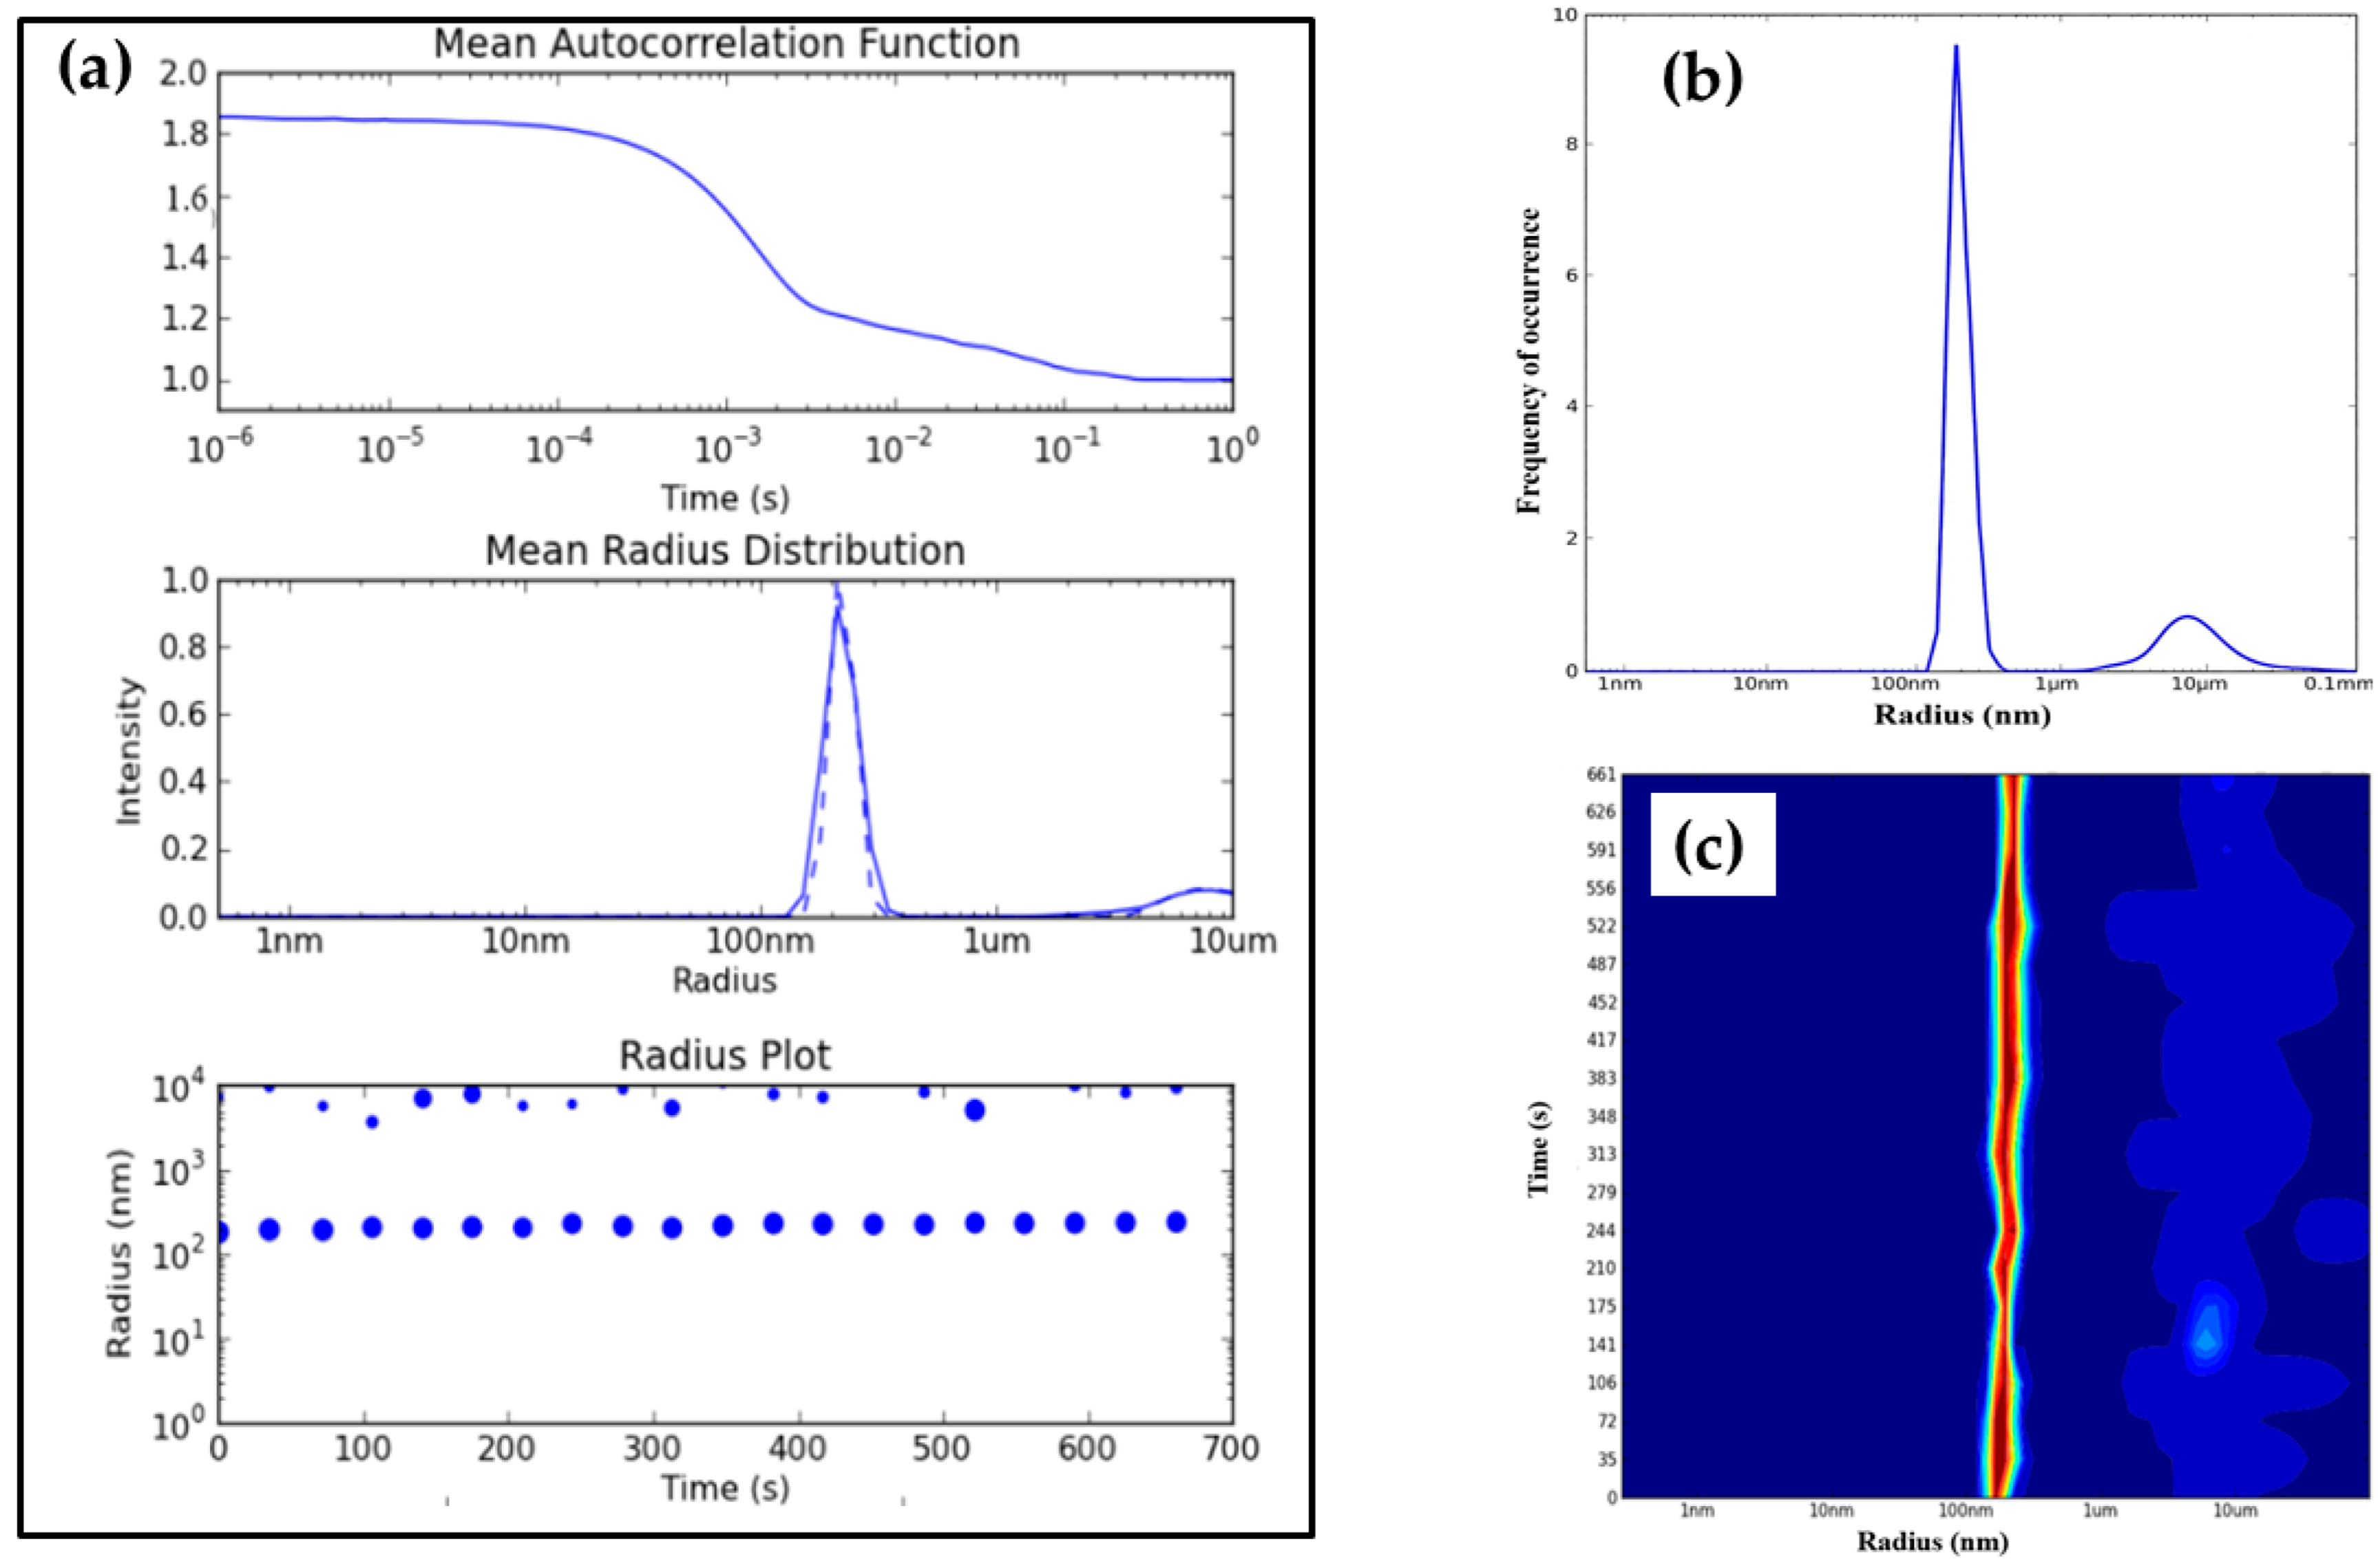
DLS measurements (Figure 4) are highly sensitive to NP aggregation. The biosynthesized ZnO NPs particle size distribution (Figure 4) is a bimodal function (Figure 4a,b) with roughly half of the particles having a smaller average hydrodynamic radius of 217 ± 16 nm with a relatively narrow polydispersity index (PDI) of 12.9%. The other half of the particles form much larger aggregates with an average hydrodynamic radius of 6883 ± 1232 nm and a much broader distribution, reflected in PDI = 42%. This is broadly consistent with SEM images of the ZnO NPs (Section 3.1) which reveal significant NP aggregation (Figure 2). If one assumes that both modes in particle size distributions in solution as made of tightly packed rigid spheres with as average diameter of 25 nm (Figure 2c), the smaller size well-defined distribution with an average radius of 217 nm represents clusters with several hundreds to a few thousands individual NPs, although the upper limit might be overestimated, since an influence of the hydration sphere of water molecules tightly bound to the surface of NPs has not been taken into account. The second part of the distribution reflects much larger aggregates. Nevertheless, the suspension reveals good temporal stability, with only minor fluctuation in hydrodynamic radius over time (Figure 4c).

3.6. Point of Zero Charge (pHzpc)

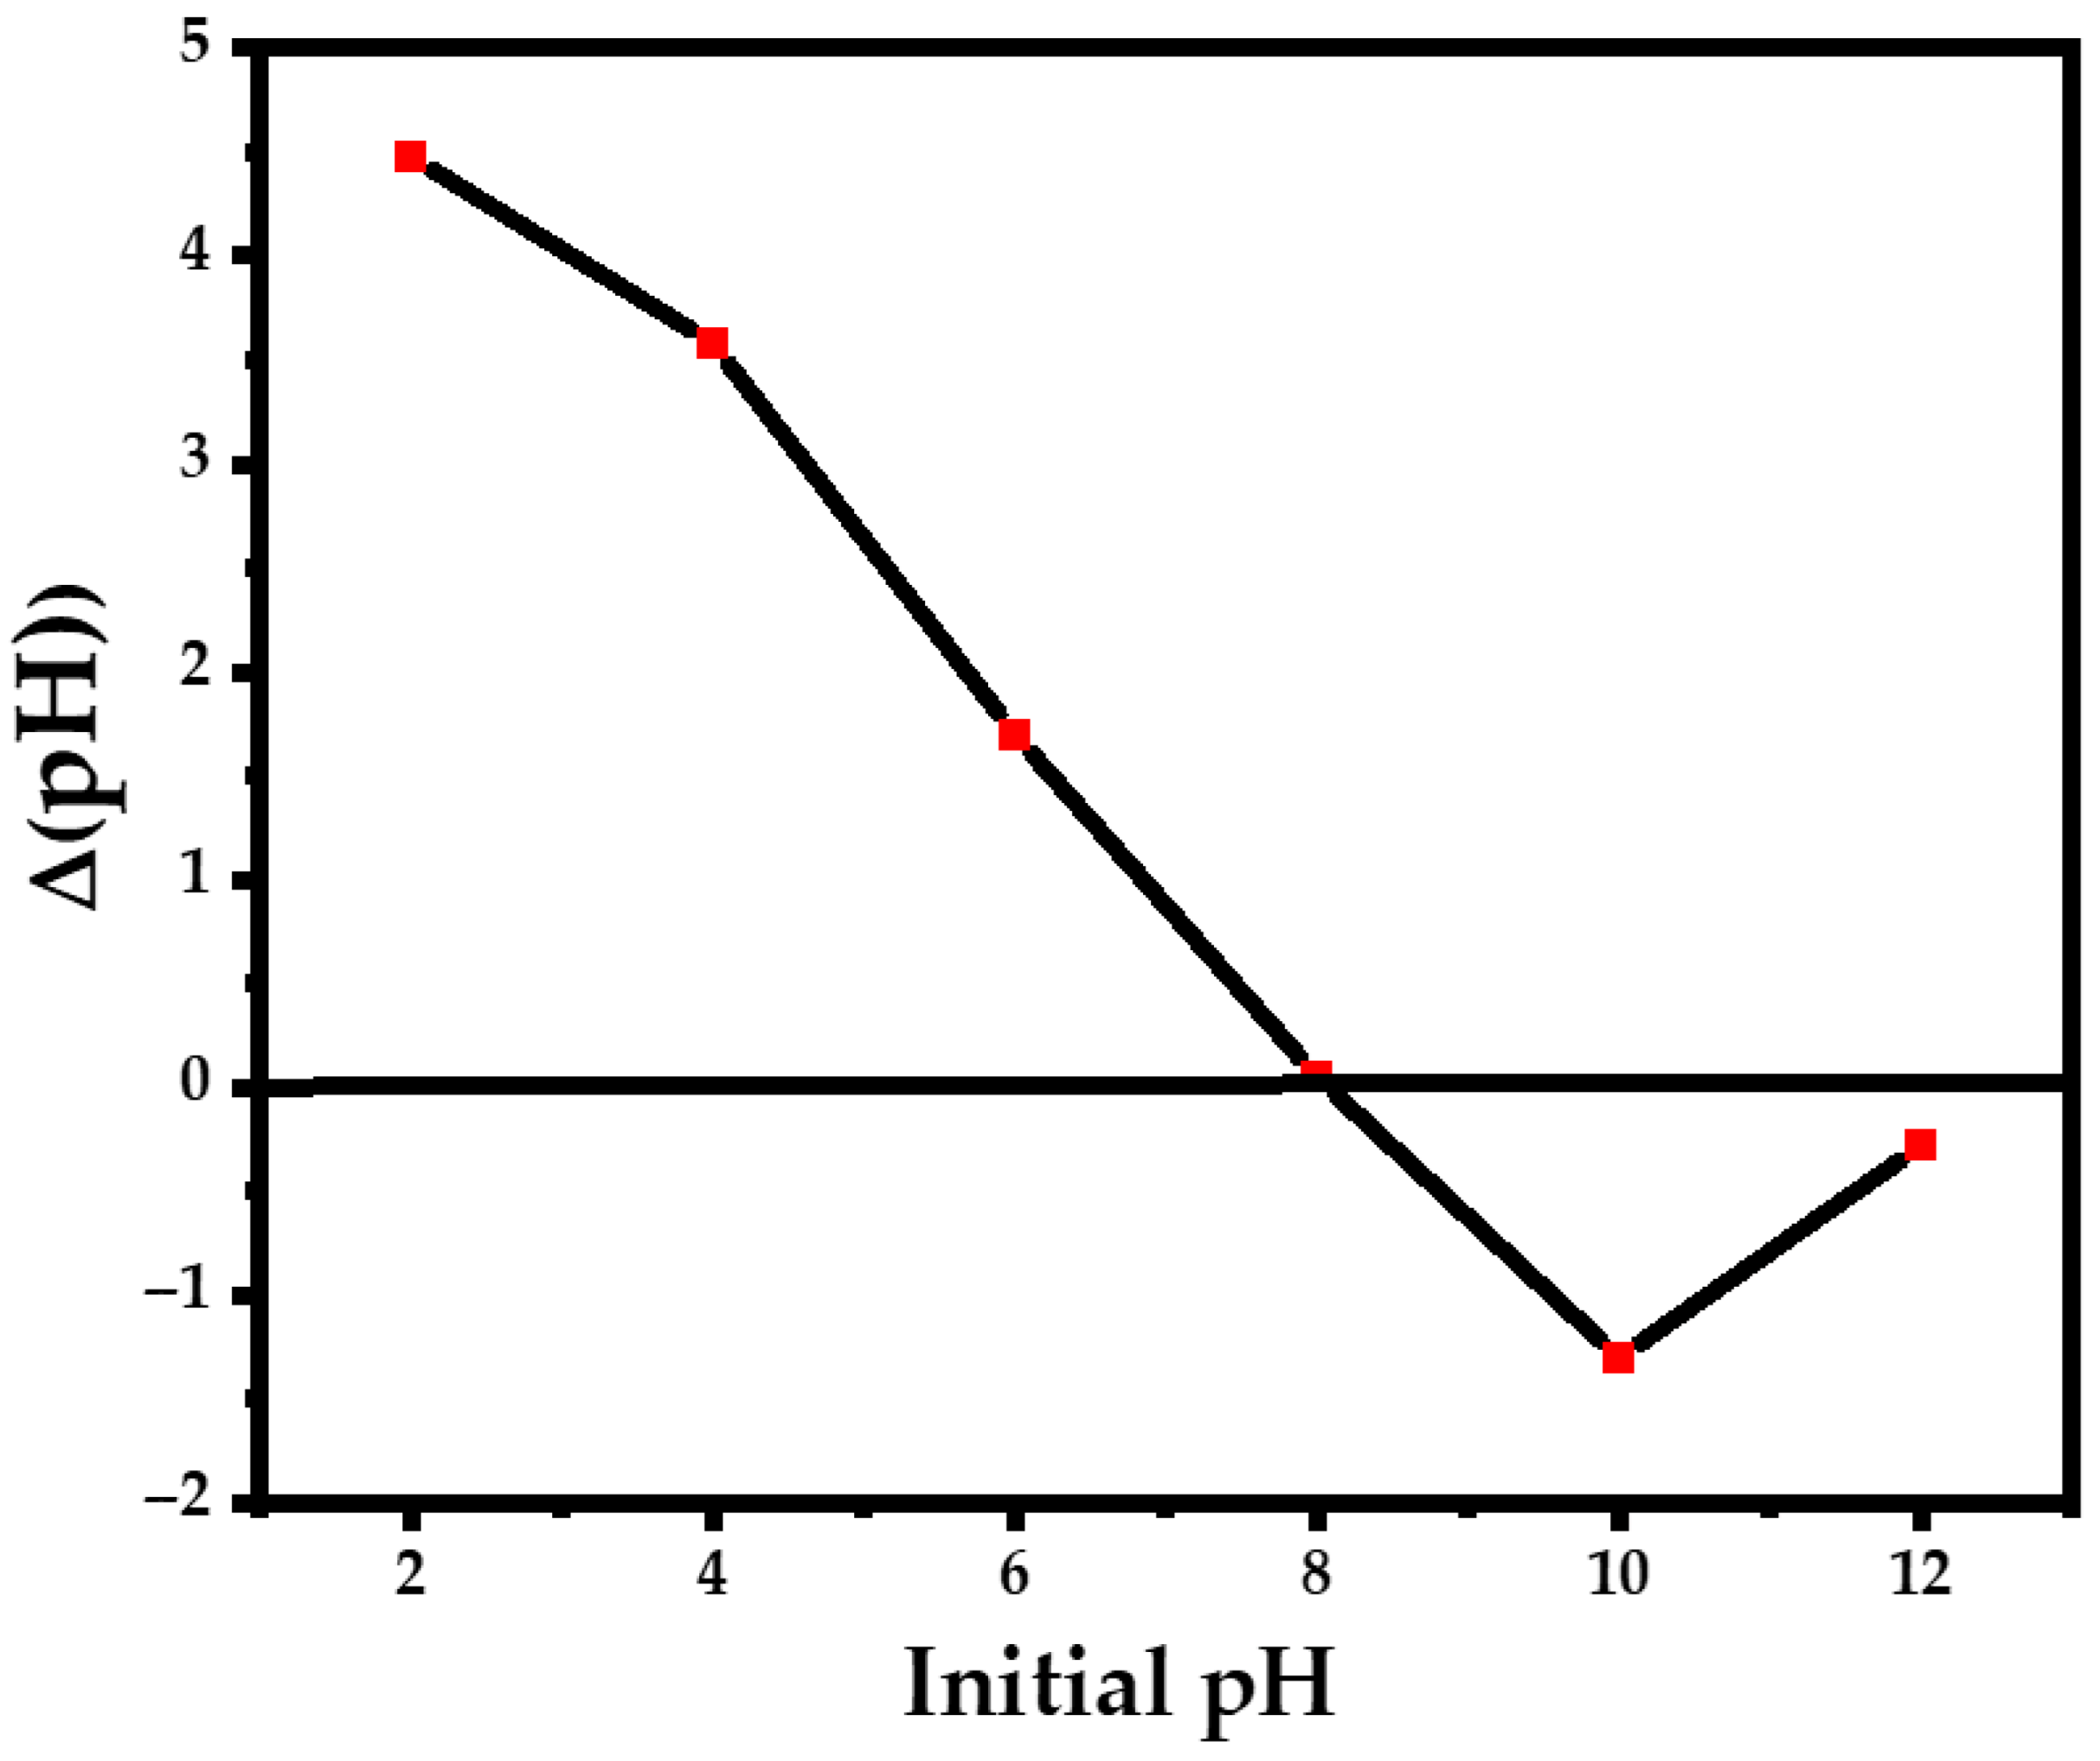
The pHzpc is the pH value for which the surface net charge of the NP is zero. This value is very important in photodegradation processes. To determine pHzpc, a suspension with 25 mg of the catalyst was added to 10 mL of NaCl (C = 0.0125 molar) with an initial pH of 2, 4, 6, 8, 10, and 12 and stirred for 24h when the final pH was measured. Next, a curve of the pH change as a function of the initial pH was plotted, and the pHzpc was determined as the value of pH in which the pH change does not occur [56]. From Figure 5, it is clear that the pHzpc = 8. The pH above pHzpc makes the surface of ZnO NPs negative while pH below pHzpc makes the ZnO NP surface positive [57,58].

3.7. Photocatalytic Activity

One of the main objectives of our research was to assess the photocatalytic potential of the green ZnO NPs in degrading MB and CV dyes. The photocatalytic activity of the NPs was tested using a binary dye-catalyst system subjected to UV irradiation. The photocatalytic degradation was performed at an initial pH of MB and CV dyes (initial concentration of 5 ppm) and 25 mg of the respective photocatalyst. Figure 6a,b show the optical absorption spectra of the binary solution shifted significantly over time. A consistent decline in peak intensity for both MB (Figure 6a) and CV (Figure 6b) was observed as a function of the irradiation time. The application of ZnO NPs resulted in remarkable degradation efficiencies of 93.54% for MB (Figure 6c) and 79% for CV (Figure 6d) after seven and two hours of photocatalytic reactions, respectively.

3.8. Kinetic of Photodegradation

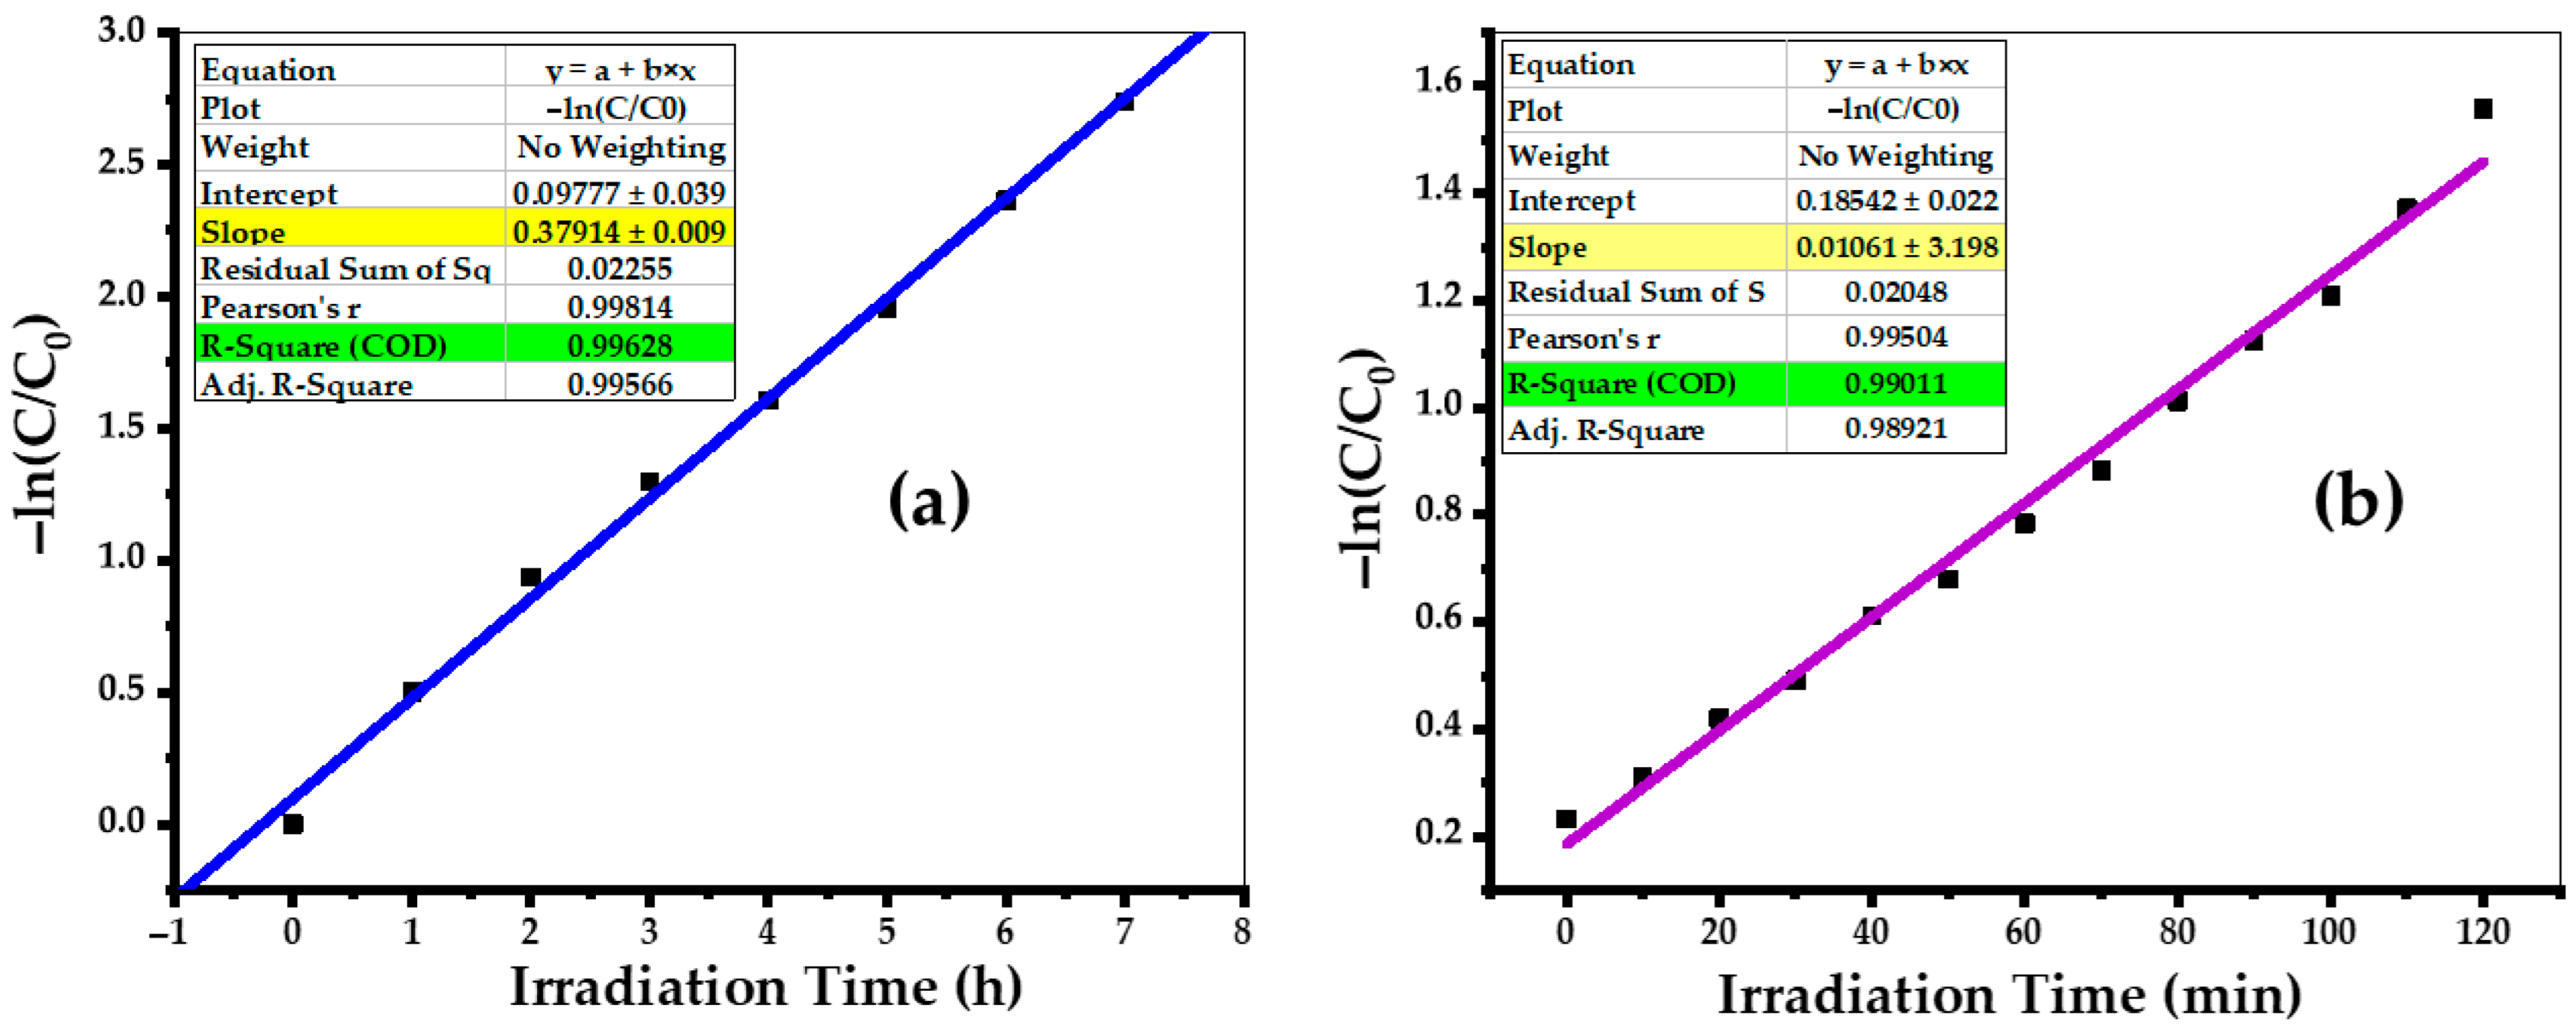
The pseudo-first-order kinetics with respect to the substrate concentration is frequently applied to evaluate photocatalytic reactions [59,60]. The kinetic studies of photocatalytic degradation of both MB and CV dyes (Figure 7a,b) show that the photocatalytic degradation process occurs via the Langmuir–Hinshelwood pseudo-first-order reaction which can be described by Equation (9) [61,62,63,64]. The pseudo-second-order model was examined in parallel with the first-order model according to Equation (10). However, the R2-values of the pseudo-first-order model were much better than those of the pseudo-second-order model. For this reason, we have not included these data in the final text to avoid potentially cluttering the manuscript.
l n C C 0 = k 1 t
1 C = 1 C 0 + k 2   t
Here C0, C, k1 and k2 represent the initial concentration of dyes, the concentration of dyes at time t, and the estimated pseudo-first- and second-order rate coefficients, respectively. The plots of ln(C/C0) for the pseudo-first-order are given in Figure 7a,b. The rate constants and the corresponding coefficients (R2) were calculated from the plots. From the results obtained, the pseudo-first-order equation describes well the experimental data as confirmed by the obtained parameters [65]. The MB and CV photodegradation rate constants of 0.37914 h−1 and 0.01061 min−1 have accomplished under UV light respectively.

3.9. Optimization of Photocatalytic Degradation Parameter

3.9.1. pH Optimization

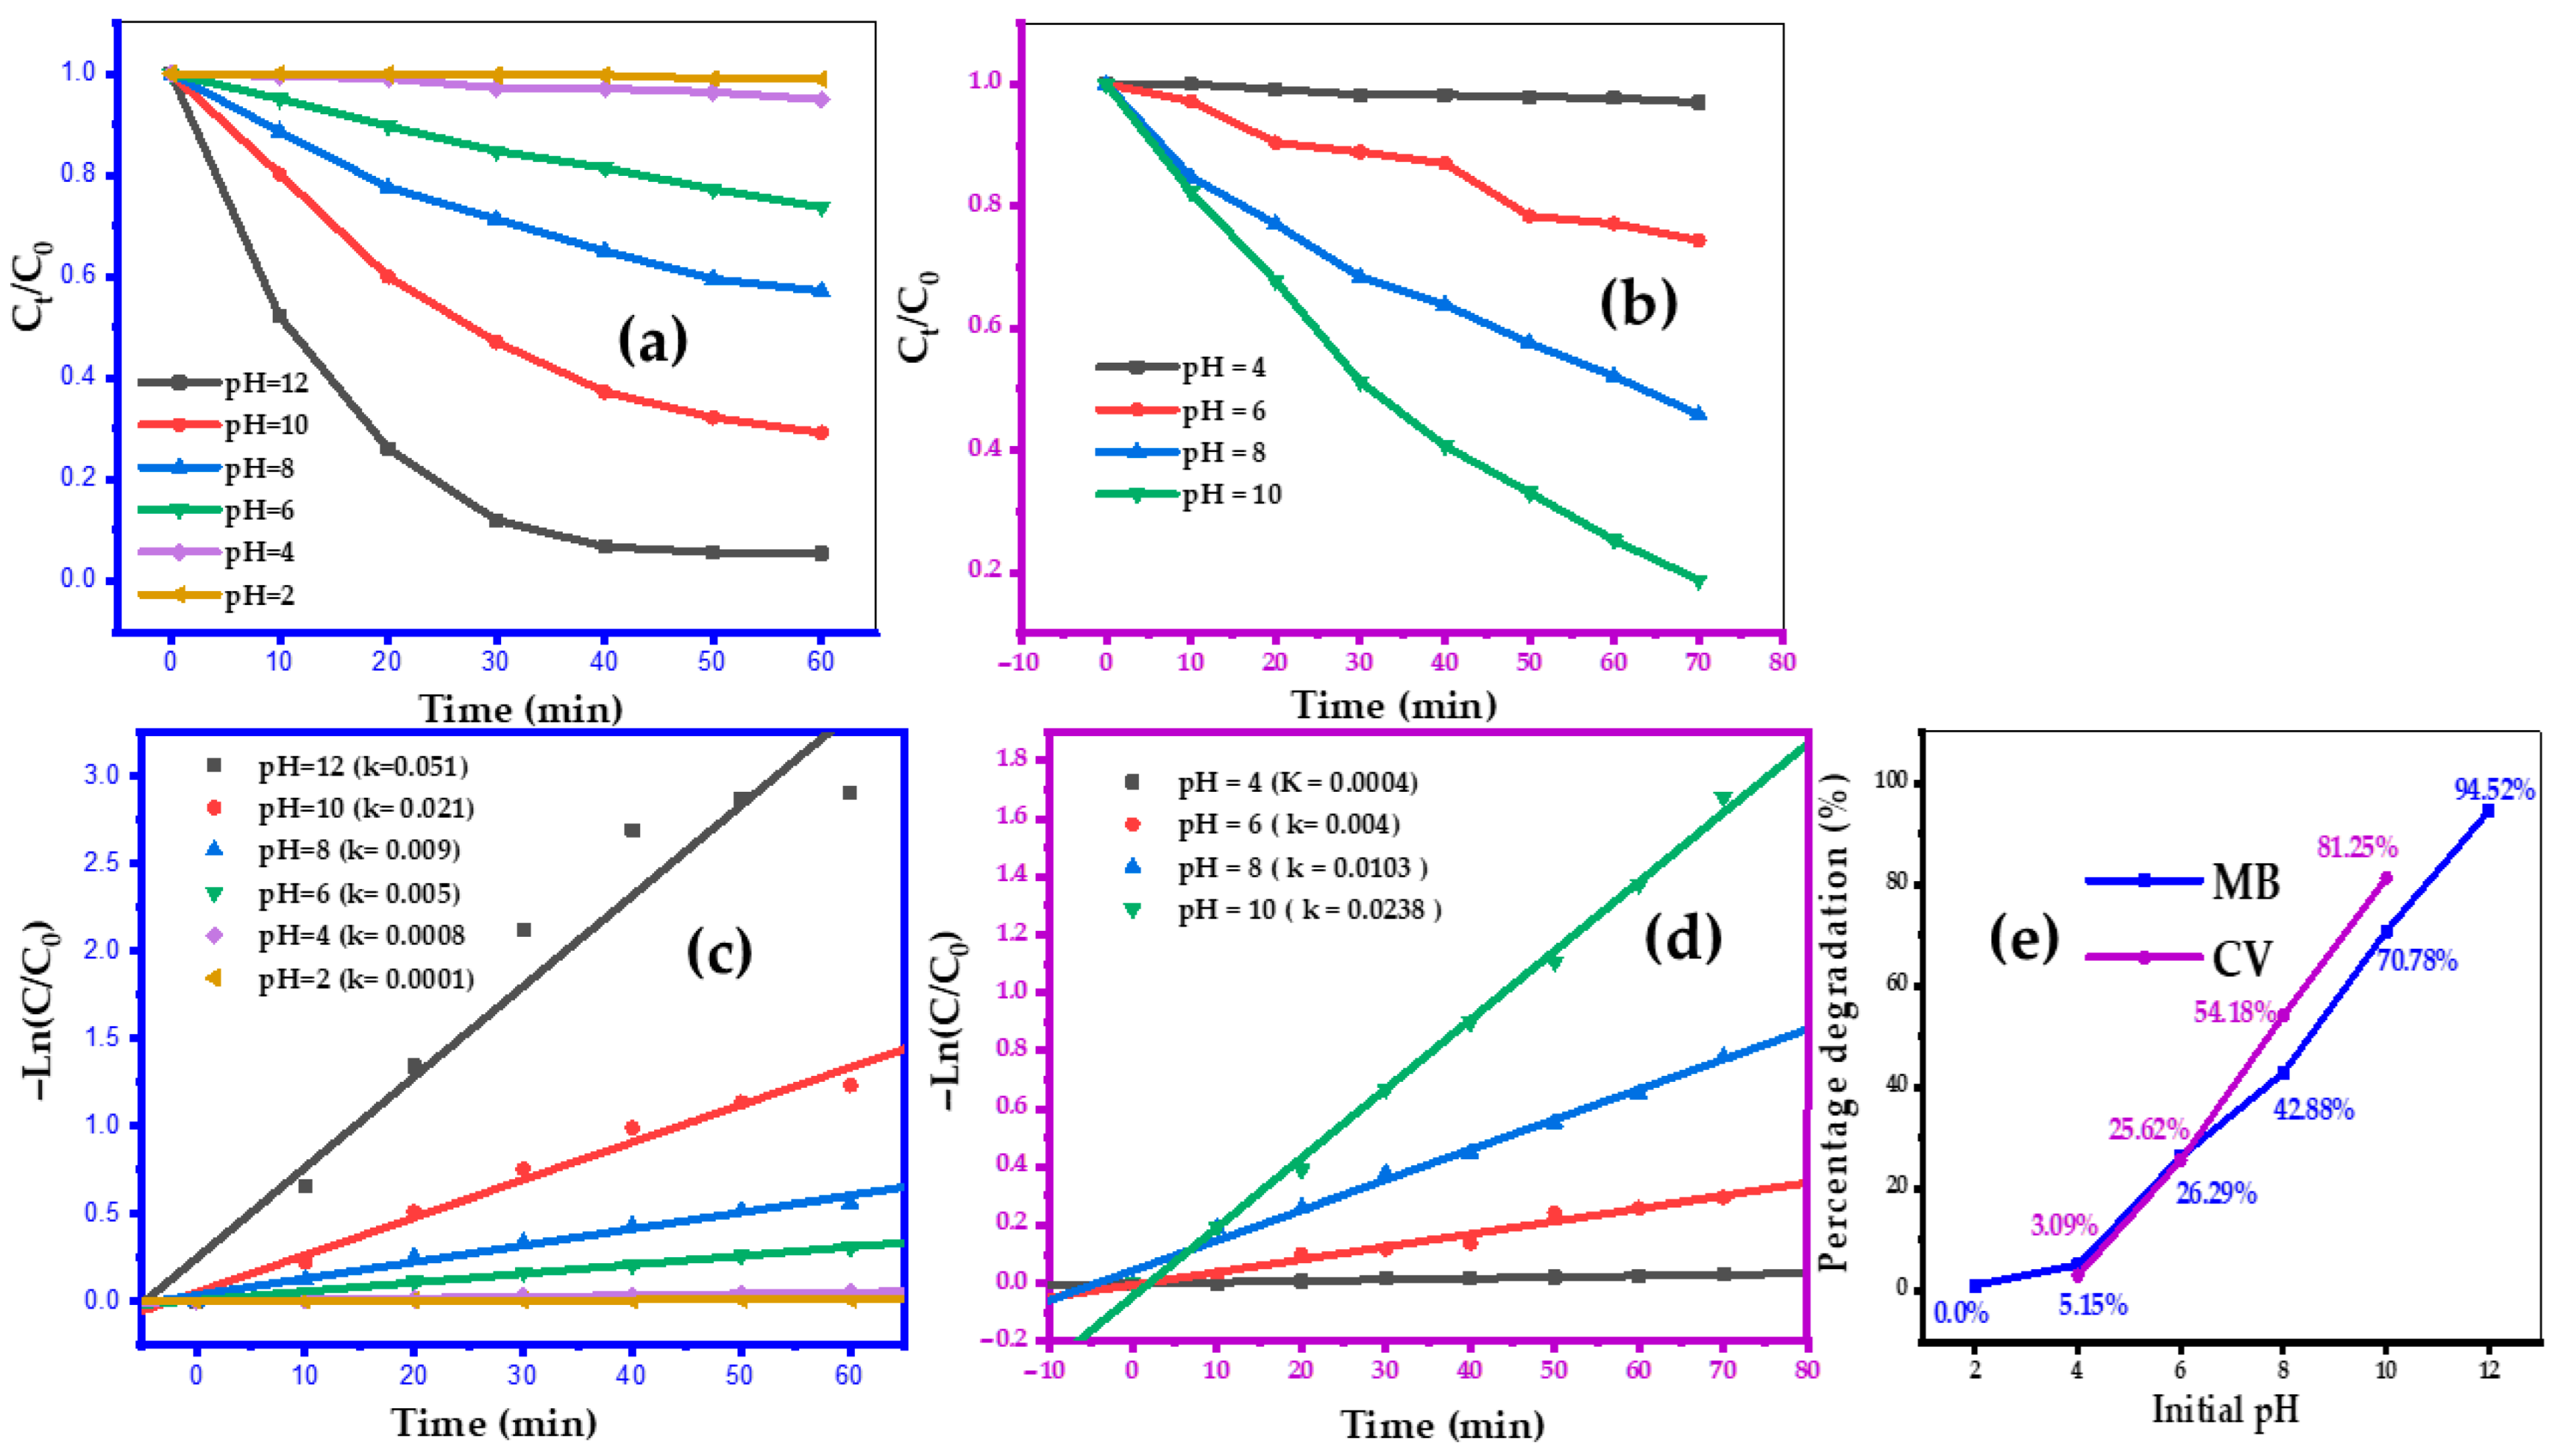
The influence of the initial pH was evaluated within a pH range from 2 to 12 and 4 to 10 for MB and CV dyes. A 5 ppm dye concentration and 25 mg of the ZnO catalyst dosage were kept constant and the mixture was exposed to UV light (48 W) (Figure 8a,b). It is clear that the dye removal efficiency increases with an increase in the initial pH of MB (Figure 8). The photocatalytic efficiency of MB and CV dyes reached ~94% and ~81% with pH = 12 and pH = 10 after 60 min and 70 min, respectively, against only ~1% and 3% degradation in a weakly acidic medium at pH = 2 and pH = 4. As a result, their first-order rate constant increased with increasing pH values for both dyes, reaching a maximum of 0.051 min−1 and 0.0238 min−1 for MB and CV dyes, respectively, at pH = 12 and pH = 10 (Figure 8c,d). The pHzpc for the ZnO NPs is 8 (Figure 5). The pH above pHzpc makes the surface of ZnO negative and while pH below pHzpc makes the surface of ZnO positive [65,66]. As demonstrated in Figure 8c,d the highest rate of MB and CV degradation on the ZnO NPs occurs at pH 12 and 10, respectively. This can be explained by an electrostatic attraction of cationic, positively charged dyes to negatively charged NP surfaces. Additionally, a higher amount of OH· radical ions are absorbed on the photocatalyst surface at high pH values, further assisting the efficiency of the photodegradation process [67].

3.9.2. Optimization of the Catalyst Dosage

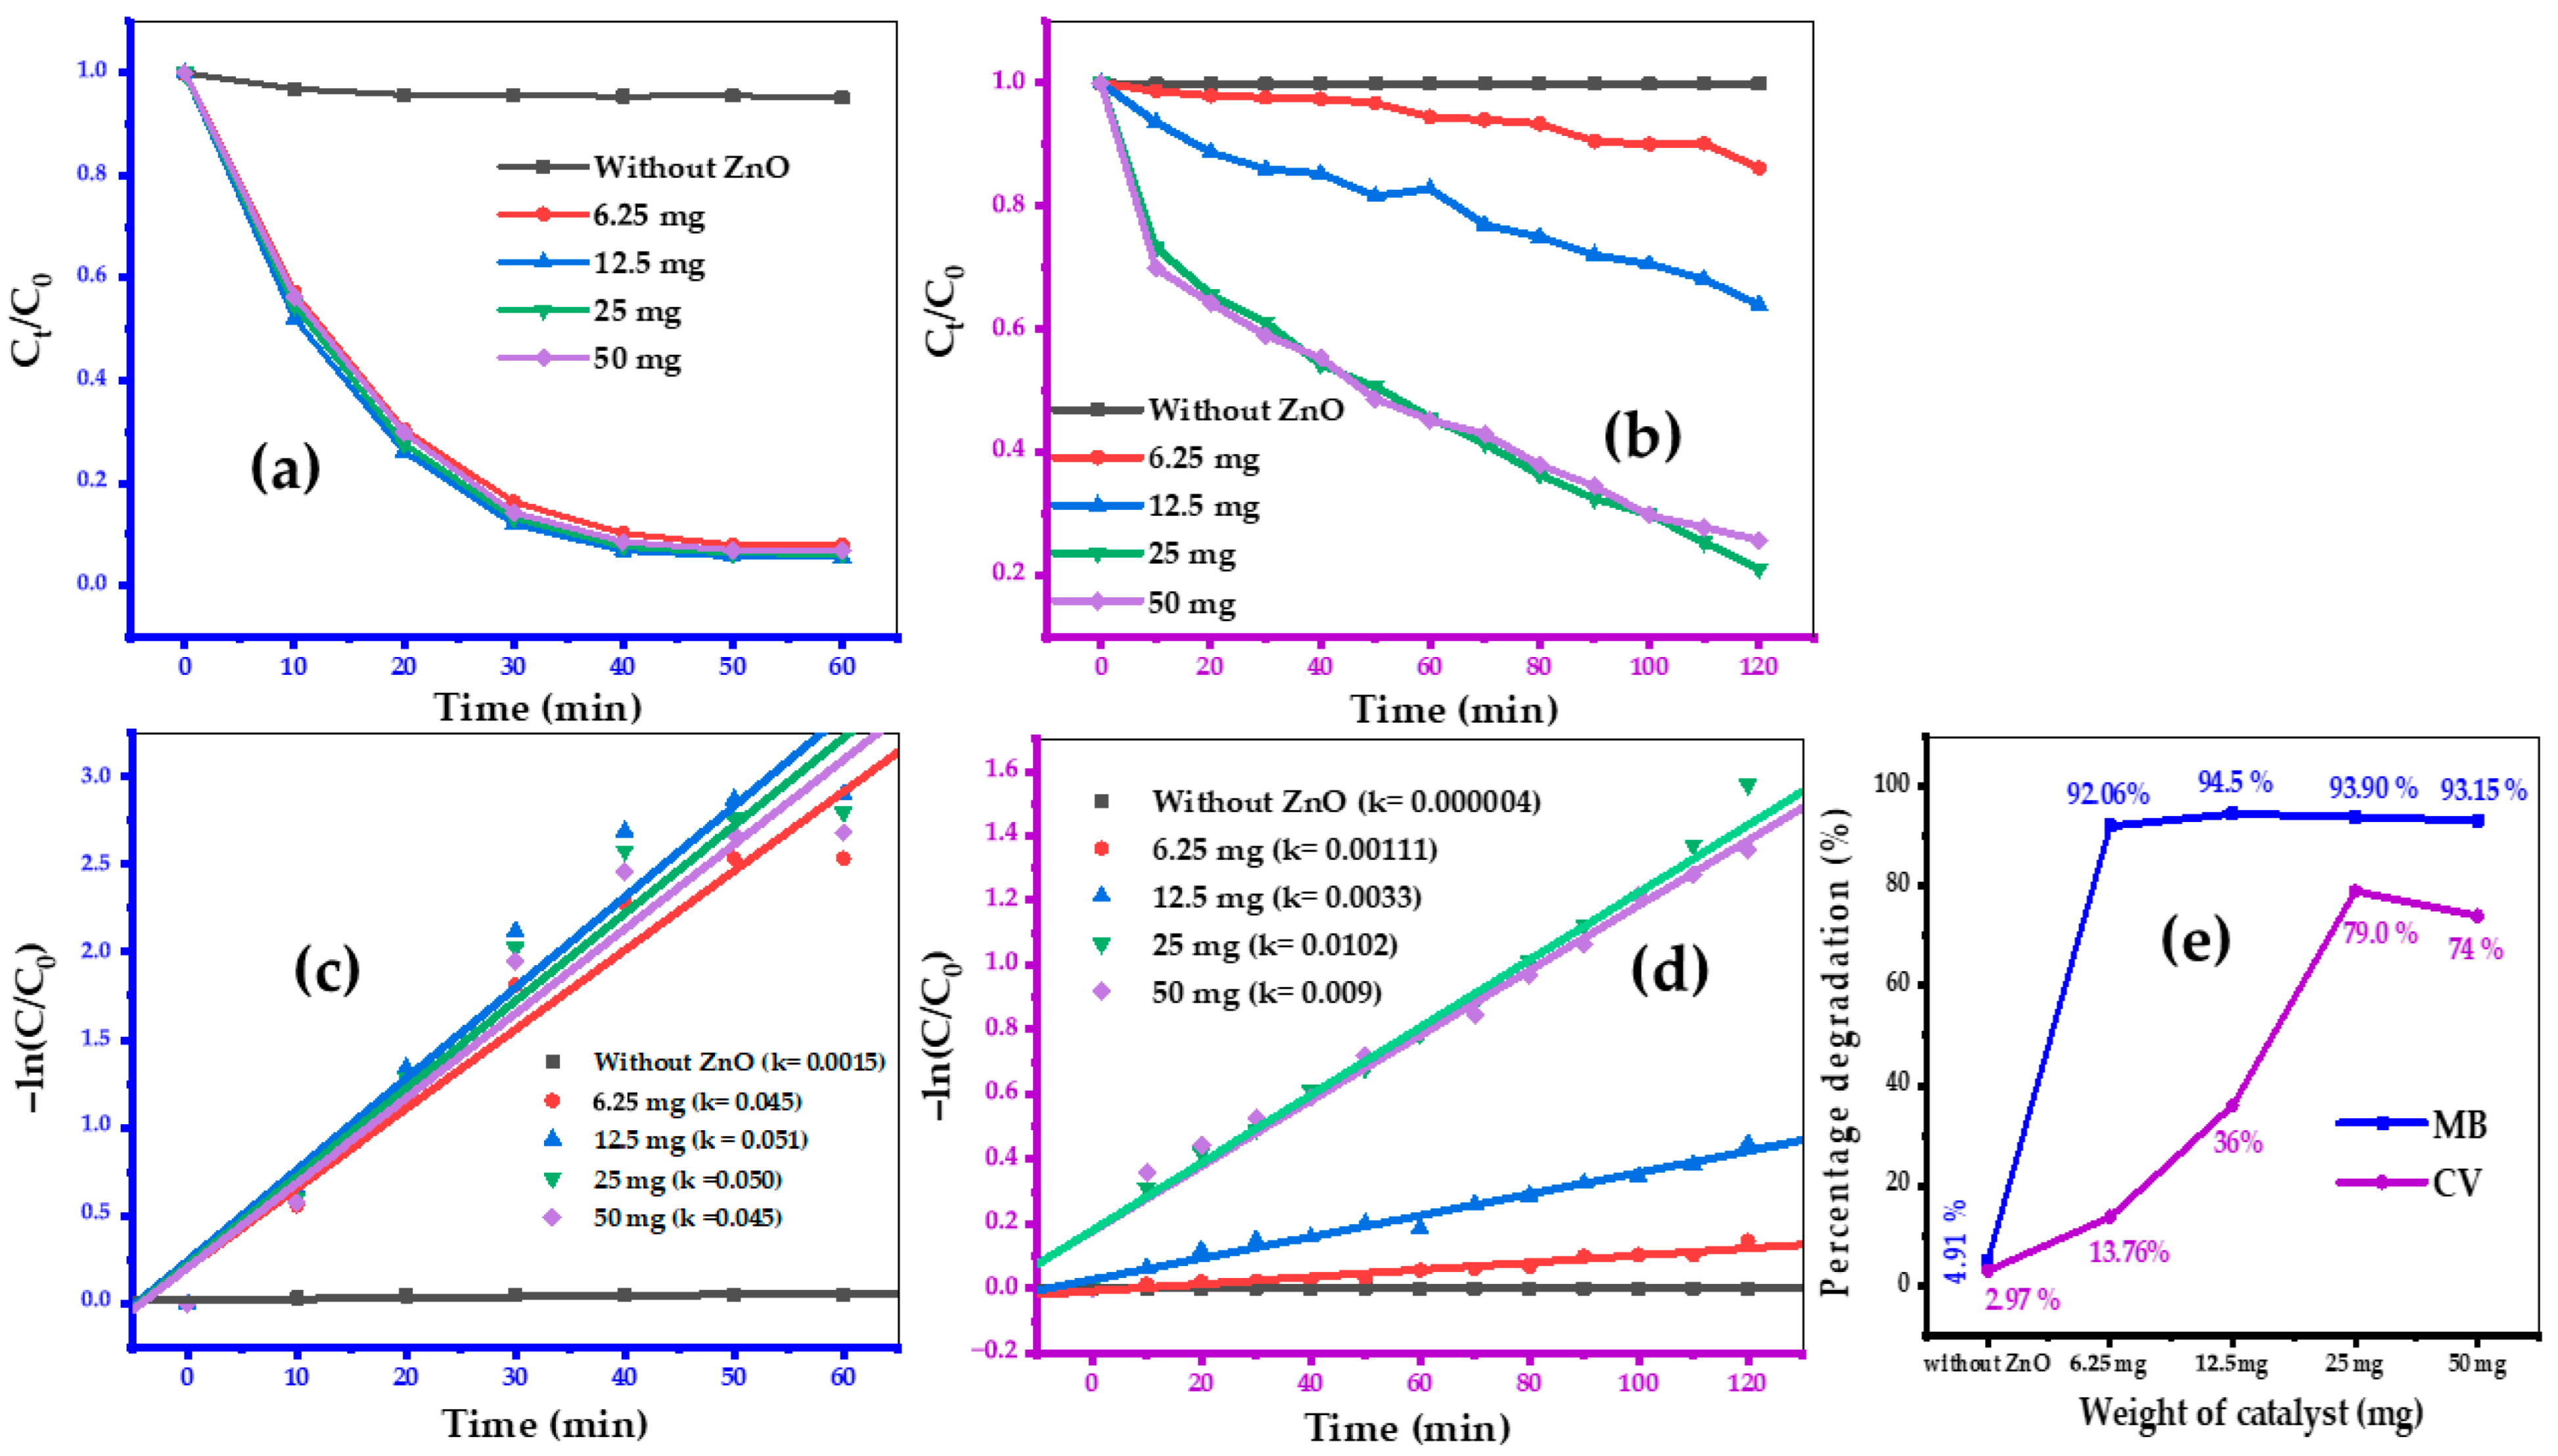
The optimal photocatalyst dosage for MB and CV dyes elimination was assessed by altering the quantity of ZnO NPs while maintaining constant dye concentrations and reaction pH. The results show that the efficacies of MB and CV dyes removal are impacted by the dosage of the photocatalyst (Figure 9a,b). When the photocatalyst dosage increased from 6.25 mg to 12.5 mg, ~92% and ~94% degradation of MB was detected, respectively. In parallel, the degradation of the CV dye increased from 13.76% to 79% when the ZnO NPs loading increased from 6.25 mg to 25 mg (Figure 9e). This enhancement in the degradation based on the amount of catalyst dosage is probably due to the availability of highly reactive surface area, which in turn increases the number of active sites as the ZnO NPs concentration increases [67,68]. Notwithstanding this, further increase in the dosage of photocatalyst from 25 mg to 50 mg led to a decrease in the photodegradation efficiency for both dyes. When the photocatalyst dosage exceeds a critical range when there will not be enough room for the NPs to disperse in the solution and the particles tend to stick to each other and become aggregated. In this situation most of the photocatalyst active sites will become blocked and unavailable and the degradation efficiency of the system is expected to decrease [69]. As illustrated in Figure 9e MB and CV dyes show the optimum photodegradation performance at photocatalyst dosages of 12.5 mg and 25 mg, respectively. Therefore, 12.5 mg and 25 mg were chosen as the optimal photocatalyst dosage and were utilized in subsequent experiments.
In addition, the photocatalytic degradation kinetics were analyzed using a pseudo-first-order kinetic model and the reaction rate constants (k) were calculated for each ZnO NPs dosage. The kinetics data (Figure 9c,d) revealed a similar trend to that of the photocatalytic degradation efficiencies. The k value increases from 0.045 min−1 to 0.051 min−1 when ZnO dosage is raised from 6.25 mg to 12.5 mg for MB and 0.001 min−1 to 0.0102 min−1 when photocatalyst dosage is increased from 6.25 mg to 25 mg for CV, confirming enhanced photocatalytic degradation rate at increased ZnO NPs dosages. This increase in the reaction kinetics reflects a larger quantity of active catalytic sites and higher ROS generation at optimal photocatalyst dosage. At 25 mg and 50 mg of ZnO NPs, however, the reaction rate constant for MB and CV declined from 0.050 min−1 to 0.045 min−1 and 0.0102 min−1 to 0.009 min−1 respectively, reinforcing the observation that excessive ZnO NPs concentrations are deleterious for its photocatalytic activity.

3.9.3. Optimization of the Initial Dye Concentration

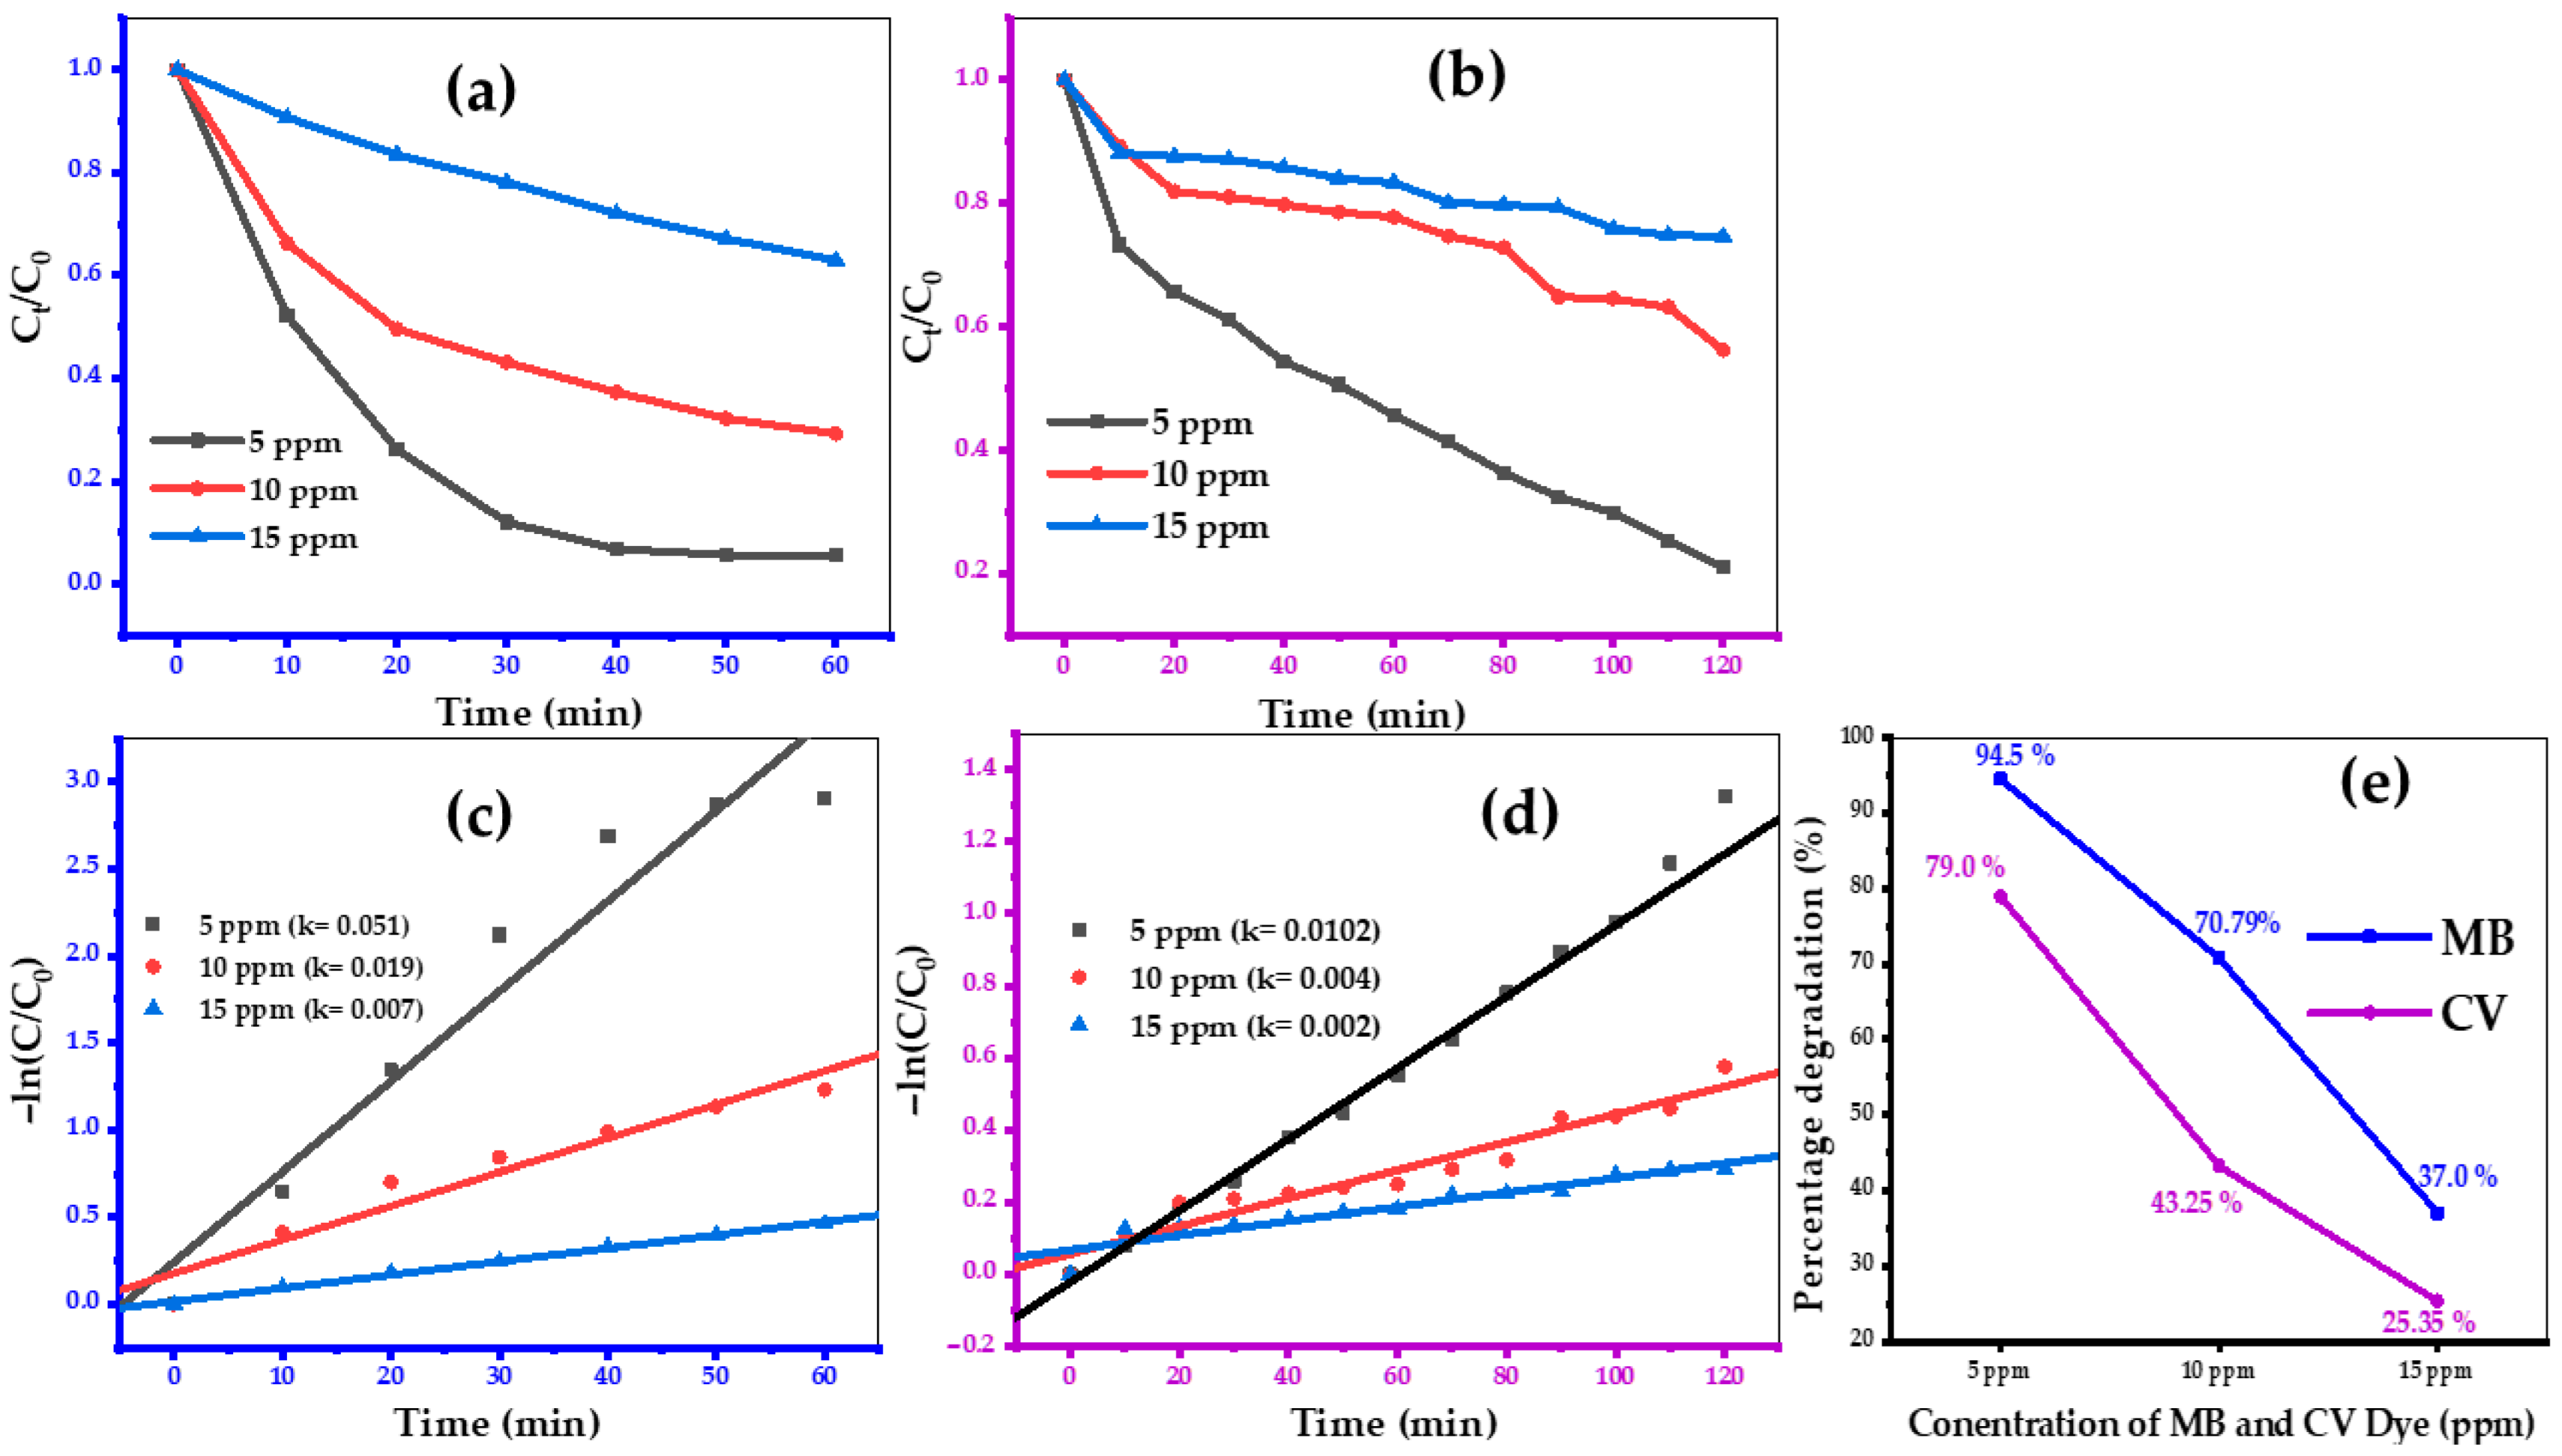
The dye concentration impact on photocatalytic activity is very important for practical applications. Thus, the photocatalytic activity of the biosynthesized ZnO NPs for degradation of MB and CV dyes was investigated by changing the dye concentrations from 5.0 ppm to 15 ppm while maintaining the photocatalyst amount and reaction pH constants (12.5 mg at pH 12 for MB, 25 mg at initial pH of CV) and using UV light irradiation (48 W) (Figure 10a,b). The experimental results reveal that the photocatalytic efficiency of the ZnO NPs is inversely proportional to the concentration of both dyes under similar conditions and maximum catalytic efficacy corresponds to a minimum dye concentration (5 ppm). When the dye concentrations were increased from 5 to 15 ppm, the dye photodegradation fell from 94.5% to 37.0% and 79% to 25.35%, respectively, for MB and CV (Figure 10e). This decrease is presumably related to lower light absorption on the ZnO photocatalyst surface caused by increased dye concentration in solution, which in turn reduces the production of ROS [70]. Thus, a 5 ppm dye concentration has been chosen in the following optimization experiments for both dyes.
Photocatalytic degradation kinetics were analyzed (Figure 10c,d) and the trend in rate constant closely follows the degradation efficiencies: at 5 ppm concentration of dyes, reaction rate constants were highest (0.051 min−1 for MB and 0.0102 min−1 for CV), reflecting efficient photocatalytic degradation due to the high amounts of ROS and minimal light attenuation. At 10 ppm dye concentrations, rate constants decreased (0.019 min−1 for MB and 0.004 min−1 for CV), indicating a slight reduction in degradation rate, whereas at 15 ppm dye concentrations, rate constants dropped sharply (0.007 min−1 for MB and 0.002 min−1 for CV). These results highlight the importance of matching the initial dye concentration with the catalyst dosage to maximize the photocatalytic activity. Excessive dye concentrations not only limit the availability of ROS but also impede light penetration, which ultimately hinders the overall photocatalytic reaction. Photocatalytic degradation at varying dye concentrations can be understood as a competition between the availability of ROS and the quantity of dye molecules. At low concentrations of dyes, ZnO NPs photogenerated ROS are abundant, enabling rapid and efficient degradation of the dye molecules. However, as the dye concentrations increase, ROS concentration becomes suboptimum, leading to a decrease in the photocatalytic degradation efficiencies and reaction rates. Dye concentration of 5 ppm represents a point of equilibrium at which the ROS production matches the dye molecule concentration. Beyond this concentration, the degradation process becomes diffusion- and light-limited, further underscoring a need for optimization for particular applications [71].

3.9.4. Intensity of Light Optimization

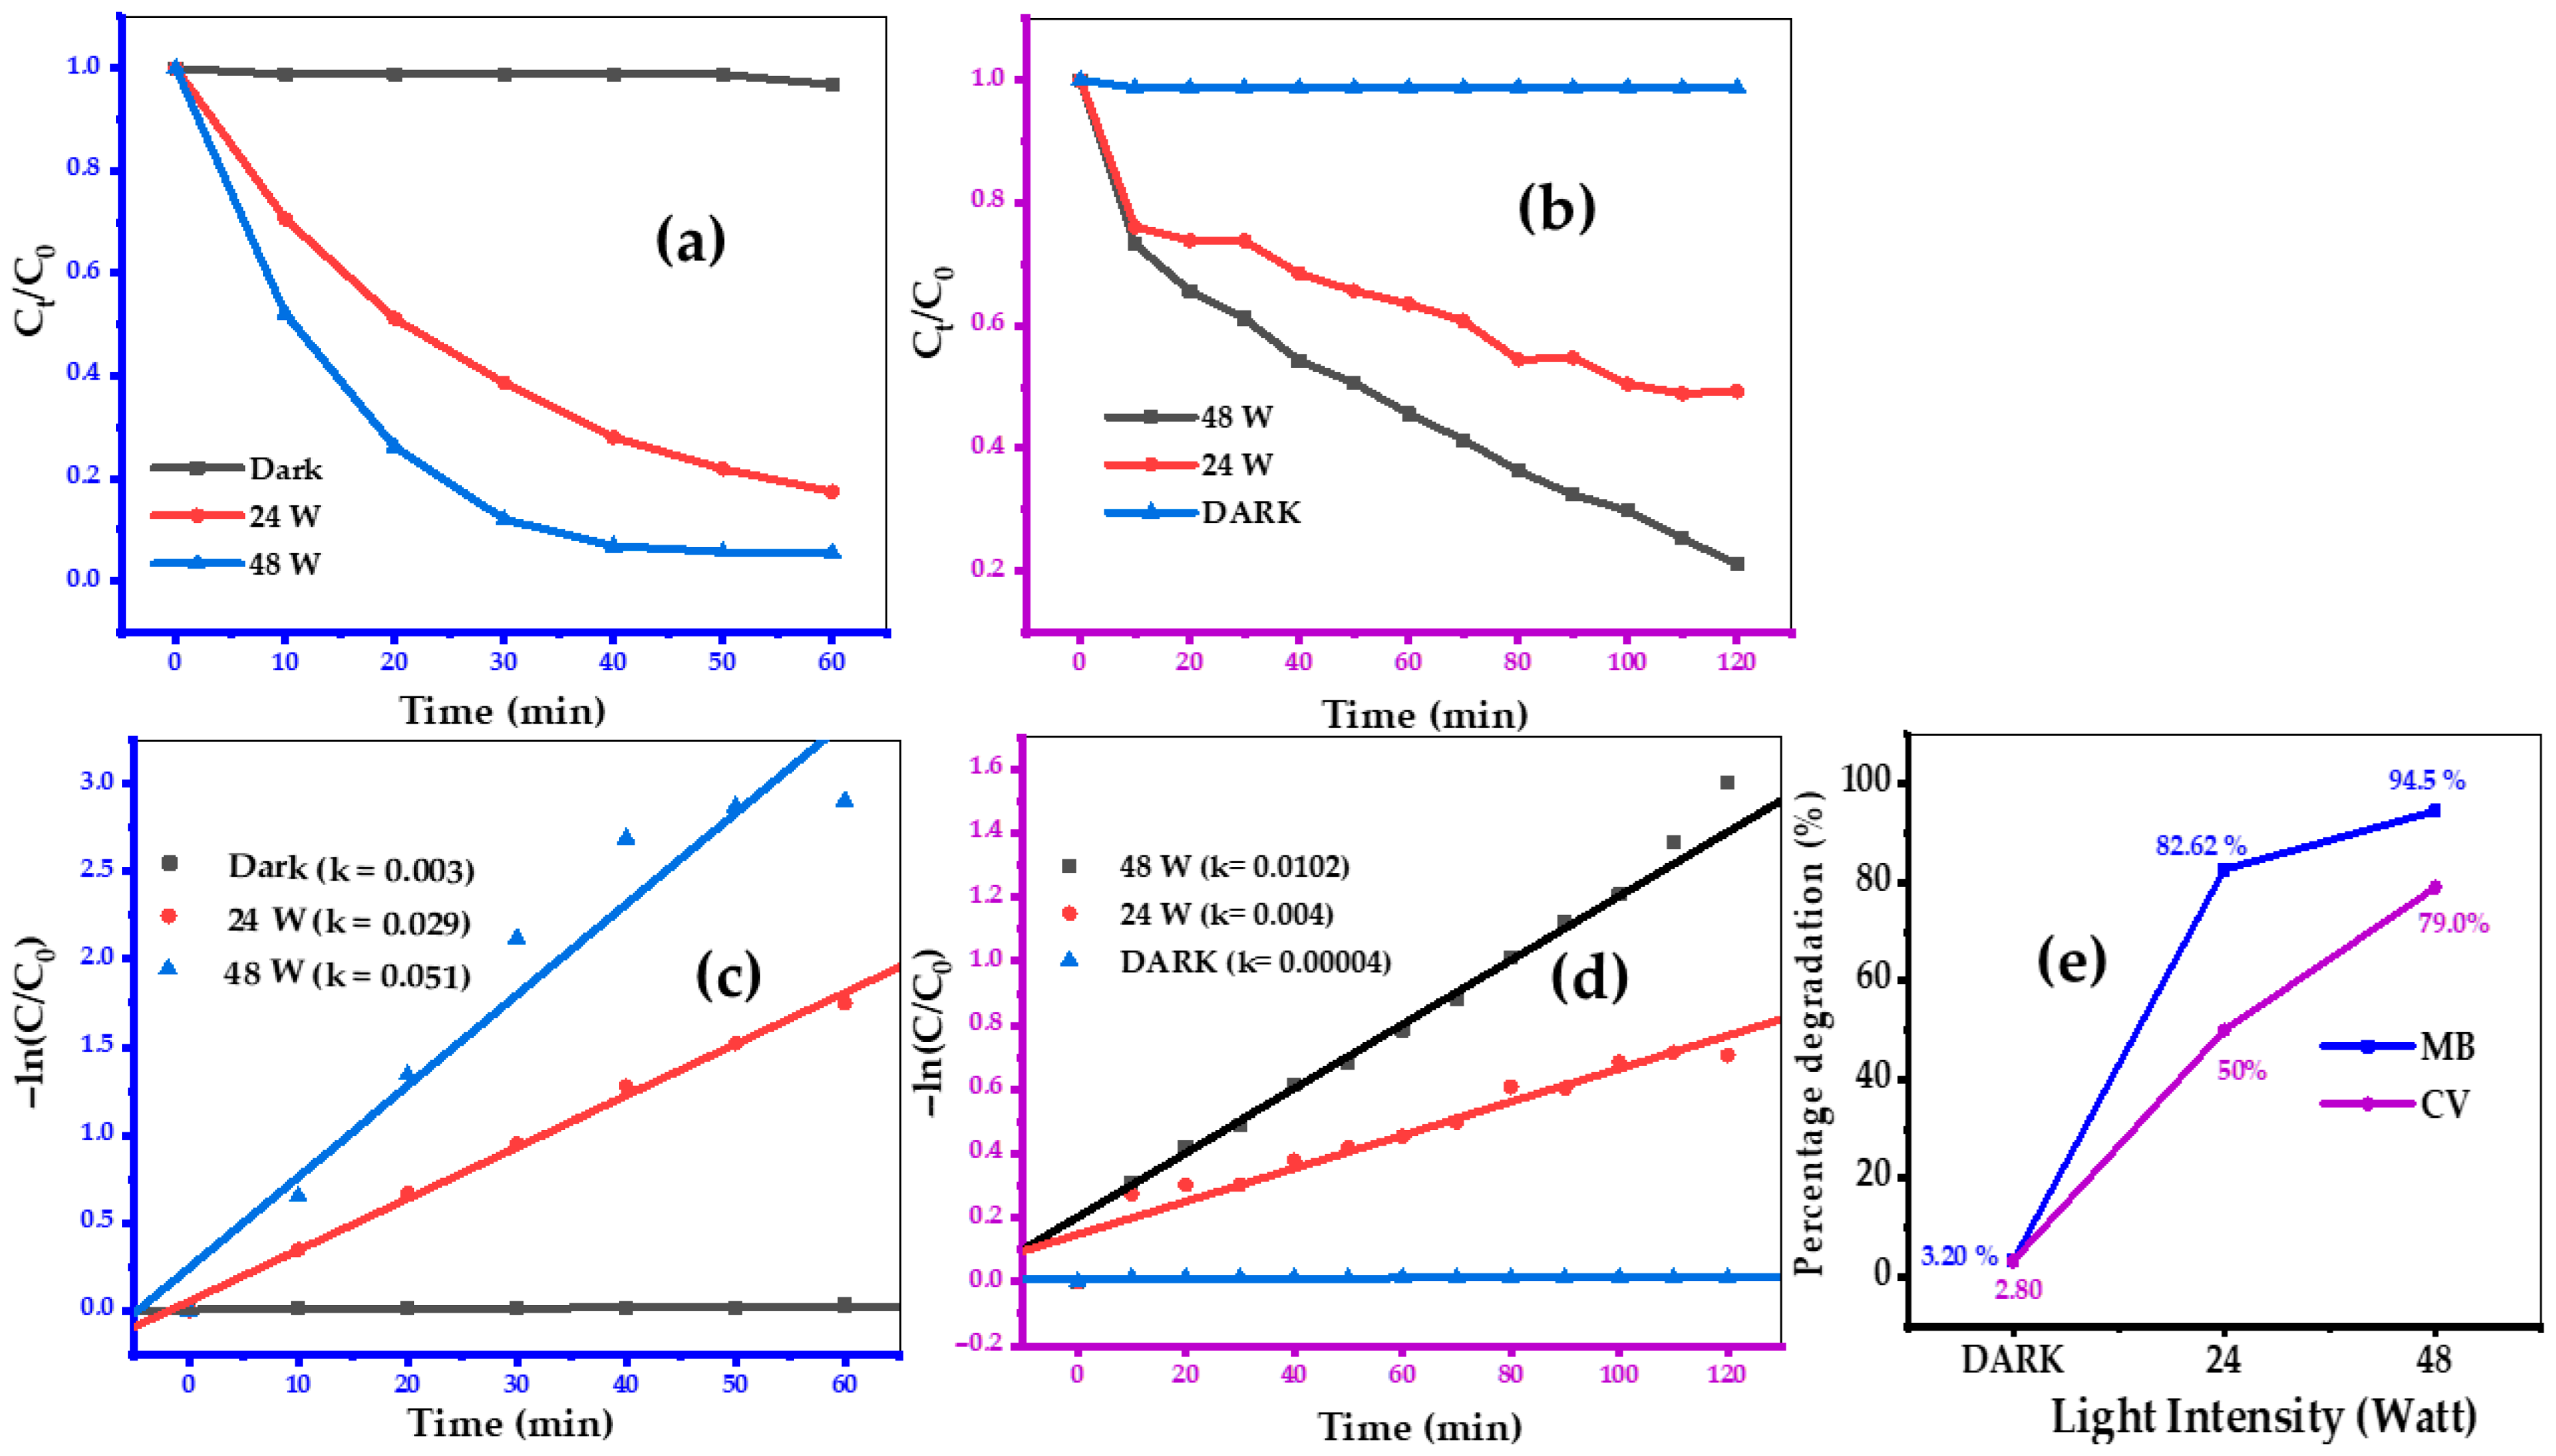
To investigate the influence of UV light intensity levels on the ZnO NP catalyzed photodegradation of MB and CV, the UV lamps with a total power of 34 W and 48 W were employed while the initial MB and CV dyes concentration, catalyst loading and pH were set to 5 ppm: 25 mg for CV, 12.5 mg for MB and (12 for MB and initial pH of CV, respectively. The experiments were conducted under light illumination and in the absence of light (Figure 11a,b). It is clear that the photodegradation efficiency is impacted by the light intensity. Indeed, when UV light intensity was increased from 24 W to 48 W, both the rate and percentage of dye degradations increased from 0.029 min−1 to 0.051 min−1 and 82.62% to 94.52%, respectively, for MB. In parallel, the same parameters grow from 0.004 min−1 to 0.0102 min−1 and 50% to 79% for CV (Figure 11c–e). Since the ZnO NPs suspension is stirred in solution, the light intensity directly affects the light intensity, which illuminates the surface of the catalyst. The increase in degradation rates and efficiencies can be explained by the higher generation of ROS on the ZnO NP surface under stronger light illumination. As expected, in the dark, the ZnO NPs were unable to efficiently eliminate the dyes (Figure 11) [72,73].

3.10. Identification of Main Reaction Oxygen Species

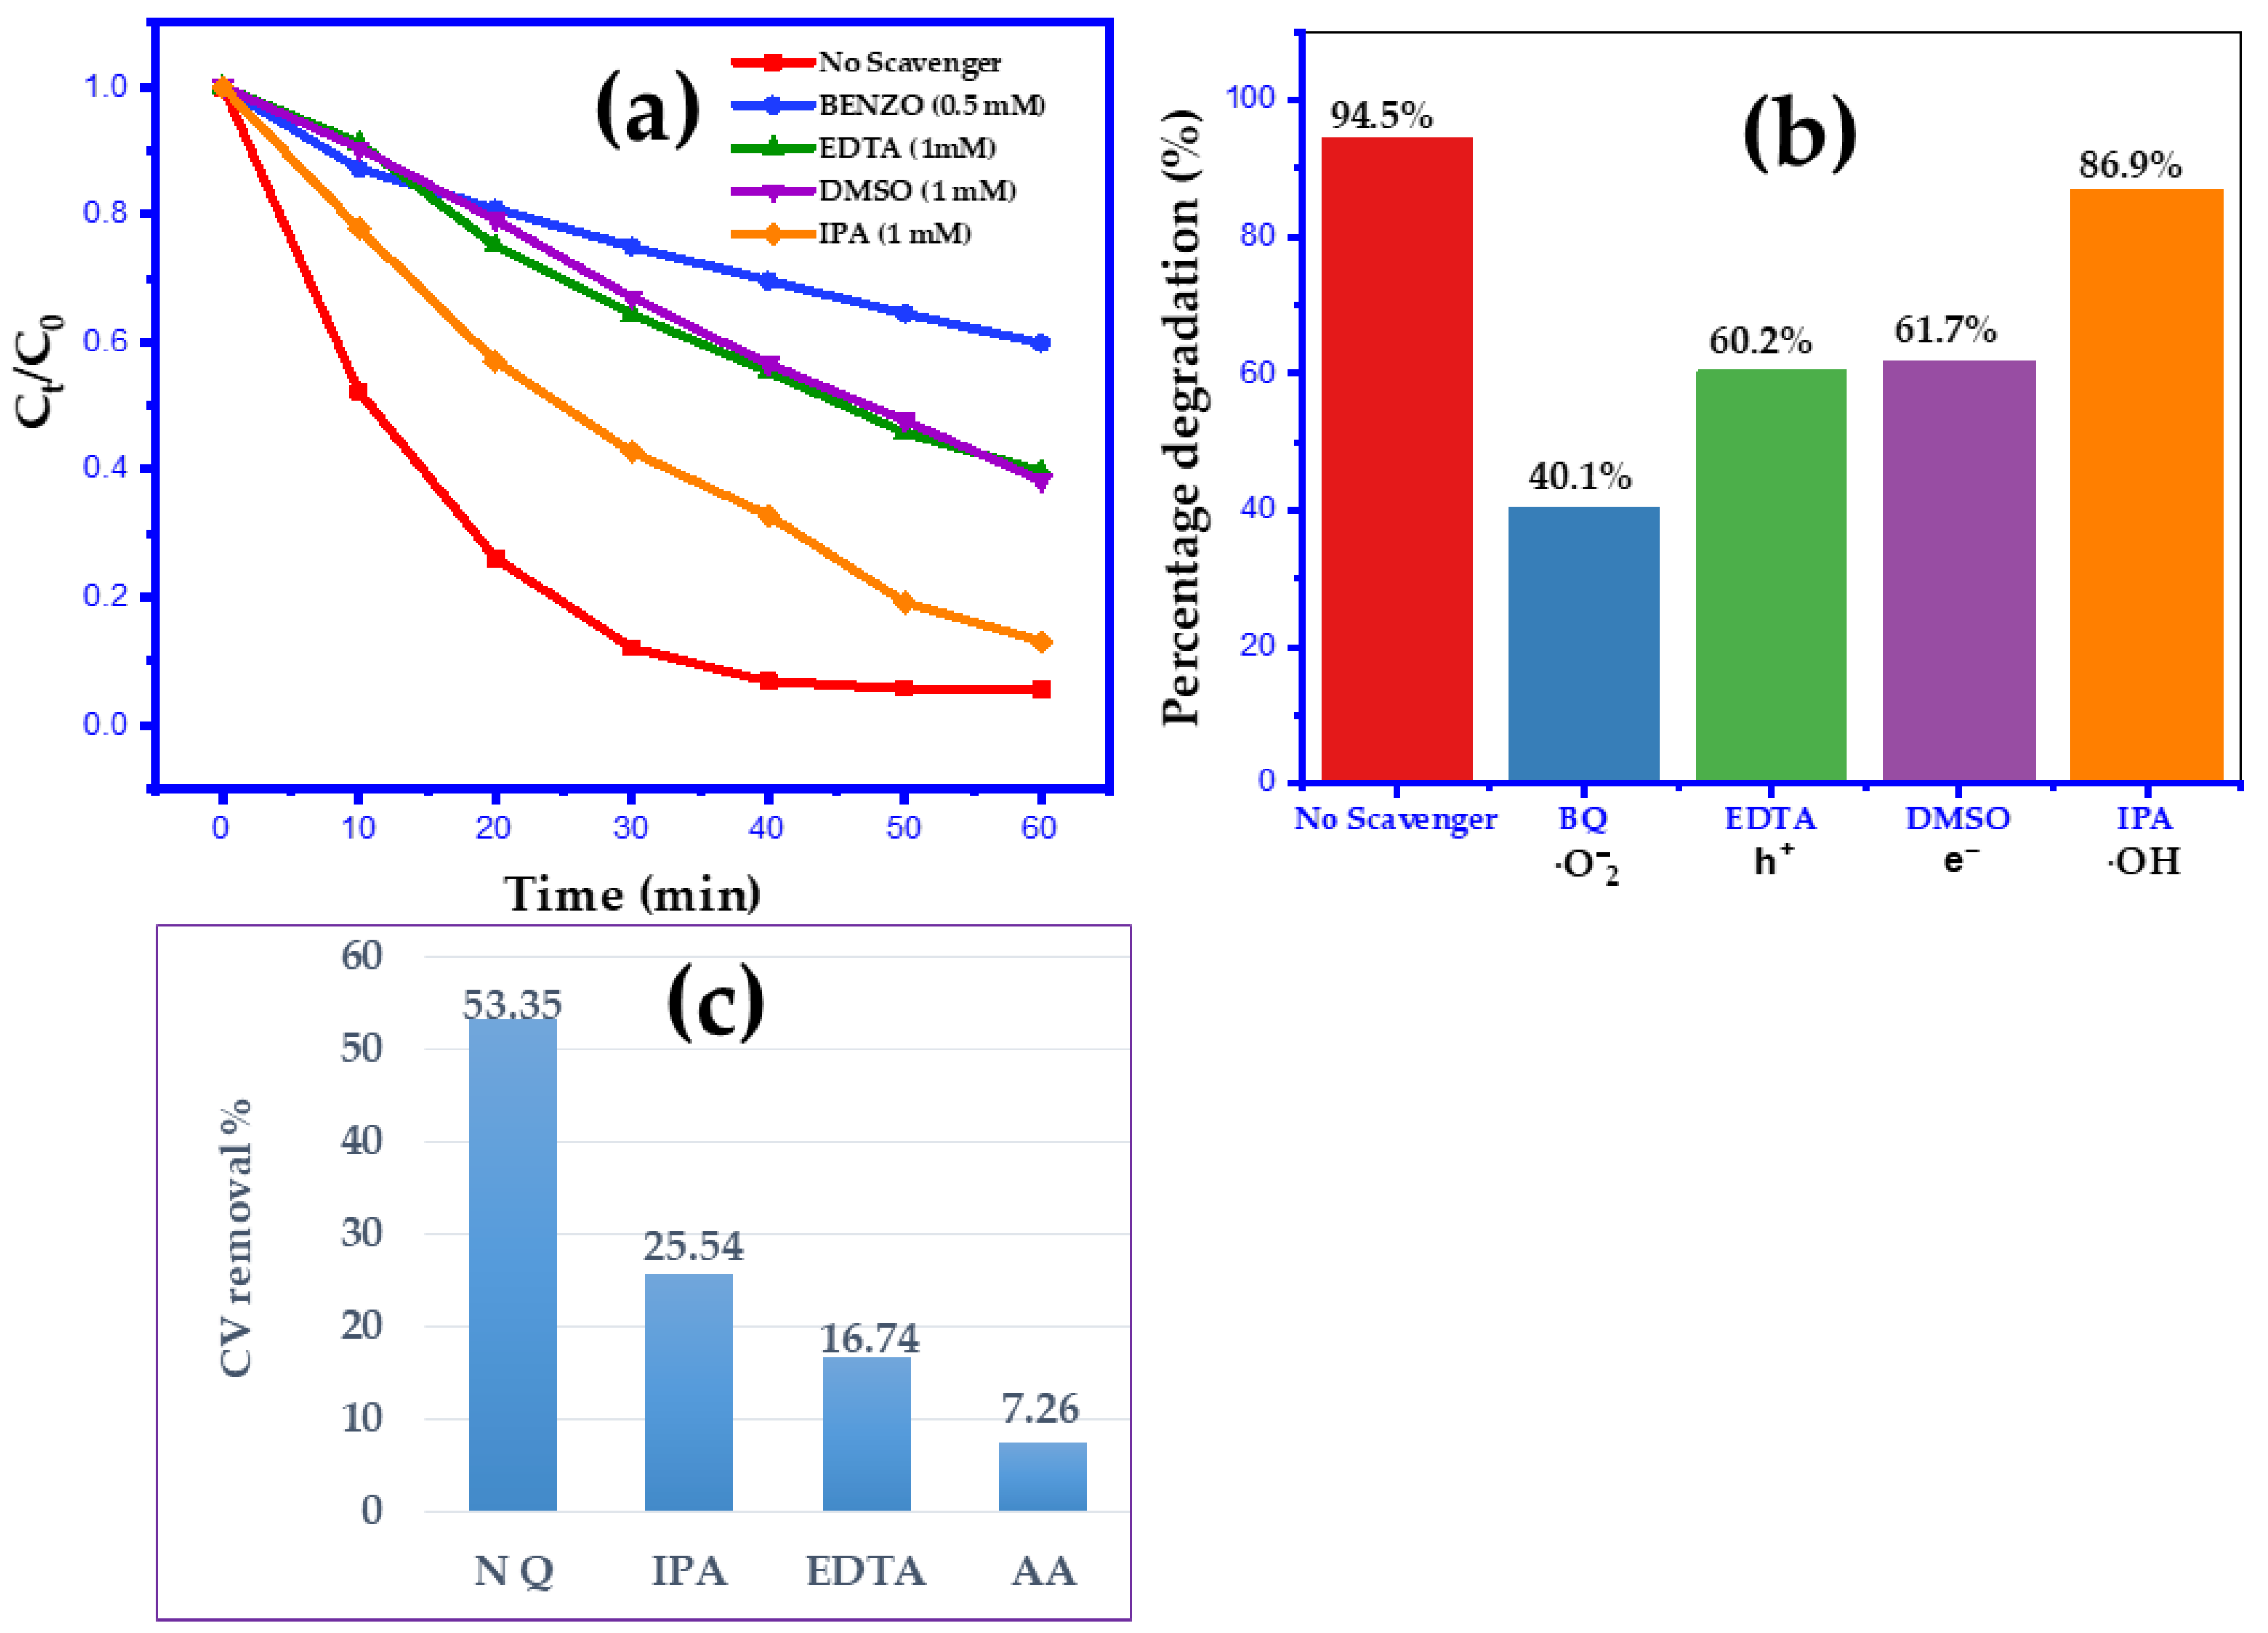
To understand the photocatalytic process in molecular detail it is important to identify the ROS involved in the breakdown of dyes. When MB is photodegraded using ZnO, four different radical scavengers, EDTA, DMSO, BQ and IPA were separately added to the reactions to capture holes (h+), electrons (e), superoxide (O2) and hydroxyl radicals (OH) respectively [74,75,76]. All scavengers were tested at the same concentration (1.0 mM) but BQ (0.5 mM). A total of 5 ppm of aqueous MB solution at pH = 12 and 12.5 mg of ZnO catalyst were used. The plots (C/C0) and the percentage of dye degradation in the presence and absence of scavengers are given in Figure 12a,b. The photodegradation efficiency of MB was significantly reduced upon addition of BQ (40.1%), DMSO (61.7%) and EDTA (60.2%), while the addition of IPA (86.9%) had relatively little effect. According to the effects of scavengers on the efficiency of MB removal, their inhibitor effect can be ranked as BQ > DMSO > EDTA > IPA > No scavenger. This means that OH can have a certain influence on the reaction, whereas h+, e and O2 radicals play crucial roles in the photocatalysis of MB dye. Although it is known that DMSO, particularly at high concentrations and high pHs, is capable of also capturing OH radicals [77,78], and the influence of DMSO can be partially ascribed to this effect, the fact that IPA has modestly affected the photocatalytic activity practically rules out a predominant role of hydroxyl radicals under the studied conditions. The impact of the scavengers on the efficiency of photocatalytic degradation of CV is represented in Figure 12c [69]. The strongest suppression of the photocatalytic reaction was observed for acid ascorbic (AA), revealing that superoxide plays a leading role in the CV photodegradation. IPA and EDTA also caused suppression of the rate of the CV photocatalytic degradation, but their impacts were somewhat more limited. This indicates that H+ and OH also play important roles but they are less important than superoxide ions for this particular photocatalytic reaction.

3.11. Mechanism of MB Dye Degradation

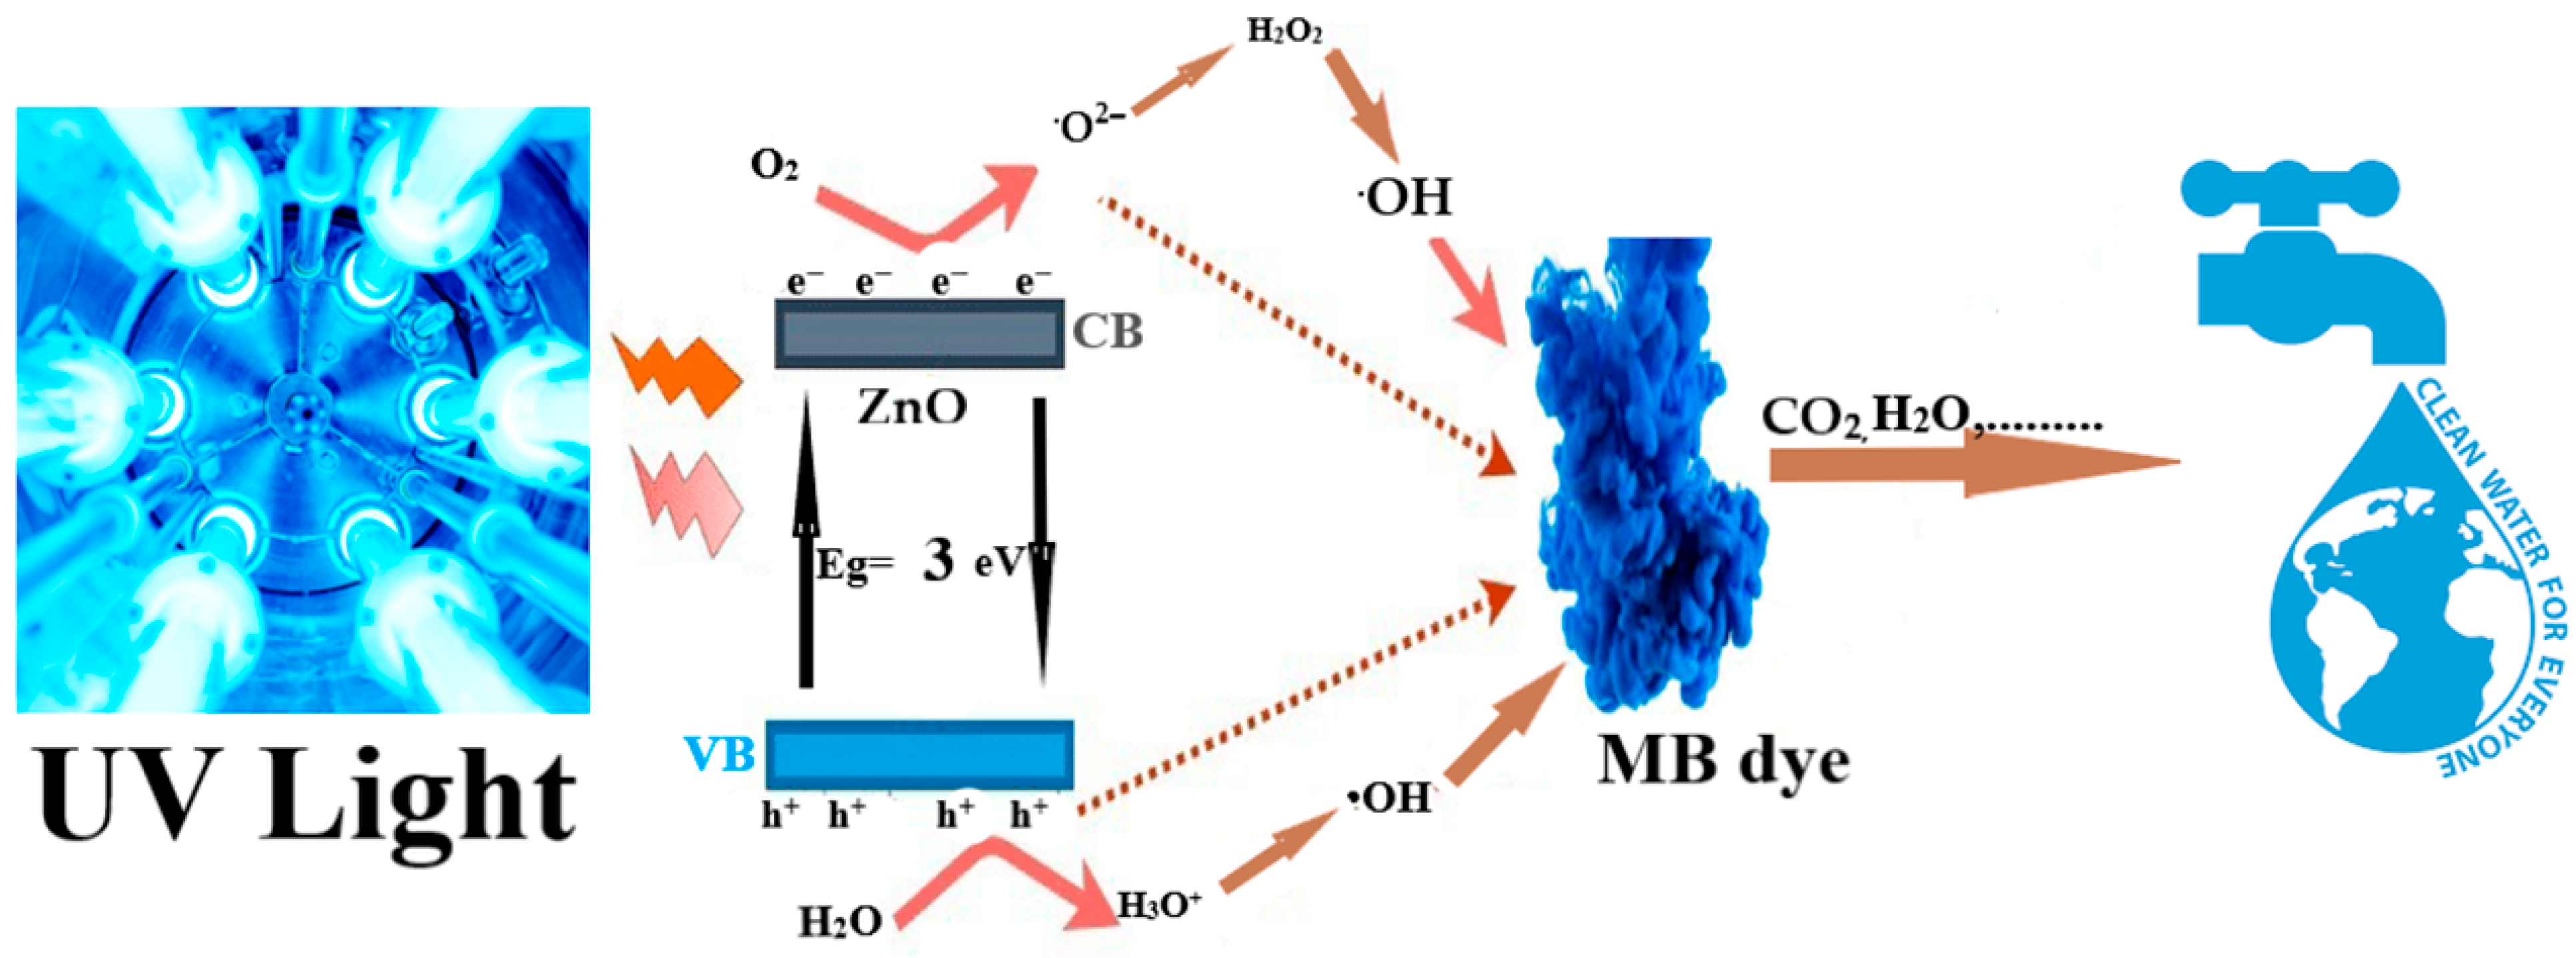
Based on the experiment data the following mechanism may be proposed for the degradation of MB dye (Figure 13). Upon exposure to UV irradiation, photons having energy equal to or greater than the band gap energy of the ZnO NPs (3 eV) excite e from the valence band (VB) to the conduction band (CB), creating electron–hole pairs. The electrons and photogenerated holes on the surface of the NPs react with O2 and H2O, leading to the formation of radicals with high oxidative power, such as superoxide (O2) and hydroxyl (OH) that degrade dyes down to the final H2O and CO2 molecules and other non-polluting sub-products [75,79,80].
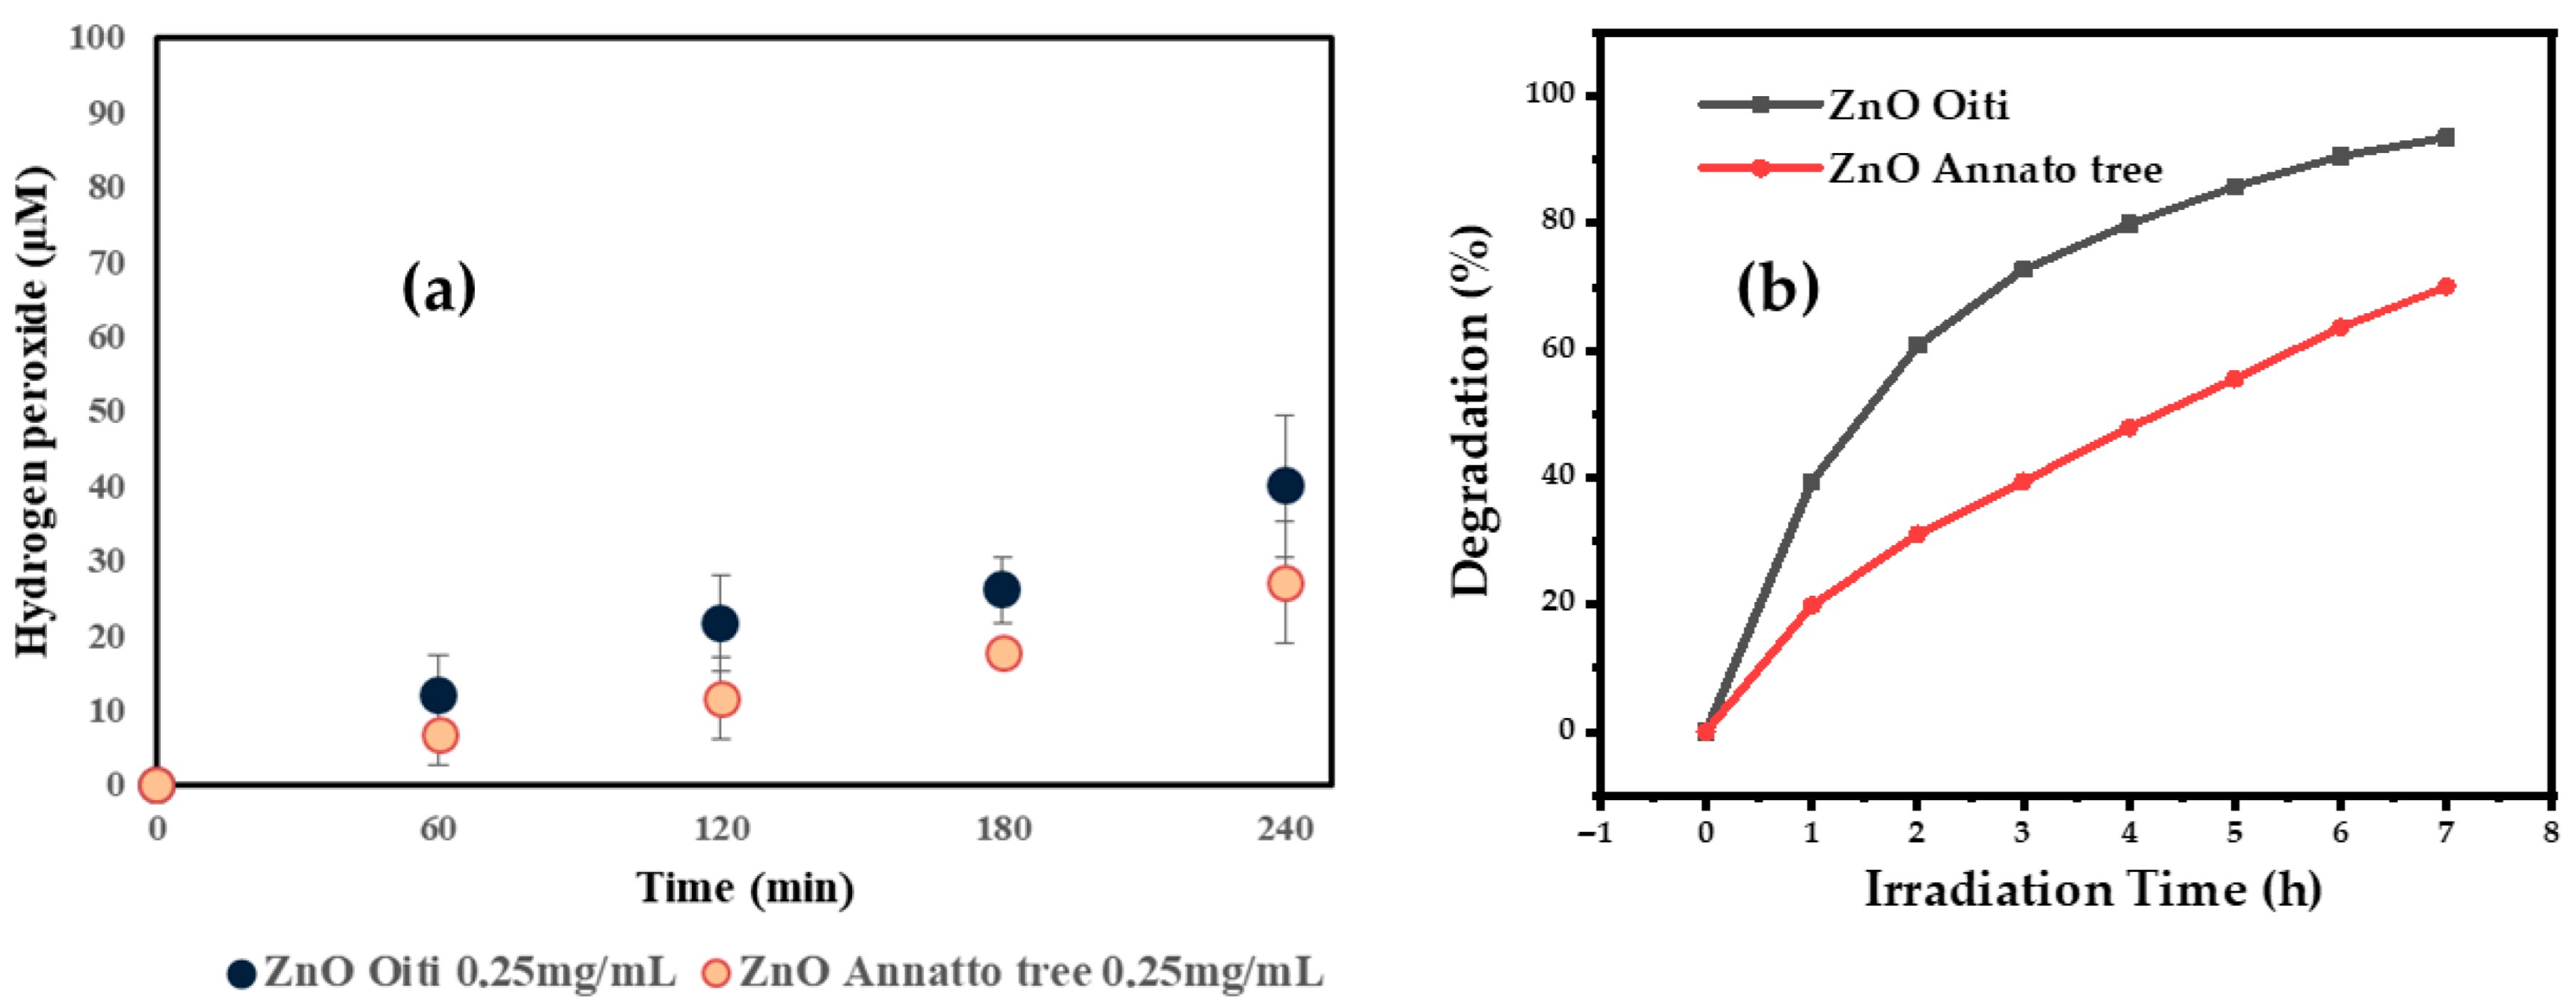
In this study, we decided to directly measure the availability of particular ROS produced by the ZnO NPs. We have chosen to measure H2O2 because it is the most biologically stable ROS and also the most quantifiable by biochemical means. To measure H2O2 release, we used the samples of ZnO NPs biosynthesized using Licania tomentosa and Annato tree leaves [25] suspended at 0.25 mg/mL in a solution of water exposed to 24 W UVA light for 4 h with continuous stirring. During the experiment, 1 mL aliquots were taken every one hour in duplicate. The supernatant was obtained by centrifugation at 13,300 rpm for 10 min. To measure the production of H2O2, a 49 µL kit consisting of a mixture of 200 µM Ampliflu red 5 U/mL of horseradish peroxidase and 50 mM Bis-Tris buffer pH = 6, was mixed with 51 µL of each type of nanoparticle, followed by an absorbance measurement at λ = 560 nm using spectrophotometer M200 Pro (TECAN) (Figure 14a).
Figure 14a indicates a steady increase in H2O2 content over time, with a production of 39.96 μM and 27.08 μM of H2O2, respectively, with ZnO NPs from Oiti (Licania tomentosa) and Annatto tree leaves extract.
ROS are inherently unstable and degrade over time. Some, such as hydroxyl radical (·OH), are highly reactive and consequently short-lived, having only an in vivo half-life of 10−9 s−1 [81]. H2O2 is the most stable of the ROS making it more suitable for quantification. ZnO NPs frequently have a number of crystalline defects at the surface allowing electron hole pairs (e h+) to form upon excitation in the UV or visible spectrum [82,83]. Water suspending these particles can be split forming H2O2 and other ROS through the following possible reactions [82,84]:
Z n O + h υ e + h +
h + H 2 O O H · + H +
e + O 2 O 2 ·
O 2 · + H + H O 2 ·
H O 2 · + H + + e + H 2 O 2
Moreover, the quantity of H2O2 generated by the ZnO NPs synthesized using Licania tomentosa leaf is greater than that produced by Annatto tree leaf extract. This could explain the difference in the photocatalytic performance obtained by these two types of ZnO NPs (Figure 14b). Indeed, Figure 14b shows that the ZnO NPs biosynthesized using Licania tomentosa leaves, which produce a higher amount of H2O2, offer superior degradation efficiency compared to the NPs biosynthesized with Annatto tree leaves (93.54% vs. 70.07%, respectively) under the same conditions (25 mg of ZnO NPs catalyst, 100 mL of 5 ppm MB in initial pH, 48 W UVA light during 7 h). This is consistent with the results obtained by Yangsi Liu et al. [85].
Under UV light, H2O2 supports the generation of hydroxyl radicals leading to improved treatment efficiency. This occurs either by interaction of H2O2 with radiation, superoxide anion (formed by the reaction of dissolved oxygen with the catalyst under irradiation) or by accepting the electron from the catalyst conduction band, according to the reactions shown below [86,87]. In general, an increase in H2O2 concentration leads to improved color removal [88,89,90].
H 2 O 2 + h υ 2 H O ·
H 2 O 2 + O 2 · O H · + O H + O 2
H 2 O 2 + e O H + O H ·

3.12. Reusability of Photocatalyst

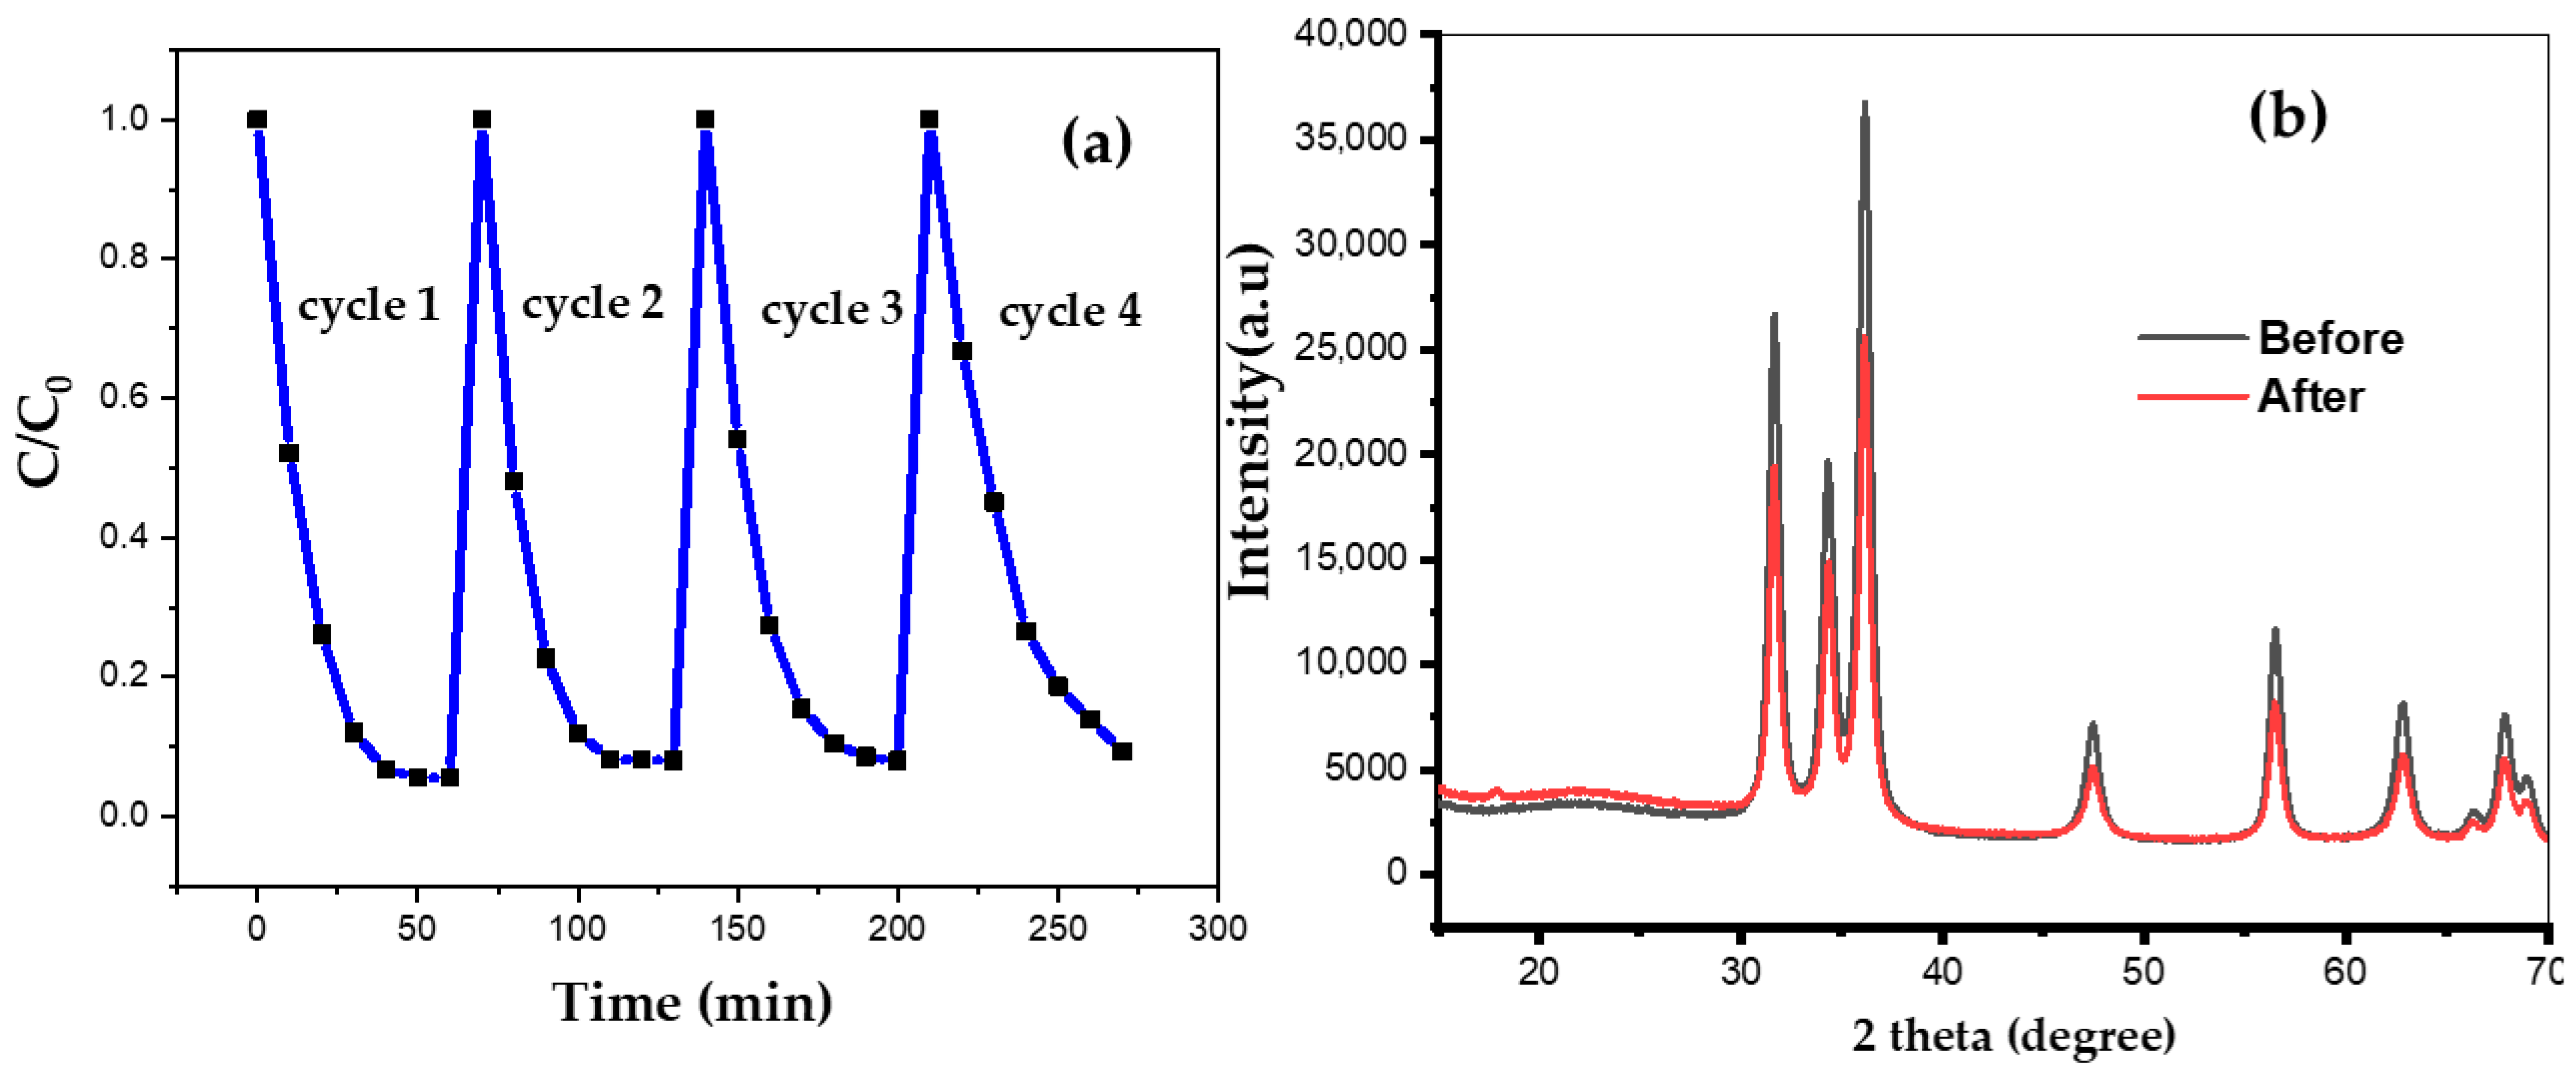
The recyclability of ZnO nanoparticles for the photodegradation of MB was investigated to check the practical application of the catalysts in photocatalytic applications. In our experiments, the photocatalyst can be recycled up to four cycles and their photocatalytic results are shown in Figure 15a. After each photocatalysis experiment, the catalyst was thoroughly rinsed with ethanol and water then vacuum dried at 100° C and reused another time. The efficiency of photodegradation of MB by ZnO NPs has been observed to be intact for at least four cycles.
To investigate what happens with the photocatalyst in the course of the photocatalytic process, the ZnO NPs after four photocatalytic cycles were subjected to XRD analysis. The XRD profile demonstrated a well-defined crystalline order (Figure 15b). Structural parameters of the biosynthesized ZnO NPs prior to and post four cycles of the photocatalytic degradation process are given in Table 1. Our results demonstrate that continuous UV illumination led to an increase in the average crystallite size (from 15.9 to 23.8 nm) and a significant decrease in the dislocation density (Table 1), consistent with the previous studies [4]. One possible explanation of this phenomenon is the heating up of the NPs in the process of UV irradiation during photocatalytic cycles and cooling them down between the cycles. This might lead to an annealing effect, which would promote the collapse of the individual crystallites leading to a bigger crystallite formation, accompanied by partial elimination of dislocations. This could impact parameters of the NPs, such as, for example, the nature and concentration of electronic defects which are known to have significant impacts on the NP photocatalytic performances [91]. However, additional studies of the structural parameters of photocatalytic NPs will be needed to fully confirm this hypothesis.

4. Antimicrobial Activity

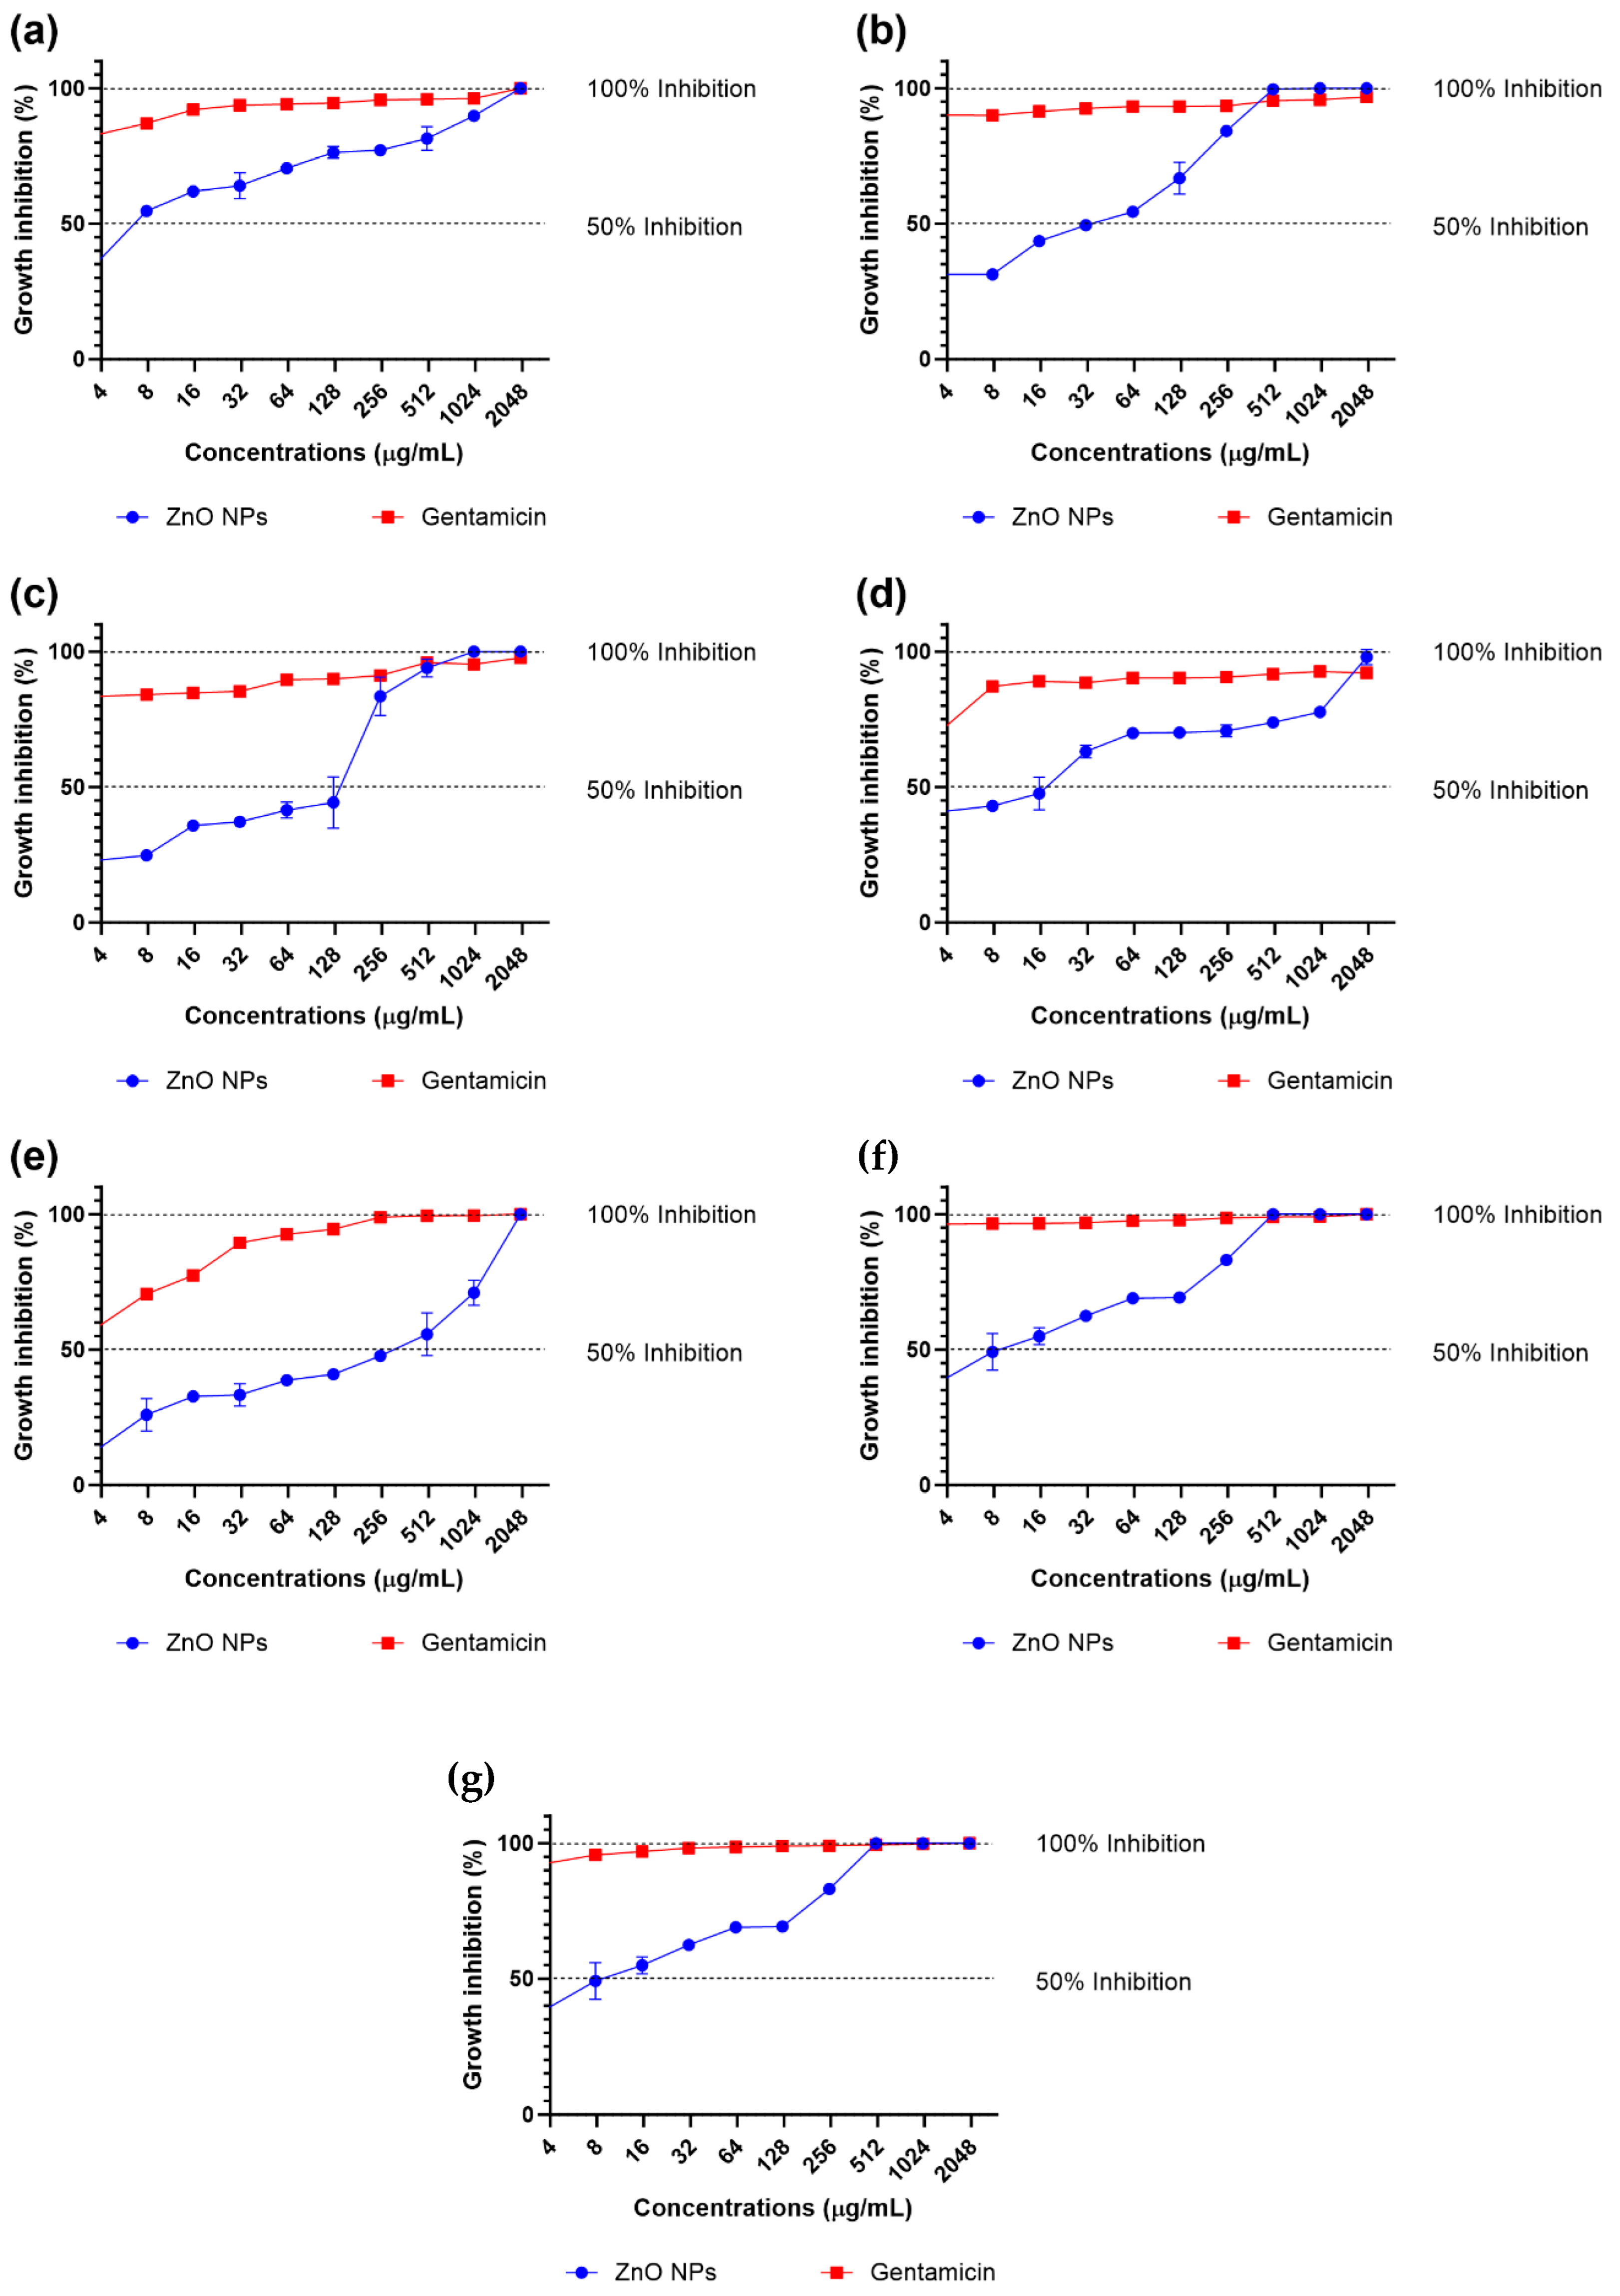
The antimicrobial activity of the biosynthesized ZnO NPs was evaluated through the determination of their MIC, MBC and IC50 (Table 2; Figure 16). The NPs exhibited broad-spectrum inhibitory effects against all tested species, although with variable potency depending on the microorganism. Among Gram-negative bacteria, E. coli ATCC 35218 showed the lowest IC50 value (7.74 µg/mL), indicating high susceptibility to ZnO NPs. K. pneumoniae ATCC 700603 exhibited an intermediate response (IC50 = 128.91 µg/mL). P. aeruginosa ATCC 27853 also demonstrated strong sensitivity to ZnO NPs (IC50 = 12.57 µg/mL), whereas the clinical isolate P. aeruginosa B3 displayed a markedly higher IC50 (283.14 µg/mL). The MIC values for Gram-negative strains were in the range from 1000 to 2000 µg/mL, and MBC values were ≥1000 µg/mL, suggesting that high nanoparticle concentrations are required to achieve bactericidal activity.
Among Gram-positive bacteria, S. aureus ATCC 29213 showed a low IC50 value (12.56 µg/mL), comparable to the more susceptible Gram-negative strains. In contrast, S. aureus SA01, a multidrug-resistant bloodstream isolate [92], showed reduced susceptibility (IC50 = 130.53 µg/mL). This strains E. faecalis ATCC 29737 exhibited moderate susceptibility with an IC50 of 41.86 µg/mL and an MIC of 250 µg/mL, the lowest MIC observed among all tested species. Consistent with the behavior of other strains, bactericidal activity required elevated concentrations (MBC = 2000 µg/mL).
These results demonstrate that ZnO NPs possess measurable antimicrobial activity; however, complete growth inhibition and bactericidal effects required higher doses. This is a typical behavior of metal–oxide nanoparticles, whose antimicrobial action is known to involve multiple mechanisms, including ROS generation, membrane disruption, and Zn2+ ion release. Indeed, evidence from mechanistic studies confirms that ZnO NPs induce oxidative stress, damage cytoplasmic membranes, and release Zn2+ ions, three central pathways contributing to their bactericidal activity [93,94,95].
Unlike previous studies with the use of the biosynthesized NPs, most works use the agar diffusion method based on halo formation, whereas the results of this study were obtained using the microdilution method. Furthermore, differences in the chemical composition of the extracts used, the synthesis conditions, or the particle morphology can significantly influence the antimicrobial response. Considering these factors, Gharbia et al. [96] observed strong antimicrobial activity of ZnO nanorods produced from Olea europaea leaf extract, with inhibition zones ≥ 30 mm against S. aureus, Streptococcus mutans, and E. coli. Similarly, Manojkumar et al. [30] and Francis et al. [90] synthesized ZnO nanoparticles from Brassica oleracea var. botrytis (BO) leaf extract and reported inhibition zones against S. aureus (13 mm), K. pneumoniae (13 mm), and E. coli (9 mm). Francis et al. [97], using the microdilution method, report MICs between 125 and 250 ng/µL (equivalent to 125–250 µg/mL) for biogenic ZnO NPs, with microbicidal activity equal to these MICs. These values are lower than those obtained in this study (250–2000 µg/mL). This difference could be related to partial aggregation of the nanoparticles in the liquid medium, reducing their specific surface area, or to the specific physicochemical characteristics of the extract used, which influence their bioavailability and their ability to interact with bacterial cells.

5. Antibiofilm Activity

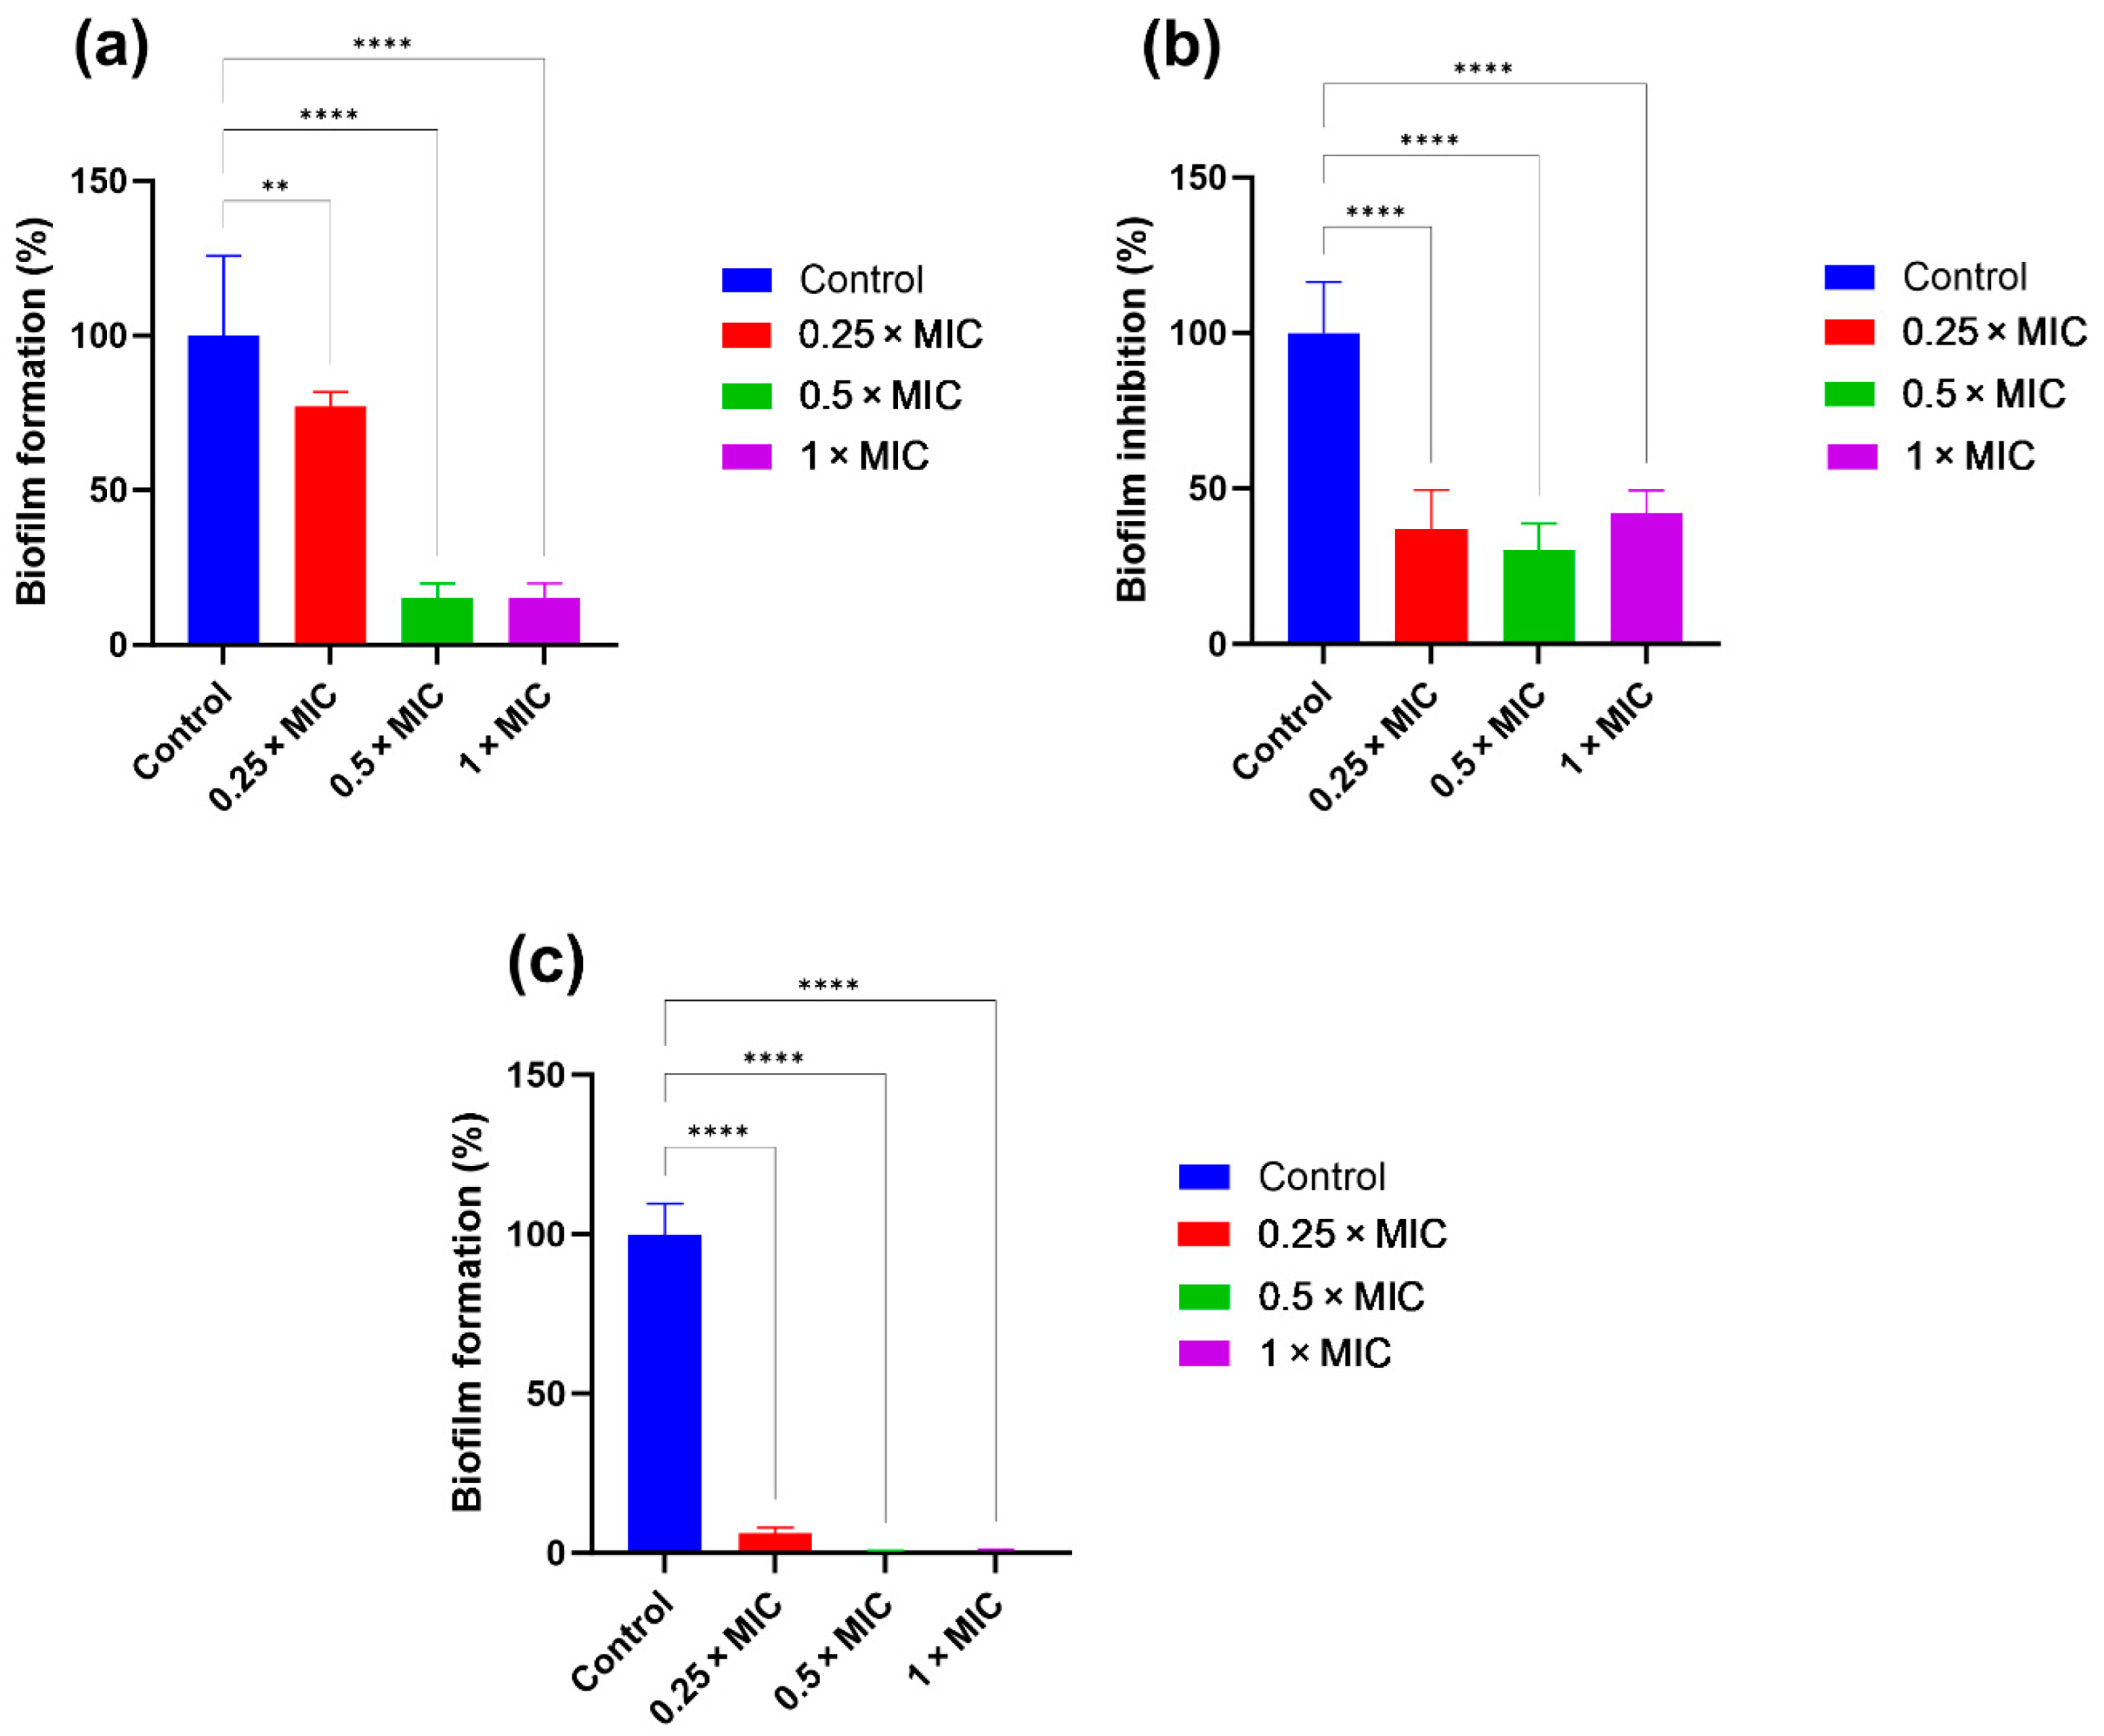
The antibiofilm effects of ZnO nanoparticles were evaluated against E. faecalis ATCC 29737, P. aeruginosa ATCC 27856, and S. aureus SA01 using crystal violet staining to quantify biofilm biomass. ZnO NPs inhibited biofilm formation in a concentration-dependent fashion, although the magnitude and pattern of inhibition varied across species (Figure 17). For E. faecalis, ZnO NPs achieved 84.80 ± 4.74% inhibition at MIC, with inhibition decreasing to 64.91 ± 6.30% at 0.5 × MIC and 22.82 ± 4.62% at 0.25 × MIC, indicating a clear dose-dependent response.
Importantly, the biofilm of S. aureus SA01 was completely inhibited by all tested concentrations. In contrast, P. aeruginosa ATCC 27856 displayed similar levels of biofilm inhibition across all three concentrations tested. No statistically significant differences in the resulting values (p > 0.05) have been observed, which ranged from 57.75 ± 7.13% to 69.62 ± 12.63%. Comparable behavior has been described in other nanoparticle–biofilm systems, particularly under sub-inhibitory NP concentrations, where bacterial stress responses, extracellular polymeric substance (EPS) reorganization, or enhanced NP penetration into the biofilm matrix may modulate the extent of inhibition [92].
The green ZnO NPs characterized in this research demonstrated enhanced CV and MB dyes degradations under UV irradiation and antimicrobial MIC values as compared to other ZnO NPs (Table 3). The recent studies on green-synthesized ZnO NPs are compared in Table 3. While bulk ZnO has a band gap of about 3.37 eV, green-synthesized nanoparticles often show slightly reduced value (~2.9 eV, likely due to lattice defects such as oxygen vacancies formed during synthesis). This band gap narrowing enables activation under UV and visible light and improves photodegradation efficiency. Additionally, the nanoscale morphology of ZnO NPs enhances their interaction with bacterial cells, while defect-induced reactive oxygen species contribute to their antimicrobial activity [98,99].

6. Disk Diffusion

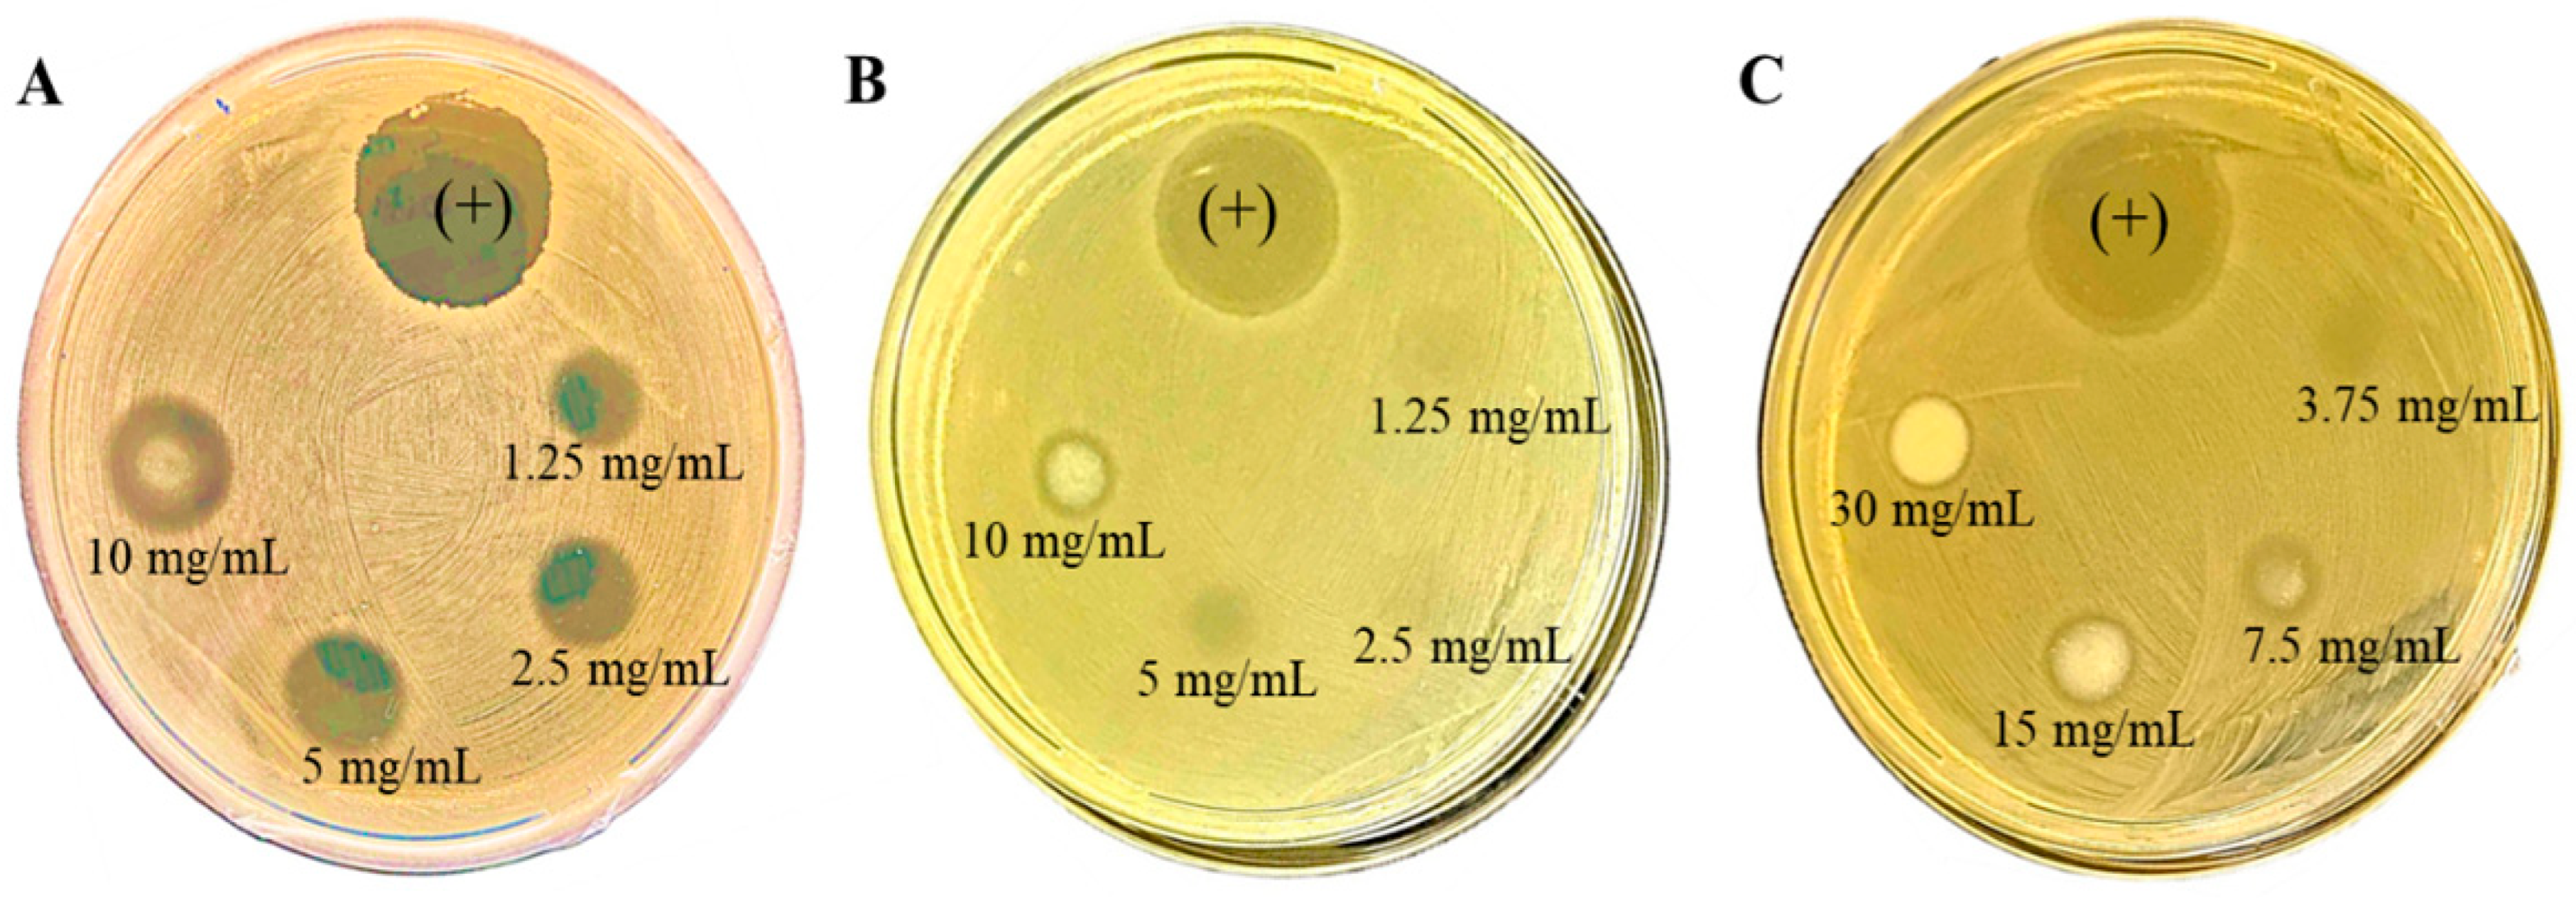
We also conducted additional studies of antimicrobial activities of the green ZnO NPs using disk diffusion assays using representative Gram-positive and Gram-negative bacterial strains. Table 4. presents the results obtained in the disk diffusion assay for Staphylococcus aureus 03 and Escherichia coli 1TCC 25922.
The ZnO NPs synthesized demonstrated an inhibitory effect on the bacterial growth, with greater antibacterial activity observed at a concentration of 10 mg/mL and 30 mg/mL, which resulted in inhibition zones of 13.5 mm and 8 mm, respectively, for Staphylococcus aureus SA03 (Figure 18A) and Escherichia coli 1TCC 25922 (Figure 18C). On the other hand, the concentration of 2.5 mg/mL and 1.25 mg/mL NPs did not produce any inhibition zones (Figure 18B) for Escherichia coli 1TCC 25922 indicating a directly proportional relationship between the concentration of the NPs and antibacterial activity [107,108,109]. The positive control (ampicillin, 10 mg/mL) produced an inhibition zone of 19 mm, confirming the sensitivity of the strain to the standard antibiotic, while negative controls showed no inhibition activity for either bacterium. These results are consistent with early studies [83,110], which reported that Gram-positive bacteria tend to be more susceptible to ZnO NPs, likely due to structural differences in their cell walls that facilitate NP penetration. The higher concentration of NPs required to inhibit E.coli can be attributed to the structural composition of this bacterium’s cell walls, which consists of a thin layer of peptidoglycan associated with an outer membrane rich in lipopolysaccharides [111,112]. This can reduce the penetration and action of the nanoparticles.

7. Conclusions

Here, the ZnO NPs have been produced in an efficient, uncomplicated and environmentally friendly way utilizing Licania Tomentosa Benth leaf extracts. The Tauc plot, based on UV-Vis spectra of the ZnO NPs, reveals a relatively small band gap of 3.0 eV. EDX analysis demonstrated only Zn and O in the NPs’ elementary composition. X-ray diffraction studies showed that the biosynthesized ZnO NPs have a hexagonal wurtzite structure. Scanning electron microscopy confirmed that the ZnO NPs have a spherical shape with an average diameter of 25.5 ± 1.1 nm. An average crystallite size of 15.9 nm was estimated, based on X-ray diffraction data using the Scherrer equation and 10.83 using the Williamson–Hall approach. Moreover, the ZnO NPs exhibited elevated antimicrobial activity against all tested strains, including isolates with multidrug resistance phenotypes. Their MICs range from 250 to 2000 µg/mL, notably demonstrating efficacy against E. faecalis ATCC 29737 (MIC = 250 µg/mL). The nanoparticles also exhibited significant antibiofilm activity, effectively inhibiting biofilm formation in E. faecalis ATCC 29737, P. aeruginosa ATCC 27856, and S. aureus SA01. In addition, photodegradation experiments showed that 12.5 mg and 25 mg of green ZnO NPs at pH 12 and 10 resulted in the highest equilibrium elimination of MB and CV (94.52% and 81%, respectively). Collectively, the biosynthesized ZnO NPs using Licania tomentosa Benth leaf extracts show a great promise as multifunctional material with applications in antimicrobial treatments, biofilm control, and photocatalytic remediation, making them potentially attractive for medical, environmental, and wastewater management technologies.

Author Contributions

M.T., R.C.C.M., F.C., L.C.N.d.S., V.O.A.P. and I.P. designed the experiments; M.T. synthesized and conducted characterization of the NPs; B.D.N. and M.d.O.N. contributed with scientific discussions and further characterization of the NPs; M.T. and F.C. conducted photodegradation studies; R.C.C.M., H.L.A.F., M.S.R., A.J.M.C.R.P. and L.C.N.d.S. conducted antimicrobial and antibiofilm investigations, M.T., V.O.A.P. and I.P. wrote the manuscript with the input from all the other authors; I.P., L.C.N.d.S. and M.d.O.N. secured funding, and I.P., M.d.O.N. and L.C.N.d.S. supervised the project. All authors have read and agreed to the published version of the manuscript.

Funding

This work was supported by the Fundação de Amparo à Pesquisa do Estado de São Paulo (FAPESP, grants #2021/08780-1 and 2024/00533-3 to I.P.), by the Conselho Nacional de Desenvolvimento Científico e Tecnológico (CNPq, grants #306852/2021-7 and 440180/2022-8 to I.P.) and by Federal Deputy Tiririca (to M.d.O.N.).

Data Availability Statement

The original contributions presented in this study are included in the article. Further inquiries can be directed to the corresponding author.

Acknowledgments

We acknowledge support of multiuser facilities of IQSC/USP to allow for SEM and EDS measurements.

Conflicts of Interest

The author declares no conflicts of interest.

References

  1. Zolkefli, N.; Sharuddin, S.S.; Yusoff, M.Z.M.; Hassan, M.A.; Maeda, T.; Ramli, N. A review of current and emerging approaches for water pollution monitoring. Water 2020, 12, 3417. [Google Scholar] [CrossRef]
  2. Arman, N.Z.; Salmiati, S.; Aris, A.; Salim, M.R.; Nazifa, T.H.; Muhamad, M.S.; Marpongahtun, M. A review on emerging pollutants in the water environment: Existences, health effects and treatment processes. Water 2021, 13, 3258. [Google Scholar] [CrossRef]
  3. Ferreira, V.; Magalhães, R.; Teixeira, P.; Castro, P.M.L.; Calheiros, C.S.C. Occurrence of fecal bacteria and zoonotic pathogens in different water bodies: Supporting water quality management. Water 2022, 14, 780. [Google Scholar] [CrossRef]
  4. de Oliveira Arnoldi Pellegrini, V.; de Jesus Bernardo, A.; Rossi, B.R.; Leite, R.R.; Possatto, J.F.; Dabul, A.N.G.; Fontana, C.R.; Dlamini, Z.W.; Mahule, T.S.; Mosepele, B.Q.; et al. Antimicrobial, photodegradation and BioReRAM applications of multifaceted green zinc oxide nanoparticles synthesized using coffee leaves extract. Sci. Rep. 2025, 15, 29054. [Google Scholar] [CrossRef] [PubMed]
  5. Venkatachalam, P.; Jayaraj, M.; Manikandan, R.; Geetha, N.; Rene, E.R.; Sharma, N.; Sahi, S. Zinc oxide nanoparticles (ZnONPs) alleviate heavy metal-induced toxicity in Leucaena leucocephala seedlings: A physiochemical analysis. Plant Physiol. Biochem. 2017, 110, 59–69. [Google Scholar] [CrossRef] [PubMed]
  6. Vimala, K.; Sundarraj, S.; Paulpandi, M.; Vengatesan, S.; Kannan, S. Green synthesized doxorubicin loaded zinc oxide nanoparticles regulates the Bax and Bcl-2 expression in breast and colon carcinoma. Process Biochem. 2014, 49, 160–172. [Google Scholar] [CrossRef]
  7. Huang, J.; Zong, Z.; Wang, P.; Zhou, H.; Zhang, Y.; Li, Z. Atomic-level steering of charge flow from type-II to S-scheme in In2O3/BiOCl via vacancy–metal pairs for CO2 photoreduction. Chem. Eng. J. 2026, 528, 172537. [Google Scholar] [CrossRef]
  8. Sharma, S.; Devi, M.; Kumar, P.; Thakur, N.; Kumar, K.; Jeet, K.; Sharma, A.; Kumar, S.; Kumar, A.; Thakur, N. Photocatalytic, antibacterial and antioxidant study of Vitex negundo mediated green synthesized nickel and neodymium doped zinc oxide nanoparticles. Toxicol. Environ. Chem. 2025, 107, 178–206. [Google Scholar] [CrossRef]
  9. Khan, A.K.; Renouard, S.; Drouet, S.; Blondeau, J.-P.; Anjum, I.; Hano, C.; Abbasi, B.H.; Anjum, S. Effect of UV irradiation (A and C) on Casuarina equisetifolia-mediated biosynthesis and characterization of antimicrobial and anticancer activity of biocompatible zinc oxide nanoparticles. Pharmaceutics 2021, 13, 1977. [Google Scholar] [CrossRef]
  10. Joseph, J.A.; Nair, S.B.; John, S.S.; Remillard, S.K.; Shaji, S.; Philip, R.R. Zinc-doped iron oxide nanostructures for enhanced photocatalytic and antimicrobial applications. J. Appl. Electrochem. 2021, 51, 521–538. [Google Scholar] [CrossRef]
  11. Ikhmayies, S.J. Synthesis of ZnO microrods by the spray pyrolysis technique. J. Electron. Mater. 2016, 45, 3964–3969. [Google Scholar] [CrossRef]
  12. Manikandan, E.; Kavitha, G.; Kennedy, J. Epitaxial zinc oxide, graphene oxide composite thin-films by laser technique for micro-Raman and enhanced field emission study. Ceram. Int. 2014, 40, 16065–16070. [Google Scholar] [CrossRef]
  13. Singh, J.; Dutta, T.; Kim, K.-H.; Rawat, M.; Samddar, P.; Kumar, P. ‘Green’ synthesis of metals and their oxide nanoparticles: Applications for environmental remediation. J. Nanobiotechnol. 2018, 16, 84. [Google Scholar] [CrossRef]
  14. Roopa, M.; Thirumala, S.; Kallimani, S.; Manohara, B.; Basavarajaiah, S. Green synthesis of nanoparticles for enhanced wastewater treatment and other applications: A review and future perspectives. Next Mater. 2025, 8, 100664. [Google Scholar] [CrossRef]
  15. Sanpradit, P.; Byeon, E.; Lee, J.-S.; Peerakietkhajorn, S. Ecotoxicological, ecophysiological, and mechanistic studies on zinc oxide (ZnO) toxicity in freshwater environment. Comp. Biochem. Physiol. Part C Toxicol. Pharmacol. 2023, 273, 109720. [Google Scholar] [CrossRef]
  16. Raha, S.; Ahmaruzzaman, M. ZnO nanostructured materials and their potential applications: Progress, challenges and perspectives. Nanoscale Adv. 2022, 4, 1868–1925. [Google Scholar] [CrossRef]
  17. Dunston, A.K.; Marimuthu, V.; Murugesan, S.; Sivasamy, N. Effective utilization of green synthesized zinc oxide nanoparticles for sequestering methylene blue dye from pharmaceutical industry. Matéria 2025, 30, e20240654. [Google Scholar] [CrossRef]
  18. Nguyen, L.; Roth, D.M.; Shanewise, J.S.; Kaplan, J.A. Discontinuing cardiopulmonary bypass. In Kaplan’s Essentials of Cardiac Anesthesia; Elsevier: Amsterdam, The Netherlands, 2018; pp. 715–740. [Google Scholar] [CrossRef]
  19. Abou Zeid, S.; Perez, A.; Bastide, S.; Le Pivert, M.; Rossano, S.; Remita, H.; Hautière, N.; Leprince-Wang, Y. Antibacterial and photocatalytic properties of ZnO nanostructure decorated coatings. Coatings 2023, 14, 41. [Google Scholar] [CrossRef]
  20. Xin, Z.; He, Q.; Wang, S.; Han, X.; Fu, Z.; Xu, X.; Zhao, X. Recent progress in ZnO-based nanostructures for photocatalytic antimicrobial in water treatment: A review. Appl. Sci. 2022, 12, 7910. [Google Scholar] [CrossRef]
  21. Samadi, H.; Mohgadam, R.Z.; Shahraki, M.G. Green synthesis of ZnO nanoparticles, photocatalyst activity and its biomedical applications: A review. Mater. Chem. Phys. 2025, 345, 131161. [Google Scholar] [CrossRef]
  22. Aldeen, T.S.; Mohamed, H.E.A.; Maaza, M. ZnO nanoparticles prepared via a green synthesis approach: Physical properties, photocatalytic and antibacterial activity. J. Phys. Chem. Solids 2022, 160, 110313. [Google Scholar] [CrossRef]
  23. Duarte, F.S.; Melo, A.; Oliveira, L.; Duarte, J.; Oliveira, R. Green Synthesis for Antibiotic Photodegradation: Recent Advances and Future Trends. Water 2025, 18, 39. [Google Scholar] [CrossRef]
  24. Vieira, I.R.S.; Mirres, A.C.d.M.; Conte-Junior, C.A. Zinc Oxide Nanomaterials: Green Synthesis, Properties, and Potentials in Active Food Packaging, Edible Coatings, and Nanomedicine Applications. ChemistrySelect 2026, 11, e04228. [Google Scholar] [CrossRef]
  25. Bernardo, A.d.J.; Dabul, A.N.; Thiam, M.; Pellegrini, V.O.; Silva, M.A.; Vallabhapurapu, S.; Desarada, S.; Vallabhapurapu, V.S.; Fontana, C.R.; Polikarpov, I. Dye Photocatalytic Degradation and Water Treatment Using Biosynthetic ZnO Nanoparticles Produced Using Annatto Tree Leaf Extract. Processes 2026, 14, 459. [Google Scholar] [CrossRef]
  26. Bala, N.; Saha, S.; Chakraborty, M.; Maiti, M.; Das, S.; Basu, R.; Nandy, P. Green synthesis of zinc oxide nanoparticles using Hibiscus subdariffa leaf extract: Effect of temperature on synthesis, anti-bacterial activity and anti-diabetic activity. RSC Adv. 2015, 5, 4993–5003. [Google Scholar] [CrossRef]
  27. Sharma, S.; Kumar, K.; Thakur, N.; Chauhan, S.; Chauhan, M. The effect of shape and size of ZnO nanoparticles on their antimicrobial and photocatalytic activities: A green approach. Bull. Mater. Sci. 2020, 43, 20. [Google Scholar] [CrossRef]
  28. Arumugam, J.; Thambidurai, S.; Suresh, S.; Selvapandiyan, M.; Kandasamy, M.; Pugazhenthiran, N.; Kumar, S.K.; Muneeswaran, T.; Quero, F. Green synthesis of zinc oxide nanoparticles using Ficus carica leaf extract and their bactericidal and photocatalytic performance evaluation. Chem. Phys. Lett. 2021, 783, 139040. [Google Scholar] [CrossRef]
  29. Mirza, S.; Hussaini, A.A.; Öztürk, G.; Turgut, M.; Öztürk, T.; Tugay, O.; Ulukuş, D.; Yıldırım, M. Photocatalytic and antibacterial activities of ZnO nanoparticles synthesized from Lupinus albus and Lupinus pilosus plant extracts via green synthesis approach. Inorg. Chem. Commun. 2023, 155, 111124. [Google Scholar] [CrossRef]
  30. Manojkumar, U.; Kaliannan, D.; Srinivasan, V.; Balasubramanian, B.; Kamyab, H.; Mussa, Z.H.; Palaniyappan, J.; Mesbah, M.; Chelliapan, S.; Palaninaicker, S. Green synthesis of zinc oxide nanoparticles using Brassica oleracea var. botrytis leaf extract: Photocatalytic, antimicrobial and larvicidal activity. Chemosphere 2023, 323, 138263. [Google Scholar] [CrossRef]
  31. Carnevale Neto, F.; Pilon, A.C.; da Silva Bolzani, V.; Castro-Gamboa, I. Chrysobalanaceae: Secondary metabolites, ethnopharmacology and pharmacological potential. Phytochem. Rev. 2013, 12, 121–146. [Google Scholar] [CrossRef]
  32. Zamproni, K.; Biondi, D.; de Carvalho Maria, T.R.B.; Almeida Louveira, F. Diagnóstico Quali-Quantitativo da Arborização Viária de Bonito, Mato Grosso do Sul. Floresta 2018, 48, 235–244. [Google Scholar] [CrossRef]
  33. Andrade, E.H.A.; Zoghbi, M.d.G.B.; Maia, J.G.S. Constituintes voláteis dos frutos de Licania tomentosa Benth. Acta Amaz. 1998, 28, 55. [Google Scholar] [CrossRef]
  34. Monteiro, K.L.; Oliveira, C.d.; Silva, B.M.d.S.; Môro, F.V.; Carvalho, D.A.d. Caracterização morfológica de frutos, de sementes e do desenvolvimento pós-seminal de Licania tomentosa (Benth.) Fritsch. Ciência Rural 2012, 42, 90–97. [Google Scholar] [CrossRef]
  35. Castilho, R.O.; Kaplan, M.A.C. Constituintes químicos de Licania tomentosa Benth. (Chrysobalanaceae). Química Nova 2008, 31, 66–69. [Google Scholar] [CrossRef]
  36. Macedo, J.B.M. Capacidade Antioxidante In Vitro e Avaliação da Toxicidade Aguda In Vivo de Extratos de Folhas de Licania rigida Benth., Licania tomentosa (Benth.) Fritsch e Couepia impressa Prance (Chrysobalanaceae); Federal University of Rio Grande do Norte: Natal, Brazil, 2011; Available online: https://repositorio.ufrn.br/jspui/handle/123456789/13510 (accessed on 15 April 2026).
  37. Farias, D.F.; Souza, T.M.; Viana, M.P.; Soares, B.M.; Cunha, A.P.; Vasconcelos, I.M.; Ricardo, N.M.P.S.; Ferreira, P.M.P.; Melo, V.M.M.; Carvalho, A.F.U. Antibacterial, antioxidant, and anticholinesterase activities of plant seed extracts from Brazilian semiarid region. BioMed Res. Int. 2013, 2013, 510736. [Google Scholar] [CrossRef] [PubMed]
  38. Agra, M.d.F.; Freitas, P.F.d.; Barbosa-Filho, J.M. Synopsis of the plants known as medicinal and poisonous in Northeast of Brazil. Rev. Bras. Farmacogn. 2007, 17, 114–140. [Google Scholar] [CrossRef]
  39. Nasiri, S.; Rabiei, M.; Palevicius, A.; Janusas, G.; Vilkauskas, A.; Nutalapati, V.; Monshi, A. Modified Scherrer equation to calculate crystal size by XRD with high accuracy, examples Fe2O3, TiO2 and V2O5. Nano Trends 2023, 3, 100015. [Google Scholar] [CrossRef]
  40. Monshi, A.; Foroughi, M.R.; Monshi, M.R. Modified Scherrer equation to estimate more accurately nano-crystallite size using XRD. World J. Nano sci. Eng 2012, 2, 154–160. [Google Scholar] [CrossRef]
  41. Zak, A.K.; Majid, W.A.; Abrishami, M.E.; Yousefi, R. X-ray analysis of ZnO nanoparticles by Williamson–Hall and size–strain plot methods. Solid State Sci. 2011, 13, 251–256. [Google Scholar] [CrossRef]
  42. Hameed, H.; Waheed, A.; Sharif, M.S.; Saleem, M.; Afreen, A.; Tariq, M.; Kamal, A.; Al-Onazi, W.A.; Al Farraj, D.A.; Ahmad, S.; et al. Green synthesis of zinc oxide (ZnO) nanoparticles from green algae and their assessment in various biological applications. Micromachines 2023, 14, 928. [Google Scholar] [CrossRef]
  43. Figueiredo, C.S.S.e.S.; Branco Santos, J.C.; Castro Junior, J.A.d.A.; Wakui, V.G.; Rodrigues, J.F.; Arruda, M.O.; Monteiro, A.d.S.; Monteiro-Neto, V.; Bomfim, M.R.Q.; Kato, L. Himatanthus drasticus leaves: Chemical characterization and evaluation of their antimicrobial, antibiofilm, antiproliferative activities. Molecules 2017, 22, 910. [Google Scholar] [CrossRef]
  44. Wahab, S.; Asmare, M.M.; Khan, A.; Khan, T.; Ahmad, R.; Sunghwan, K.; Yun, S.-I. Green synthesis of silver nanoparticles using salvia rosmarinus extract: Characterization, mechanistic antibacterial, antibiofilm, and in silico evaluation. Ind. Crops Prod. 2025, 236, 122033. [Google Scholar] [CrossRef]
  45. Morkoç, H.; Özgür, Ü. Zinc Oxide: Fundamentals, Materials and Device Technology; John Wiley & Sons: Hoboken, NJ, USA, 2008. [Google Scholar] [CrossRef]
  46. Theivarasu, C.; Indumathi, T. Effect of rare earth metal ion Ce3+ on the structural, optical and magnetic properties of ZnO nanoparticles synthesized by the co-precipitation method. J. Mater. Sci. Mater. Electron. 2017, 28, 3664–3671. [Google Scholar] [CrossRef]
  47. Borysiewicz, M.A. ZnO as a functional material, a review. Crystals 2019, 9, 505. [Google Scholar] [CrossRef]
  48. Koch, U.; Fojtik, A.; Weller, H.; Henglein, A. Photochemistry of semiconductor colloids. Preparation of extremely small ZnO particles, fluorescence phenomena and size quantization effects. Chem. Phys. Lett. 1985, 122, 507–510. [Google Scholar] [CrossRef]
  49. Khan, M.M.; Saadah, N.H.; Khan, M.E.; Harunsani, M.H.; Tan, A.L.; Cho, M.H. Potentials of Costus woodsonii leaf extract in producing narrow band gap ZnO nanoparticles. Mater. Sci. Semicond. Process. 2019, 91, 194–200. [Google Scholar] [CrossRef]
  50. Pantidos, N.; Horsfall, L.E. Biological synthesis of metallic nanoparticles by bacteria, fungi and plants. J. Nanomed. Nanotechnol. 2014, 5, 1. [Google Scholar] [CrossRef]
  51. Alharthi, F.A.; Alghamdi, A.A.; Alothman, A.A.; Almarhoon, Z.M.; Alsulaiman, M.F.; Al-Zaqri, N. Green synthesis of ZnO nanostructures using Salvadora Persica leaf extract: Applications for photocatalytic degradation of methylene blue dye. Crystals 2020, 10, 441. [Google Scholar] [CrossRef]
  52. Ayyanusamy, P.; Alphonse, R.; Minakshi, M.; Sivasubramanian, R. Synthesis of Amorphous Nickel-Cobalt Hydroxides for Ni−Zn Batteries. Chem. Eur. J. 2024, 30, e202402325. [Google Scholar] [CrossRef]
  53. Minakshi, M.; Samayamanthry, A.; Whale, J.; Aughterson, R.; Shinde, P.A.; Ariga, K.; Kumar Shrestha, L. Phosphorous–containing activated carbon derived from natural honeydew peel powers aqueous supercapacitors. Chem. Asian J. 2024, 19, e202400622. [Google Scholar] [CrossRef]
  54. Ragunathan, R.; Velusamy, S.; Nallasamy, J.L.; Shanmugamoorthy, M.; Johney, J.; Veerasamy, S.; Gopalakrishnan, D.; Nithyanandham, M.; Balamoorthy, D.; Velusamy, P. Synthesis and Enhanced Photocatalytic Activity of Zinc Oxide-Based Nanoparticles and Its Antibacterial Activity. J. Nanomater. 2022, 2022, 3863184. [Google Scholar] [CrossRef]
  55. Álvarez-Chimal, R.; García-Pérez, V.I.; Álvarez-Pérez, M.A.; Arenas-Alatorre, J.Á. Green synthesis of ZnO nanoparticles using a Dysphania ambrosioides extract. Structural characterization and antibacterial properties. Mater. Sci. Eng. C 2021, 118, 111540. [Google Scholar] [CrossRef]
  56. Souza, R.P.; Freitas, T.K.; Domingues, F.S.; Pezoti, O.; Ambrosio, E.; Ferrari-Lima, A.M.; Garcia, J.C. Photocatalytic activity of TiO2, ZnO and Nb2O5 applied to degradation of textile wastewater. J. Photochem. Photobiol. A Chem. 2016, 329, 9–17. [Google Scholar] [CrossRef]
  57. Humelnicu, D.; Dinu, M.V.; Drăgan, E.S. Adsorption characteristics of UO22+ and Th4+ ions from simulated radioactive solutions onto chitosan/clinoptilolite sorbents. J. Hazard. Mater. 2011, 185, 447–455. [Google Scholar] [CrossRef]
  58. Belaid, K.D.; Kacha, S. Étude cinétique et thermodynamique de l’adsorption d’un colorant basique sur la sciure de bois. Rev. Sci. L’eau 2011, 24, 131–144. [Google Scholar] [CrossRef]
  59. Daneshvar, N.; Rasoulifard, M.; Khataee, A.; Hosseinzadeh, F. Removal of CI Acid Orange 7 from aqueous solution by UV irradiation in the presence of ZnO nanopowder. J. Hazard. Mater. 2007, 143, 95–101. [Google Scholar] [CrossRef]
  60. Saien, J.; Khezrianjoo, S. Degradation of the fungicide carbendazim in aqueous solutions with UV/TiO2 process: Optimization, kinetics and toxicity studies. J. Hazard. Mater. 2008, 157, 269–276. [Google Scholar] [CrossRef]
  61. Adeel, M.; Saeed, M.; Khan, I.; Muneer, M.; Akram, N. Synthesis and characterization of Co–ZnO and evaluation of its photocatalytic activity for photodegradation of methyl orange. ACS Omega 2021, 6, 1426–1435. [Google Scholar] [CrossRef]
  62. Karthikeyan, S.; Boopathy, R.; Sekaran, G. In situ generation of hydroxyl radical by cobalt oxide supported porous carbon enhance removal of refractory organics in tannery dyeing wastewater. J. Colloid Interface Sci. 2015, 448, 163–174. [Google Scholar] [CrossRef] [PubMed]
  63. Marques, J.O.; Bellato, C.R.; Souza, C.H.d.; Silva, R.C.d.; Rocha, P.A. Synthesis, characterization and enhanced photocatalytic activity of iron oxide/carbon nanotube/Ag-doped TiO2 nanocomposites. J. Braz. Chem. Soc. 2017, 28, 2301–2312. [Google Scholar] [CrossRef]
  64. Pham, X.N.; Nguyen, H.T.; Pham, T.N.; Nguyen, T.-T.-B.; Nguyen, M.B.; Tran, V.T.-T.; Doan, H.V. Green synthesis of H-ZSM-5 zeolite-anchored O-doped g–C3N4 for photodegradation of Reactive Red 195 (RR 195) under solar light. J. Taiwan Inst. Chem. Eng. 2020, 114, 91–102. [Google Scholar] [CrossRef]
  65. Chen, C.; Liu, J.; Liu, P.; Yu, B. Investigation of photocatalytic degradation of methyl orange by using nano-sized ZnO catalysts. Adv. Chem. Eng. Sci. 2011, 1, 9–14. [Google Scholar] [CrossRef]
  66. Chamjangali, M.A.; Boroumand, S. Synthesis of flower-like Ag-ZnO nanostructure and its application in the photodegradation of methyl orange. J. Braz. Chem. Soc. 2013, 24, 1329–1338. [Google Scholar] [CrossRef]
  67. Farzana, M.H.; Meenakshi, S. Synergistic effect of chitosan and titanium dioxide on the removal of toxic dyes by the photodegradation technique. Ind. Eng. Chem. Res. 2014, 53, 55–63. [Google Scholar] [CrossRef]
  68. Kuriechen, S.K.; Murugesan, S.; Raj, S.P.; Maruthamuthu, P. Visible light assisted photocatalytic mineralization of Reactive Red 180 using colloidal TiO2 and oxone. Chem. Eng. J. 2011, 174, 530–538. [Google Scholar] [CrossRef]
  69. Thiam, M.; Bernardo, A.d.J.; Pellegrini, V.d.O.A.; Possatto, J.F.; Dlamini, Z.W.; Mahule, T.S.; Ngom, B.D.; Mosepele, B.Q.; Thema, F.T.; Mamba, B.B.; et al. Green synthesis of ZnO nanoparticles using Licania tomentosa Benth (Oiti) leaf extract: Characterization and applications for the photocatalytic degradation of crystal Violet dye. Processes 2025, 13, 880. [Google Scholar] [CrossRef]
  70. Pugazhenthiran, N.; Murugesan, S.; Sathishkumar, P.; Anandan, S. Photocatalytic degradation of ceftiofur sodium in the presence of gold nanoparticles loaded TiO2 under UV–visible light. Chem. Eng. J. 2014, 241, 401–409. [Google Scholar] [CrossRef]
  71. Sakthivel, S.; Neppolian, B.; Shankar, M.; Arabindoo, B.; Palanichamy, M.; Murugesan, V. Solar photocatalytic degradation of azo dye: Comparison of photocatalytic efficiency of ZnO and TiO2. Sol. Energy Mater. Sol. Cells 2003, 77, 65–82. [Google Scholar] [CrossRef]
  72. Debnath, S.; Ballav, N.; Nyoni, H.; Maity, A.; Pillay, K. Optimization and mechanism elucidation of the catalytic photo-degradation of the dyes Eosin Yellow (EY) and Naphthol blue black (NBB) by a polyaniline-coated titanium dioxide nanocomposite. Appl. Catal. B Environ. 2015, 163, 330–342. [Google Scholar] [CrossRef]
  73. Mancuso, A.; Mottola, S.; Sacco, O.; Vaiano, V.; De Marco, I. Photocatalytic degradation of ceftriaxone using TiO2 coupled with ZnO micronized by supercritical antisolvent route. Nanomaterials 2023, 13, 3130. [Google Scholar] [CrossRef]
  74. Alamzeb, M.; Faryad, S.; Ullah, I.; Hussain, J.; Setzer, W.N. Photocatalytic degradation of brilliant blue dye under solar light irradiation: An insight into mechanistic, kinetics, mineralization and scavenging studies. J. Fluoresc. 2025, 35, 9093–9111. [Google Scholar] [CrossRef] [PubMed]
  75. Younis, S.A.; Kim, K.-H. Heterogeneous photocatalysis scalability for environmental remediation: Opportunities and challenges. Catalysts 2020, 10, 1109. [Google Scholar] [CrossRef]
  76. Huang, J.; Rasouli, K.; Zong, Z.; Wang, P.; Zhang, Y.; Li, Z. Engineering a high-performance ZnFe2O4/BiOBr/MXene S-scheme heterostructure for CO2 photoreduction and wastewater treatment. Chem. Eng. J. 2026, 530, 173675. [Google Scholar] [CrossRef]
  77. Hyland, K.; Auclair, C. The formation of superoxide radical anions by a reaction between O2, OH and dimethyl sulfoxide. Biochem. Biophys. Res. Commun. 1981, 102, 531–537. [Google Scholar] [CrossRef]
  78. Steiner, M.G.; Babbs, C.F. Quantitation of the hydroxyl radical by reaction with dimethyl sulfoxide. Arch. Biochem. Biophys. 1990, 278, 478–481. [Google Scholar] [CrossRef]
  79. Shikuku, V.O.; Nyairo, W.N. Advanced oxidation processes for dye removal from wastewater. In Impact of Textile Dyes on Public Health and the Environment; IGI Global Scientific Publishing: Hershey, PA, USA, 2020; pp. 205–238. [Google Scholar] [CrossRef]
  80. Masuleh, M.T.; Hasheminiasari, M.; Ashiri, R. Enhanced photocatalytic efficiency of eco-friendly synthesized ZnO for rapid full degradation of methylene blue dye. Mater. Adv. 2025, 6, 2611–2621. [Google Scholar] [CrossRef]
  81. Pryor, W.A. Oxy-radicals and related species: Their formation, lifetimes, and reactions. Annu. Rev. Physiol. 1986, 48, 657–667. [Google Scholar] [CrossRef]
  82. Hanley, C.; Thurber, A.; Hanna, C.; Punnoose, A.; Zhang, J.; Wingett, D.G. The influences of cell type and ZnO nanoparticle size on immune cell cytotoxicity and cytokine induction. Nanoscale Res. Lett. 2009, 4, 1409. [Google Scholar] [CrossRef]
  83. Padmavathy, N.; Vijayaraghavan, R. Enhanced bioactivity of ZnO nanoparticles—An antimicrobial study. Sci. Technol. Adv. Mater. 2008, 9, 035004. [Google Scholar] [CrossRef]
  84. Fang, M.; Chen, J.-H.; Xu, X.-L.; Yang, P.-H.; Hildebrand, H.F. Antibacterial activities of inorganic agents on six bacteria associated with oral infections by two susceptibility tests. Int. J. Antimicrob. Agents 2006, 27, 513–517. [Google Scholar] [CrossRef]
  85. Liu, Y.; Han, J.; Qiu, W.; Gao, W. Hydrogen peroxide generation and photocatalytic degradation of estrone by microstructural controlled ZnO nanorod arrays. Appl. Surf. Sci. 2012, 263, 389–396. [Google Scholar] [CrossRef]
  86. Freire, R.S.; Pelegrini, R.; Kubota, L.T.; Durán, N.; Peralta-Zamora, P. New trends for treatment of industrial effluents containing organochloride species. Química Nova 2000, 23, 504–511. [Google Scholar] [CrossRef]
  87. Garcia, J.C.; Takashima, K. Photocatalytic degradation of imazaquin in an aqueous suspension of titanium dioxide. J. Photochem. Photobiol. A Chem. 2003, 155, 215–222. [Google Scholar] [CrossRef]
  88. Taj-Aldeen, R.A.; Alqaraguly, M.B.; Salah, O.H.; Abdulwahid, A.S.; Hanoon, T.; Alzahraa, Z.A.; Omran, A.A. Enhanced photocatalytic performance of ZnO NPs in the presence of solar light and H2O2 for degradation of Tetracycline from wastewater: Optimal conditions for green products. Adv. J. Chem. Sect. A 2024, 7, 396–405. [Google Scholar] [CrossRef]
  89. Mohammadzadeh, A.; Khoshghadam-Pireyousefan, M.; Shokrianfard-Ravasjan, B.; Azadbeh, M.; Rashedi, H.; Dibazar, M.; Mostafaei, A. Synergetic photocatalytic effect of high purity ZnO pod shaped nanostructures with H2O2 on methylene blue dye degradation. J. Alloys Compd. 2020, 845, 156333. [Google Scholar] [CrossRef]
  90. Saridewi, N.; Rustanti, S.; Zulys, A.; Nurbayti, S.; Aziz, I.; Adawiah, A. Synthesis of ZnO nanoparticle using Lidah Mertua (Sansevieria trifasciata) extract through sol-gel method and its application for methylene blue photodegradation. Bull. Chem. React. Eng. Catal. 2023, 18, 375–385. [Google Scholar] [CrossRef]
  91. Flores, N.M.; Pal, U.; Galeazzi, R.; Sandoval, A. Effects of morphology, surface area, and defect content on the photocatalytic dye degradation performance of ZnO nanostructures. RSC Adv. 2014, 4, 41099–41110. [Google Scholar] [CrossRef]
  92. Ferreira, R.M.; dos Santos Silva, D.H.; Silva, K.F.; de Melo Monteiro, J.; Ferreira, G.F.; Silva, M.R.C.; da Silva, L.C.N.; de Castro Oliveira, L.; Monteiro, A.S. Draft genome sequence of Staphylococcus aureus sequence type 5 SA01 isolated from bloodstream infection and comparative analysis with reference strains. Funct. Integr. Genom. 2023, 23, 288. [Google Scholar] [CrossRef]
  93. Mendes, C.R.; Dilarri, G.; Forsan, C.F.; Sapata, V.d.M.R.; Lopes, P.R.M.; de Moraes, P.B.; Montagnolli, R.N.; Ferreira, H.; Bidoia, E.D. Antibacterial action and target mechanisms of zinc oxide nanoparticles against bacterial pathogens. Sci. Rep. 2022, 12, 2658. [Google Scholar] [CrossRef]
  94. Sirelkhatim, A.; Mahmud, S.; Seeni, A.; Kaus, N.H.M.; Ann, L.C.; Bakhori, S.K.M.; Hasan, H.; Mohamad, D. Review on zinc oxide nanoparticles: Antibacterial activity and toxicity mechanism. Nano-Micro Lett. 2015, 7, 219–242. [Google Scholar] [CrossRef] [PubMed]
  95. Lallo da Silva, B.; Abuçafy, M.P.; Berbel Manaia, E.; Oshiro Junior, J.A.; Chiari-Andréo, B.G.; Pietro, R.C.R.; Chiavacci, L.A. Relationship between structure and antimicrobial activity of zinc oxide nanoparticles: An overview. Int. J. Nanomed. 2019, 14, 9395–9410. [Google Scholar] [CrossRef]
  96. Abu-Gharbia, M.; Salem, J.; Al-Arabi, G. Biosynthesis of zinc oxide nanoparticles using Aloe vera leaves extract and their antibacterial impact. Bull. Pharm. Sci. Assiut Univ. 2024, 47, 499–517. [Google Scholar] [CrossRef]
  97. Francis, D.V.; Jayakumar, M.N.; Ahmad, H.; Gokhale, T. Antimicrobial activity of biogenic metal oxide nanoparticles and their synergistic effect on clinical pathogens. Int. J. Mol. Sci. 2023, 24, 9998. [Google Scholar] [CrossRef] [PubMed]
  98. Freire, P.G.; Montes, R.H.; Romeiro, F.C.; Lemos, S.C.; Lima, R.C.; Richter, E.M.; Munoz, R.A. Morphology of ZnO nanoparticles bound to carbon nanotubes affects electrocatalytic oxidation of phenolic compounds. Sens. Actuators B Chem. 2016, 223, 557–565. [Google Scholar] [CrossRef]
  99. Pavithra, N.; Lingaraju, K.; Raghu, G.; Nagaraju, G. Citrus maxima (Pomelo) juice mediated eco-friendly synthesis of ZnO nanoparticles: Applications to photocatalytic, electrochemical sensor and antibacterial activities. Spectrochim. Acta Part A Mol. Biomol. Spectrosc. 2017, 185, 11–19. [Google Scholar] [CrossRef]
  100. Shubha, J.P.; Kavalli, K.; Adil, S.F.; Assal, M.E.; Hatshan, M.R.; Dubasi, N. Facile green synthesis of semiconductive ZnO nanoparticles for photocatalytic degradation of dyes from the textile industry: A kinetic approach. J. King Saud Univ.-Sci. 2022, 34, 102047. [Google Scholar] [CrossRef]
  101. Karthik, P.; Ravichandran, S.; Mukkannan, A.; Rajesh, J. Plant-mediated biosynthesis of zinc oxide nanoparticles from Delonix Elata: A promising photocatalyst for crystal violet degradation. Inorg. Chem. Commun. 2022, 146, 110122. [Google Scholar] [CrossRef]
  102. Kamarajan, G.; Anburaj, D.B.; Porkalai, V.; Muthuvel, A.; Nedunchezhian, G. Green synthesis of ZnO nanoparticles using Acalypha indica leaf extract and their photocatalyst degradation and antibacterial activity. J. Indian Chem. Soc. 2022, 99, 100695. [Google Scholar] [CrossRef]
  103. Akash, M.H.; Bhowmik, S.; Azad, M.A.S.; Sultana, N.; Alam, M.A. Microwave-assisted Green Synthesis of ZnO Nanoparticles Utilizing Litchi chinensis Leaf Waste for Efficient Photocatalytic degradation of Methylene Blue. RSC Sustain. 2026, 4, 1097–1112. [Google Scholar] [CrossRef]
  104. Assad, N.; Abbas, A.; ur Rehman, M.F.; Naeem-ul-Hassan, M. Photo-catalytic and biological applications of phyto-functionalized zinc oxide nanoparticles synthesized using a polar extract of Equisetum diffusum D. RSC Adv. 2024, 14, 22344–22358. [Google Scholar] [CrossRef]
  105. Elango, B.; Maghimaa, M.; Okram, G.S. Green Synthesis of Zinc Oxide Nanoparticles as a Therapeutic Approach for Antimicrobial, Antibiofilm and Cytotoxic Potentials Against Skin Cancer Cells. Biomed. Mater. Devices 2026, 1–17. [Google Scholar] [CrossRef]
  106. Ifeanyichukwu, U.L.; Fayemi, O.E.; Ateba, C.N. Green synthesis of zinc oxide nanoparticles from pomegranate (Punica granatum) extracts and characterization of their antibacterial activity. Molecules 2020, 25, 4521. [Google Scholar] [CrossRef]
  107. Rezaei, F.Y.; Pircheraghi, G.; Nikbin, V.S. Antibacterial activity, cell wall damage, and cytotoxicity of zinc oxide nanospheres, nanorods, and nanoflowers. ACS Appl. Nano Mater. 2024, 7, 15242–15254. [Google Scholar] [CrossRef]
  108. da Silva, B.L.; Caetano, B.L.; Chiari-Andréo, B.G.; Pietro, R.C.L.R.; Chiavacci, L.A. Increased antibacterial activity of ZnO nanoparticles: Influence of size and surface modification. Colloids Surf. B Biointerfaces 2019, 177, 440–447. [Google Scholar] [CrossRef] [PubMed]
  109. Sharma, V.; Anderson, D.; Dhawan, A. Zinc oxide nanoparticles induce oxidative stress and genotoxicity in human liver cells (HepG2). J. Biomed. Nanotechnol. 2011, 7, 98–99. [Google Scholar] [CrossRef] [PubMed]
  110. Raghupathi, K.R.; Koodali, R.T.; Manna, A.C. Size-dependent bacterial growth inhibition and mechanism of antibacterial activity of zinc oxide nanoparticles. Langmuir 2011, 27, 4020–4028. [Google Scholar] [CrossRef]
  111. Li, W.-R.; Xie, X.-B.; Shi, Q.-S.; Zeng, H.-Y.; Ou-Yang, Y.-S.; Chen, Y.-B. Antibacterial activity and mechanism of silver nanoparticles on Escherichia coli. Appl. Microbiol. Biotechnol. 2010, 85, 1115–1122. [Google Scholar] [CrossRef]
  112. Ullah, S.; Ahmad, A.; Ri, H.; Khan, A.U.; Khan, U.A.; Yuan, Q. Green synthesis of catalytic zinc oxide nano-flowers and their bacterial infection therapy. Appl. Organomet. Chem. 2020, 34, e5298. [Google Scholar] [CrossRef]
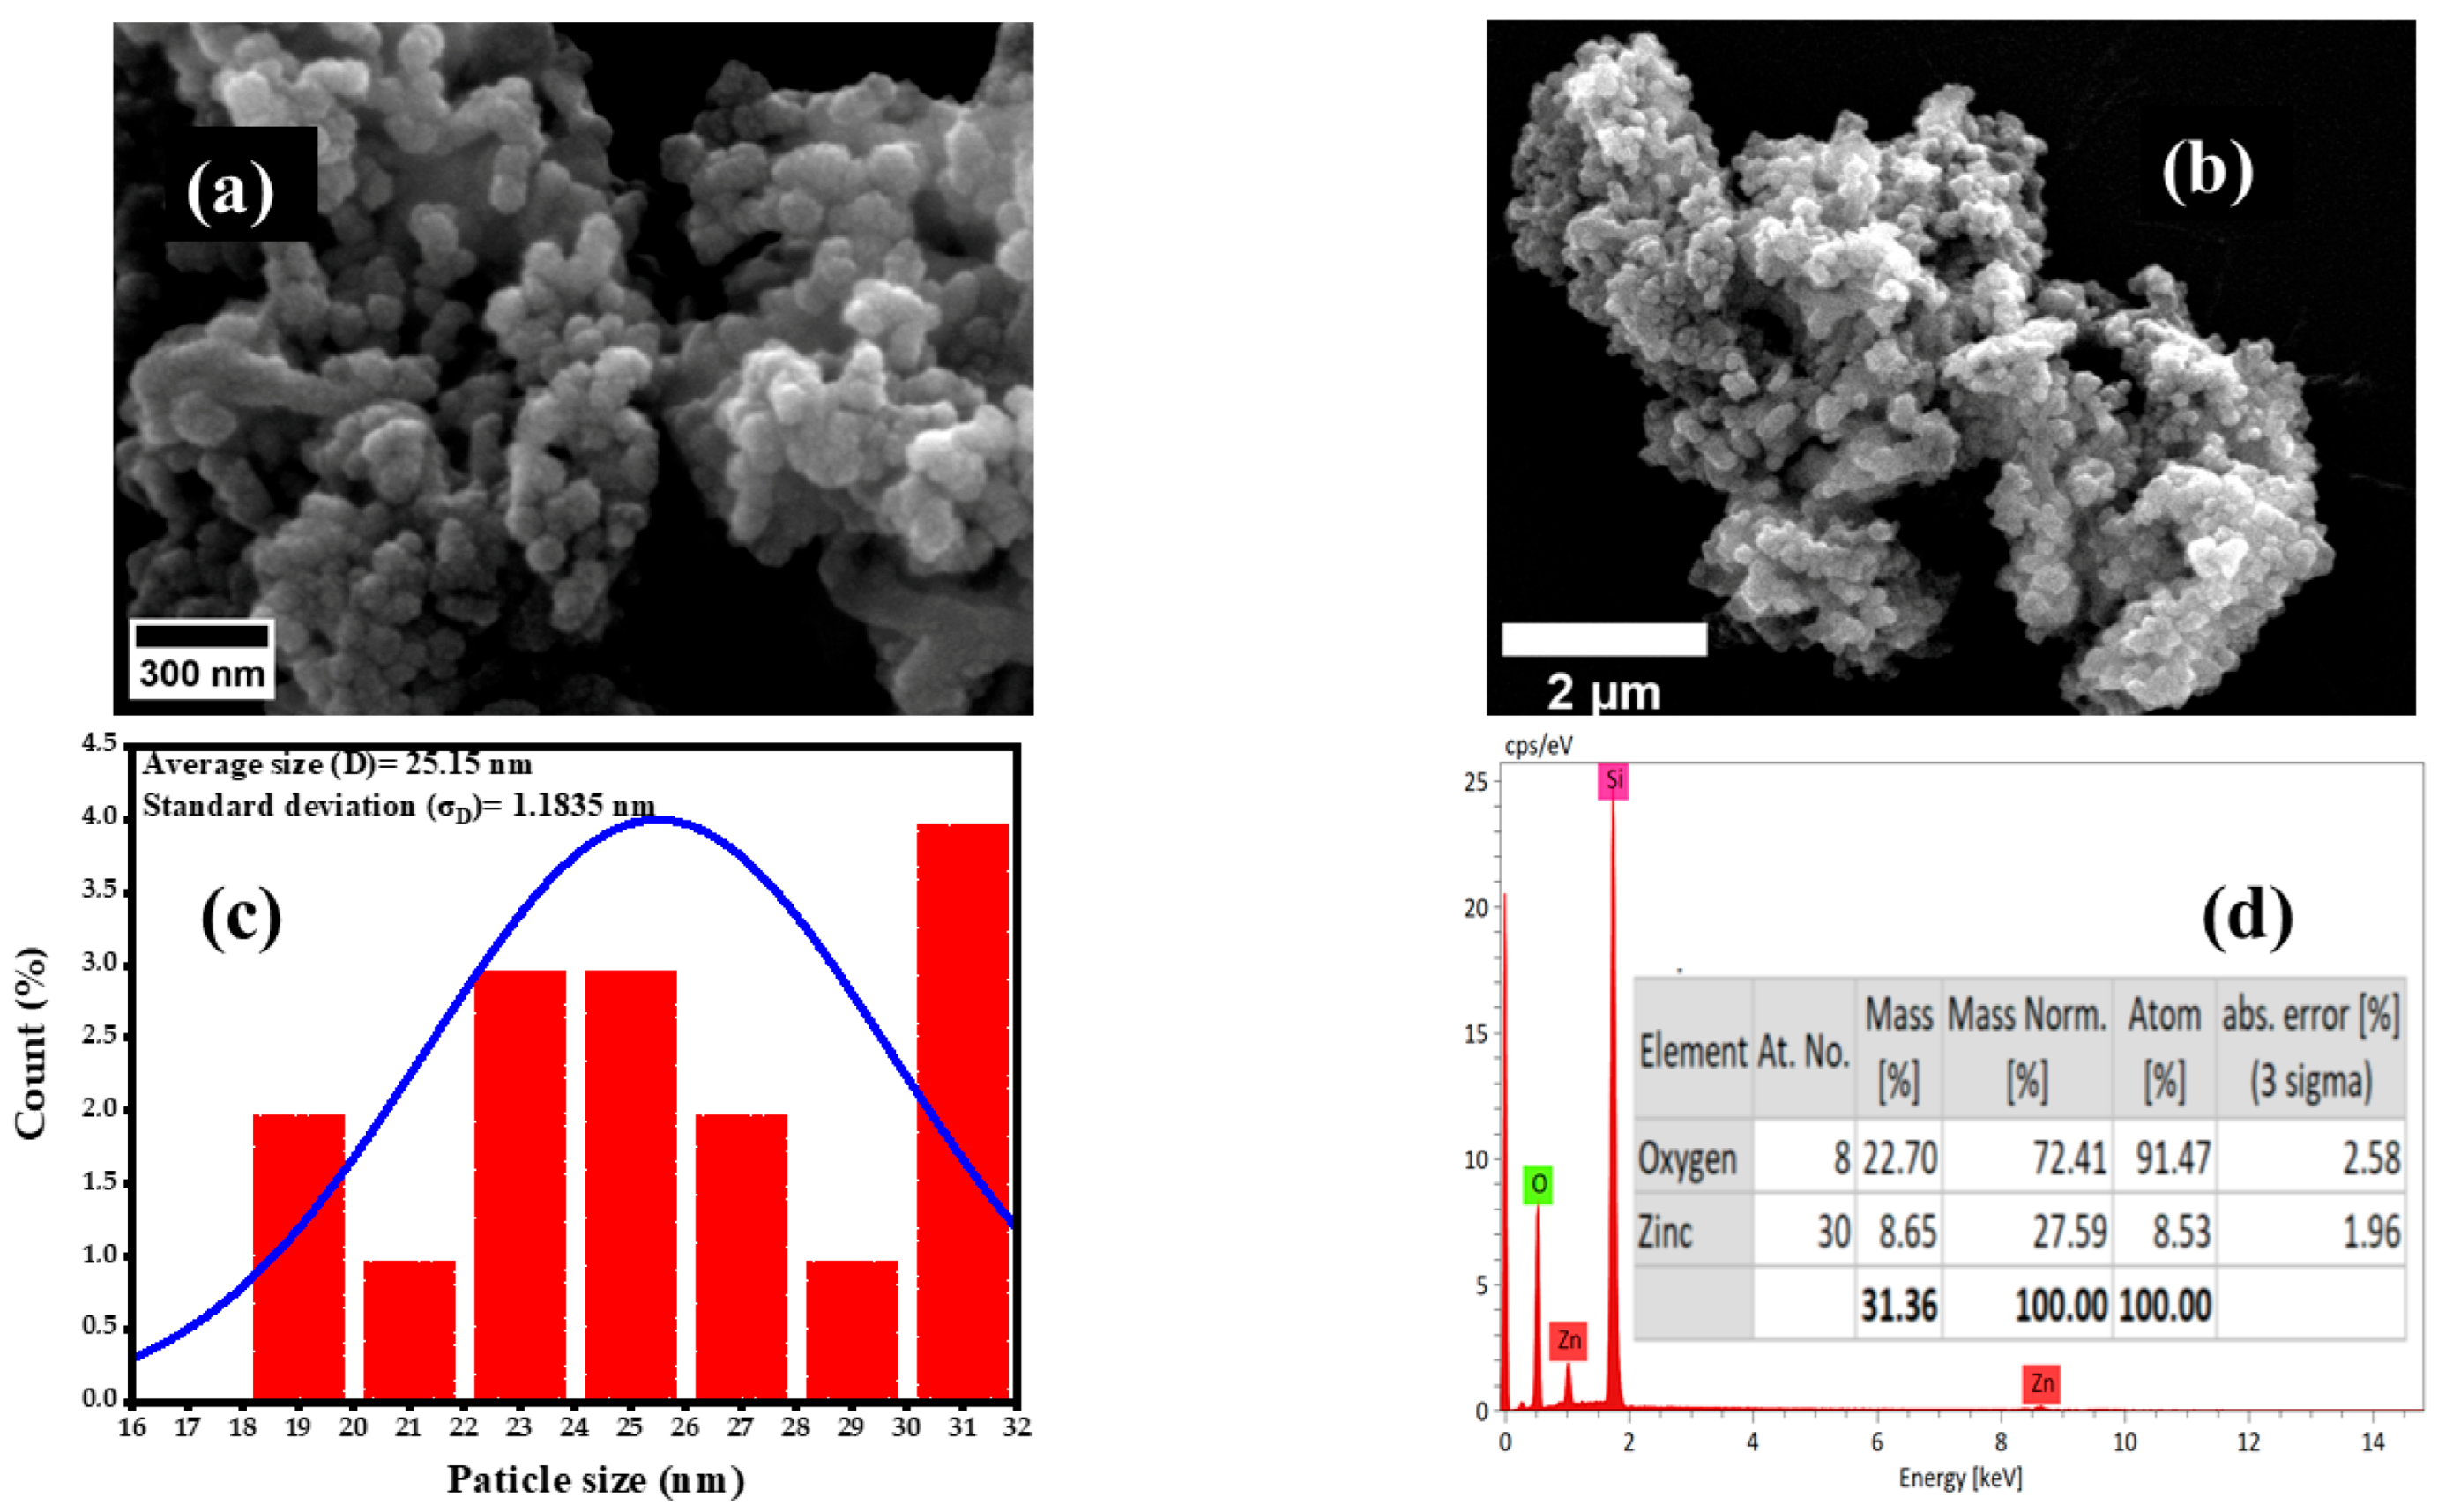
Figure 2. Structural and morphological characterization of ZnO NPs synthesized using Licania tomentosa leaves. (a,b) ZnO NPs as observed by SEM at two different amplifications; (c) distribution of the particle sizes; and (d) EDS of ZnO NPs: the detected Si (silicon) signal originates from the Si grids used for the sample loading.
Processes 14 01334 g002
Figure 3. (a) X-ray diffraction data obtained from the green ZnO NPs produced using Licania tomentosa leaves extract. (b) The Williamson–Hall plot. (c) UV-Vis spectrum with the Tauc plot of (αhυ)2 vs. hυ for ZnO NPs: experimental data (black) and linear fit (red) used to estimate the optical band gap. (d) The ZnO NPs FT-IR spectrum.
Processes 14 01334 g003
Figure 4. DLS analysis of ZnO NPs biosynthesized with the use of Licania tomentosa leaf extract. (a) Mean autocorrelation funcion, Mean radius distribution (solid line) and Gaussian peak fit in dashed line, Radii of the particles; (b) Size distribution of the NPs; (c) Time-dependent size distribution.
Processes 14 01334 g004
Figure 5. pHzpc of the ZnO NPs biosynthesized with Licania tomentosa leaf. The black horizontal line at y = 0 represents the line of zero pH change. The black line with red squares plots the difference ((Δ (pH)) between the final pH and the initial pH of the solution after the addition of the ZnO NPs. The point where this data line crosses the zero-charge line (approximately at pH 8) indicate the point of zero charge for the ZnO NPs.
Processes 14 01334 g005
Figure 6. Photocatalytic performance of ZnO nanoparticles synthesized using Licania tomentosa leaves toward methylene blue and crystal violet degradation. (a,b) Changes in the absorption spectra of MB and CV dyes, respectively, as a function of irradiation time in the presence of ZnO NP photocatalyst; (c,d) the degradation efficiencies of MB and CV dyes solution by the ZnO NPs.
Processes 14 01334 g006
Figure 7. (a,b) Pseudo-first-order kinetics data for MB and CV dyes photodegradation using the ZnO NPs catalyst.
Processes 14 01334 g007
Figure 8. Photocatalyst degradation of MB and CV dye solutions using biosynthesized ZnO NPs under UV light illumination at different pHs. (a,b) (C/C0) ratios for, respectively, MB and CV; (c,d) the plots of ln(C/C0) as a function of irradiation time for MB and CV, respectively, and (e) the degradation efficiencies.
Processes 14 01334 g008
Figure 9. Photocatalyst degradation of MB and CV dye solutions with green-synthesized ZnO NPs under UV light illumination at different catalyst loadings. (a,b) Ratios (C/C0) for MB and CV, respectively, (c,d) the plots of ln(C/C0) as a function of irradiation time for, respectively, MB and CV and (e) the degradation efficiencies.
Processes 14 01334 g009
Figure 10. Photocatalyst degradation of MB and CV dyes solutions using biosynthesized ZnO NPs under UV illumination at different concentrations of dyes. (a,b) Ratios (C/C0) for, respectively, MB and CV; (c,d) the plots of ln(C/C0) as a function of irradiation time for MB and CV, respectively and (e) the degradation efficiencies.
Processes 14 01334 g010
Figure 11. Photocatalyst degradation of MB and CV dye solutions using green-synthesized ZnO NPs under UV light illumination of different intensities. (a,b) Ratios (C/C0) for MB and CV, respectively; (c,d) the plots of ln(C/C0) as a function of illumination time for MB and CV, respectively, and (e) the degradation efficiencies.
Processes 14 01334 g011
Figure 12. (a) Impacts of BQ, DMSO, EDTA, AA and IPA addition during the ZnO-mediated photocatalytic degradation of MB; (b) the maximum percentage of observed degradation in the presence of different scavenging agents; (b,c) the corresponding degradation efficiencies.
Processes 14 01334 g012
Figure 13. Schema of the photocatalytic degradation routes: Schematic illustration of the photocatalytic degradation mechanism of MB dye using ZnO under UV light irradiation. Upon UV exposure, electrons (e) are excited from the valence band (VB) to the conduction band (CB), leaving behind holes (h+). These charge carriers generate reactive oxygen species such as •OH and O2•, which contribute to dye degradation. Solid arrows indicate the primary charge transfer and redox reactions, while dotted arrows represent the diffusion and interaction of reactive species with MB dye molecules. Different colored arrows distinguish between oxidation (red) and reduction (brown) pathways involved in the photocatalytic process.
Processes 14 01334 g013
Figure 14. (a) H2O2 generated and (b) degradation efficiencies of MB dye by the ZnO NPs synthesized using Licania tomentosa and Annatto tree leaves extract during UV irradiation.
Processes 14 01334 g014
Figure 15. (a) The reusability of the ZnO NPs and (b) XRD before and after 4 photodegradation cycles.
Processes 14 01334 g015
Figure 16. Dose–response inhibition curves of ZnO nanoparticles against Gram-negative and Gram-positive bacterial strains. (a) E. coli ATCC 35218, (b) E. faecalis ATCC 29737, (c) K. pneumoniae ATCC 700603, (d) P. aeruginosa ATCC 27853, (e) P. aeruginosa B3, (f) S. aureus ATCC 29213, and (g) S. aureus SA01. Data represent the mean inhibition percentage relative to untreated controls.
Processes 14 01334 g016
Figure 17. Inhibition of biofilm formation by green-synthesized ZnO nanoparticles. (a) Enterococcus faecalis ATCC 29737, (b) Pseudomonas aeruginosa ATCC 27856, and (c) Staphylococcus aureus SA01. The percentage of inhibition was calculated relative to untreated biofilm controls. ** p < 0.01; **** p < 0.0001. MIC: minimum inhibitory concentration.
Processes 14 01334 g017
Figure 18. (A) Inhibition zones produced by the ZnO NPs against Staphylococcus aureus SA03. (B,C) Inhibition zones produced by ZnO NPs against Escherichia coli ATCC 25922.
Processes 14 01334 g018
Table 1. Structural parameters of the ZnO NPs before and after 4 photocatalytic cycles.
Average Crystallite Size (nm)Dislocation Density (δ) (nm−2)Strain
Before15.93.94 × 10−32.55 × 10⁻³
After23.81.76 × 10−34.75 × 10⁻³
Table 2. Antimicrobial activity of green-synthesized ZnO nanoparticles against clinical and reference bacterial strains.
BacteriaIC50
(µg/mL)
MIC (µg/mL)MBC
(µg/mL)
E. coli ATCC 352187.7410002000
E. faecalis ATCC 2973741.862502000
K. pneumoniae ATCC 700603128.9110001000
P. aeruginosa ATCC 2785312.5610001000
P. aeruginosa B3283.142000>2000
S. aureus SA01130.5310002000
S. aureus ATCC 2921310.9810002000
IC50: half maximal inhibitory concentration; MIC: minimum inhibitory concentration; MBC: minimum bactericidal concentration.
Table 3. MB and CV dyes degradation efficiencies by biogenic ZnO NPs.
Source of NanomaterialsExtract MassTemperature of CalcinationBand Bap (eV)CompositionCatalyst Load (mg)Light SourceRemoval Efficiency (%)Initial Dye Concentration (ppm)pH of SolutionRate Constant k (min−1)DyeRef.
Cow dung1 g in 100 mL water400 °C, 3 h3.19Zn and O18UV87.5 (100 min)5100.05675MB[100]
Delonix elata leaf20 g in 100 mL water400 °C, 2 h2.7 Zn and O20UV86 (90 min)10Initial pH0.01598CV[101]
Acalypha indica leaf20 mg in 50 mL400 °C, 4 h3.34Zn and O100Sunlight 96 (90 min)16.67Initial pH1.04476MB[102]
Litchi chinensis leaf50 g in 200 mL500 °C, 3 h3.33Zn and O5UV98 (120)5Initial pH0.0295MB[103]
Equisetum diffusum D5 g in 100 mL450 °C2.79Zn, O, S, C20UV85.61 (120)10Initial pH0.152MB[104]
Licania tomentosa leaf3 g in 150 mL500 °C3Zn and O12.5UV94.5 (60 min)5120.051MBThis work
Licania tomentosa leaf3 g in 150 mL500 °C3Zn and O25UV81 (70 min)5100.0102CVThis work
Zone of inhibition (mm) and MIC as demonstrated by green ZnO NPs
PlantExtract massTemperature of calcinationMorphology structureCompositionBacterial strainsMIC
(µg/mL)
Ref.
Equisetum diffusum D5 g in 100 mL450 °CSpherical Zn, O, S, CListeria monocytogenes, Staphylococcus epidermidis, Escherichia coli and Bordetella bronchiseptica30, 20, 70 and 90[104]
M. oleifera50 g in 200 mL80 °CAgglomerated shapeZn and OC. albicans, E. coli, K. paneumoniae, P. aeruginosa, S. aureus and A. baumannii18.89, 16.56, 10.85, 4.11, 5.42, and 6.23[105]
Pomegranate Leaf and Flower10 g in 100 mL80 °CSphericalZn and OB. cereus, P. aeruginosa, E. faecalis, A. hydrophila, S. pneumoniae, E. faecium, S. aureus. E. coli, L. monocytogenes, M. catarrhalis, S. typhi and K. pneumoniae0.93, 0.88, 1.25, 0.85, 0.93, 0.816, 1250, 1250, 0.71, 1250, 0.6, and 1250[106]
Licania tomentosa leaf3 g in 150 mL500 °CSphericalZn and OE. coli ATCC 35218, E. faecalis ATCC 29737, K. pneumoniae ATCC 700603, P. aeruginosa ATCC 27853, P. aeruginosa B3, S. aureus SA01 and S. aureus ATCC 292131000, 250, 1000, 1000,2000, 1000 and 1000This work
Table 4. Antibacterial activity of ZnO NPs against Staphylococcus aureus (03) and Escherichia coli 1TCC 25922, expressed in inhibition zones (mm).
Zone of Inhibition (ZOI) (mm)
BacteriaControle (+) 10 mg/mLConcentration of ZnO NPs
10 mg/mL5 mg/mL2.5 mg/mL1.25 mg/mL
Staphylococcus aureus 03 (24 h)20 ± 0.813.5 ± 0.512 ± 0.89.7 ± 0.58 ± 0.5
Escherichia coli 25922 (24 h)18 ± 1.15 ± 13 ± 1NoNo
Escherichia coli 25922 (48 h)19 ± 16 ± 0.54 ± 0.5NoNo
30 mg/mL15 mg/mL7.5 mg/mL3.75 mg/mL
Escherichia coli 25922 (24 h)18 ± 1.18 ± 1.15 ± 0.54.6 ± 0.51 ± 1.7
Disclaimer/Publisher’s Note: The statements, opinions and data contained in all publications are solely those of the individual author(s) and contributor(s) and not of MDPI and/or the editor(s). MDPI and/or the editor(s) disclaim responsibility for any injury to people or property resulting from any ideas, methods, instructions or products referred to in the content.